labour taxes and international trade
TRANSCRIPT
AUGUST 2021 Working Paper 205
Labour Taxes and International Trade:
The Role of Domestic Labour Value Added
Amat Adarov, Mario Holzner, Branimir Jovanović and Goran Vukšić
The Vienna Institute for International Economic Studies Wiener Institut für Internationale Wirtschaftsvergleiche

Labour Taxes and International Trade:
The Role of Domestic Labour Value Added
AMAT ADAROV MARIO HOLZNER BRANIMIR JOVANOVIĆ GORAN VUKŠIĆ
Amat Adarov is Senior Economist at the World Bank. He contributed to this study while he was employed at wiiw. Branimir Jovanović is Economist at The Vienna Institute for International Economic Studies (wiiw). Mario Holzner is Executive Director at wiiw. Goran Vukšić is Economic Analyst at DG ECFIN, European Commission. He contributed to this study while he was employed at wiiw.
Research for this paper was financed by the Anniversary Fund of the Oesterreichische Nationalbank (Project No.18310). Support provided by Oesterreichische Nationalbank for this research is gratefully acknowledged.
The information and views set out in this article are those of the authors and do not necessarily reflect the official opinion of The Vienna Institute for International Economic Studies, the European Commission, the Oesterreichische Nationalbank, or the World Bank.


Abstract
This paper revisits the relationship between labour taxation and international trade, focusing on the role of domestic labour value added. Using sectoral data from 41 EU and OECD economies over the period 2005-2014, we assess how labour taxes affect exports and imports and how domestic labour value added shapes this relationship. We find that higher labour taxes reduce exports but that the effect depends to a large extent on the share of domestic labour value added, which differs by industries, countries and time periods. Imports do not seem to be affected. This implies that changes in labour taxes will not affect all sectors and countries in the same way and that policy makers should be aware of this when deciding on labour taxes. We also calculate the contribution of labour tax changes to the export dynamics in the analysed period and sample of countries, finding that in general the contribution is small.
Keywords: taxation, labour, international trade, exports, imports, labour share
JEL classification: F14, F16, H24, J32

CONTENTS
1. Introduction ..................................................................................................................................................... 9
2. Related literature ......................................................................................................................................... 10
3. Methodology ................................................................................................................................................... 13
3.1. Model and econometric technique .................................................................................................13 3.2. Data and variables .........................................................................................................................14
4. Results ............................................................................................................................................................... 18
4.1. Main results....................................................................................................................................18 4.2. Robustness ....................................................................................................................................23 4.3. Results for different components of the tax wedge and different industries ..................................34
5. Discussion and policy implications .................................................................................................... 39
6. Conclusion ...................................................................................................................................................... 46
References ................................................................................................................................................................... 48
Appendix ...................................................................................................................................................................... 49
TABLES AND FIGURES
Table 1 / Variables and data sources ....................................................................................................... 17 Table 2 / Correlation between exports/imports and tax wedge ................................................................ 17 Table 3 / Main results for exports and tax wedge .................................................................................... 19 Table 4 / Semi-elasticity of exports to labour tax wedge for selected industries ...................................... 21 Table 5 / Main results for imports and tax wedge .................................................................................... 22 Table 6 / Robustness to excluding certain years (exports) ...................................................................... 23 Table 7 / Robustness to excluding certain years (imports) ...................................................................... 24 Table 8 / Robustness to excluding countries (exports) ............................................................................ 25 Table 9 / Robustness to excluding countries (imports) ............................................................................ 26 Table 10 / Robustness to excluding outliers and commodity exporters (exports) .................................... 27 Table 11 / Robustness to excluding outliers and commodity exporters (imports) .................................... 28 Table 12 / Robustness to excluding controls and fixed effects for exports .............................................. 29 Table 13 / Robustness to excluding controls and fixed effects for imports .............................................. 30 Table 14 / Robustness to alternative instrument set for exports .............................................................. 31 Table 15 / Robustness to alternative instrument set for imports .............................................................. 32 Table 16 / Results when exports are expressed as % of GDP ................................................................ 33 Table 17 / Results when imports are expressed as % of GDP ................................................................ 34 Table 18 / Results for different components of the tax wedge, for exports .............................................. 35 Table 19 / Results for different components of the tax wedge, for imports .............................................. 36 Table 20 / Results for different industries, for exports .............................................................................. 37 Table 21 / Results for different industries, for imports .............................................................................. 38 Table 22 / Semi-elasticities of exports to labour tax wedge changes for 33 industries in Austria,
Germany and the US, in 2014 ................................................................................................. 40 Table 23 / Semi-elasticities of exports of motor vehicles, trailers and semi-trailers to labour tax
wedge changes in 37 countries, in 2014 .................................................................................. 41 Table 24 / Changes in exports between 2005-2014 in the 33 analysed industries, and the
contribution of the labour tax wedge to these changes (UK) ................................................... 43 Table 25 / Changes in exports between 2005-2014 in the 33 analysed industries, and the
contribution of the labour tax wedge to these changes (Italy) .................................................. 44 Table 26 / Average industry export growth in the analysed countries over 2005-2014, and the
contributions of the labour tax changes to this growth ............................................................. 45 Figure 1 / Semi-elasticity of log (exports) to 1 pp increase in the labour tax wedge ................................ 20 Table A1 / Sectors included in the analysis ............................................................................................. 49 Table A2 / Descriptive statistics of the variables ...................................................................................... 50 Figure A1 / Labour tax wedge in the 41 analysed countries during 2005-2019 (% of total labour costs) 51

INTRODUCTION 9 Working Paper 205
1. Introduction
The relationship between labour taxes and international trade has already been discussed in the existing literature. The conventional wisdom argues that higher labour taxes may reduce exports and increase imports, as they would make domestic products more expensive and less competitive than foreign products, which may in turn decrease the demand for them.
This notion has important implications not just for the literature but also for policy making, as it implies that countries can improve their trade balance by reducing labour taxes. Some authors have used this as an argument for proposing fiscal devaluation, whereby governments can improve their external position by reducing labour taxes by a certain amount and increasing the value-added tax (VAT) by a comparable amount without harming their public finances.
In this paper we revisit the relationship between labour taxes and international trade, focusing on the role of the domestic labour value added. Namely, the mechanism described above works through a cut in domestic labour costs. For it to be effective, domestic labour costs have to constitute a sizeable share of the final price of a product. If this is not the case, changes in labour taxes will have only a minor impact on the final price of the product, and the respective changes in exports and imports will be small.
To this end, we use two-stage least squares (2SLS) estimations based on sectoral data (33 NACE sectors) for 41 EU and OECD countries over the period 2005-2014 to assess how labour taxes affect exports and imports, and whether the effect depends on the domestic labour value added.
The next section gives an overview of the related literature and elaborates our contributions to it. Section 3 presents the methodology we apply, while section 4 shows our results. Section 5 discusses the implications of our findings, and section 6 concludes.
10 RELATED LITERATURE Working Paper 205
2. Related literature
Researchers have been studying the relationship between taxes and international trade for some time. Alesina and Perotti (1997) examined the effects of labour taxation on unit labour costs using a theoretical model, which features labour unions as well as regression analysis. They found that higher labour taxes result in higher labour costs, as unions prevent the burden of the higher taxes to fall entirely on the workers, which in turn reduces competitiveness and exports. They also found that the effect is non-linear and depends on the strength of the unions, being smaller in the case of weaker unions.
Lane and Perotti (1998) explored the short-run impact of different fiscal policy instruments on exports, imports and the trade balance using econometric techniques for a panel of OECD countries over 1960-1995, with the purpose of documenting the macroeconomic consequences of fiscal adjustment. They found that labour taxes do not significantly affect the volume of exports and imports.
Erceg et al. (2005) assessed the effects of fiscal policy on the trade balance in the case of the US, using a dynamic general equilibrium model. They analysed the effects of government consumption and labour income taxation, finding that both of them have a relatively small effect on the trade balance. In their benchmark calibration, a rise in labour income tax of 1 percentage point (pp) of GDP induces the trade balance to deteriorate by 0.2 pp of GDP or less.
Lately, the question has been analysed as part of the fiscal devaluation debate, specifically after the Great Recession, when many EU countries experienced sovereign debt issues and were faced with the challenge of improving their external positions. As they could not devaluate their currencies because they were members of the euro area, the idea of internal, or fiscal, devaluation emerged. This idea essentially implies using fiscal instruments to change domestic prices relative to foreign prices, similar to the way in which exchange-rate movements would operate, with the purpose of boosting domestic price competitiveness and thus improving their trade balance. In addition to the effects of labour taxes on trade that we study here, fiscal devaluation also involves raising the VAT rate, which leads to higher consumer prices at home (for all goods), thus reducing real domestic demand, and consequently also imports. In this sense, the effects from fiscal devaluation on the trade balance may be expected to be stronger than only from labour tax changes.
The idea of fiscal devaluation can be traced back to Keynes (1931), who proposed a combination of export subsidies and import tariffs as an alternative to devaluating the sterling at that time. An excellent review of the older literature on the issue can be found in Laker (1981).
More recently, Farhi et al. (2014) developed a theoretical model and examined the effects of two types of fiscal devaluations: an export subsidy accompanied by an increase in import tariffs and a payroll tax reduction combined with a VAT increase. They showed that, under certain conditions, both types of fiscal devaluation can achieve the same outcome as an exchange-rate devaluation.
RELATED LITERATURE 11 Working Paper 205
In a similar way, using a theoretical model, Lipińska and von Thadden (2019) studied the short-run and long-run effects of a revenue-neutral shift in the tax structure from direct to indirect taxes in countries belonging to a monetary union. They found that the short-run and long-run effects could differ. In general, the short-run effects for the overall welfare of the union are negative and worse for the home (devaluing) country, although they depend on many underlying assumptions, most notably the characteristics of the labour market. The long-run effects, on the other hand, are positive for the welfare of the whole union but depend crucially on the degree of financial integration between the two countries. Under complete markets welfare gains are tilted towards foreign consumers, while under incomplete markets home consumers benefit the most from the tax shift.
Several papers have used model simulations to study the effects of fiscal devaluation, finding in general that the effects on the trade balance are likely to be small. Engler et al. (2017), using a DSGE model calibrated to the euro area, quantified the effects of a fiscal devaluation implemented as a revenue-neutral shift from employers’ social contributions to the VAT rate. They found that devaluation can have effects on output, but that the effects on the trade balance and the real exchange rate are mild. In a model calibrated for Spain and Portugal, Gomes et al. (2016) found that a (temporary) fiscal devaluation, implemented through a reduction in social contributions by 1% of GDP and a corresponding increase in the VAT rate, would improve the trade balance in Spain by around 0.6% of GDP and in Portugal by 0.4% of GDP. Hohberger and Kraus (2016) produced results of a similar size, implying that a drastic change in the tax structure would be needed to achieve sizable trade-balance improvements.
Econometric papers found more sizeable results for the effects of fiscal devaluation. De Mooij and Keen (2012) applied panel techniques on a sample of 30 OECD countries between 1965 and 2009 to study the effects of fiscal devaluation, defined as a reduction in employers’ social security contributions and a corresponding increase in the VAT rate. They found that a revenue-neutral shift from contributions to VAT in the magnitude of 1% of GDP can improve the trade balance in the euro area countries by up to 4% of GDP in the short run. In the long run the effect is smaller and statistically less significant. For the non-euro area countries the effects are smaller and insignificant, both in the short run and in the long run, which implies that the effects are not linear and are likely to depend on the country characteristics.
Applying a similar approach but based on bilateral trade data of 27 EU countries over the period 2000-2014, Holzner et al. (2018) estimated similar average short-run effects of fiscal devaluations as De Mooij and Keen (2012). However, they also found that the effect varies significantly across countries, depending importantly on their openness to trade, with more open countries experiencing stronger effects.
Holzner et al. (2019) extended this work by assessing whether the effects of VAT and social contributions on the trade balance vary across different groups of products, distinguishing between (i) consumer, capital and intermediate goods and (ii) labour- and capital-intensive goods. They found that the VAT is most strongly related to balances of trade in consumer goods, while the contributions turn out to be more strongly associated with balances of trade in capital goods and goods that are labour‐intensive in production. Thus, the composition of trade flows is important for the magnitude of the impact of fiscal devaluation on the trade balance.
Our paper contributes to the literature further by offering new insights into the factors that shape the relationship between taxation and trade. More precisely, we use panel econometric techniques accounting for endogeneity and other issues to explicitly investigate the role played by domestic labour
12 RELATED LITERATURE Working Paper 205
value added in the relationship between labour taxes and exports. No study has explored this rigorously so far, even though several existing studies have recognised that the labour share is likely to play a role (IMF, 2011; De Mooij and Keen, 2012; Bernoth et al., 2014; Holzner et al., 2019).
Our study differs from existing econometric studies on the issue, which use either country data or bilateral-trade data, in that we use sectoral data. This yields more observations, provides greater variability, alleviates possible aggregation bias and thus results in more robust estimates.
Instead of analysing the effect of employers’ social security contributions on trade, as most of the recent studies have done, we analyse the effect of the total labour tax wedge on trade (i.e. employers’ social security contributions + employees’ social security contributions + personal income tax). We opt for the tax wedge because it is a wider concept and includes all government-imposed levies on labour, representing in that way the part of the labour cost that is not determined by the market but is under government control. The choice of the total labour tax wedge brings us closer to the original literature on taxation and trade and fiscal devaluations (Alesina and Perotti, 1997; Lane and Perotti, 1998; Erceg et al., 2005; Farhi et al., 2014; Lipińska and von Thadden, 2019), which were talking about total labour taxes, not only social security contributions. In addition, the choice to work with the total labour tax gives us the possibility to investigate whether there are differences in the effects of its components (i.e. employers’ social security contributions, employees’ social security contributions and personal income tax) on trade.

METHODOLOGY 13 Working Paper 205
3. Methodology
3.1. MODEL AND ECONOMETRIC TECHNIQUE
The model from which we start expresses exports and imports as a function of the labour tax wedge, plus a set of controls:
exportss,c,t = α₁ + α₂∗tax_wedges,c,t + α₃∗controlss,c,t + xs + yc + zt + εs,c,t (1)
importss,c,t = β₁ + β₂∗tax_wedges,c,t + β₃∗controlss,c,t + xs + yc + zt + ηs,c,t (2)
where s is an index that denotes the sectors, c is an index for the countries, t is an index for the years, xs indicates the sector fixed effects, yc the country fixed effects, zt the time fixed effects, ε and η are error terms, and α′s and β’s are coefficients to be estimated.
The labour tax wage is the sum of all labour taxes (personal income tax + social security contributions paid by the worker + social security contributions paid by the employer), expressed as a percentage of total labour costs, for salary equal to the average in the economy.
Exports and imports are in nominal terms, in US dollars, expressed as logs, so that the α and β coefficients could be interpreted as semi-elasticities, i.e. as giving the percentage changes in exports/imports as a result of an increase in the labour tax wedge by 1 pp of the labour costs. In the robustness checks section we examine how alternative definitions of exports and imports affect the results.
The control variables included in the specification are the standard determinants of trade from the literature, explained in greater detail in section 2.3.
This model is then augmented to see if the effect of labour taxes on trade differs for different levels of domestic labour value added (DLVA). The rationale behind this is that labour taxes are expected to affect exports and imports through domestic labour costs, in which higher taxes would raise labour costs for domestic producers, and thus their overall costs and the price of their products, compared with their foreign competitors. An increase in relative prices would lead to a demand switch from domestic to foreign products, both in external markets (through effects on exports) as well as in domestic markets (through effects on imports). The magnitude of the proposed impact should depend on the domestic labour value added incorporated in the product. If domestic labour value added is low, changes in labour taxes will have a minor impact on the final price of the products, and hence respective changes in exports and imports will be small. To assess whether this is the case, we add a cross-product between the tax wedge and the DLVA to the model from equations (1) and (2):
exportss,c,t = α₁ + α₂∗tax_wedges,c,t + α₃∗DLVA_Xs,c,t∗tax_wedges,c,t + α4∗controlss,c,t + xs + yc + zt + εs,c,t (3)
importss,c,t = β₁ + β₂∗tax_wedges,c,t + β₃∗DLVA_Ms,c,t∗tax_wedges,c,t + β4∗controlss,c,t + xs + yc + zt + ηs,c,t (4)

14 METHODOLOGY Working Paper 205
where DLVA_X stands for the domestic labour value added of exports, DLVA_M stands for the domestic labour value added of imports, and everything else is same as before.
DLVA_X is defined as a cross-product between the labour share in domestic value added and the domestic value added in exports. In this way, it represents the share of exports that is due to domestic labour. Both the labour share in domestic value added and the domestic value added in exports are calculated on a sectoral level.
DLVA_M is defined just as the labour share in domestic value added, as there is no domestic value added in imports.
There is apparent endogeneity in the above models, stemming both from reverse causality, as trade might also affect taxes, and omitted variables, as there are many factors that may affect both dependent and independent variables in the regressions, all of which cannot be taken into account (many of them are also unobservable). To address this issue, we apply the two-stage least squares (2SLS) estimator, using the second lag of taxes and the second lag of public debt as instruments for the current values of taxes. These are not directly affected by current trade developments because they predate them. They may be still correlated with them if there are omitted variables that are correlated with both taxes and trade. To address this, we include as control variables standard variables from this literature, and also fixed effects for countries, years and industries. In this way, arguably, the omitted variable bias is reduced sizeably and should not affect our results.
We assess the appropriateness of our instruments on the grounds of the Kleibergen-Paap underidentification test (the null hypothesis is that the model is underidentified, so a p-value below 0.05 indicates that the model is identified), and on the grounds of the Hansen J test (the null hypothesis is that the instruments are uncorrelated with the error term, so that a p-value above 0.05 indicates that the instruments are valid). Standard errors robust to both arbitrary heteroskedasticity and arbitrary autocorrelation are reported.
3.2. DATA AND VARIABLES
Data on exports and imports are sectoral, in nominal terms, in US dollars, and from the OECD database. In the main regressions the variables for them are expressed in logs, while in the robustness checks section they are also expressed as shares of GDP.
DLVA for exports is calculated as a cross-product between the labour share in domestic value added and the domestic value added in exports. Both of them are on a sectoral level. The data on the labour share are from the World Input-Output Database (WIOD), while the data on the domestic share of exports are from the OECD.
DLVA for imports is calculated in the same way as the labour share in domestic value added, as there is no domestic value added in imports. It is on a sectoral level, and the data are from the WIOD.
Data on the labour tax wage are from the OECD Tax Database, and for some EU members which are not members of the OECD they are from the European Commission. The labour tax wedge is calculated as the

METHODOLOGY 15 Working Paper 205
sum of the personal income tax, the social security contributions paid by the worker and the social security contributions paid by the employer, all expressed as a percentage of total labour costs, for salary equal to the average in the economy. In the baseline regressions we use the total tax wedge, while in the further investigations we also use the separate components. These data are on an aggregate country level, as there are no data on taxes on a sectoral level. Still, by multiplying the tax variables with the DLVA variables, which are on a sectoral level, we obtain sectoral variability in the taxes.
The control variables which are included in the estimations are the standard determinants of trade from the literature: nominal effective exchange rate, foreign/domestic demand, stock of foreign direct investment (FDI) in the country, other taxes, net wages, old-age dependency ratio, unemployment rate, general government budget balance, and dummies for having adopted the euro and for EU membership.
The nominal effective exchange rate is included because it affects the relative price of domestic and foreign goods, through which it can affect exports and imports. Foreign demand, measured as the weighted GDP of the biggest trading partners, is included, as it may lead to higher exports. Domestic demand, measured through the domestic GDP and exports, is included because it may lead to higher imports. The stock of FDI may affect both exports and imports through the export and import activities of the foreign companies. Other taxes measure other government-imposed levies, which may increase non-labour production costs and affect trade in that way. Nominal net wages are included because they represent the part of the labour costs which are not captured by the labour taxes and may thus also affect imports and exports, as they determine the final price of the products. The old-age dependency ratio, the unemployment rate and the general government balance are included, following De Mooij and Keen (2012) and Holzner et al. (2018). A higher old-age dependency ratio may be associated with lower net exports as a result of net dissaving by the elderly. The unemployment rate may capture business-cycle developments. The general government balance is included due to the ‘twin-deficit’ hypothesis, i.e. because government deficits may lead to trade deficits. The euro and EU dummies are included as they may both lead to higher trade.
In addition to these control variables from the literature on international trade, the specifications which include the cross-product of the DLVA and the labour tax wedge also include the DLVA as a control variable. This is done so that the effect of the DLVA on trade that goes through the taxes can be isolated from the potential direct effect of the DLVA on trade.
All control variables are included with their lags to alleviate potential endogeneity; the exception is foreign demand, which is clearly exogenous. All control variables are on an aggregate national level, as there are no data for them on a sectoral level. The exceptions are the DLVA and nominal net wages, which are available on a sectoral level.
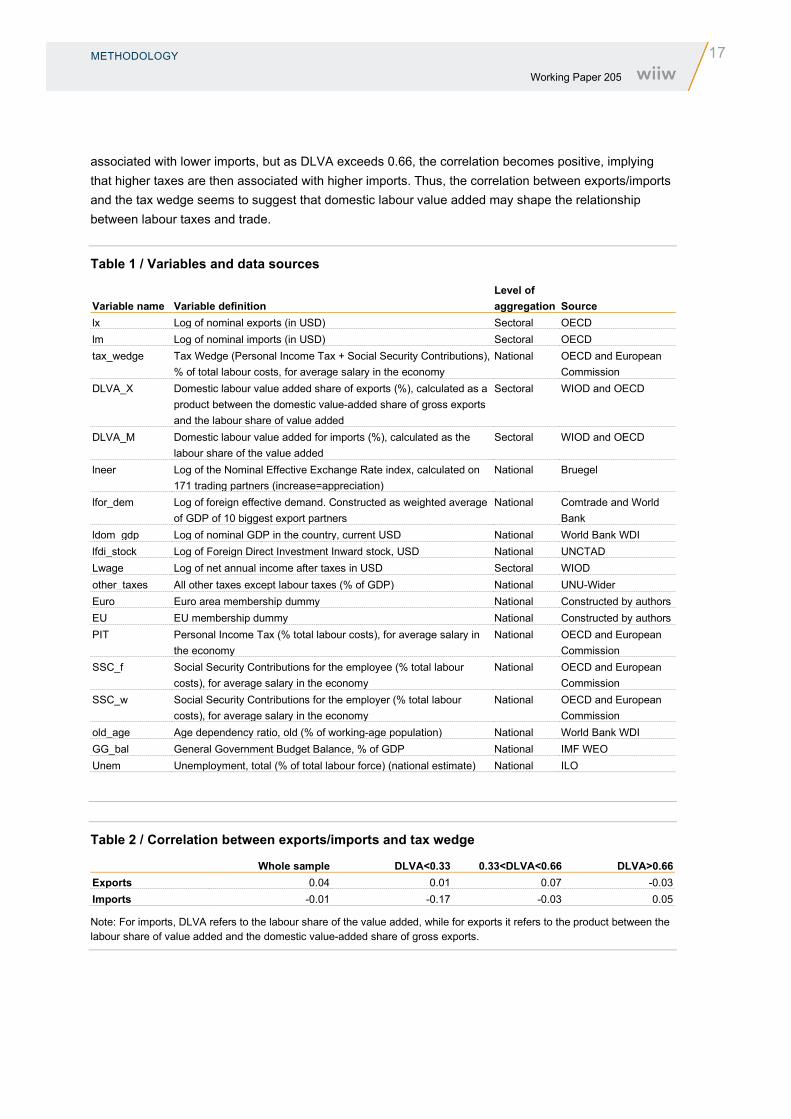
Table 1 presents the variable names, variable definitions and data sources.
The analysis includes 41 countries that are members of the OECD and the EU and covers 33 NACE sectors over a 10-year period (2005-2014).
The countries that are included are: Australia, Austria, Belgium, Bulgaria, Canada, Switzerland, Chile, Cyprus, Czechia, Germany, Denmark, Spain, Estonia, Finland, France, United Kingdom, Greece, Croatia, Hungary, Ireland, Iceland, Israel, Italy, Japan, Korea, Lithuania, Luxembourg, Latvia, Mexico,
16 METHODOLOGY Working Paper 205
Malta, Netherlands, Norway, New Zealand, Poland, Portugal, Romania, Slovakia, Slovenia, Sweden, Turkey, United States.
The sectors that are included are shown in Table A1 in the Appendix.
The descriptive statistics for the variables – the number of observations, the mean, the standard deviation, the minimum value, the 25th percentile, the 75th percentile and the maximum value – are presented in Table A2 in the Appendix.
All the variables have around 11,000 observations, dropping to 7,000-8,000 in the regressions.
The average for the labour tax wedge is 38% of the total labour costs, ranging between 14% and 56%. Cyprus is the country with the lowest tax wedge in this sample, while Belgium is the country with the highest tax wedge.
The biggest share of the labour tax wedge comes from social contributions paid by the employer, with an average of 13% of the total labour costs. The lowest contributions (0%) are registered in Chile, Denmark and New Zealand, the highest (31%) in France.
Social contributions paid by the employee account for the smallest share of the labour tax wedge, averaging 9% of the total labour costs. They range between 0% (Australia, Denmark and New Zealand) and 19% (Netherlands).
Personal income tax accounts on average for 13% of the total labour costs, its lowest value being 2% (in Cyprus), and highest 39% (in Denmark).
DLVA of exports has an average value of 44% and ranges from 0.3% to 93%. There are several cases with values close to zero in real estate activities (Greece and Turkey). There are also several observations in public administration and education where this share exceeds 90%.
DLVA of imports (or the labour share of value added) has an average value of 58% and ranges between 0.3% and 100%. The observations with the lowest shares are the same as for exports (real estate activities in Greece and Turkey). There are several observations with values of 100% (or close to 100%) in various countries and industries.
Almost three quarters of the observations (73%) are in the EU, while 41% are in countries that have adopted the euro as their currency.
Table 2 shows the correlation between exports and imports and the tax wedge. The first column shows the correlation for the whole sample, the second column shows low values of DLVA (below 0.33), the third shows medium values of DLVA (between 0.33 and 0.66) and the last column shows high values of DLVA (above 0.66). All the correlation coefficients are low, but the change in their sign for high values of DLVA is evident. For exports, for values of DLVA below 0.66, the coefficient is positive, implying that a higher tax wedge is associated with higher exports. When DLVA exceeds 0.66, the coefficient becomes negative, implying a negative correlation between taxes and exports. For imports the situation is the opposite – for values of DLVA below 0.66 the correlation is negative, implying that higher taxes are
METHODOLOGY 17 Working Paper 205
associated with lower imports, but as DLVA exceeds 0.66, the correlation becomes positive, implying that higher taxes are then associated with higher imports. Thus, the correlation between exports/imports and the tax wedge seems to suggest that domestic labour value added may shape the relationship between labour taxes and trade.
Table 1 / Variables and data sources
Variable name Variable definition Level of aggregation Source
lx Log of nominal exports (in USD) Sectoral OECD lm Log of nominal imports (in USD) Sectoral OECD tax_wedge Tax Wedge (Personal Income Tax + Social Security Contributions),
% of total labour costs, for average salary in the economy National OECD and European
Commission DLVA_X Domestic labour value added share of exports (%), calculated as a
product between the domestic value-added share of gross exports and the labour share of value added
Sectoral WIOD and OECD
DLVA_M Domestic labour value added for imports (%), calculated as the labour share of the value added
Sectoral WIOD and OECD
lneer Log of the Nominal Effective Exchange Rate index, calculated on 171 trading partners (increase=appreciation)
National Bruegel
lfor_dem Log of foreign effective demand. Constructed as weighted average of GDP of 10 biggest export partners
National Comtrade and World Bank
ldom_gdp Log of nominal GDP in the country, current USD National World Bank WDI lfdi_stock Log of Foreign Direct Investment Inward stock, USD National UNCTAD Lwage Log of net annual income after taxes in USD Sectoral WIOD other_taxes All other taxes except labour taxes (% of GDP) National UNU-Wider Euro Euro area membership dummy National Constructed by authors EU EU membership dummy National Constructed by authors PIT Personal Income Tax (% total labour costs), for average salary in
the economy National OECD and European
Commission SSC_f Social Security Contributions for the employee (% total labour
costs), for average salary in the economy National OECD and European
Commission SSC_w Social Security Contributions for the employer (% total labour
costs), for average salary in the economy National OECD and European
Commission old_age Age dependency ratio, old (% of working-age population) National World Bank WDI GG_bal General Government Budget Balance, % of GDP National IMF WEO Unem Unemployment, total (% of total labour force) (national estimate) National ILO
Table 2 / Correlation between exports/imports and tax wedge
Whole sample DLVA<0.33 0.33<DLVA<0.66 DLVA>0.66 Exports 0.04 0.01 0.07 -0.03 Imports -0.01 -0.17 -0.03 0.05
Note: For imports, DLVA refers to the labour share of the value added, while for exports it refers to the product between the labour share of value added and the domestic value-added share of gross exports.
18 RESULTS Working Paper 205
4. Results
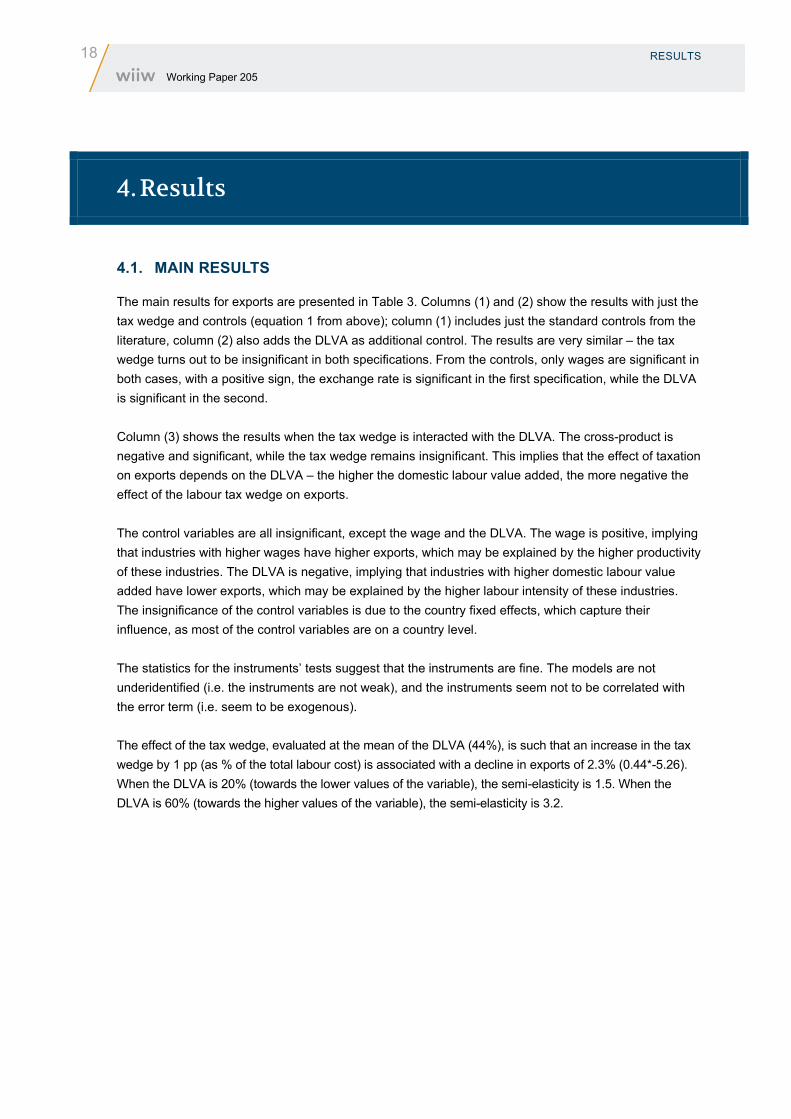
4.1. MAIN RESULTS
The main results for exports are presented in Table 3. Columns (1) and (2) show the results with just the tax wedge and controls (equation 1 from above); column (1) includes just the standard controls from the literature, column (2) also adds the DLVA as additional control. The results are very similar – the tax wedge turns out to be insignificant in both specifications. From the controls, only wages are significant in both cases, with a positive sign, the exchange rate is significant in the first specification, while the DLVA is significant in the second.
Column (3) shows the results when the tax wedge is interacted with the DLVA. The cross-product is negative and significant, while the tax wedge remains insignificant. This implies that the effect of taxation on exports depends on the DLVA – the higher the domestic labour value added, the more negative the effect of the labour tax wedge on exports.
The control variables are all insignificant, except the wage and the DLVA. The wage is positive, implying that industries with higher wages have higher exports, which may be explained by the higher productivity of these industries. The DLVA is negative, implying that industries with higher domestic labour value added have lower exports, which may be explained by the higher labour intensity of these industries. The insignificance of the control variables is due to the country fixed effects, which capture their influence, as most of the control variables are on a country level.
The statistics for the instruments’ tests suggest that the instruments are fine. The models are not underidentified (i.e. the instruments are not weak), and the instruments seem not to be correlated with the error term (i.e. seem to be exogenous).
The effect of the tax wedge, evaluated at the mean of the DLVA (44%), is such that an increase in the tax wedge by 1 pp (as % of the total labour cost) is associated with a decline in exports of 2.3% (0.44*-5.26). When the DLVA is 20% (towards the lower values of the variable), the semi-elasticity is 1.5. When the DLVA is 60% (towards the higher values of the variable), the semi-elasticity is 3.2.

RESULTS 19 Working Paper 205
Table 3 / Main results for exports and tax wedge
(1) (2) (3) VARIABLES Tax wedge +
controls Tax wedge + controls
+ DLVA Tax wedge *DLVA + controls (inc. DLVA)
tax_wedge -0.960 -1.293 0.392 (3.538) (3.333) (4.246) tax_wedge*DLVA_X -5.260** (2.050) L.lneer -0.649** -0.380 -0.481 (0.307) (0.301) (0.330) lfor_dem 0.210 0.0991 0.0731 (0.219) (0.196) (0.231) L.other_taxes -0.118 -0.189 -0.528 (1.594) (1.507) (1.728) Euro 0.0464 -0.0259 -0.0265 (0.0954) (0.0876) (0.0928) L.lfdi_stock 0.0455 -0.0213 -0.0110 (0.123) (0.116) (0.128) L.old_age -1.338 -1.338 -1.439 (3.408) (3.416) (3.972) L.GG_bal 0.00457 0.000675 1.21e-05 (0.00719) (0.00620) (0.00665) L.unem 1.002 0.656 0.875 (0.868) (0.837) (0.971) L.lwage 0.742*** 0.850*** 0.835*** (0.0948) (0.0977) (0.107) L.DLVA_X -3.303*** -1.312* (0.224) (0.771) Constant -2.409 2.540 2.954 (6.814) (6.288) (7.144) Observations 8,315 8,313 7,297 R-squared 0.768 0.790 0.786 Underidentification test p-value 0 0 0 Hansen J test 0.948 0.666 0.696
Robust standard errors in parentheses. *** p<0.01, ** p<0.05, * p<0.1. All regressions include industry, country and year fixed effects. L. stands for the first lag of the variable.

20 RESULTS Working Paper 205
Figure 1 shows the size of the semi-elasticity throughout the whole range of the DLVA. It ranges from almost 0 for the lowest values of the DLVA in the sample to almost 5 for the highest values of DLVA observed.
Figure 1 / Semi-elasticity of log (exports) to 1 pp increase in the labour tax wedge
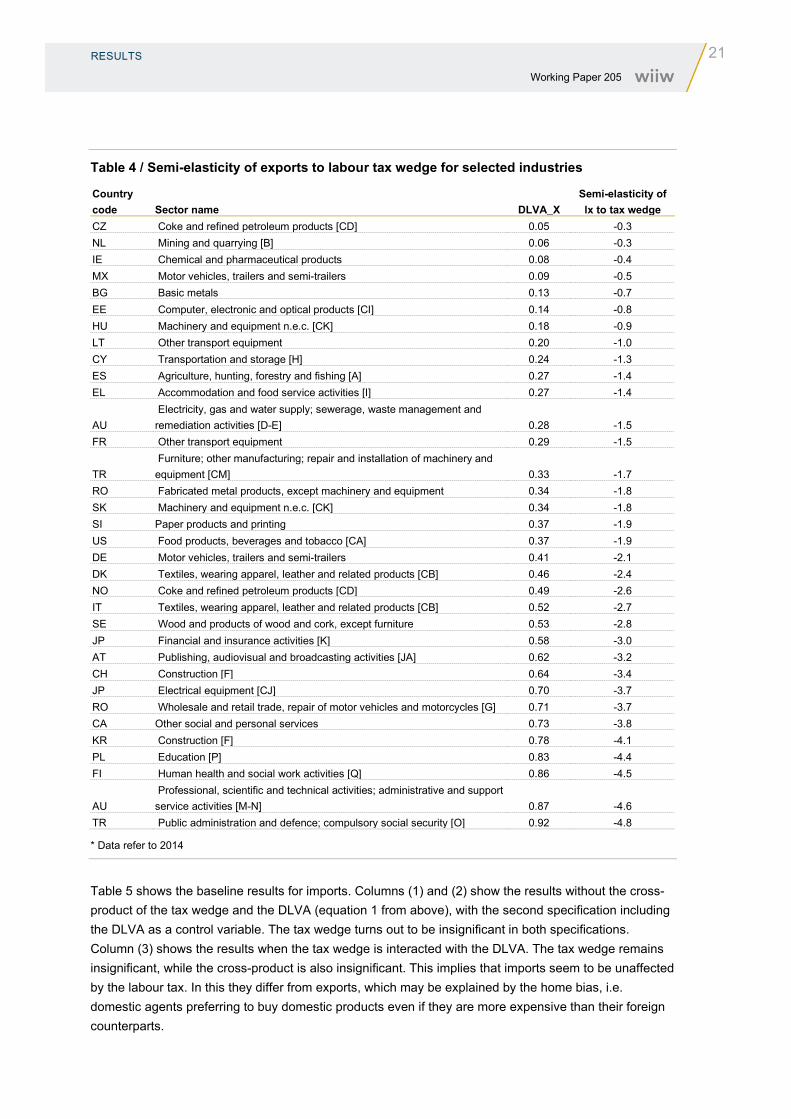
Table 4 presents the semi-elasticity for selected industries from the analysed countries. It can be seen that the effect differs sizeably between countries and industries, depending on the DLVA of the exports. For instance, chemical and pharmaceutical products in Ireland have a small DLVA of just 8%, which makes the semi-elasticity of exports to labour tax changes for this sector just -0.4. This implies that changes in the labour tax wedge in Ireland would have a very small effect on the exports of pharmaceuticals. On the other hand, professional, scientific and technical activities in Australia have a DLVA of exports of 87%, which makes the semi-elasticity of exports to labour tax changes for this sector -4.6. This means that changes in the labour tax in Australia are likely to have a big effect on the exports of professional, scientific and technical activities. Thus, it would be wrong to speak of one common effect of the labour taxes on exports, as the effect is likely to be different for different sectors.
-5-4
-3-2
-10
lx
(%)
0 .2 .4 .6 .8 1Domestic labour value added share (%)
Semi-elasticity of exports to labour tax wedge
RESULTS 21 Working Paper 205
Table 4 / Semi-elasticity of exports to labour tax wedge for selected industries
Country code Sector name DLVA_X
Semi-elasticity of lx to tax wedge
CZ Coke and refined petroleum products [CD] 0.05 -0.3 NL Mining and quarrying [B] 0.06 -0.3 IE Chemical and pharmaceutical products 0.08 -0.4 MX Motor vehicles, trailers and semi-trailers 0.09 -0.5 BG Basic metals 0.13 -0.7 EE Computer, electronic and optical products [CI] 0.14 -0.8 HU Machinery and equipment n.e.c. [CK] 0.18 -0.9 LT Other transport equipment 0.20 -1.0 CY Transportation and storage [H] 0.24 -1.3 ES Agriculture, hunting, forestry and fishing [A] 0.27 -1.4 EL Accommodation and food service activities [I] 0.27 -1.4
AU Electricity, gas and water supply; sewerage, waste management and remediation activities [D-E] 0.28 -1.5
FR Other transport equipment 0.29 -1.5
TR Furniture; other manufacturing; repair and installation of machinery and equipment [CM] 0.33 -1.7
RO Fabricated metal products, except machinery and equipment 0.34 -1.8 SK Machinery and equipment n.e.c. [CK] 0.34 -1.8 SI Paper products and printing 0.37 -1.9 US Food products, beverages and tobacco [CA] 0.37 -1.9 DE Motor vehicles, trailers and semi-trailers 0.41 -2.1 DK Textiles, wearing apparel, leather and related products [CB] 0.46 -2.4 NO Coke and refined petroleum products [CD] 0.49 -2.6 IT Textiles, wearing apparel, leather and related products [CB] 0.52 -2.7 SE Wood and products of wood and cork, except furniture 0.53 -2.8 JP Financial and insurance activities [K] 0.58 -3.0 AT Publishing, audiovisual and broadcasting activities [JA] 0.62 -3.2 CH Construction [F] 0.64 -3.4 JP Electrical equipment [CJ] 0.70 -3.7 RO Wholesale and retail trade, repair of motor vehicles and motorcycles [G] 0.71 -3.7 CA Other social and personal services 0.73 -3.8 KR Construction [F] 0.78 -4.1 PL Education [P] 0.83 -4.4 FI Human health and social work activities [Q] 0.86 -4.5
AU Professional, scientific and technical activities; administrative and support service activities [M-N] 0.87 -4.6
TR Public administration and defence; compulsory social security [O] 0.92 -4.8
* Data refer to 2014
Table 5 shows the baseline results for imports. Columns (1) and (2) show the results without the cross-product of the tax wedge and the DLVA (equation 1 from above), with the second specification including the DLVA as a control variable. The tax wedge turns out to be insignificant in both specifications. Column (3) shows the results when the tax wedge is interacted with the DLVA. The tax wedge remains insignificant, while the cross-product is also insignificant. This implies that imports seem to be unaffected by the labour tax. In this they differ from exports, which may be explained by the home bias, i.e. domestic agents preferring to buy domestic products even if they are more expensive than their foreign counterparts.

22 RESULTS Working Paper 205
Of the control variables, exports, unemployment and wages turn out to be significant. The positive coefficient on exports implies that higher demand, induced by higher exports, leads to higher imports, which is plausible. The negative coefficient on the unemployment points out that when unemployment grows, imports decline due to lower domestic demand. The negative coefficient on wages is surprising at first but can be taken to mean that industries which have higher wages are more competitive and thus have lower imports.
Table 5 / Main results for imports and tax wedge
(1) (2) (3) VARIABLES Tax wedge +
controls Tax wedge + controls +
DLVA Tax wedge *DLVA + controls (inc. DLVA)
tax_wedge 1.554 1.551 1.442 (1.940) (1.940) (2.441) tax_wedge*DLVA -0.00697 (1.113) L.lneer 0.137 0.127 0.0976 (0.199) (0.199) (0.227) L.ldom_gdp 0.199 0.205 0.256 (0.165) (0.165) (0.188) L.oth_taxes -0.709 -0.738 -0.651 (0.915) (0.914) (1.009) Euro 0.0263 0.0301 0.0770 (0.0475) (0.0478) (0.0508) L.lfdi_stock 0.0848 0.0884 0.0957 (0.0674) (0.0675) (0.0728) L.lwage -0.172*** -0.180*** -0.180*** (0.0442) (0.0458) (0.0500) Lx 0.228*** 0.232*** 0.236*** (0.0131) (0.0136) (0.0147) L.old_age -1.620 -1.599 -1.523 (1.781) (1.784) (2.091) L.GG_bal 0.00329 0.00351 0.00320 (0.00375) (0.00376) (0.00405) L.unem -1.611*** -1.569*** -1.145* (0.465) (0.467) (0.588) l.DLVA_M 0.146* 0.158 (0.0874) (0.413) Constant -0.136 -0.430 -2.143 (4.552) (4.551) (5.307) Observations 8,315 8,315 7,303 R-squared 0.930 0.930 0.930 Underidentification test p-value 0 0 0 Hansen J test 0.309 0.330 0.410
Robust standard errors in parentheses.*** p<0.01, ** p<0.05, * p<0.1 All regressions include industry, country and year fixed effects. L. stands for the first lag of the variable.

RESULTS 23 Working Paper 205
4.2. ROBUSTNESS
4.2.1. Robustness to excluding years, outliers and countries
We next check whether the results are robust to excluding years, countries and outliers.
First, we investigate the stability of the results when the sample is reduced to a shorter time period. Table 6 shows the results for exports. Column (1) shows the results for the period before 2012, column (2) for the period after 2009, and column (3) for the period after 2008 and before 2013. The results remain same as before in all cases – the coefficient on the tax wedge is insignificant, while the coefficient on the cross-product is significant and negative, with a magnitude of around -5. The two tests for the validity of the instruments are fine in all the cases.
Table 6 / Robustness to excluding certain years (exports)
(1) (2) (3) VARIABLES Before 2012 After 2009 Before 2013 and after 2008 tax_wedge -11.23 0.0471 -0.304 (12.20) (14.55) (8.307) tax_wedge*DLVA_X -4.606* -5.268* -5.355* (2.477) (2.721) (2.936) L.lneer -0.149 -0.965 -0.383 (0.441) (0.631) (0.488) lfor_dem 0.258 -0.0593 0.0965 (0.357) (0.291) (0.368) L.other_taxes -0.813 -0.889 -0.153 (2.879) (3.745) (2.584) Euro -0.0534 -0.111 -0.171 (0.109) (0.230) (0.195) L.lfdi_stock 0.0944 0.0266 -0.128 (0.218) (0.182) (0.237) L.old_age -1.881 -2.227 -2.100 (8.563) (5.786) (9.333) L.GG_bal -0.0112 -0.00106 -0.00141 (0.0102) (0.00757) (0.00934) L.unem 2.347 0.668 1.247 (2.422) (1.546) (1.860) L.lwage 0.838*** 0.802*** 0.815*** (0.125) (0.128) (0.139) L.DLVA_X -1.767* -1.132 -1.334 (0.921) (1.019) (1.086) Constant -3.247 8.376 5.559 (11.09) (10.92) (11.55) Observations 4,073 5,346 4,167 R-squared 0.795 0.779 0.786 Underidentification test p-value 0 0 0 Hansen J test 0.544 0.707 0.342
Robust standard errors in parentheses. *** p<0.01, ** p<0.05, * p<0.1 All regressions include industry, country and year fixed effects. L. stands for the first lag of the variable.

24 RESULTS Working Paper 205
Table 7 shows the results for imports over the same time periods. It can be seen that the tax wedge, as well as its product with the DLVA, remains insignificant everywhere.
Table 7 / Robustness to excluding certain years (imports)
(1) (2) (3) VARIABLES Before 2012 After 2009 Before 2013 and after 2008 tax_wedge 2.725 -0.484 -2.131 (8.035) (7.661) (4.751) tax_wedge*DLVA_M 0.118 0.546 0.581 (1.288) (1.462) (1.535) L.lneer -0.0406 0.247 0.0650 (0.398) (0.501) (0.362) L.lgdp_nom 0.0460 0.220 0.370 (0.328) (0.343) (0.319) L.other_taxes -0.362 -1.121 -0.756 (2.126) (1.814) (1.399) Euro 0.0656 0.0114 0.207** (0.0677) (0.115) (0.0958) L.lfdi_stock 0.167 -0.00428 0.308** (0.130) (0.103) (0.128) L.lwage -0.230*** -0.165*** -0.202*** (0.0614) (0.0584) (0.0659) Lx 0.241*** 0.234*** 0.239*** (0.0185) (0.0173) (0.0189) L.old_age -2.295 0.381 0.635 (4.437) (3.249) (4.567) L.GG_bal 0.00831 0.00508 0.00432 (0.00579) (0.00455) (0.00553) L.unem -1.023 -1.023 0.380 (1.297) (1.133) (1.158) L.DLVA_M 0.202 -0.0790 0.000863 (0.468) (0.545) (0.561) Constant 2.992 1.326 -10.83 (8.885) (8.621) (8.789) Observations 4,079 5,348 4,170 R-squared 0.933 0.929 0.931 Underidentification test p-value 3.33e-09 0 0 Hansen J test 0.466 0.552 0.434
Robust standard errors in parentheses. *** p<0.01, ** p<0.05, * p<0.1 All regressions include industry, country and year fixed effects. L. stands for the first lag of the variable.

RESULTS 25 Working Paper 205
Next, we check the robustness to excluding certain countries. Table 8 shows the results for exports. Six different results are presented, each of them excluding seven of the 41 countries surveyed. The results are stable. The coefficient on the tax wedge is insignificant in all the cases, while the coefficient on the interaction term becomes insignificant in just one case, although even here its magnitude remains negative and similar to previous results.
Table 8 / Robustness to excluding countries (exports)
(1) (2) (3) (4) (5) (6) VARIABLES Countries
1-7 omitted Countries
8-14 omitted Countries
15-21 omitted Countries
22-28 omitted Countries
29-35 omitted Countries
36-41 omitted tax_wedge 2.294 -0.382 -2.452 1.168 0.501 1.221 (4.486) (4.492) (4.540) (5.287) (4.758) (4.525) tax_wedge*DLVA_X -7.983*** -4.556** -3.082 -5.947*** -5.710*** -4.957** (2.823) (2.165) (2.227) (2.205) (2.193) (2.007) L.lneer -0.459 -0.491 -0.674* -0.271 -0.449 -0.581 (0.402) (0.339) (0.387) (0.349) (0.372) (0.353) lfor_dem 0.0732 0.111 0.0303 0.123 0.0589 0.0451 (0.257) (0.264) (0.267) (0.247) (0.273) (0.231) L.other_taxes -0.442 -1.621 -0.262 -0.138 -0.956 0.194 (1.893) (2.175) (1.593) (1.984) (1.838) (1.808) Euro -0.0235 0.0135 -0.0419 -0.0397 -0.0148 -0.0442 (0.0964) (0.126) (0.0927) (0.107) (0.0966) (0.114) L.lfdi_stock -0.0961 -0.0375 0.0578 0.0143 -0.0183 -0.0321 (0.171) (0.130) (0.146) (0.132) (0.128) (0.138) L.old_age -1.710 -1.732 -1.818 1.144 -2.192 -0.986 (4.270) (4.575) (4.044) (4.478) (4.637) (4.046) L.GG_bal -0.000730 0.000888 0.00786 -0.000701 0.000713 -0.00221 (0.00687) (0.00729) (0.0109) (0.00675) (0.00713) (0.00756) L.unem 0.503 1.079 1.404 0.636 0.763 1.078 (1.087) (1.168) (1.190) (1.114) (1.012) (1.011) L.lwage 0.766*** 0.816*** 0.875*** 0.631*** 0.794*** 1.156*** (0.124) (0.113) (0.125) (0.102) (0.119) (0.0904) L.DLVA_X -0.412 -1.598** -1.726** -1.301 -0.690 -1.854** (1.046) (0.795) (0.833) (0.841) (0.848) (0.762) Constant 5.489 3.486 3.346 1.392 3.684 -0.991 (8.421) (7.805) (8.580) (7.660) (7.864) (7.273) Observations 6,006 6,163 6,229 6,022 5,973 6,092 R-squared 0.793 0.770 0.784 0.791 0.793 0.794 Underidentification test p-value 0 0 0 0 0 0 Hansen J test 0.880 0.740 0.728 0.666 0.409 0.957
Robust standard errors in parentheses. *** p<0.01, ** p<0.05, * p<0.1 All regressions include industry, country and year fixed effects. L. stands for the first lag of the variable.

26 RESULTS Working Paper 205
Table 9 shows the results for the exclusion of countries for imports. As before, six results are presented, each of them excluding 7 of the 41 countries. Again, the results are stable. Both the coefficient on the tax wedge and its cross-product with the DLVA are insignificant in all the cases.
Table 9 / Robustness to excluding countries (imports)
(1) (2) (3) (4) (5) (6) VARIABLES Countries
1-7 omitted Countries
8-14 omitted Countries
15-21 omitted Countries
22-28 omitted Countries
29-35 omitted Countries
36-41 omitted tax_wedge 1.161 2.054 2.170 -0.451 1.444 0.985 (2.639) (2.647) (2.490) (2.990) (2.770) (2.635) tax_wedge*DLVA_M 1.014 -0.559 -0.837 0.00513 0.372 0.0506 (1.587) (1.207) (1.137) (1.181) (1.203) (1.100) L.lneer 0.0980 0.173 0.110 0.109 -0.0942 0.101 (0.262) (0.247) (0.261) (0.242) (0.252) (0.244) L.lgdp_nom 0.117 0.185 0.358 0.236 0.289 0.330* (0.214) (0.210) (0.225) (0.196) (0.202) (0.198) L.other_taxes -0.554 -0.858 -0.451 -0.816 -0.674 -0.797 (1.112) (1.279) (0.914) (1.105) (1.197) (1.088) Euro 0.0814 -0.0655 0.0764 0.146** 0.0623 0.114* (0.0513) (0.0680) (0.0494) (0.0592) (0.0523) (0.0633) L.lfdi_stock 0.121 0.0973 0.0346 0.151** 0.101 0.0892 (0.0998) (0.0735) (0.0838) (0.0716) (0.0750) (0.0795) L.lwage -0.147** -0.177*** -0.233*** -0.193*** -0.0631 -0.269*** (0.0577) (0.0538) (0.0609) (0.0546) (0.0459) (0.0458) Lx 0.252*** 0.240*** 0.237*** 0.245*** 0.217*** 0.233*** (0.0165) (0.0156) (0.0162) (0.0153) (0.0153) (0.0159) L.old_age -1.631 -1.863 -1.185 -4.837* 1.099 -1.629 (2.311) (2.411) (2.199) (2.513) (2.263) (2.123) L.GG_bal 0.00368 0.00266 0.00440 0.00143 0.00538 0.00246 (0.00415) (0.00455) (0.00564) (0.00434) (0.00411) (0.00467) L.unem -1.390** -1.386* -0.858 -0.856 -1.080* -1.070* (0.678) (0.726) (0.749) (0.684) (0.574) (0.614) L.DLVA_M -0.251 0.368 0.525 0.375 -0.179 0.0918 (0.582) (0.440) (0.418) (0.443) (0.461) (0.410) Constant 0.964 -0.579 -3.419 -1.996 -3.873 -4.027 (6.301) (6.121) (6.076) (5.336) (5.767) (4.923) Observations 6,011 6,169 6,235 6,026 5,976 6,098 R-squared 0.932 0.924 0.930 0.933 0.935 0.928 Underidentification test p-value 0 0 0 0 0 0 Hansen J test 0.293 0.678 0.901 0.428 0.0768 0.408
Robust standard errors in parentheses. *** p<0.01, ** p<0.05, * p<0.1 All regressions include industry, country and year fixed effects. L. stands for the first lag of the variable.

RESULTS 27 Working Paper 205
Finally, to check whether the results are driven by extreme observations, we exclude 1% observations with the highest values and 1% observations with the lowest values for exports/imports, DLVA and the tax wedge. In addition, we exclude commodity-dependent countries according to the UNCTAD classification, whereby Australia, Chile, Greece, Iceland, Norway and New Zealand are considered as commodity-dependent countries. Table 10 presents the results for exports, Table 11 the results for imports. In both cases the results remain unchanged.
Table 10 / Robustness to excluding outliers and commodity exporters (exports)
(1) (2) (3) (4) VARIABLES Export outliers
removed DLVA outliers
removed Tax wedge outliers
removed Commodity
countries removed tax_wedge 0.0702 1.641 0.763 0.0371 (4.122) (4.313) (4.248) (4.064) tax_wedge*DLVA_X -3.991** -6.607*** -6.027*** -4.125** (1.781) (2.395) (2.115) (2.017) L.lneer -0.499 -0.620* -0.481 -0.450 (0.321) (0.328) (0.331) (0.345) lfor_dem 0.0169 0.0629 0.0738 0.0702 (0.208) (0.233) (0.232) (0.263) L.other_taxes -0.463 -0.310 -0.493 -0.988 (1.645) (1.741) (1.729) (1.891) Euro 0.00513 -0.0276 -0.0285 -0.0216 (0.0869) (0.0929) (0.0929) (0.0919) L.lfdi_stock -0.0171 -0.0221 -0.0116 0.0111 (0.126) (0.129) (0.133) (0.132) L.old_age -1.771 -0.778 -1.424 -1.944 (3.856) (4.005) (3.978) (4.063) L.GG_bal 0.000598 -0.000279 -6.60e-05 -0.000213 (0.00667) (0.00674) (0.00667) (0.00704) L.unem 0.908 0.819 0.858 0.883 (0.927) (0.979) (0.970) (1.103) L.lwage 0.672*** 1.020*** 0.837*** 0.807*** (0.0944) (0.0817) (0.107) (0.115) L.DLVA_X -1.427** -0.854 -1.059 -1.583** (0.678) (0.902) (0.792) (0.767) Constant 6.384 1.600 2.806 2.723 (6.606) (7.224) (7.198) (8.486) Observations 7,154 7,162 7,200 6,629 R-squared 0.779 0.789 0.786 0.798 Underidentification test p-value 0 0 0 0 Hansen J test 0.444 0.836 0.693 0.396
Robust standard errors in parentheses. *** p<0.01, ** p<0.05, * p<0.1 All regressions include industry, country and year fixed effects. L. stands for the first lag of the variable.

28 RESULTS Working Paper 205
Table 11 / Robustness to excluding outliers and commodity exporters (imports)
(1) (2) (3) (4) VARIABLES Import outliers
removed DLVA outliers
removed Tax wedge outliers
removed Commodity countries
removed tax_wedge 1.435 1.324 1.448 2.076 (2.408) (2.489) (2.451) (2.372) tax_wedge*DLVA_M 0.146 0.140 0.0502 -0.530 (1.103) (1.303) (1.161) (1.087) L.lneer 0.0720 0.106 0.0946 0.150 (0.229) (0.228) (0.227) (0.235) L.lgdp_nom 0.307 0.303 0.250 0.188 (0.189) (0.189) (0.188) (0.214) L.other_taxes -0.524 -0.652 -0.638 -0.194 (1.002) (1.018) (1.011) (1.085) Euro 0.0763 0.0796 0.0760 0.0701 (0.0500) (0.0512) (0.0507) (0.0501) L.lfdi_stock 0.0962 0.0958 0.108 0.0332 (0.0728) (0.0739) (0.0752) (0.0767) L.lwage -0.167*** -0.261*** -0.176*** -0.194*** (0.0496) (0.0414) (0.0499) (0.0554) Lx 0.250*** 0.243*** 0.236*** 0.264*** (0.0153) (0.0147) (0.0148) (0.0155) L.old_age -1.102 -1.384 -1.534 -1.030 (2.090) (2.118) (2.100) (2.103) L.GG_bal 0.00290 0.00347 0.00331 0.00434 (0.00408) (0.00404) (0.00406) (0.00427) L.unem -1.156** -1.146* -1.143* -1.202* (0.579) (0.598) (0.589) (0.664) L.DLVA_M 0.106 0.141 0.141 0.286 (0.412) (0.484) (0.428) (0.406) Constant -3.948 -2.825 -2.351 1.041 (5.371) (5.369) (5.310) (6.001) Observations 7,158 7,168 7,206 6,634 R-squared 0.926 0.930 0.930 0.935 Underidentification test p-value 0 0 0 0 Hansen J test 0.579 0.377 0.413 0.832
Robust standard errors in parentheses. *** p<0.01, ** p<0.05, * p<0.1 All regressions include industry, country and year fixed effects. L. stands for the first lag of the variable.
4.2.2. Robustness to excluding controls and fixed effects
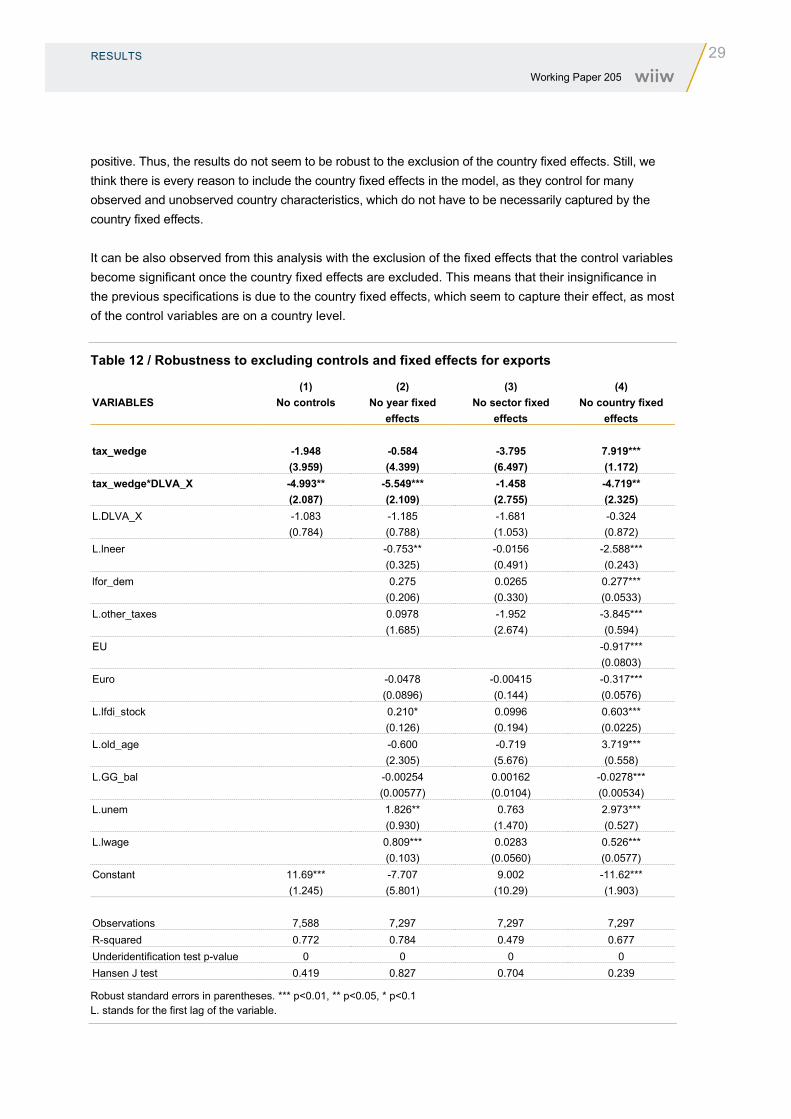
We next explore robustness to excluding the control variables and the fixed effects. Table 12 shows the results for exports. Column (1) excludes the control variables. The results remain unchanged. Column (2) excludes the year fixed effects. Again, the results remain unchanged. Column (3) removes the sector fixed effects. Here the results change, as the cross-product loses its significance. Still, both the cross-product and the tax wedge are negative in this specification, and their sum is close to the coefficient of the cross-product from before (around -5), meaning that the results are qualitatively similar to the previous ones even here. Finally, column (4) shows the results when the country fixed effects are excluded. Here, the cross-product keeps the coefficient from before (around -5) but the tax wedge is positive and significant here, with a bigger coefficient (7.9), meaning that in this specification the effect of the tax wedge on exports is
RESULTS 29 Working Paper 205
positive. Thus, the results do not seem to be robust to the exclusion of the country fixed effects. Still, we think there is every reason to include the country fixed effects in the model, as they control for many observed and unobserved country characteristics, which do not have to be necessarily captured by the country fixed effects.
It can be also observed from this analysis with the exclusion of the fixed effects that the control variables become significant once the country fixed effects are excluded. This means that their insignificance in the previous specifications is due to the country fixed effects, which seem to capture their effect, as most of the control variables are on a country level.
Table 12 / Robustness to excluding controls and fixed effects for exports
(1) (2) (3) (4) VARIABLES No controls No year fixed
effects No sector fixed
effects No country fixed
effects tax_wedge -1.948 -0.584 -3.795 7.919*** (3.959) (4.399) (6.497) (1.172) tax_wedge*DLVA_X -4.993** -5.549*** -1.458 -4.719** (2.087) (2.109) (2.755) (2.325) L.DLVA_X -1.083 -1.185 -1.681 -0.324 (0.784) (0.788) (1.053) (0.872) L.lneer -0.753** -0.0156 -2.588*** (0.325) (0.491) (0.243) lfor_dem 0.275 0.0265 0.277*** (0.206) (0.330) (0.0533) L.other_taxes 0.0978 -1.952 -3.845*** (1.685) (2.674) (0.594) EU -0.917*** (0.0803) Euro -0.0478 -0.00415 -0.317*** (0.0896) (0.144) (0.0576) L.lfdi_stock 0.210* 0.0996 0.603*** (0.126) (0.194) (0.0225) L.old_age -0.600 -0.719 3.719*** (2.305) (5.676) (0.558) L.GG_bal -0.00254 0.00162 -0.0278*** (0.00577) (0.0104) (0.00534) L.unem 1.826** 0.763 2.973*** (0.930) (1.470) (0.527) L.lwage 0.809*** 0.0283 0.526*** (0.103) (0.0560) (0.0577) Constant 11.69*** -7.707 9.002 -11.62*** (1.245) (5.801) (10.29) (1.903) Observations 7,588 7,297 7,297 7,297 R-squared 0.772 0.784 0.479 0.677 Underidentification test p-value 0 0 0 0 Hansen J test 0.419 0.827 0.704 0.239
Robust standard errors in parentheses. *** p<0.01, ** p<0.05, * p<0.1 L. stands for the first lag of the variable.

30 RESULTS Working Paper 205
Table 13 presents the results for imports when the control variables and the fixed effects are excluded. In column (1) the controls are excluded. One can see that the interaction term between the tax wedge and the DLVA becomes significant and negative. This can be explained by some of the control variables which were significant before – exports, unemployment and wages – as they may be correlated with the taxes, and taxes may now capture their effect. The next three columns show the results when the fixed effects are excluded. In those cases the results remain the same as before. Thus, the import results seem to be robust to the exclusion of the fixed effects and the control variables.
Table 13 / Robustness to excluding controls and fixed effects for imports
(1) (2) (3) (4) VARIABLES No controls No year fixed
effects No sector fixed
effects No country fixed
effects tax_wedge -1.121 -0.461 0.996 -0.381 (2.483) (2.498) (3.921) (0.742) tax_wedge_*DLVA_M -2.118* 0.672 2.324 1.540 (1.248) (1.130) (2.092) (1.224) L.DLVA_M 0.451 -0.0920 -1.209 -0.209 (0.461) (0.419) (0.791) (0.457) L.lneer -0.0756 0.253 -0.00906 (0.192) (0.364) (0.112) L.lgdp_nom 0.187 -0.0364 0.386*** (0.132) (0.302) (0.0177) L.other_taxes -0.511 -0.219 -0.0127 (0.984) (1.626) (0.274) EU -0.0339 (0.0440) Euro 0.0794 0.0354 -0.0204 (0.0498) (0.0948) (0.0229) L.lfdi_stock 0.301*** 0.0512 0.181*** (0.0614) (0.113) (0.0140) L.lwage -0.190*** 0.0546 0.0972*** (0.0506) (0.0432) (0.0242) Lx 0.240*** 0.662*** 0.295*** (0.0147) (0.0124) (0.0136) L.old_age 1.302 -1.172 -1.209*** (1.144) (3.131) (0.302) L.GG_bal 0.00355 0.00219 -0.0133*** (0.00346) (0.00642) (0.00311) L.unem -0.367 -1.865* -0.405 (0.522) (1.088) (0.262) Constant 9.602*** -5.228 2.075 -11.33*** (0.780) (3.781) (8.700) (0.677) Observations 7,639 7,303 7,303 7,303 R-squared 0.914 0.929 0.785 0.912 Underidentification test p-value 0 0 0 0 Hansen J test 0.000821 0.531 0.765 5.80e-06
Robust standard errors in parentheses. *** p<0.01, ** p<0.05, * p<0.1 L. stands for the first lag of the variable.

RESULTS 31 Working Paper 205
4.2.3. Robustness to alternative instruments set
We next explore the robustness to the instruments used. Table 14 shows the results for exports, followed by Table 15 with the results for imports. Instead of using the second lag of the tax and the public debt, column (1) shows the results obtained when just the first lag is used. In column (2) the first two lags are used. In column (3) the first two lags are used, but only of the taxes, i.e. omitting the public debt from the instrument list. The results remain roughly the same as before – in the case of exports the tax wedge is insignificant and the cross-product is significant and negative, just as before. Only the coefficient on the cross-product is smaller now, at around -3.5 instead of -5. For imports both the taxes and their interaction term with the DLVA are insignificant in all the three cases, the same as before.
Table 14 / Robustness to alternative instrument set for exports
(1) (2) (3) VARIABLES First lag as
instrument First two lags as
instrument First two lags as instrument,
without public debt tax_wedge 0.692 1.494 1.326 (2.209) (2.492) (2.584) tax_wedge*DLVA_X -3.507** -3.074** -3.094** (1.555) (1.508) (1.509) L.lneer -0.327 -0.478 -0.478 (0.299) (0.329) (0.329) lfor_dem 0.0763 0.0743 0.0738 (0.197) (0.230) (0.230) L.other_taxes -0.254 0.0622 0.0112 (1.278) (1.395) (1.416) Euro -0.0314 -0.0299 -0.0295 (0.0870) (0.0921) (0.0922) L.lfdi_stock -0.0322 -0.0303 -0.0282 (0.111) (0.122) (0.122) L.old_age -0.997 -1.716 -1.702 (3.417) (3.986) (3.986) L.GG_bal 0.00129 0.000129 0.000119 (0.00621) (0.00663) (0.00663) L.unem 0.532 0.554 0.582 (0.721) (0.810) (0.820) L.lwage 0.844*** 0.834*** 0.834*** (0.0941) (0.106) (0.106) L.DLVA_X -1.951*** -2.107*** -2.099*** (0.604) (0.590) (0.591) Constant 2.527 3.163 3.176 (6.290) (7.082) (7.081) Observations 8,450 7,296 7,296 R-squared 0.788 0.787 0.787 Underidentification test p-value 0 0 0 Hansen J test 0.789 0.340 0.158
Robust standard errors in parentheses. *** p<0.01, ** p<0.05, * p<0.1 All regressions include industry, country and year fixed effects. L. stands for the first lag of the variable.
32 RESULTS Working Paper 205
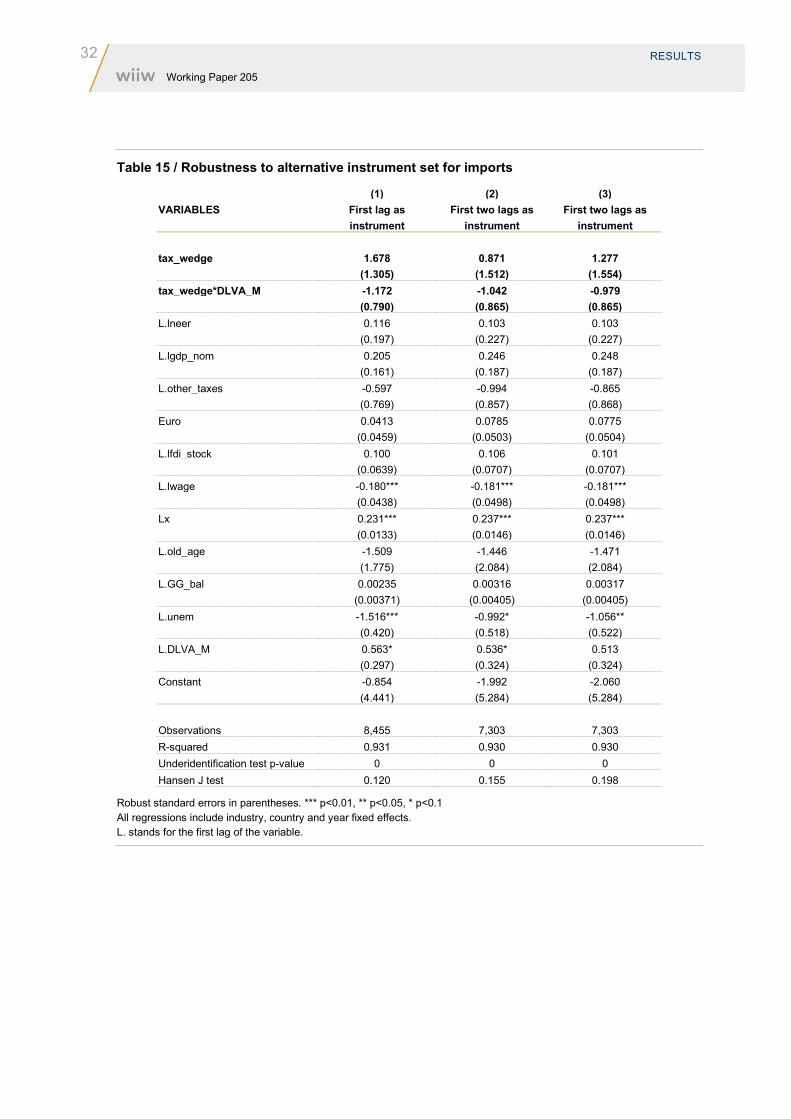
Table 15 / Robustness to alternative instrument set for imports
(1) (2) (3) VARIABLES First lag as
instrument First two lags as
instrument First two lags as
instrument tax_wedge 1.678 0.871 1.277 (1.305) (1.512) (1.554) tax_wedge*DLVA_M -1.172 -1.042 -0.979 (0.790) (0.865) (0.865) L.lneer 0.116 0.103 0.103 (0.197) (0.227) (0.227) L.lgdp_nom 0.205 0.246 0.248 (0.161) (0.187) (0.187) L.other_taxes -0.597 -0.994 -0.865 (0.769) (0.857) (0.868) Euro 0.0413 0.0785 0.0775 (0.0459) (0.0503) (0.0504) L.lfdi_stock 0.100 0.106 0.101 (0.0639) (0.0707) (0.0707) L.lwage -0.180*** -0.181*** -0.181*** (0.0438) (0.0498) (0.0498) Lx 0.231*** 0.237*** 0.237*** (0.0133) (0.0146) (0.0146) L.old_age -1.509 -1.446 -1.471 (1.775) (2.084) (2.084) L.GG_bal 0.00235 0.00316 0.00317 (0.00371) (0.00405) (0.00405) L.unem -1.516*** -0.992* -1.056** (0.420) (0.518) (0.522) L.DLVA_M 0.563* 0.536* 0.513 (0.297) (0.324) (0.324) Constant -0.854 -1.992 -2.060 (4.441) (5.284) (5.284) Observations 8,455 7,303 7,303 R-squared 0.931 0.930 0.930 Underidentification test p-value 0 0 0 Hansen J test 0.120 0.155 0.198
Robust standard errors in parentheses. *** p<0.01, ** p<0.05, * p<0.1 All regressions include industry, country and year fixed effects. L. stands for the first lag of the variable.

RESULTS 33 Working Paper 205
4.2.4. Robustness to alternative definitions of the dependent variables
Next we investigate how stable the results are to alternative definitions of the dependent variables for exports and imports. Namely, instead of defining them as logs, we define them as a percentage of GDP. Table 16 shows the results for exports, and it can be seen that the tax wedge, when entered without the cross-product, remains insignificant as before, irrespective of the control variables. When its cross-product with the DLVA is entered and the DLVA is not included as an additional control, the cross-product is negative and significant, as before. However, when the DLVA is included as an additional control, the cross-product becomes insignificant, meaning that the DLVA is overtaking the effect of the cross-product.
Table 16 / Results when exports are expressed as % of GDP
(1) (2) (3) (4) VARIABLES Tax wedge + controls
(without DLVA) Tax wedge + controls
(with DLVA) Tax wedge * DLVA +
controls (without DLVA) Tax wedge * DLVA + controls (with DLVA)
tax_wedge 0.316 0.320 0.618 0.356 (0.813) (0.806) (1.232) (1.242) tax_wedge_DVAX_lab -0.633*** -0.0305 (0.0921) (0.185) L.lneer171 -0.0191 0.000791 0.00611 0.00918 (0.0257) (0.0257) (0.0334) (0.0334) lfor_dem 0.00757 -0.000888 -0.00265 -0.00520 (0.0128) (0.0120) (0.0143) (0.0139) L.oth_taxes2 -0.0150 -0.00860 0.00775 0.0107 (0.232) (0.231) (0.258) (0.257) euro 0.000540 -0.00554 -0.00690 -0.00760 (0.0109) (0.0109) (0.0101) (0.0100) L.lfdi_s 0.0173 0.0128 0.00312 0.00366 (0.0162) (0.0156) (0.0182) (0.0180) L.old_age -0.146 -0.154 -0.0843 -0.119 (0.231) (0.224) (0.254) (0.255) L.GG_bal -0.00195 -0.00232 -0.00116 -0.00120 (0.00305) (0.00302) (0.00337) (0.00335) L.unem 0.123 0.0956 0.0357 0.0313 (0.0931) (0.0906) (0.0917) (0.0910) L.lwage2 -0.00220 0.00614 0.00647 0.00748 (0.00688) (0.00685) (0.00746) (0.00744) L.lab_DVAX -0.267*** -0.265*** (0.0369) (0.0847) Constant -0.705 -0.344 -0.177 -0.0143 (0.689) (0.663) (0.794) (0.790) Observations 8,367 8,315 7,298 7,298 R-squared 0.266 0.301 0.298 0.305 Underidentification test p-value 0 0 0 0 Hansen J test 0.406 0.435 0.705 0.718
Robust standard errors in parentheses. *** p<0.01, ** p<0.05, * p<0.1 All regressions include industry, country and year fixed effects. L. stands for the first lag of the variable.

34 RESULTS Working Paper 205
Table 17 shows the results for imports, which are same as before – both the tax wedge and its interaction term with the DLVA are always insignificant.
Table 17 / Results when imports are expressed as % of GDP
(1) (2) (3) (4) VARIABLES Tax wedge + controls
(without DLVA) Tax wedge + controls
(with DLVA) Tax wedge * DLVA +
controls (without DLVA) Tax wedge * DLVA + controls (with DLVA)
tax_wedge 0.0269 0.0275 0.153 0.106 (0.589) (0.590) (0.935) (0.909) tax_wedge_lab -0.0408 0.0378 (0.0339) (0.121) L.lneer171 0.0549 0.0564 0.0519 0.0519 (0.0408) (0.0410) (0.0491) (0.0491) L.lgdp_nom -0.0791 -0.0799 -0.0552 -0.0552 (0.0658) (0.0659) (0.0729) (0.0728) L.oth_taxes2 -0.193 -0.189 -0.116 -0.116 (0.224) (0.224) (0.232) (0.233) Euro -0.000251 -0.000793 -0.00304 -0.00308 (0.00831) (0.00837) (0.00838) (0.00837) L.lfdi_s 0.0173 0.0168 0.00517 0.00533 (0.0180) (0.0179) (0.0184) (0.0184) L.lwage2 -0.0150*** -0.0139*** -0.0144*** -0.0141*** (0.00415) (0.00417) (0.00454) (0.00458) lx 0.0146*** 0.0140*** 0.0148*** 0.0147*** (0.00244) (0.00235) (0.00261) (0.00259) L.old_age -0.276 -0.279 -0.198 -0.199 (0.273) (0.273) (0.312) (0.312) L.GG_bal -0.000762 -0.000793 -4.49e-05 -5.16e-05 (0.00232) (0.00232) (0.00261) (0.00261) L.unem -0.0457 -0.0516 -0.0859 -0.0855 (0.0684) (0.0692) (0.105) (0.105) L.lab_sh_sec -0.0204 -0.0336 (0.0126) (0.0488) Constant 1.744 1.785 1.323 1.335 (1.482) (1.487) (1.659) (1.658) Observations 8,315 8,315 7,303 7,303 R-squared 0.295 0.296 0.298 0.298 Underidentification test p-value 0 0 0 0 Hansen J test 0.697 0.706 0.900 0.903
Robust standard errors in parentheses. *** p<0.01, ** p<0.05, * p<0.1 All regressions include industry, country and year fixed effects. L. stands for the first lag of the variable.
4.3. RESULTS FOR DIFFERENT COMPONENTS OF THE TAX WEDGE AND DIFFERENT INDUSTRIES
The various robustness checks undertaken confirm by and large that the baseline findings for the relationship between the labour tax wedge and exports and imports are stable. We next investigate which of the components of the tax wedge drive the results, followed by a comparison of the effects for different industries.

RESULTS 35 Working Paper 205
Table 18 shows the exports results when the labour tax wedge is decomposed into its three components – personal income tax, social security contributions of the employee and social security contributions of the employer. The relationship observed before – insignificance of the tax variable and significance of the cross-product – is present only for the personal income tax. The social security contributions are always insignificant. This implies that the effect is driven by the personal income tax and that the literature which investigates the relationship between taxation and trade and which has lately focused mostly on the social contributions may be omitting an important part of the whole story.
Table 18 / Results for different components of the tax wedge, for exports
(1) (2) (3) (4) VARIABLES PIT + SSC_f + SSC_w Just PIT Just SSC_f Just SSC_w PIT 2.582 -2.185 (5.465) (4.281) SSC_f 4.252 -1.760 (13.39) (9.859) SSC_w 11.65 11.22 (17.00) (10.81) PIT_DVAX_lab -6.882*** -4.596*** (2.609) (1.762) SSC_f_DVAX_lab -2.763 -1.253 (1.836) (1.483) SSC_w_DVAX_lab -4.284 -1.846 (2.629) (2.177) L.lneer171 -0.467 -0.449 -0.402 -0.441 (0.359) (0.329) (0.346) (0.328) lfor_dem 0.00884 0.0972 0.0442 0.00281 (0.269) (0.241) (0.237) (0.236) L.oth_taxes2 -0.122 -0.876 -0.407 -0.356 (2.045) (1.418) (1.626) (1.268) Euro -0.0414 -0.0257 -0.0157 -0.0266 (0.108) (0.0920) (0.0995) (0.0911) L.lfdi_s -0.0178 0.0237 -0.0163 -0.0194 (0.133) (0.122) (0.122) (0.123) L.old_age -3.524 -2.911 -1.721 -3.838 (4.616) (4.307) (4.084) (4.502) L.GG_bal 0.00117 0.00101 0.00147 0.000963 (0.00685) (0.00686) (0.00679) (0.00689) L.unem 0.192 1.094 0.491 0.0898 (1.463) (0.876) (0.690) (0.844) L.lwage2 0.712*** 0.703*** 0.716*** 0.716*** (0.101) (0.100) (0.0999) (0.0991) L.lab_DVAX -1.143 -2.214*** -2.638*** -2.662*** (0.753) (0.328) (0.326) (0.289) Constant 4.995 3.199 4.898 5.948 (7.704) (7.194) (7.107) (7.229) Observations 7,085 7,085 7,085 7,085 R-squared 0.779 0.781 0.781 0.781 Underidentification test p-value 0 0 0 0 Hansen J test 0.696 0.960 0.537 0.802
Robust standard errors in parentheses. *** p<0.01, ** p<0.05, * p<0.1 All regressions include industry, country and year fixed effects. L. stands for the first lag of the variable.
36 RESULTS Working Paper 205
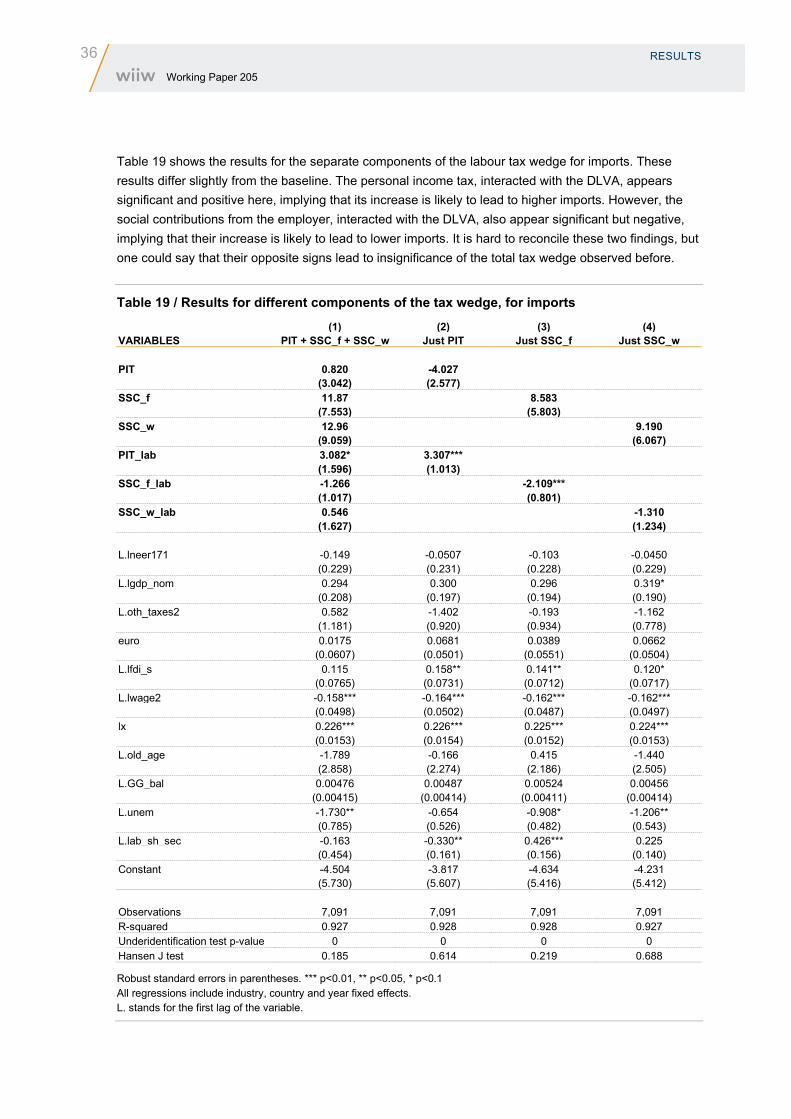
Table 19 shows the results for the separate components of the labour tax wedge for imports. These results differ slightly from the baseline. The personal income tax, interacted with the DLVA, appears significant and positive here, implying that its increase is likely to lead to higher imports. However, the social contributions from the employer, interacted with the DLVA, also appear significant but negative, implying that their increase is likely to lead to lower imports. It is hard to reconcile these two findings, but one could say that their opposite signs lead to insignificance of the total tax wedge observed before.
Table 19 / Results for different components of the tax wedge, for imports (1) (2) (3) (4) VARIABLES PIT + SSC_f + SSC_w Just PIT Just SSC_f Just SSC_w PIT 0.820 -4.027 (3.042) (2.577) SSC_f 11.87 8.583 (7.553) (5.803) SSC_w 12.96 9.190 (9.059) (6.067) PIT_lab 3.082* 3.307*** (1.596) (1.013) SSC_f_lab -1.266 -2.109*** (1.017) (0.801) SSC_w_lab 0.546 -1.310 (1.627) (1.234) L.lneer171 -0.149 -0.0507 -0.103 -0.0450 (0.229) (0.231) (0.228) (0.229) L.lgdp_nom 0.294 0.300 0.296 0.319* (0.208) (0.197) (0.194) (0.190) L.oth_taxes2 0.582 -1.402 -0.193 -1.162 (1.181) (0.920) (0.934) (0.778) euro 0.0175 0.0681 0.0389 0.0662 (0.0607) (0.0501) (0.0551) (0.0504) L.lfdi_s 0.115 0.158** 0.141** 0.120* (0.0765) (0.0731) (0.0712) (0.0717) L.lwage2 -0.158*** -0.164*** -0.162*** -0.162*** (0.0498) (0.0502) (0.0487) (0.0497) lx 0.226*** 0.226*** 0.225*** 0.224*** (0.0153) (0.0154) (0.0152) (0.0153) L.old_age -1.789 -0.166 0.415 -1.440 (2.858) (2.274) (2.186) (2.505) L.GG_bal 0.00476 0.00487 0.00524 0.00456 (0.00415) (0.00414) (0.00411) (0.00414) L.unem -1.730** -0.654 -0.908* -1.206** (0.785) (0.526) (0.482) (0.543) L.lab_sh_sec -0.163 -0.330** 0.426*** 0.225 (0.454) (0.161) (0.156) (0.140) Constant -4.504 -3.817 -4.634 -4.231 (5.730) (5.607) (5.416) (5.412) Observations 7,091 7,091 7,091 7,091 R-squared 0.927 0.928 0.928 0.927 Underidentification test p-value 0 0 0 0 Hansen J test 0.185 0.614 0.219 0.688
Robust standard errors in parentheses. *** p<0.01, ** p<0.05, * p<0.1 All regressions include industry, country and year fixed effects. L. stands for the first lag of the variable.
RESULTS 37 Working Paper 205
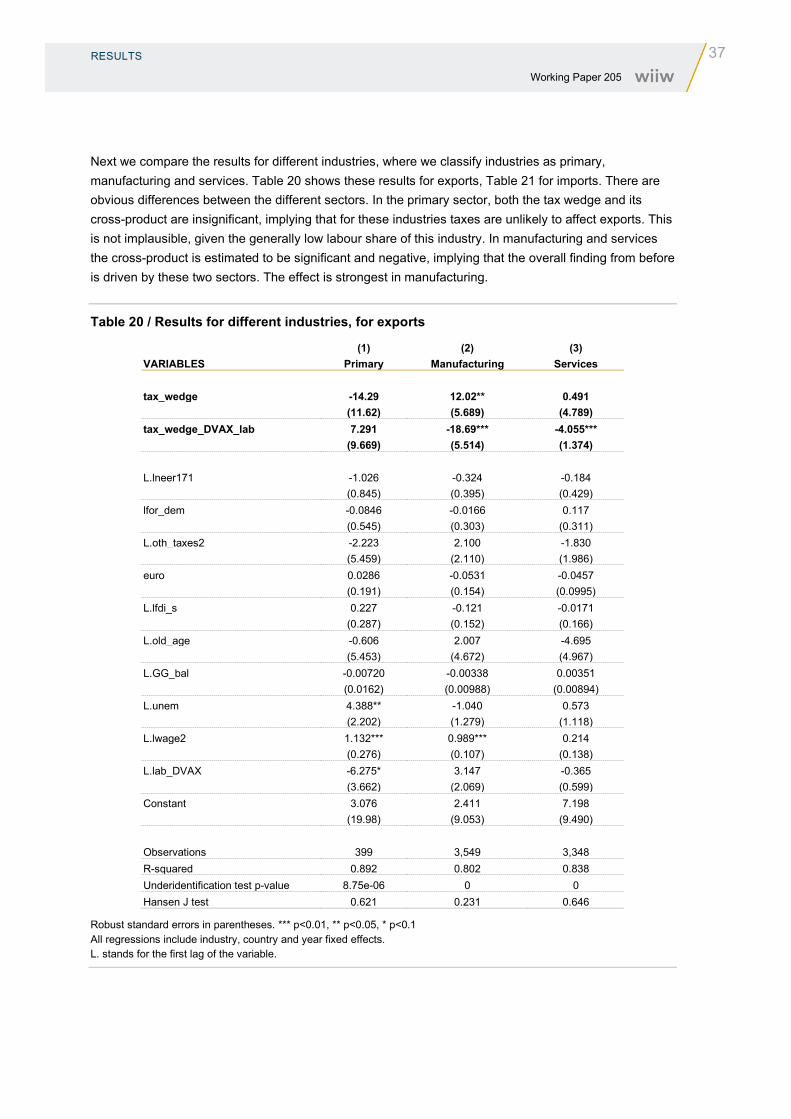
Next we compare the results for different industries, where we classify industries as primary, manufacturing and services. Table 20 shows these results for exports, Table 21 for imports. There are obvious differences between the different sectors. In the primary sector, both the tax wedge and its cross-product are insignificant, implying that for these industries taxes are unlikely to affect exports. This is not implausible, given the generally low labour share of this industry. In manufacturing and services the cross-product is estimated to be significant and negative, implying that the overall finding from before is driven by these two sectors. The effect is strongest in manufacturing.
Table 20 / Results for different industries, for exports
(1) (2) (3) VARIABLES Primary Manufacturing Services tax_wedge -14.29 12.02** 0.491 (11.62) (5.689) (4.789) tax_wedge_DVAX_lab 7.291 -18.69*** -4.055*** (9.669) (5.514) (1.374) L.lneer171 -1.026 -0.324 -0.184 (0.845) (0.395) (0.429) lfor_dem -0.0846 -0.0166 0.117 (0.545) (0.303) (0.311) L.oth_taxes2 -2.223 2.100 -1.830 (5.459) (2.110) (1.986) euro 0.0286 -0.0531 -0.0457 (0.191) (0.154) (0.0995) L.lfdi_s 0.227 -0.121 -0.0171 (0.287) (0.152) (0.166) L.old_age -0.606 2.007 -4.695 (5.453) (4.672) (4.967) L.GG_bal -0.00720 -0.00338 0.00351 (0.0162) (0.00988) (0.00894) L.unem 4.388** -1.040 0.573 (2.202) (1.279) (1.118) L.lwage2 1.132*** 0.989*** 0.214 (0.276) (0.107) (0.138) L.lab_DVAX -6.275* 3.147 -0.365 (3.662) (2.069) (0.599) Constant 3.076 2.411 7.198 (19.98) (9.053) (9.490) Observations 399 3,549 3,348 R-squared 0.892 0.802 0.838 Underidentification test p-value 8.75e-06 0 0 Hansen J test 0.621 0.231 0.646
Robust standard errors in parentheses. *** p<0.01, ** p<0.05, * p<0.1 All regressions include industry, country and year fixed effects. L. stands for the first lag of the variable.
38 RESULTS Working Paper 205
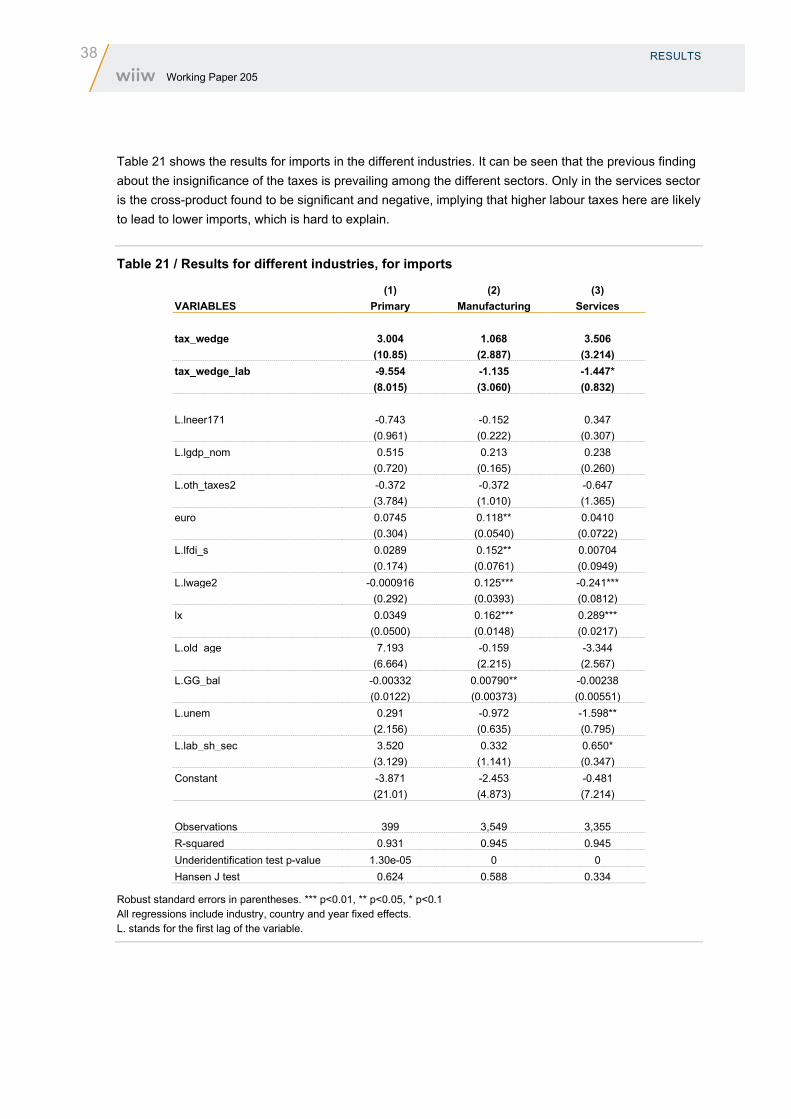
Table 21 shows the results for imports in the different industries. It can be seen that the previous finding about the insignificance of the taxes is prevailing among the different sectors. Only in the services sector is the cross-product found to be significant and negative, implying that higher labour taxes here are likely to lead to lower imports, which is hard to explain.
Table 21 / Results for different industries, for imports
(1) (2) (3) VARIABLES Primary Manufacturing Services tax_wedge 3.004 1.068 3.506 (10.85) (2.887) (3.214) tax_wedge_lab -9.554 -1.135 -1.447* (8.015) (3.060) (0.832) L.lneer171 -0.743 -0.152 0.347 (0.961) (0.222) (0.307) L.lgdp_nom 0.515 0.213 0.238 (0.720) (0.165) (0.260) L.oth_taxes2 -0.372 -0.372 -0.647 (3.784) (1.010) (1.365) euro 0.0745 0.118** 0.0410 (0.304) (0.0540) (0.0722) L.lfdi_s 0.0289 0.152** 0.00704 (0.174) (0.0761) (0.0949) L.lwage2 -0.000916 0.125*** -0.241*** (0.292) (0.0393) (0.0812) lx 0.0349 0.162*** 0.289*** (0.0500) (0.0148) (0.0217) L.old_age 7.193 -0.159 -3.344 (6.664) (2.215) (2.567) L.GG_bal -0.00332 0.00790** -0.00238 (0.0122) (0.00373) (0.00551) L.unem 0.291 -0.972 -1.598** (2.156) (0.635) (0.795) L.lab_sh_sec 3.520 0.332 0.650* (3.129) (1.141) (0.347) Constant -3.871 -2.453 -0.481 (21.01) (4.873) (7.214) Observations 399 3,549 3,355 R-squared 0.931 0.945 0.945 Underidentification test p-value 1.30e-05 0 0 Hansen J test 0.624 0.588 0.334
Robust standard errors in parentheses. *** p<0.01, ** p<0.05, * p<0.1 All regressions include industry, country and year fixed effects. L. stands for the first lag of the variable.

DISCUSSION AND POLICY IMPLICATIONS 39 Working Paper 205
5. Discussion and policy implications
The findings presented so far have important implications for the existing literature on taxation and international trade as well as for policy making. They illustrate that the effect of taxation on trade is not constant across countries and industries but depends on the underlying circumstances, i.e. the share of the domestic labour in the total value added. Thus, how a specific increase or decrease in labour taxes will impact trade will be different for different countries and industries at different points in time, depending on this share.
To illustrate this, we present in Table 22 the semi-elasticities of exports to changes in the labour tax wedge for Austria, Germany and the US in 2014 for the 33 industries included in this analysis. In all three countries the semi-elasticities vary considerably: from -0.4 to -4.3 in Austria, from -0.2 to -4.5 in Germany, and from -0.3 to -4.7 in the US. In Austria, for instance, in the mining and quarrying sector an increase in the labour tax of 1 pp is likely to reduce exports by 1.2%, whereas in agriculture the same increase would reduce exports by 4.1%. One can also note that certain industries have a very different semi-elasticity in different countries. For instance, agriculture in the US has a semi-elasticity of -1.8, while in Austria the semi-elasticity is -4.1.
To illustrate this point further, in Table 23 we show the semi-elasticities for the automotive sector in 2014 for 37 countries which have the relevant data. Even though it is always the same industry and the analysed countries have rather similar levels of development, the semi-elasticities differ greatly, ranging from -0.5 in Mexico to -3.2 in Japan. In Hungary, for example, a 1 pp increase in the labour tax wedge is likely to reduce automotive exports by 0.7%, while a same increase in France would lower automotive exports by 2.6%.

40 DISCUSSION AND POLICY IMPLICATIONS Working Paper 205
Table 22 / Semi-elasticities of exports to labour tax wedge changes for 33 industries in Austria, Germany and the US, in 2014
Industry name Austria Germany US Paper products and printing -2.11 -2.55 -2.79 Other social and personal services -3.48 -3.30 -3.94 Agriculture, hunting, forestry and fishing [A] -4.07 -3.25 -1.78 Mining and quarrying [B] -1.17 -3.75 -1.14 Food products, beverages and tobacco [CA] -1.96 -2.98 -1.93 Textiles, wearing apparel, leather and related products [CB] -2.28 -3.00 -3.39 Wood and products of wood and cork, except furniture -2.40 -3.22 -3.06 Coke and refined petroleum products [CD] -1.12 -0.58 -0.38 Chemical and pharmaceutical products -1.41 -1.91 -1.26 Rubber and plastics products -2.03 -2.57 -2.49 Other non-metallic mineral products -2.41 -2.78 -2.60 Basic metals -1.82 -2.37 -2.30 Fabricated metal products, except machinery and equipment -2.25 -3.09 -2.89 Computer, electronic and optical products [CI] -1.63 -2.48 -2.38 Electrical equipment [CJ] -1.94 -2.65 -2.69 Machinery and equipment n.e.c. [CK] -1.95 -2.80 -2.58 Motor vehicles, trailers and semi-trailers -1.25 -2.14 -1.80 Other transport equipment -1.61 -2.44 -2.66 Furniture; other manufacturing; repair and installation of machinery and equipment [CM] -2.66 -3.43 -3.10 Electricity, gas and water supply; sewerage, waste management and remediation activities [D-E] -1.68 -1.53 -1.50 Construction [F] -2.64 -3.41 -3.74 Wholesale and retail trade, repair of motor vehicles and motorcycles [G] -2.95 -3.64 -2.69 Transportation and storage [H] -2.40 -2.59 -2.94 Accommodation and food service activities [I] -2.53 -3.71 -3.21 Publishing, audiovisual and broadcasting activities [JA] -3.25 -2.50 -2.13 Telecommunications [JB] -1.92 -1.52 -1.39 IT and other information services [JC] -3.43 -3.31 -4.09 Financial and insurance activities [K] -2.98 -3.40 -2.93 Real estate activities [L] -0.42 -0.24 -0.28 Professional, scientific and technical activities; administrative and support service activities [M-N] -3.28 -3.14 -3.68 Public administration and defence; compulsory social security [O] -3.81 -3.89 N/A Education [P] -4.27 -4.48 -4.74 Human health and social work activities [Q] -3.93 -3.91 -4.40

DISCUSSION AND POLICY IMPLICATIONS 41 Working Paper 205
Table 23 / Semi-elasticities of exports of motor vehicles, trailers and semi-trailers to labour tax wedge changes in 37 countries, in 2014
Country Domestic labour value added share of exports
Semi-elasticity of exports to labour tax wedge
Australia 0.39 -2.08 Austria 0.24 -1.25 Belgium 0.35 -1.82 Bulgaria 0.28 -1.48 Canada 0.35 -1.84 Switzerland 0.42 -2.20 Cyprus 0.49 -2.60 Czechia 0.19 -1.01 Germany 0.41 -2.14 Denmark 0.53 -2.78 Spain 0.41 -2.15 Estonia 0.31 -1.62 Finland 0.45 -2.39 France 0.49 -2.59 UK 0.52 -2.72 Greece 0.42 -2.19 Croatia 0.46 -2.42 Hungary 0.13 -0.66 Ireland 0.34 -1.78 Italy 0.45 -2.38 Japan 0.61 -3.22 Korea 0.35 -1.84 Lithuania 0.22 -1.18 Luxembourg 0.21 -1.12 Latvia 0.35 -1.83 Mexico 0.09 -0.48 Malta 0.40 -2.11 Netherlands 0.36 -1.91 Norway 0.53 -2.80 Poland 0.25 -1.33 Portugal 0.29 -1.54 Romania 0.35 -1.87 Slovakia 0.19 -0.98 Slovenia 0.27 -1.44 Sweden 0.38 -2.02 Turkey 0.40 -2.12 US 0.34 -1.80
Another way to make use of these findings is by observing the contribution of the labour tax changes to the changes in trade during a certain period for different countries and industries. To illustrate this, we take two European countries which have recorded pronounced but opposite trends in labour taxes. The first is the UK, which recorded a decrease in the labour tax wedge between 2005 and 2014 of approximately 3 pp of total labour costs. The second is Italy, which saw its labour tax wedge increase over the same period by 2 pp of total labour costs (Figure A1 in the Appendix). Tables 24 and 25 show these calculations. The changes in exports over the period 2005-2014 are shown for the 33 analysed

42 DISCUSSION AND POLICY IMPLICATIONS Working Paper 205
industries, as well as the contributions of the labour tax wedge to these changes. The contributions are calculated by multiplying the semi-elasticities for each industry and year by the change in the labour tax during that year.
One can see from Table 24 that UK exports in 2005-2014 increased in all industries surveyed, with the exception of the Computer, electronic and optical products sector, which saw a decline of 9.6%. Education recorded the biggest increase, of 86%. The unweighted average for all the industries was 44%, which indicates that there was a general upward trend in exports during this period, driven by many factors. The contribution of the labour tax changes to the export dynamics was positive in all the industries covered, but with great variations. For instance, in Real estate activities it accounted for just 1.2 pp of the entire growth of 82.2%, while in the Other non-metallic mineral products sector it accounted for 10.1 pp of the entire growth of 20.2%. The unweighted average of the contributions for all the industries was 8.8 pp, which is one fifth of the average increase in exports during the same period, meaning that the overall contribution of the labour tax changes to the export dynamics in the UK during this period was moderate.
Turning to Italy (Table 25), one can see that it too has seen increases in the exports of 32 out of the 33 industries surveyed in 2005-2014, and that, again, only exports of Computers and electronic and optical products declined during this period, by 16.4%. Electricity, gas and water supply saw the steepest increase, of 293%. As the labour tax wedge increased in Italy during this period, it contributed negatively to the export growth in all the industries. But here too the magnitude of the contribution varied considerably – in Transportation and storage it was -4.6 pp, which is more than half of the growth in exports observed there (8.3%). In Real estate activities, on the other hand, the contribution was just -0.3 pp, which is a negligible part of the total growth of exports there of 69.5%. The average contribution by all the industries (unweighted) was -4.9 pp, which is a rather small fraction of the average growth of exports of 65%.
Finally, in Table 26 we present these average (unweighted) contributions of the labour tax changes to the export dynamics for all the analysed countries for the entire period surveyed (2005-2014). The first thing to note is that the average industry export growth during the observed period was high in all the countries surveyed – Canada saw the lowest growth of 29.5%, while Japan recorded the highest growth of 336%. As these averages are unweighted, the very high growth rates are sometimes driven by just several industries which recorded very small exports at the beginning of the sample. Despite this, it still holds that almost all the industries in almost all the countries saw an increase in exports during this period. The second finding of note is that the contributions of the labour tax wedge to this growth were rather limited. In just six out of the 31 countries for which this is calculated was the contribution of the labour tax changes bigger than 10% of export growth (in absolute terms): Sweden (12.5 pp of 60.4%), the UK (8.8 pp of 43.8%), Denmark (7.7 pp of 48.6%), France (5.8 pp of 40.7%), Germany (8 pp of 72.5%) and Mexico (-6.1 pp of 54.2%). In all the other countries the contribution was smaller. Thus, in the sample of countries and over the time period covered by this analysis, the contribution of the labour tax changes to export growth has been rather limited.

DISCUSSION AND POLICY IMPLICATIONS 43 Working Paper 205
Table 24 / Changes in exports between 2005-2014 in the 33 analysed industries, and the contribution of the labour tax wedge to these changes (UK)
Industry
Change in exports
(%)
Contribution of the change in the labour
tax wedge (pp) Agriculture, hunting, forestry and fishing [A] 56.0% 9.9 Wood and products of wood and cork, except furniture 5.6% 10.0 Paper products and printing 2.9% 9.5 Coke and refined petroleum products [CD] 70.3% 2.1 Chemical and pharmaceutical products 26.4% 5.9 Rubber and plastics products 30.8% 9.3 Other non-metallic mineral products 20.2% 10.1 Basic metals 66.0% 6.8 Fabricated metal products, except machinery and equipment 20.8% 10.2 Computer, electronic and optical products [CI] -9.6% 7.8 Electrical equipment [CJ] 42.0% 8.4 Machinery and equipment n.e.c. [CK] 67.9% 8.6 Motor vehicles, trailers and semi-trailers 55.6% 8.4 Other transport equipment 50.6% 7.8 Furniture; other manufacturing; repair and installation of machinery and equipment [CM] 36.6% 9.5 Electricity, gas and water supply; sewerage, waste management and remediation activities [D-E] 75.7% 4.6 Mining and quarrying [B] 51.8% 2.9 Construction [F] 50.5% 11.9 Wholesale and retail trade, repair of motor vehicles and motorcycles [G] 26.9% 9.9 Transportation and storage [H] 24.9% 11.9 Accommodation and food service activities [I] 43.3% 9.9 Publishing, audiovisual and broadcasting activities [JA] 9.4% 9.9 Telecommunications [JB] 80.9% 7.0 IT and other information services [JC] 55.7% 11.8 Financial and insurance activities [K] 48.0% 7.7 Real estate activities [L] 82.2% 1.2 Professional, scientific and technical activities; administrative and support service activities [M-N] 58.2% 10.2 Public administration and defence; compulsory social security [O] 49.3% 10.9 Education [P] 86.0% 14.1 Human health and social work activities [Q] 24.9% 12.3 Other social and personal services 56.2% 9.8 Food products, beverages and tobacco [CA] 51.3% 8.9 Textiles, wearing apparel, leather and related products [CB] 37.1% 10.1

44 DISCUSSION AND POLICY IMPLICATIONS Working Paper 205
Table 25 / Changes in exports between 2005-2014 in the 33 analysed industries, and the contribution of the labour tax wedge to these changes (Italy)
Industry
Change in exports (%)
Contribution of the change in the labour
tax wedge (pp) Agriculture, hunting, forestry and fishing [A] 52.0% -5.0 Wood and products of wood and cork, except furniture 38.0% -5.8 Paper products and printing 53.5% -5.0 Chemical and pharmaceutical products 41.4% -3.5 Rubber and plastics products 28.8% -4.7 Other non-metallic mineral products 24.7% -5.4 Basic metals 73.4% -4.1 Fabricated metal products, except machinery and equipment 27.0% -5.1 Computer, electronic and optical products [CI] -16.4% -4.2 Electrical equipment [CJ] 70.4% -4.0 Machinery and equipment n.e.c. [CK] 40.9% -4.6 Motor vehicles, trailers and semi-trailers 51.7% -4.3 Other transport equipment 59.1% -4.5 Furniture; other manufacturing; repair and installation of machinery and equipment [CM] 46.7% -5.7 Electricity, gas and water supply; sewerage, waste management and remediation activities [D-E] 292.5% -2.3 Mining and quarrying [B] 67.3% -1.8 Construction [F] 244.2% -5.9 Wholesale and retail trade, repair of motor vehicles and motorcycles [G] 31.8% -6.1 Transportation and storage [H] 8.3% -4.6 Accommodation and food service activities [I] 15.9% -5.8 Publishing, audiovisual and broadcasting activities [JA] 33.7% -4.8 Telecommunications [JB] 86.0% -2.0 IT and other information services [JC] 90.5% -6.1 Financial and insurance activities [K] 63.1% -4.9 Real estate activities [L] 69.5% -0.3 Professional, scientific and technical activities; administrative and support service activities [M-N] 25.7% -5.9 Public administration and defence; compulsory social security [O] 100.9% -6.4 Education [P] 72.5% -9.0 Human health and social work activities [Q] 173.9% -7.2 Other social and personal services 31.8% -6.3 Food products, beverages and tobacco [CA] 60.5% -4.9 Textiles, wearing apparel, leather and related products [CB] 28.5% -5.1

DISCUSSION AND POLICY IMPLICATIONS 45 Working Paper 205
Table 26 / Average industry export growth in the analysed countries over 2005-2014, and the contributions of the labour tax changes to this growth
Country Industry export growth, simple
average, 2005-2014 (in %)
Contribution of the labour tax changes to the industry export growth, simple
average, 2005-2014 (in pp) AU 182.0% 2.1 AT 62.3% -2.7 BE 47.1% -0.1 CA 29.5% 0.8 CH 76.4% 0.9 CY 125.7% -2.3 CZ 77.7% 2.4 DE 72.5% 8.0 DK 48.6% 7.7 ES 57.9% -4.6 EE 127.6% -0.4 FI 143.1% 1.9 FR 40.7% 5.8 UK 43.8% 8.8 EL 61.7% 1.9 HU 141.1% 3.6 IT 66.8% -4.8 JP 336.1% -11.4 KR 160.7% -8.9 LT 131.1% 9.7 LV 177.9% 0.9 MX 54.2% -6.1 MT 75.1% -1.8 NL 47.4% -0.1 NO 68.4% 1.0 PL 132.1% 6.5 RO 120.6% 0.0 SK 103.2% -5.5 SE 60.4% 12.5 TR 138.3% 8.8 US 58.3% -3.0
46 CONCLUSION Working Paper 205
6. Conclusion
In this paper we have reinvestigated the link between labour taxes and international trade, focusing specifically on the role of domestic labour value added in this relationship. Existing studies have argued that higher labour taxes worsen the trade balance – they reduce exports because they make domestic products more expensive, and they may also increase imports because they make them cheaper than domestic products. But for this effect to be relevant, domestic labour costs have to account for a significant share of the final price of the product. If the share of domestic labour costs in the total value of the product is low, changes in labour taxes will, other things being equal, have a less pronounced impact on the final price of the product, and hence the respective changes in exports and imports will be small.
This paper has used industry-level data for 33 industries from 41 OECD and EU countries over the 2005-2014 period to assess the relationship between labour taxes and exports and imports, and to examine whether this relationship is affected by the share of domestic labour costs in the total value added.
We have found that labour taxes are likely to have a negative effect on exports. The impact depends to a large extent on the share of domestic labour value added, with the magnitude of the effect increasing in line with a larger share of domestic labour. Since this share varies by industries, countries and years, the effect of the labour tax on exports will also vary. Imports, on the other hand, have been found to be insensitive to domestic labour tax changes, which may be explained by the home bias – people and businesses continue to buy domestic goods despite the fact that they are more expensive than their foreign counterparts.
These results have proved to be stable to various robustness checks, including estimations over shorter periods of time, excluding outliers and certain countries, excluding fixed effects and control variables, alternative instrument sets and alternative definitions of the variables.
The paper has calculated the semi-elasticities of exports to labour tax changes for selected countries and industries, illustrating that they differ considerably, meaning that a given change in labour taxes is likely to have very different effects on exports in different industries and countries.
Further, we have calculated the overall contribution of labour tax changes to export developments in the analysed time period and sample of countries, finding that it has been rather limited in most of the countries surveyed.
These results have important implications for policy makers. They imply that changes in labour taxes will not affect all sectors and countries in the same way, that the overall effects on export developments are likely to be limited, and that policy makers must be wary of this when considering changing taxes for the sake of improving the trade balance.

CONCLUSION 47 Working Paper 205
The main finding of this study – that the effect of labour taxes on trade is likely to depend on the underlying circumstances – points to several avenues for future research on this topic. It would be worthwhile investigating which other circumstances may affect the taxation and trade nexus, such as labour market conditions and characteristics (unemployment rate, unionisation, level of wages etc.). Also, this study refers to a rather limited sample of countries (OECD + EU) and a rather limited time period (2005-2014). It would be good to see if the results hold over a longer time period and for an extended sample of countries, including also developing economies.
48 REFERENCES Working Paper 205
References
Alesina, A. and R. Perotti (1997), ‘The welfare state and competitiveness’, American Economic Review, 87(5): 921-939.
Bernoth, K., Burauel, P. and Engler, P. (2014), ‘Fiskalische Abwertung: Wirtschaftlicher Impuls für die Krisenländer im Euroraum’, DIW Wochenbericht, 81(39), 916–922.
Engler, P., G. Ganelli, J.Tervala and S. Voigts (2017), ‘Fiscal devaluation in a monetary union’, IMF Economic Review, 65(2), 241–272.
Christopher J.E., L. Guerrieri and G.C. Gust (2005), ‘Expansionary Fiscal Shocks and the US Trade Deficit’, International Finance, Vol. 8(3), pp. 363-397.
De Mooij, R. and M. Keen (2012), ‘Fiscal Devaluation and Fiscal Consolidation: The VAT in Troubled Times’, NBER chapters in: Fiscal Policy after the Financial Crisis, pp. 443-485, National Bureau of Economic Research, Inc., Cambridge, Massachusetts.
Farhi, E., G. Gopinath and O. Itskhoki (2014), ‘Fiscal devaluations’, Review of Economic Studies, 81(2), 725-760.
Gomes, S., P. Jacquinot and M. Pisani (2016), ‘Fiscal devaluation in the euro area: A model-based analysis’, Economic Modelling, 52, 58–70.
Hohberger, S. and L. Kraus (2016), ‘Is fiscal devaluation welfare-enhancing?’, Economic Modelling, 58, 512-522.
Holzner, M., M. Tkalec, M. Vizek and G. Vukšić (2018), ‘Fiscal devaluations: Evidence using bilateral trade balance data’, Review of World Economics, 154, 247–275. https://doi.org/10.1007/s10290-018-0309-5
Holzner M., M. Tkalec and G.Vukšić (2019), ‘Composition of trade flows and the effectiveness of fiscal devaluation’, World Economics, 42:453–477. https://doi.org/10.1111/twec.12700
IMF (2011), ‘Fiscal Devaluation: What Is It – and Does It Work?’, Fiscal Monitor: Addressing Fiscal Challenges to Reduce Economic Risks, Appendix 1.
IMF (2012), ‘Internal devaluation – The IMF view’, IMF Staff Report. https://kkalev4economy.wordpress.com/2012/03/20/internal-devaluation-the-imf-view/
Laker, J.F. (1981), ‘Fiscal Proxies for Devaluation: A General Review’, IMF Staff Report, Vol. 28, No. 1, pp. 118-143.
Keynes, J. M. (1931). Addendum to: Great Britain. Committee on Finance and Industry Report [Macmillan Report] (London: His Majesty’s Stationery Office, 1931) 190–209. Reprinted in Donald Moggridge, The Collected Writings of John Maynard Keynes, Vol. 20 (London: Macmillan and Cambridge: Cambridge Press for the Royal Economic Society, 1981), pp. 283-309.
Lane, P.R. and R. Perotti (1998), ‘The trade balance and fiscal policy in the OECD’, Elsevier, Vol. 42(3-5), pp. 887-895.
Lipińska, A., and L. von Thadden, (2019), ‘On the Effectiveness of Fiscal Devaluations in a Monetary Union’, Macroeconomic Dynamics, 23(8), 3424-3456. https://doi.org/10.1017/S136510051800010X.

APPENDIX 49 Working Paper 205
Appendix
Table A1 / Sectors included in the analysis
Paper products and printing Other social and personal services Agriculture, hunting, forestry and fishing [A] Mining and quarrying [B] Food products, beverages and tobacco [CA] Textiles, wearing apparel, leather and related products [CB] Wood and products of wood and cork, except furniture Coke and refined petroleum products [CD] Chemical and pharmaceutical products Rubber and plastics products Other non-metallic mineral products Basic metals Fabricated metal products, except machinery and equipment Computer, electronic and optical products [CI] Electrical equipment [CJ] Machinery and equipment n.e.c. [CK] Motor vehicles, trailers and semi-trailers Other transport equipment Furniture; other manufacturing; repair and installation of machinery and equipment [CM] Electricity, gas and water supply; sewerage, waste management and remediation activities [D-E] Construction [F] Wholesale and retail trade, repair of motor vehicles and motorcycles [G] Transportation and storage [H] Accommodation and food service activities [I] Publishing, audiovisual and broadcasting activities [JA] Telecommunications [JB] IT and other information services [JC] Financial and insurance activities [K] Real estate activities [L] Professional, scientific and technical activities; administrative and support service activities [M-N] Public administration and defence; compulsory social security [O] Education [P] Human health and social work activities [Q]

50 APPENDIX Working Paper 205
Table A2 / Descriptive statistics of the variables
variable N mean sd min p25 p50 p75 max tax_wedge 11236 0.38 0.09 0.14 0.32 0.39 0.43 0.56 PIT 10894 0.13 0.06 0.02 0.09 0.13 0.16 0.39 SSC_f 10894 0.16 0.07 0 0.10 0.16 0.23 0.31 SSC_w 10894 0.09 0.05 0 0.06 0.08 0.12 0.19 DLVA_X 11769 0.44 0.19 0.003 0.31 0.44 0.57 0.93 DLVA_M 11851 0.58 0.21 0.003 0.45 0.61 0.74 1.00 lx 11769 7.32 2.14 -1.61 5.95 7.40 8.84 12.50 lm 11851 7.52 2.00 0.83 6.13 7.66 8.97 12.93 lneer 11851 4.60 0.10 4.15 4.58 4.61 4.63 4.99 lfor_dem 11851 28.36 0.60 27.08 27.97 28.32 28.57 30.30 ldom_gdp 11851 26.46 1.77 22.58 24.82 26.68 27.77 30.49 other_taxes 11723 0.23 0.04 0.13 0.21 0.23 0.25 0.41 EU 11851 0.73 0 0 1 1 1 euro 11851 0.41 0 0 0 1 1 lfdi_stock 11523 25.75 1.42 22.31 24.89 25.83 26.89 29.33 lwage 11851 10.43 0.82 5.37 9.85 10.58 11.06 14.09 old_age 11851 0.23 0.05 0.09 0.20 0.24 0.27 0.41 GG_bal 11851 -2.48 4.62 -32.03 -4.56 -2.66 -0.26 18.68 unem 11851 0.08 0.04 0.02 0.05 0.07 0.10 0.27
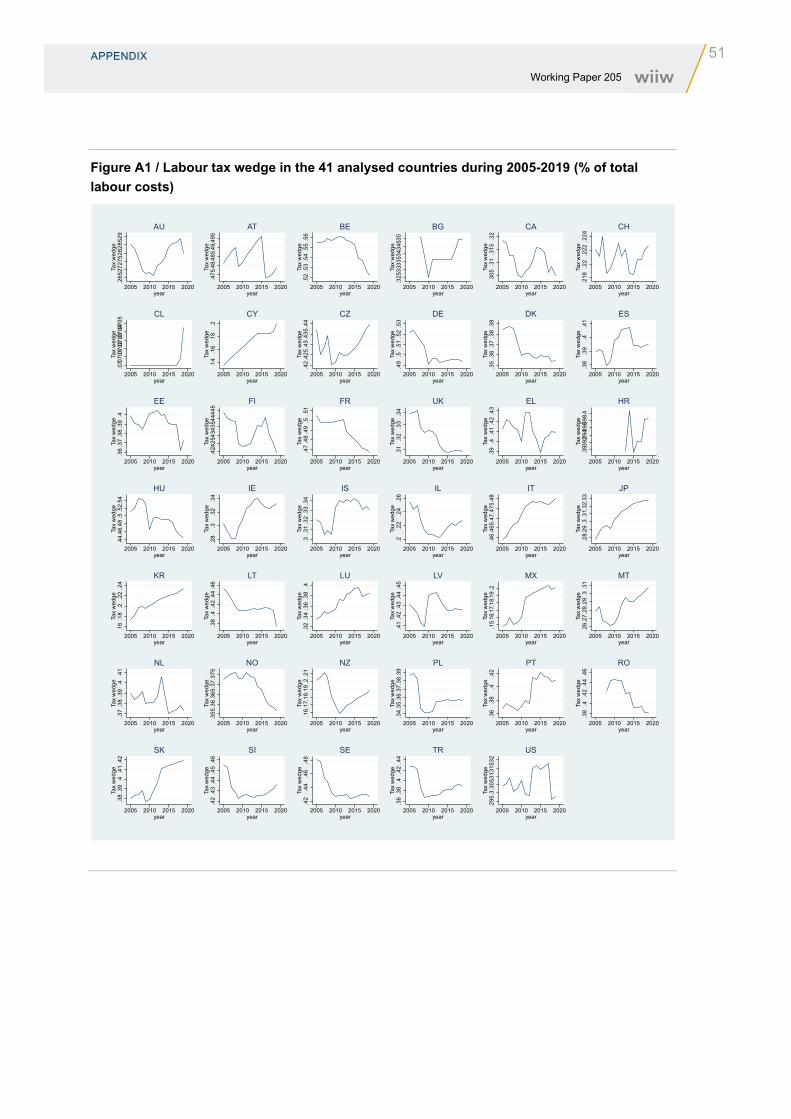
APPENDIX 51 Working Paper 205
Figure A1 / Labour tax wedge in the 41 analysed countries during 2005-2019 (% of total labour costs)
.265
.27.2
75.2
8.285
.29
Tax
wed
ge
2005 2010 2015 2020year
AU
.475
.48.
485.
49.4
95Ta
x w
edge
2005 2010 2015 2020year
AT
.52
.53
.54
.55
.56
Tax
wed
ge
2005 2010 2015 2020year
BE
.325
.33.3
35.3
4.345
.35
Tax
wed
ge
2005 2010 2015 2020year
BG
.305
.31
.315
.32
Tax
wed
ge
2005 2010 2015 2020year
CA
.218
.22
.222
.224
Tax
wed
ge
2005 2010 2015 2020year
CH
.07.0
701.070
2.070
3.070
4.070
5Ta
x w
edge
2005 2010 2015 2020year
CL
.14
.16
.18
.2Ta
x w
edge
2005 2010 2015 2020year
CY.4
2.42
5.43
.435
.44
Tax
wed
ge
2005 2010 2015 2020year
CZ
.49
.5.5
1.5
2.5
3Ta
x w
edge
2005 2010 2015 2020year
DE
.35
.36
.37
.38
.39
Tax
wed
ge
2005 2010 2015 2020year
DK
.38
.39
.4.4
1Ta
x w
edge
2005 2010 2015 2020year
ES
.36
.37
.38
.39
.4Ta
x w
edge
2005 2010 2015 2020year
EE
.42.4
25.4
3.435
.44.4
45Ta
x w
edge
2005 2010 2015 2020year
FI
.47
.48
.49
.5.5
1Ta
x w
edge
2005 2010 2015 2020year
FR.3
1.3
2.3
3.3
4Ta
x w
edge
2005 2010 2015 2020year
UK
.39
.4.4
1.4
2.4
3Ta
x w
edge
2005 2010 2015 2020year
EL
.39.3
92.39
4.396.
398.
4Ta
x w
edge
2005 2010 2015 2020year
HR
.44.
46.4
8.5
.52.
54Ta
x w
edge
2005 2010 2015 2020year
HU
.28
.3.3
2.3
4Ta
x w
edge
2005 2010 2015 2020year
IE
.3.3
1.3
2.3
3.3
4Ta
x w
edge
2005 2010 2015 2020year
IS
.2.2
2.2
4.2
6Ta
x w
edge
2005 2010 2015 2020year
IL.4
6.46
5.47
.475
.48
Tax
wed
ge
2005 2010 2015 2020year
IT
.28.
29.3
.31.
32.3
3Ta
x w
edge
2005 2010 2015 2020year
JP
.16
.18
.2.2
2.2
4Ta
x w
edge
2005 2010 2015 2020year
KR
.38
.4.4
2.4
4.4
6Ta
x w
edge
2005 2010 2015 2020year
LT
.32
.34
.36
.38
.4Ta
x w
edge
2005 2010 2015 2020year
LU
.41
.42
.43
.44
.45
Tax
wed
ge
2005 2010 2015 2020year
LV
.15.
16.1
7.18
.19
.2Ta
x w
edge
2005 2010 2015 2020year
MX.2
6.27
.28.
29.3
.31
Tax
wed
ge
2005 2010 2015 2020year
MT
.37
.38
.39
.4.4
1Ta
x w
edge
2005 2010 2015 2020year
NL
.355
.36.
365.
37.3
75Ta
x w
edge
2005 2010 2015 2020year
NO
.16.
17.1
8.19
.2.2
1Ta
x w
edge
2005 2010 2015 2020year
NZ
.34.
35.3
6.37
.38.
39Ta
x w
edge
2005 2010 2015 2020year
PL
.36
.38
.4.4
2Ta
x w
edge
2005 2010 2015 2020year
PT
.38
.4.4
2.4
4.4
6Ta
x w
edge
2005 2010 2015 2020year
RO
.38
.39
.4.4
1.4
2Ta
x w
edge
2005 2010 2015 2020year
SK
.42
.43
.44
.45
.46
Tax
wed
ge
2005 2010 2015 2020year
SI
.42
.44
.46
.48
Tax
wed
ge
2005 2010 2015 2020year
SE
.36
.38
.4.4
2.4
4Ta
x w
edge
2005 2010 2015 2020year
TR
.295
.3.3
05.3
1.315
.32
Tax
wed
ge
2005 2010 2015 2020year
US


IMPRESSUM
Herausgeber, Verleger, Eigentümer und Hersteller: Verein „Wiener Institut für Internationale Wirtschaftsvergleiche“ (wiiw), Wien 6, Rahlgasse 3 ZVR-Zahl: 329995655 Postanschrift: A 1060 Wien, Rahlgasse 3, Tel: [+431] 533 66 10, Telefax: [+431] 533 66 10 50 Internet Homepage: www.wiiw.ac.at Nachdruck nur auszugsweise und mit genauer Quellenangabe gestattet. Offenlegung nach § 25 Mediengesetz: Medieninhaber (Verleger): Verein "Wiener Institut für Internationale Wirtschaftsvergleiche", A 1060 Wien, Rahlgasse 3. Vereinszweck: Analyse der wirtschaftlichen Entwicklung der zentral- und osteuropäischen Länder sowie anderer Transformationswirtschaften sowohl mittels empirischer als auch theoretischer Studien und ihre Veröffentlichung; Erbringung von Beratungsleistungen für Regierungs- und Verwaltungsstellen, Firmen und Institutionen.