laddering in initial public offering allocations · pdf fileladdering in initial public...
TRANSCRIPT

Working Paper No. 2/2011
January 2011
Laddering in Initial Public Offering Allocations
Sturla Lyngnes Fjesme
© Sturla Lyngnes Fjesme 2011. All rights reserved. Short sections of text, not to exceed two paragraphs, may be quoted without explicit permission, provided that full credit, including © notice, is given to the source. This paper can be downloaded without charge from the CCGR website http://www.bi.no/ccgr

1
Laddering in Initial Public Offering
Allocations1
.
Sturla Lyngnes Fjesme2
Job market paper
.
January 16, 2011
.
.
JEL classification: G3; G24
Keywords: IPO allocations; Laddering; Tie-in agreements; Rent seeking; Equity offerings
1I am very grateful to Øyvind Norli (supervisor), François Derrien, Roni Michaely, Øyvind Bøhren,Bruno Gerard, Karin Thorburn (discussant), Diane Denis (discussant), William Megginson (discussant),Paul Ehling, Christopher Vincent, David De Angelis, Alyssa Anderson, Maury Saslaff, Yelena Larkin, GideonSaar, and seminar participants at the S.C. Johnson Graduate School of Management at Cornell University,the Norwegian School of Management, the Nordic Finance Network (NFN) workshop in Lund 2010 and theFinancial Management Association (FMA) Doctoral Student Consortium in Hamburg 2010 for valuable sug-gestions. I thank the Oslo Stock Exchange VPS for providing the data, the Financial Supervisory Authorityof Norway (Finanstilsynet) and the companies and investment banks that helped locate the listing prospec-tuses. Part of the article was written while I was a visiting PhD student at the S.C. Johnson GraduateSchool of Management at Cornell University. I also thank the American-Scandinavian-Association and theNorwegian Central Bank for financial support. All errors are my own.
2Correspondence: The Norwegian School of Management, Nydalsveien 37, 0484 Oslo, Norway, Emailaddress: [email protected], Telephone (USA): +1-607-793-6911, Telephone (Norway): +47-957-722-43.

2
Abstract
Tying Initial Public Offering (IPO) allocations of common stock to after-listing
purchases in the IPO shares, a process referred to as IPO laddering, has resulted
in large-scale investigations of the major investment banks by the SEC and the
National Association of Securities Dealers (NASD). This process is claimed to
drive after-listing share prices above their fundamental values, and is illegal un-
der the laws against market manipulation and fraud. As a result, investment
banks are reluctant to distribute information about their allocation practices, so
investigating the alleged laddering and its implications has proven to be diffi -
cult. With a new and unique dataset of 16,593 IPO allocations on the Oslo Stock
Exchange (OSE), we confirm the SEC’s suspicion that IPO allocations are de-
pendent on after-listing trading. Allocations to after-listing purchasing investors
has been combined with allocations to high brokerage commissions generating
investors that can take advantage of the IPO laddering, thereby allowing invest-
ment banks to recapture some of the money left on the table in IPOs. Allocated
IPO investors buy more shares after new listings because they are rewarded for
doing so with more IPO allocations.

3
1. Introduction
On December 6, 2000 the Wall Street Journal (WSJ) reported that the SEC and the
NASD were investigating some of the major investment banks for tying IPO allocations to
after-listing purchases. An investment banker interviewed for the article admits that IPO
allocations to investors with after-listing interest could occur, but explains that after-listing
interest is a signal that the investor is of the buy-and-hold type. Since banks strive to allocate
shares to buy-and-hold investors to create price stability, after-listing purchases are related
to IPO allocations. An investor confirms that expressing an interest in after-listing purchases
is one way of obtaining more IPO allocations.
Three U.S. investment banks have been sued by the SEC over allegations of IPO lad-
dering after the WSJ article, though all three later settled (without admitting guilt).3 The
allegations made by the SEC are that the banks promised investors that they would receive
an increased allocation in current hot IPOs if they bought additional shares after the listing
of the same IPOs.4 The banks, allegedly asked IPO applicants if they would be interested in
buying more shares after the listings and at what price and quantity. Since IPO laddering is
illegal, there are no formal records of tying IPO allocations to after-listing trading, as agree-
ments are likely to be made over the phone or in person rather than in a written agreement.5
It is, however, possible to see if there is a positive and consistent relationship between IPO
3See the litigation releases made by the SEC at http://www.sec.gov/litigation/litreleases/lr18385.htm,http://www.sec.gov/litigation/litreleases/lr19050.htm, and http://www.sec.gov/litigation/litreleases/lr19051.htm.
4There are many news articles and web pages that cover laddering and the ladderingcases in USA. For excellent overviews please see Deneen and Hooghuis (2001), Aggarwal etal. (2006) and the IPO securities litigation websites at http://www.iposecuritieslitigation.com/,http://www.dandodiary.com/articles/ipo-laddering-cases/ and the articles by Susan Pulliam and RandallSmith, the journalists that first published the laddering scandal in the Wall Street Journal series in 2000.http://www.pbs.org/wgbh/pages/frontline/shows/dotcon/interviews/pulliam-smith.html
5In both Norway and the U.S. IPO laddering is illegal under the law against market manipulation.

4
allocations and after-listing trading by investors. Such a relationship would strongly indicate
that IPO allocations are tied to after-listing buy trades, although this data is very hard to
obtain in the U.S. (even for the SEC and NASD). Using data from the Oslo Stock Exchange,
we are able to observe the after-listing trading of investors that were allocated shares in
IPOs. The data consists of 16,593 IPO allocations with brokerage commissions and after-
listing trading on the Oslo Stock Exchange in the period from 1993 to 2007. Stock ownership
by investor ID is observed for all companies throughout the listing process, and is used to
calculate actual IPO allocations. It is, from this data that the relationship between IPO
allocations, after-listing purchases, commissions and future IPO allocations is investigated.
The main contribution of this paper is that we show a strong and robust relationship
between the number of shares that are purchased after new listings and IPO allocations
by laddering investors. We confirm the SEC’s suspicion that IPO shares are allocated to
investors that buy shares dictated by the investment bank. We define laddering as allocated
IPO investors that continue to buy shares right after the listing before they sell all shares
within six months of the listing date. This sales requirement is included to remove rationed
investors that buy shares to reach optimal holding levels after the listing. We also show that
IPO laddering benefits both investors and investment banks and that the specified trading
can not be attributed to other explanations such as share rationing. In the 50% IPOs with
the highest laddering there is an average aggregate IPO allocation to laddering investors of
4%. On average these investors buy 6% more of the aggregate IPO shares after the listing,
and then sell on average 10% of the aggregate IPO shares shortly after the listing. As a
consequence of this, we are not able to reject that IPO allocations are tied to after-listing
purchases of IPO shares.

5
The SEC is investigating IPO laddering because laddering falsely increases the price and
demand of specific shares (price manipulation). In addition to being abusive and discrim-
inatory, IPO laddering is undesirable because it increases adverse selection problems (by
deterring non-laddering investors from applying for IPO shares).6 Investment banks use IPO
laddering because this practice will boost share prices after the listings. IPO shares that
will go up in price for sure can also be allocated to bank clients that provide high levels of
brokerage commissions, thereby ensuring a future relationship between banks and investors
that generate high levels of income for the banks. We show that investment banks and lad-
dering inventors earn money on IPO laddering, while most companies with high levels of IPO
laddering fall in price in the first six months after the listing (8 out of 11).
IPOs generally have high first day returns (on average 8% in Norway in the sample period)
and IPO shares are therefore very popular investments. Most IPOs are many times oversub-
scribed and few investors are allowed to buy IPO shares. Investment banks are reluctant to
distribute information about their allocation practices, and the continued investigation by the
SEC and the NASD on investment bank allocation practices has not made data collection any
easier. Ritter (2003) and Jenkinson and Jones (2004) argue that there are three main views
on how IPOs are allocated. First, the academic view based on Benveniste and Spindt (1989)
is that investors obtain IPO allocations in return for revealing their true valuations of the
IPO shares. These investors help to price the issue. Second, the pitchbook view argues that
IPO shares are allocated to buy-and-hold investors, and long-term buy-and-hold investors
will create price stability. Finally, the rent seeking view argues that IPOs are allocated in
6Laddering is not new. The SEC sent out warnings that laddering was illegal in 1961, 1984 and 2000(Griffi n et al., 2007).

6
return for kickbacks. The types of rent seeking that have been under SEC investigation are
to condition IPO allocations on generated brokerage commissions, future corporate business
(IPO spinning) or after-listing purchases of IPO shares (IPO laddering), see Liu and Ritter
(2010). IPOs can also be intentionally underpriced in exchange for future analyst coverage
(analyst conflict of interest). There are many articles that have studied both the academic
and pitchbook view, but a lack of data has limited the number of articles which have studied
the rent seeking view.7 Cliff and Denis (2004) show that IPO underpricing is related to
after-listing analyst coverage, Liu and Ritter (2010) reveal that IPOs are allocated in return
for IPO spinning and Fjesme, Michaely and Norli (2010) document that IPOs are allocated
in return for brokerage commissions. No empirical papers have been able to establish a
relationship between IPO allocations and after-listing purchases of IPO shares (IPO ladder-
ing). Hao (2007) identifies the incentives to engage in IPO laddering and the implications of
IPO laddering theoretically. Griffi n, Harris and Topaloglu (2007) show empirically that it is
likely that IPO laddering is used by studying aggregate after-listing trading at the brokerage
house level. Griffi n et al. (2007) find that after-listing buy trades primarily go through lead
managers, whereas after-listing sell trades go through other managers in the weeks after new
listings. This is consistent with IPO laddering because laddering investors will place their
orders through the lead manager as evidence that the trades have been made. Previous re-
search has not been able to study the relationship between IPO allocations and after-listing
trading of the IPO shares at the investor level due to data limitations.8 The main research
7See, amongst others, Jenkinson and Jones (2004), Ritter (2003) and Fjesme, Michaely and Norli (2010)for papers that summarizes studies on IPO allocations.
8Griffi n, Harris and Topaloglu (2007) find that it is very likely that investment banks tie IPO allocationsto after-listing purchases. The major difference is that Griffi n et al. (2007) study the after-listing tradingthrough co and lead managers at the brokerage house level, and we study actual IPO allocations and after-

7
question addressed in this paper is whether investors are able to increase allocations in IPOs
by committing to buy more shares after the listing of the same IPOs. We also investigate
whether future IPO allocations are tied to after-listing purchases in past IPOs.
The rest of the paper is organized as follows: Section 2 describes related literature: Section
3 describes predictions and testable implications: Section 4 describes the IPO process and
the factors that create the incentives to engage in IPO laddering: Section 5 describes the
data set: Section 6 describes the empirical results, and Section 7 concludes.
2. Related literature
There are two main theoretical papers that model IPO laddering. Hao (2007) first show
the factors that create the incentives to engage in IPO laddering. Then, the effects of IPO
laddering on companies are identified. Hao (2007) argue that IPO laddering can benefit the
underwriter from two sources. First, IPO laddering could boost the after-listing market price.
This will reduce the underwriters expected cost of price support after the listing. From this, it
is expected that IPO laddering will be stronger when there is a positive drift in the after-listing
share price. Second, IPO laddering can benefit the underwriter through rent seeking. If some
allocated investors pay a part of their profit from IPO allocations back to the underwriter
through brokerage commission payments, then a part of the laddering generated profits will
go back to the underwriter. Hao (2007) argue that when the underwriter share in on the
profit from the underpricing, laddering is stronger when the realized percentage underpricing
is higher. Hao (2007) also show that expected underpricing increases IPO laddering. More
expected underpricing contributes to a greater extent of laddering. Hao (2007) predicts that
listing trading on the investor level. Griffi n et al. (2007) show that it is likely that laddering is being used byinvestigating through what manager after-listing buy orders are placed, and we show that after-listing buyorders are related to current and future IPO allocations by investors.

8
laddering is positively related to IPO allocations to high commission generating investors.
IPO laddering will inflate prices after the listing, so investment banks use laddering to make
share prices go up after the listing (more than they otherwise would have). Shares that
go up in price can then be allocated to clients that generate high revenue for investment
banks through brokerage commissions. High brokerage commission investors sell shares after
the listing and capture the (inflated) return. Investment banks receives payment for the
allocations from inflated brokerage commission. Hao (2007) also predicts that laddering will
increase the IPO offer price, the first day closing price, the money left on the table and
long-run underperformance of the newly listed companies. Aggarwal et al. (2006) predict
that IPO laddering increases underpricing, turnover and long-run underperformance of the
newly listed companies. These are all effects of an increased demand of the IPO shares right
after the listing that will fall in the long-run.
There are three main empirical papers that provide indirect evidence of the existence
of IPO laddering. Griffi n et al. (2007) look at investors who buy shares through lead and
other underwriters in the three weeks after the listing of 1,294 Nasdaq IPOs in the period
1997 to 2002. As opposed to this study, they examine aggregate trading at the brokerage
house level. They argue that the after-listing buy trades through the lead manager (main
underwriter) in the weeks after the listings are likely to be part of laddering agreements,
while buy trades through other managers (co-underwriters that help to spread the issue) in
the same period are likely to not be part of the agreements. The paper finds that it is likely
that IPO allocations are tied to after-listing purchases (IPO laddering) because there are
unproportional high levels of buy trades through lead managers after new listings. Aggarwal
et al. (2006) study IPOs that have been sued on laddering allegations to test the implications

9
of laddering. The data includes 33 IPOs sued by the SEC, 140 class action law suits and 735
non-laddering IPOs on Nasdaq, NYSE and AMEX in the period 1998 to 2000. The main
findings are that IPO laddering leads to underpricing and long-run underperformance. Ellis
(2006) investigates the trading volume in IPO shares after the listing for 311 Nasdaq IPOs
in the period 1996 to 1997. She shows that investor buy trades through the lead underwriter
account for 22% of trading volume after IPOs, and this is consistent with laddering being
used.
There are also three other types of IPO rent seeking that have led to investigations and
subsequent settlements with the SEC or the NASD (Liu and Ritter, 2010). IPO allocations
can be dependent on future corporate business (IPO spinning), brokerage commissions or
companies can agree to underprice IPOs in exchange for after-listing company coverage from
a star analyst provided by the investment bank (analyst conflict of interest). All of these
allocation practices have been investigated in empirical papers. Liu and Ritter (2010) inves-
tigate 56 U.S. IPOs in the period 1996 to 2000 and show that IPO shares are allocated to
corporate executives in return for future corporate business (IPO spinning). Cliff and Denis
(2004) show that IPO underpricing is positively related to the after-listing coverage by the
lead underwriter and an all star analyst (analyst conflict of interest). Nimalendran, Ritter
and Zhang (2007), Reuter (2006) and Fjesme, Michaely and Norli (2010) show that IPO
allocations are related to brokerage commissions.
3. Predictions and testable implications
Griffi n et al. (2007) argue that investment banks may strategically allocate toe-holds to

10
investors that the bank knows have higher optimal holding levels (share rationing)9. The
bank does this in hopes that the investor will buy more shares after the listing to reach
the optimal holding level10. It is expected that most of these investors will reach their
determined holding level and then hold this in the longer run. Laddering investors, on the
other hand, buy shares right after the listing to fulfill an obligation. Many laddering investors
will therefore sell their shares when the agreement is completed. The argument is not that
laddering investors will always liquidate their holdings early. The argument is that investors
that buy more shares because of optimal holding are more likely to hold their shares in the
long-run. Some laddering investors are likely to hold their shares in the long-run as well, but
some laddering investors will also liquidate their shares early because they have no interest
in holding the shares. It is important to note that the intention of the after-listing buyer to
buy-and-hold does not remove the possibility of IPO laddering (Griffi n et al., 2007).11
9An IPO investor is rationed when the number of shares sought in the IPO is larger than the allocation.Rationing will lead to a smaller IPO allocation than the applied for shares for most investors. Rationedinvestors may buy more shares after the listing to get to the desired holding level. This has similar implicationsas IPO laddering. Over 50% of the investors that buy shares after the listing sell some or all of their shareswithin six months of the listing date. The SEC makes a big point about this in all their cases. The banksfrequently allocated shares to investors that had no plans of holding the shares in the long run. The banksasked the investors if they would agree to buy more shares after the listing. The banks did not ask if theinvestors were planning to hold the shares in the long run. This is then laddering. If the reason for theafter-listing purchases is to increase allocations, then this is laddering.
10Allocated IPO investors that buy more shares after new listings can be explained by either IPO ladderingor by IPO share rationing. Most of the IPO first day return takes place between the offer price and the firstday opening price (not between the first day opening and the first day close). This means that any additionalpurchased shares have an expected return commensurate with risk and nothing more. It is therefore expectedthat investors that buy more shares after the listing do so because they want to hold more of the specificstock in their portfolio. If there is laddering, there should then be a stronger relation between after-listingpurchases and allocations for short term investors. Short term investors are more likely to be ladderinginvestors than long term investors.11Griffi n et al. (2007) test between IPO laddering and optimal holding by studying how the aggregate
institutional holding percentage evolves from the listing date to the first quarter and the first year after thelisting. They argue that laddering investors are mainly institutional, so the aggregate institutional holdingpercentage should go down in companies with IPO laddering - since laddering investors will reduce theirholding percentage and optimal holding investors will not. In the Norwegian data we observe that theinvestors are allocated IPO shares buy more IPO shares after the listing and then sell shares soon after the

11
Optimal holding is also not a very good explanation for the observed after-listing buying
in Norway. Investment banks rank investors on A, B and C lists before the IPO allocations.12
We do not know how investors are placed on the lists, but we believe that it is related to
the investors’past trading characteristics. Investors on the A list are likely to be rationed
less than investors on the B list, and investors on the B list are likely to be rationed less
than investors on the C list. It is therefore expected that IPO applicants on the A list are
awarded a big allocation and will buy few shares after the listing. Investors on the C list will
be allocated few shares and will therefore buy many shares to reach their optimal holding
level. This will create a negative correlation between the number of shares allocated and the
number of shares purchased after the listing for these investors.
Hao (2007) argue that the two reasons why underwriters use laddering is to boost prices
after the listing or to increase underpricing. First, Hao (2007) argue that banks use laddering
to boost prices after the listing. Boosted prices is good for the banks because the expected
price support cost is then reduced. IPOs with boosted after-listing prices will also be viewed
as more successful. Second, Hao (2007) argue that when the underwriter share in on the
profit from the underpricing, laddering is stronger when the realized percentage underpricing
is higher. Hao (2007) also show that expected underpricing increases IPO laddering. More
expected underpricing contributes to a greater extent of laddering. (It is likely that the ex-
pected underpricing is highly related to the realized underpricing). If there is IPO laddering,
it is expected that the relationship between allocations and after-listing purchases is stronger
listing. It is more likely that investors that follow this three stage IPO share investment process are ladderinginvestors than optimal holding investors.12Information about allocation practices are obtained from meetings with former investment bankers in
Norway.

12
when the realized underpricing is higher. From Griffi n et al. (2007) and the first argument in
Hao (2007) we expect that laddering is more likely when there is a positive drift in the share
price after the listing (boosted price) and after-listing investors sell their shares soon after the
listing date. This is formalized in H0.1. From Griffi n et al. (2007) and the second argument
in Hao (2007) we expect that laddering is more likely when there is a positive underpricing
and after-listing investors sell their shares soon after the listing. This is formalized in H0.2.
H0.1: The relationship between allocations and after-listing purchases is stronger when
investors sell all shares within six months and the price after one week exceed the first day
closing price.
H0.2: The relationship between allocations and after-listing purchases is stronger when
investors sell all shares within six months of the listing and the first day closing price exceeds
the offer price.
If there is share rationing that explains the relationship between IPO allocations and
after-listing purchases, there is no reason why the relation should be stronger in IPOs where
investors sell their shares soon after the listing, the price increase in the first week after the
listing and the IPO is underpriced. This is formalized in HA.
HA: The relationship between IPO allocations and after-listing purchases is the same for
all investors.
H0 and HA are tested by regression equation (1).13 If the relationship between allocations
13D1: A dummy that takes the value of one if the investor have sold all allocated and after-listing shareswithin six months of the listing date.D2: A dummy variable that takes the value of one if there is a positive drift in the share price in the week
13
and after-listing shares is significantly stronger for (After-listing shares/shares issued)%i *
D1 * D2 * D3 than for (After-listing shares/shares issued)%i, then we are not able to reject
H0. This will, however, reject HA.
(1) (Allocated shares/shares issued )%i= α+ β(After-listing shares/shares issued)%i +
β(After-listing shares/shares issued)%i * D1 * D2 * D3 + β[Control variables] + εi
3.2 Testable implications of IPO laddering
We expect IPO laddering in both hot (popular/oversubscribed) and cold (less popular)
IPOs. The SEC sued banks for tying IPO allocations to after-listing buying in hot IPOs
(all IPOs referred to in the SEC litigation release have huge first day returns), while Griffi n
et al. (2007) find strong indications of laddering in cold IPOs. In hot IPOs, it is expected
that the investors that buy more shares after the listing will earn money because they are
allocated an increased portion of hot shares. It is possible that the investors either lose or
earn money on the extra shares (this is uncertain and can go both ways according to an e-
mail by Goldman Sachs referred to in the SEC release). It is, however, necessary that buying
more shares should be profitable overall. Money earned on the hot IPO allocations should
outweigh any loss on the additional shares. In cold IPOs, it is expected that the investors
earn money on future IPO allocations. Although investors are not enthusiastic about cold
IPOs, it is expected that investors will follow through with the laddering to not be excluded
from future IPOs, see Griffi n et al. (2007). This is tested by regressing past laddering on
future IPO allocations. We also test if laddering investors in hot IPOs earn money on their
following the listing (from the first day closing price to the first week closing price).D3: A dummy variable that takes the value of one if the IPO have a positive underpricing.

14
hot allocations and if laddering investors in cold IPOs earn money in total.
A possible reason why investment banks tie allocations to after-listing purchases is to earn
more money on brokerage commissions. Laddering investors agree to buy more shares after
the listing, so IPOs with laddering will increase more in price than IPOs with no laddering.
Investment banks can then charge a higher brokerage commissions for IPO allocations with
laddering (Hao, 2007). This will create a relation between the commissions generated before
the IPO (by the non-laddering allocated investors) and the aggregate after-listing purchases
(made by laddering investors). Commission investors are willing to pay more brokerage
commission before the IPO for shares that will increase more in price after the listing (more
IPO laddering). This is tested by regressing the IPO aggregated after-listing purchases made
by the laddering investors on the average commission generated per share before the IPO (by
the non-laddering allocated investors). These variables are highly related which shows that
banks are able to earn money on IPO laddering.
4. The listing process and the incentives to engage in IPO laddering
The Oslo Stock Exchange (OSE) requires that companies have suffi cient levels of equity
to survive for 12 months without a positive cash flow after a listing. The OSE also requires
that public companies must have a minimum number of owners (500 for the main list).14 This
means that most companies need to issue equity before they are able to list publicly. Table
1 gives the annual distribution of IPOs on the OSE in the sample period. Most companies
are assisted by an investment bank in their equity issuance and in the listing process. The
investment bank makes a list with proposed IPO allocations that is given to the board of
14The information about the listing process is obtained from the seminar “The road to the listing”No-vember 3, 2009 by Deloitte Public Accountants and the Oslo Stock Exchange and from meetings with formerinvestment bankers in Norway.

15
the issuing company for approval. Anecdotal evidence suggests that this list typically is
approved without adjustments. Investment banks and investors have different reasons for
why they participate in IPO laddering. Regulators investigate IPO laddering because it is
manipulative. Figure 1 describes the incentives to engage in IPO laddering for the different
market participants.
4.1 Investment banks
IPO laddering can be advantageous for investment banks in both hot and cold IPOs.
There are two main reasons why investment banks use IPO laddering in hot IPOs. Firstly,
investment banks can earn money on combining allocations to investors that generate high
brokerage commission and to laddering investors. IPO laddering will boost prices after the
listing. The IPO allocations will then be valued higher by investors that are willing to pay
brokerage commissions to obtain allocations (Hao, 2007; Aggarwal et al., 2006). In related
papers, Reuter (2006), Nimalendran et al. (2006) and Fjesme, Michaely and Norli (2010)
show that brokerage commissions are related to IPO allocations. Secondly, IPO laddering
will ensure that prices will be higher (than they otherwise would have been) after the listing.
This will give the companies more attention as successful IPOs (Hao, 2007; Aggarwal et al.,
2006; Griffi n et al., 2007). Laddering can also be beneficial for investment banks in cold IPOs.
IPO laddering will reduce the after-listing price uncertainty in cold IPOs. This is good for
investment banks because IPOs that fall in price may cause reputation damage (and price
support if used without over allotment options is potentially expensive) (Hao, 2007; Aggarwal
et al., 2006; Griffi n et al., 2007). Investment banks use IPO laddering to earn more money on
brokerage commissions, to increase the likelihood of successful IPOs and to reduce the risk
16
of after-listing price falls.15 The after-listing purchases will also increase direct commission
from the extra trades. According to Griffi n et al. (2007), it is uncertain whether laddering
is more beneficial for the investment banks in hot or cold IPOs.16
4.2 Laddering investors
Investors agree to buy more shares after cold IPOs to get future allocations in hot IPOs.
Investors are not likely to be enthusiastic about laddering in cold IPOs, but investors who
want continued access to future hot IPO allocations are likely to follow through with the
agreements (Griffi n et al., 2007). In hot IPOs, investors accept laddering in order to get more
allocations in the specific IPOs. The committed laddering will increase hot IPO allocations
and the dollar return made by the investor. Laddering investors may either earn or lose
money on the extra shares purchased after the listing, but it is expected that the return of
the hot allocated shares will outweigh any loss on the additional shares. This is described in
an e-mail from a Goldman Sachs representative to an investor published in the SEC litigation
release.17 Investment banks do not require laddering by all investors. Griffi n et al. (2007)
argue that laddering is pre arranged buying support by large institutional clients. It is easier
to control that the shares are purchased when there are only a few investors involved.
4.3 Commission investors
These investors increase their trading in other shares to generate higher levels of broker-
age commissions. This commission is payment for IPO allocations. The investment bank
15It is probably more common that bidders will offer laddering than that banks require laddering. Investorswill offer laddering if they believe that this will increase allocations and lead to future allocations. Hao (2007)argues that it does not matter for the effect of laddering if it is bidder or investment bank initiated.16Laddering in cold IPOs creates a relation between after-listing purchases and future allocations (not
necessarily between allocations and after-listing purchases). Laddering in hot IPOs will create a relationbetween allocations and after-listing purchases in specific IPOs.17See the litigation releases made by the SEC at http://www.sec.gov/litigation/litreleases/lr18385.htm,
http://www.sec.gov/litigation/litreleases/lr19050.htm, and http://www.sec.gov/litigation/litreleases/lr19051.htm.

17
get an increased revenue from brokerage commissions, and the investors get an increased
revenue from IPO allocations, see Hao (2007). Fjesme, Michaely and Norli (2010) show that
IPOs are allocated to the investors that generate the most brokerage commission through
trading in other shares. Allocated investors can sell their shares after the listing and cash in
on the short run profit from hot allocations. As long as this short run profit is above any
additional generated brokerage commission the investors are earning money. It is possible
that banks direct IPO allocations to investors that generate high levels of brokerage commis-
sions. Investors that generate high levels of brokerage commissions also have an incentive to
direct their commission to certain investment banks in order to receive more future hot IPO
allocations.
4.4 Regulators (why IPO laddering is a problem)
The reason why the SEC is investigating the investment banks is because IPO laddering
violates both anti-price-manipulation and anti-fraud regulations. Laddering falsely increases
price and demand in specific shares, and investors that are not aware of the IPO laddering are
buying shares on false market demand information. Regulators (the SEC) try to ensure that
the IPO allocation process and the IPO market are fair and open to all investors, and abusive
allocation practices are not tolerated. Laddering is a problem because it is discriminatory
against investors that are not willing to engage in price manipulation to receive IPO shares.
In a fair IPO with high demand, the offer price will increase and more money will go to
the issuing company. In an IPO with laddering, the price will go up after the listing and
more money will go to the allocated investors. Laddering is not new in the U.S. The SEC
sent out warnings that IPO laddering was illegal in 1961, 1984 and again in 2001 (Griffi n
et al., 2007). Other investors can also lose money on IPO laddering. The investors that

18
are allocated less (or no) IPO shares because the laddering investors are allocated more hot
shares are losing. Non-allocated investors that buy shares after the listing lose money if the
laddering investors sell their shares so that prices fall after the listing. IPO laddering will
also increase adverse selection problems. When investors know that it is possible to buy
allocations with after-listing trading, it is not likely that investors will participate in IPOs
without providing anything in return. Investors that do not provide any form of kickback
will not want to participate in IPOs because they expect shares to be overpriced whenever
they are offered allocations.
The allegation made by the SEC is that certain banks have promised investors that they
will get favorable IPO allocations if they buy additional shares after the listing of the same
IPO.18 The banks have, allegedly, asked IPO share applicants if they would be interested
in buying more shares after the listings and at what prices and quantities. The banks have
also allocated shares to investors with after-listing interest -investors the banks knew were
likely to sell their shares soon after the listing (laddering investors). The banks have made
follow up calls to investors that indicated after-listing interest to make sure the purchases
are made. Arguably, the only reason investors have provided after-listing interest is because
the investors understand that this will help them get favorable IPO allocations. Banks
and investors have agreed that investors will buy after-listing shares proportional to the
18Three U.S. Investment banks that have been sued and later settled with the SEC on IPO ladderingallegations. None of the banks have admitted to the laddering charges, but all banks have agreed to paypenalties of $40 million (Morgan Stanley), $40 million (Goldman Sachs) and $25 million (J.P. Morgan).The charge by the SEC is that the banks have violated Rule 101 of Regulation M under the Securities andExchange Act of 1934. This rule is, among other things, in place to prohibit underwriters in a restrictedperiod, prior to their completion of the distribution of the IPO shares, from bidding for or attempting toinduce any person to bid for or purchase any offered security in the aftermarket. Regulation M is designedto prohibit activities that can artificially influence the market and the perceived demand of the IPO shares.

19
allocations they receive.19
5. Data description
There are 403 new listings on the Oslo Stock Exchange (OSE) in the period January
1993 to September 2007 (195 of the 403 companies listed through IPOs)20. New listings are
identified from the annual statistics published by the OSE. Allocation dates are collected from
the IPO listing prospectuses. One listing requirement on the OSE is that all shareholders
must be registered in the Norwegian Central Depository (VPS) before the listing. The
number of shares owned by each investor must be given to the VPS before any company can
list publicly. This database is 100% accurate, as it is not possible to list otherwise. The
VPS database includes month end ownership by all shareholders in all companies that are
publicly listed or intend to list publicly. Some companies list in the VPS database years
before the listing, and other companies list in the VPS as part of the listing process. See
Figure 3 for a detailed description of the timeline in the listing process. IPO allocations are
obtained from the VPS database by taking the difference in company ownership before and
after IPO allocation dates. We only investigate IPO allocations to new shareholders. More
allocations to existing shareholders (if any) are not included in the analysis. All companies
list in the VPS, sell shares in the IPO and list on the OSE. To determine IPO allocations,
there are three dates that are important in the listing process: -when companies list in the
VPS ownership database, when companies distribute shares in the IPO and when companies
19In addition to these allegations, the NASD claims that J.P. Morgan tied cold IPO allocations to hot IPOallocations and that J.P. Morgan allocated hot IPO shares to investors in the return for accepting cold IPOallocations. This is also part of the J.P. Morgan settlement. Hao (2007) explains that IPO order books oftenhave investors that are marked with the number of shares that will be purchased after the listing.20In total 15 savings banks listed on the PCC list of the OSE are removed from the analysis. Most of the
PCC companies are listed as privatizations by the Norwegian bank guarantee fund. When including the PCCcompanies the findings remain unchanged.

20
list on the OSE. All three dates influence data on IPO allocations. Companies do this process
in different orders, and this leads to different levels of the obtained IPO allocations.
5.1 The IPO sample
When the listing in the VPS database, the IPO allocation and the listing on the OSE are in
separate calendar months we are able to calculate exact IPO allocations (the ownership data
is in monthly observations). Group one companies list in the VPS in good time before the
IPO. These companies also list on the OSE in a separate calendar month from the IPO (for
most companies, the IPO is in the calendar month right before the listing month). For these
companies the IPO allocations are completely accurate. There are 16,593 IPO allocations in
group one companies (23 IPOs). After-listing purchases are the increase in the number of
shares by the allocated investors from the IPO allocation to the end of the listing month (and
to the end of the month after the listing). Shares sold over the counter (OTC trading) in the
period between the allocation day and the end of the allocation month will not be detected in
the data. Investors that buy shares in the OTC market between the allocation day and the
end of the allocation month will be treated as allocated investors. OTC trading is, however,
expected to be a very small issue. It is unlikely that many investors that have been allocated
IPO shares will sell these shares in the weeks before the listing. The average number of days
between payment date in the IPO (when shares are transferred) and the listing date is just
below 14 days (two weeks).21
5.2 The remaining IPOs
21The reason why we have exact IPO allocations for these companies is because they sell shares in theIPO in the end of a month. The companies list early in the next month. Because the events are in separatecalendar months we can identify who has been allocated shares in the IPO. It is very unlikely that investorsthat are allocated IPO shares will sell these shares in the two week window before they can realize theexpected high first day returns.

21
The data set also includes 158,789 IPO allocations (148 IPOs) that are used in robustness
tests.22 The allocations in these IPOs include either some existing owners or some after-listing
trading. Group two companies list in the VPS in good time before the IPO, but they list on
the OSE in the same calendar month as the IPO allocation month. These companies have
allocations that include the actual IPO allocations and some after-listing trading. These IPO
allocations includes from one to 30 days of after-listing trading. The companies in group two
are used to test the relationship between past and future after-listing IPO holdings.
5.3. Aggregate laddering
There are 317 investors who sell all allocated and all after-listing shares within six months
of the listing date in IPOs with a positive underpricing (in the 50% IPOs with the highest
laddering). The aggregate allocations to these investors is 4% of the IPO shares. They buy
in aggregate 6% of the IPO shares after the listing. Within six months they have sold all IPO
shares (in aggregate 10% of the IPO shares). There are 174 investors who sell all allocated
and all after-listing shares within six months of the listing date in IPOs that appreciate
in price in the week after the listing (in the 50% IPOs with the highest laddering). The
aggregate allocations to these investors is 5% of the IPO shares. They buy in aggregate 8%
of the IPO shares after the listing. Within six months they have sold all IPO shares (in
aggregate 13% of the IPO shares).
5.4 Variable explanations
IPO level characteristics are given in Table 2. Market value is the total market value
22The reason it is 148 IPOs and not 172 (195-23=172) is because in 15 IPOs it has not been possible tocalculate IPO allocations from the ownership data. These companies are listed in the VPS in the same monthas the listing month. These companies are therefore removed from the sample. In 6 IPOs it has not beenpossible to locate the pricing information. These IPOs are therefore not included in the analysis. There arethree privatizations in the period that are removed.

22
(in USD) at the listing date of the IPO company. This is calculated as the number of
outstanding shares times the first day closing price. BV/MV is the book to market ratio of
the IPO company at the listing date. This is calculated as the book value of equity, after
the IPO, divided by the market value. Offer price is the IPO offer price (in USD) reported
in the listing prospectus or in the newspapers. VC dummy is a dummy variable that takes
the value of one for companies with venture capital backing, and Tech dummy is a dummy
variable that takes the value of one for IT -companies. The IPO company variables are used
to control that the results are not driven by company specific characteristics. Market value
and the book to market ratio are included in the regressions to make sure that company size
is not driving the results. Offer price is included to make sure that it is not very high or low
priced IPOs that drive the results. The VC dummy and the high-tech dummy are included
to make sure that the results are not driven by venture capital backing or high technology
companies. All regressions include IPO and year fixed effects. These are dummy variables
that take the value of one for each of the companies and sample years.
Investor characteristics, for the investors on the OSE in the period 1993 to 2007, are
described in Table 3. (After-listing shares/shares issued) % is the additional shares purchased
after the listing divided by the total number of shares issued in the IPO.23 The after-listing
shares are calculated as the share increase from the IPO allocation to the end of the listing
month for the 23 sample IPOs. (We also include the share increase to the end of the month
23The number of shares sold in the IPO is the number of actual shares sold to new shareholders from theVPS database. In the listing prospectuses the number of shares sold is often listed as a range. E.g. in theAqua Bio IPO the listing prospectus says that the number of shares sold will be between 1.2 million and 4million shares. It is also uncertain if Over Allotment Options (OAO) is used or not. This may increase thenumber of shares sold from the listing prospectus to actual shares sold up to 20%. E.g. in the Nutri PharmaIPO the minimum number of shares sold is 10 million. The lead manager is given 2 million extra shares inan OAO. From the prospectus it is impossible to know the exact number of shares that will actually be sold.This number is observable in the VPS database.

23
after the listing because some companies list late in the month and IPO laddering may go
on as long as three weeks after the listing, see Griffi n et al., 2007). For the remaining IPOs,
the share increase is measured from the end of the listing month to the end of the month
after the listing. This is likely to underestimate the after-listing purchases in the IPOs used
for robustness. D1 is a dummy variable that takes the value of one if the investor have sold
all allocated and after-listing shares within six months of the listing date. D2 is a dummy
variable that takes the value of one if there is a positive drift in the share price in the week
following the listing (from the first day closing price to the first week closing price). D3
is a dummy variable that takes the value of one if the IPO have a positive underpricing.
(Allocated shares/shares issued) % is allocated shares to each investor divided by the total
number of shares issued in the IPO.24 This is the percentage allocation of shares given to
each investor in each IPO. Previous laddering is the accumulated number of times an investor
has laddered divided by the accumulated number of times the investor has participated in
IPOs. This is a measure of how frequently an investor engages in laddering, relative to its
total participations in IPOs.25
Commission is the accumulated commission (in USD) generated by each investor in the
two years before the IPO allocation dates.26 Commission is calculated as the monthly portfo-
lio turnover times share prices and a fixed percentage commission rate (0.075%). The 0.075%
commission rate is the average used by 15 Norwegian brokerage houses. Commission is cal-
24(Allocated shares/shares issued) % is trimmed at 1% at the total 171 IPO level to remove the highestIPO allocations. These allocations are not likely to be made to investors based on trading characteristics.This is included to be consistent with Fjesme, Michaely and Norli (2010). This trimming has no influenceon the findings in this article.25An investor that has participated in one IPO and bought more shares after the listing and then sold
shares will take the value of 1 (1/1). An investor that has participated in two IPOs and bought and soldmore shares after the listing in one of these IPOs will take the value of 0.5 (1/2).26Commissions are generated from monthly data and not daily data.

24
culated as buy generated commission only. Generated commission below the minimum rate
is replaced by the fixed minimum fee for one transaction ($15). Portfolio value is the total
investor portfolio value (in million USD) for each allocated investor at 31.12.xx in the year
before the IPO allocation date. This is calculated as the shares held at 31.12.xx times the
appropriate share prices. Financial institution dummy is a dummy variable that takes the
value of one for investors that are either Norwegian or foreign financial institutions.
Previous IPOs is the accumulated previous IPO participations by the investors divided by
the accumulated number of IPOs in the sample.27 This is used to measure how many IPOs,
out of all possible in the sample, each investor has participated in. Previous buy-and-hold is
the accumulated previous number of times the allocated investor has been a buy-and-hold
investor divided by all previous IPO participations. This is the number of times, out of all
previous IPO participations, the investor has held some of the IPO allocated shares for more
than six months after the listing. Previous flipping is the accumulated number of times the
investor has flipped previous IPOs divided by all previous IPO participations. Flipping is
when all shares are sold within one month after a listing. This is the number of times, out of
all previous IPO participations, the investor has held all IPO allocated shares for less than
one month. The previous trading variables are used to control that the results are not driven
27Many IPOs are underwritten by more than one investment bank. If there is more than one investmentbank involved in the IPO, the bank that appears on the top left of the front page of the listing prospectus isassumed to be the lead investment bank. Carter and Manaster (1990) use the investment bank that appearstop left on the tombstone as the lead investment bank. In most IPOs there are also co-managers that helpwith spreading the shares. Co-managers will allocate shares to their own clients. Investment banks can beco-managers in many IPOs, and this creates the situation where investors can be allocated shares as a rewardin an IPO by another lead bank. There are also some mergers between investment banks in the period andthis will also create the situation where award shares can come from other lead banks. Because of this, weinvestigate past trading behavior in all past IPOs in relation to current IPO allocations. We also study IPOsby one single bank separately. When this is done, we only investigate past trading in the IPOs where theone bank has been the lead.
25
by investor size, trading activity or holding periods.
Other control variables includes the Percentage change in pricing range that is the change
from the midpoint in the pricing range to the offer price in book-building IPOs. This variable
measures price information collected in the book-building period, see Ljungqvist andWilhelm
(2002). Number of sentiment investors is the number of allocated retail investors that buy
less than 1,000 shares in the IPO. We use this as our sentiment measure as we believe that
small retail investors are more sentiment driven in their IPO applications as they spend less
time on fundamental analysis, see Kumar and Lee (2006). Average commission per share is
calculated as the total commission generated by non-after-listing purchasing investors in the
24 month period before the IPO divided by the number of shares allocated in the IPO. This
is the average dollar generated commission per share before the allocation (by non-laddering
investors). Combined commission % is calculated as the commission generated by all the
allocated investors in the 24 month period before each IPO divided by the accumulated
commission generated by all the allocated IPO investors in the 24 month period before
all IPOs. This variable measures how important commissions are for allocations in each
specific IPO, and this variable is used to measure if there is a relationship between the
total commission generated before an IPO (by the allocated investors) and the aggregate
after-listing purchases in the IPO.
We do not know the exact oversubscription numbers in each IPO. Normally, oversub-
scription numbers are used to define if IPOs are hot (popular/oversubscribed) or cold (less
popular/undersubscribed). We proxy for hot/cold by a dummy that takes the value of zero if
there is negative first day return (cold) and one otherwise (hot). We expect that underpriced
IPOs are hot and non-underpriced IPOs are cold.

26
6. Empirical results
From Table 4 it can be seen that there is a relationship between IPO allocations and
after-listing purchases (regression 1). This relationship is significantly stronger for investors
who sell their shares soon after the listing (regression 2). The relationship is also significantly
stronger for investors that sell all shares soon after the listing in IPOs with a positive drift in
the share price in the week after the listing (regression 3). This is consistent with H0.1. The
relationship is also significantly stronger when investors sell shares soon after the listing and
the IPO have a positive realized underpricing (regression 4). This is consistent with H0.2.
The relationship between allocations and after-listing purchases is also significantly stronger
for investors that sell all shares soon after the listing, in IPOs with a positive underpricing,
and in IPOs with a positive drift in the share price after the listing (regression 5). The point
estimate for the allocation and after-listing purchase relationship is typically two to five times
as large for the cases where H0 specify that the relationship should be stronger.
The results are also economically significant. The coeffi cient between allocation and after-
listing purchases is 0.25. This means that for each 1% of the issues that is allocated these
investors buy 4% more after the listing, controlling for all other variables. The average
number of shares purchased after the listing is close to 7,000 shares for the 427 laddering
investors. This indicates that the allocation rule is that investors who commit to buy 7,000
shares after the listing are allocated close to 2,000 more shares in the IPOs.
The results are robust to how many shares and how early the shares must be sold for
investors to be regarded as laddering investors. The results remain unchanged when investors
who have sold 50% of their shares within three months of the listing date are regarded as
potential laddering investors. The relationship between IPO allocations and after-listing

27
purchases is significantly stronger for investors that sell 50% of total shares within three
months after the listing, in IPOs with a positive underpricing, and in IPOs with a positive
drift in the share price after the listing than for other investors (regression 6). The relationship
is also significantly stronger for investors that sell 50% of total shares within six months after
the listing, in IPOs with a positive underpricing, and in IPOs with a positive drift in the
share price after the listing (regression 7). This is consistent with H.0.28 Most of the control
variables are unrelated to the level of allocations. Generated brokerage commissions are
positively related to allocations. This indicates that laddering investors are active investors.
To make sure that the results are not driven by the other allocations views suggested by
Ritter (2003) and Jenkinson and Jones (2004) we control for these views in all regressions. To
control for the pricing information view (the academic view) we include a dummy variable
that takes the value of one for all professional investors (financial institution dummy). If
there is allocation to buy-and-hold type investors, there will be a relation between holding
periods and IPO allocations (buy-and-hold view). This is controlled for by including the
past IPO holding period of the allocated investors in all regressions (past buy-and-hold and
past flipping). Neither of these variables are consistently related to allocations. It is also
possible that allocations are made to commission generating investors only (rent seeking
view). This view is controlled for, and ruled out by including the portfolio value and the
generated commission before the IPOs by the allocated investors in the regressions.29
28In these regressions, both allocated shares and aftermarket shares are scaled by the number of sharesissued in the IPOs. There are very different numbers of shares sold in each IPO. Capital raised depends onboth the number of shares and on the offer price in the IPO. The numbers we are interested in are thereforeallocated shares and aftermarket shares in percent of issued shares. This tests the relationship regardlessof the number of shares issued in the IPO. We also regress allocated shares on aftermarket shares directlywithout adjusting for issued shares in all regressions. This does not alter the findings. There are some changesto significance levels and adjusted R —squares, but the results remain the same (not reported).29We are not able to control for IPO spinning. IPO spinning is when IPO shares are allocated to company

28
In Table 5 the relation between past IPO laddering and future ownership of IPO shares
is investigated more closely. If there is IPO laddering, it is expected that investors may
be rewarded with allocations in future IPOs as well. Testing the relation between past
laddering and future allocations is harder in the 23 IPO sample because there may be some
time between each observed IPO. This is therefore tested on the full sample that includes
after-listing trading. Here we test whether investors that buy more (and then sell) shares
after the listing of IPOs also hold shares after the listing of future IPOs. In Table 5 all
171 IPOs (with 175,382 IPO allocations) are investigated. Most of these IPOs are of group
2 allocations. This means that the IPO allocations may be overestimated and the after-
listing purchases may be underestimated in these IPOs.30 Therefore, we are not studying
allocations. Rather, this table investigates whether past after-listing buying leads to future
after-listing holding of IPO shares.
In Table 5 we regress after-listing holdings of IPO shares on the number of times in the
past (out of all IPO participations) allocated investors have bought (and then sold) more
shares after IPOs. There is a strong relation between past IPO laddering and shares held
after future IPOs. This indicates that banks tie IPO allocations together. This indicates
that IPO shares are also rewards for past laddering in IPOs.31 There is a consistent negative
executives for future corporate business. Spinning will not generate the same implications as IPO laddering,so we argue that this is not a problem.30These shares are still purchased by the investors. Aftermarket purchases for group two IPO allocations
are calculated as the share increase from the end of the listing month to the end of the month after thelisting. This means that all of these investors have an increase in the IPO shares in this period. All ofthese investors are buying shares after the listing of IPOs. These investors also hold significantly more IPOshares in subsequent IPOs. Table 5 shows that investors who hold shares after the listing of IPOs, beforethey buy more shares in the following month, also hold more shares of future IPOs. This is consistent withthe laddering story. We cannot show that IPO allocated investors who buy more shares after a listing areallocated more hot IPO shares, but we show that investors who buy more (and then sell) shares after thelisting of an IPO have more IPO shares in their future portfolios.31Past aftermarket buying is less statistically and economically related to IPO allocations in the 20 IPOs
by the least active investment banks (not reported). The tie-in agreement variables are highly related to IPO

29
relationship between past buy-and-hold and IPO allocations. Investors are not allocated
shares because they repeatedly hold their shares in the long-run. Investors are, however,
punished for flipping shares in the past. Flipping investors are kept out of future hot IPOs.
These findings also show that the investment banks keep records of how investors trade in
IPOs. The banks use these records in their future IPO allocations. This is consistent with
the SEC releases where it is claimed that banks track investor trading and use this in their
future allocation decisions.
In Table 6 we show that investors are able to earn a profit from IPO laddering. For
allocated shares, monetary return is calculated as the number of allocated IPO shares times
the first day and first month return. For shares purchased after the listing, monetary return is
calculated as after-listing shares times the first month return. It is clear that the profit earned
from hot IPO allocations outweighs any loss from the after-listing purchases. Table 6A show
that the average return made by the 357 investors who ladder in IPOs with a positive realized
underpricing have a positive return overall. This is also true for the 195 investors who ladder
in IPOs with a positive drift after the listing (Table 6B). The 70 investors (427 laddering
investors - 357 laddering investors in hot IPOs) that ladder in cold IPOs are earning a profit
in their overall IPO participation. This indicates that these investors are rewarded in future
IPOs for their cold IPO laddering (Table 6C). The 23 IPO sample is also split into high and
low laddering IPOs based on the 427 investors who sell all shares within six months of the
allocations in the IPOs by the most active investment bank (not reported). The results indicate that activeIPO investment banks are able to use tie-in agreements. The reason why investors go through with the tie-inagreements, and buy more shares after the listing, is to avoid being blacklisted in future IPOs. An activeinvestment bank will have a more reliable threat than less active banks. There is no relationship between IPOallocations and aftermarket purchases by Norwegian government investors. This is also as expected. Thefindings are consistent with Pulliam and Smith (2000), Ritter (2003), Aggarwal et al. (2006), Hao (2007)and Griffi n et al. (2007).

30
listing. Non-allocated investors that buy shares after the listing in the high laddering IPOs
are losing money on average (Table 6D). This is not true in the IPOs with low laddering
(Table 6E). This shows that IPO laddering is profitable for the investors. However, IPO
laddering is very bad for non-allocated IPO investors that buy shares after the listing.
In Table 7 we show that there is a positive relationship between aggregate after-listing
buying in each IPO (by the investors who sell all shares within six months of the listing)
and the average commission generated by other allocated investors before the IPO. This is
an important condition for IPO laddering to take place. A main reason why an investment
bank would engage in IPO laddering is to increase revenue by sharing in on the money left
on the table. Investment banks bundle IPO shares to laddering investors and commission
investors, and thus create a positive relation between after-listing buying and commissions
generated by the allocated investors before the IPO. Laddering investors increase prices after
the listing, and commission investors pay more commission for shares that will increase in
price for sure. The investment banks earns more money from brokerage commissions in the
IPOs where there are more shares purchased after the listing. The data is consistent with
that investment banks bundle IPO allocations to high brokerage commission investors and
laddering investors.
6.2 Optimal holdings
We reject the hypotheses that the relation between IPO allocations and after-listing buy-
ing is driven by optimal holding of shares. There is a stronger relationship between IPO
allocations and after-listing purchases for investors that sell all shares soon after the listing,
in IPOs with a positive underpricing, and in IPOs with a positive drift in the share price
after the listing. There is also no relationship between IPO allocations and past buy-and-

31
hold. Investment banks do not allocate shares to investors because they are expected to be
buy-and-hold (based on past trading). Therefore, the after-listing purchases are not simply
a result of investors trying to reach their optimal holding levels. We reject HA.
6.3 The effect of IPO laddering
We find indications that laddering is affecting company long-run returns negatively after
the listing (not reported).32 The 11 companies with high levels of IPO laddering have a neg-
ative price evolvement in the time after the listing on average. Non-allocated IPO investors
who buy shares in this period are losing money on average. This is consistent with both
Hao (2007) and Aggarwal et al. (2006). When comparing long-run returns of IPOs with
laddering to a one for one matching listed firm, the underperformance results are very weak
with zero or very low explanatory power. The matching firm technique is also biased towards
finding long-run underperformance, see Eckbo, Masulis and Norli (2008). We are not able
to conclude that high levels of laddering leads to low long-run performance, but the results
indicate that laddering is negatively related to long-run performance.
6.4 Robustness and aggregate IPO laddering
The results are robust to including all PCC (savings banks) and trimming IPO allocations
at 0.1% (Table 8). The results are also robust to removing all company specific control
variables (Table 9). Table 10 show that IPO laddering involves an economically significant
amount of IPO shares. On average investors are allocated 4% of IPO shares, they buy 6%
32Long run performance is calculated as the (IPO company holding period return / matching companyholding period return) (Ritter, 1991). This long run return measure is regressed on the aggregate level ofaftermarket share buying and a set of control variables. Companies are matched on market values and bookto market ratios, see Eckbo and Norli (2005). All matching companies with a market value within 30% ofeach IPO company are grouped together. Only companies that have been listed for more than five years areincluded as matching companies. The company with the book to market ratio that is closest to the IPOcompany is used as the matching company. A delisted matching company is replaced by the company withthe second closest book to market ratio for the remaining years etc.

32
more shares, and then they sell 10% of the IPO shares (in the 50% IPOs with the highest
IPO laddering).
7. Conclusion
There is a stronger relationship between IPO allocations and after-listing purchases when
investors sell shares soon after the listing, the IPO have a positive realized underpricing and
there is a positive drift in the share price after the listing. This finding is not consistent
with HA and this hypothesis is therefore rejected. We reject that the relationship between
IPO allocations and after-listing purchases is driven by share rationing only. This finding is,
however, consistent with H0. We are not able to reject that the relationship between IPO
allocations and after-listing purchases is driven by IPO laddering. The evidence support IPO
laddering.
We find that laddering investors who buy more shares after the listing are also allocated
more shares in IPOs. This controls for the commissions generated by the investors, portfo-
lio value, investor type, past trading characteristics and company specific variables. These
investors also sell their shares shortly after the listing and earn a high profit from their IPO
participation, which is consistent with IPO laddering. The investors that buy the most shares
after the listing are also allocated the most shares. These investors are not expected to hold
the shares based on past trading characteristics. There is also a positive relationship between
the number of times investors have used laddering after the listing in previous IPOs and after-
listing ownership of future IPO shares. There is no relationship between past buy-and-hold
and future IPO share ownership, -further indicating that this is IPO laddering. Laddering
gives more shares in specific IPOs and more shares in future hot IPOs. The aggregate ladder-

33
ing in IPOs is also positively related to the average commission generated by the allocated
investors before the IPOs, thus demonstrating that there is more laddering when there are
more shares allocated to investors that generate high levels of brokerage commissions. In-
vestment banks seems to be able to earn money on IPO laddering by combining allocations
to after-listing investors and high commission investors. The evidence is consistent with IPO
laddering. We are not able to reject that IPO laddering is being used.
There are many implications of this finding. The main practical implication is that
investors who are not aware of IPO laddering lose money on trading in IPO shares in com-
parison to more informed investors. IPO laddering is also likely to increase adverse selection
problems as many investors are likely to stay away from the IPO market when they know
they must provide kickbacks to acquire the good allocations. In the U.S. there has been a
large-scale investigation of IPO allocation practices, and this study shows that more coun-
tries should probably start their own investigations as well. A main theoretical implication
of this finding is that IPO allocation practices should probably be explained more from a
rent seeking perspective since most theoretical papers explain IPO allocations from a pricing
information or buy-and-hold perspective.
There are some limitations to this study. With regard to the generated brokerage commis-
sions, we cannot see that a commission is paid from the allocated investor to the investment
bank, and can only observe that the commission has been generated. We also calculate com-
missions based on monthly data, and this is likely to underestimate commissions. The study
does not conduct and in-depth investigation of long-run performance (as we only observe a
limited number of companies), and we also do not know the oversubscription numbers of the
IPOs. This is proxied for by using the actual first day return as the oversubscription hot/cold

34
IPO dummy. Nevertheless, we do expect this dummy to be very accurate. In terms of future
research, it would be very interesting to investigate a sample which included the actual IPO
laddering agreements in writing.
35
References
[1] Aggarwal, Rajesh K., Amiyatosh K. Purnanandam and Guojun Wu, 2006, Underwriter
Manipulation in Initial Public Offerings. Working paper. University of Virginia and
University of Michigan.
[2] Benveniste, Lawrence and Paul Spindt, 1989, How investment banks determine the offer
price and allocation of new issues, Journal of Financial Economics 24, 343-362.
[3] Carter, Richard B. and Steven Manaster, 1990, Initial Public Offerings and the under-
writer reputation, Journal of Finance 45, 1045-1067.
[4] Cliff, Michael T. and David J. Denis, 2004, Do Initial Public Offering Firms Purchase
Analyst Coverage with Underpricing?, Journal of Finance 6, 2871-2901.
[5] Deneen, M., and J. Hooghuis, 2001, Tidal Wave of IPO ‘Laddering Litigation’Swamps
D&O Market, The Plus Journal 9.
[6] Eckbo, Espen B. and Øyvind Norli, 2005, Liquidity risk, leverage and long-run IPO
returns, Journal of Corporate Finance 11, 1-35.
[7] Eckbo, Espen B., RonaldW. Masulis and Øyvind Norli, 2000, Seasoned Public Offerings:
resolution of the ’new issues puzzle’, Journal of Financial Economics 56, 251-291.
[8] Ellis, Katrina, Roni Michaely and Maureen O’Hara, 2000, When the Underwriter Is the
Market Maker: An Examination of Trading in the IPO Aftermarket, Journal of Finance
3, 1039-1074.

36
[9] Ellis, Katrina, 2006, Who trades IPOs? A close look at the first days of trading, Journal
of Financial Economics 79, 339-363.
[10] Fjesme, Sturla Lyngnes, Roni Michaely and Øyvind Norli 2010, Using Brokerage Com-
missions to Secure IPO allocations, Working paper, Norwegian School of Management
(BI).
[11] Griffi n, John M., Jeffrey H. Harris and Selim Topaloglu, 2007, Why are IPO investors
net buyers through lead underwriters?, Journal of Financial Economics 85, 518-55.
[12] Hao, Qing (Grace), 2007, Laddering in initial public offerings, Journal of Financial
Economics 85, 102-122.
[13] Jenkinson, Tim, and Howard Jones, 2004, Bids and Allocations in European IPO Book-
building, Journal of Finance 5, 2309-2338.
[14] Kecskes, Ambrus, Roni Michaely and Kent Womack, 2010, What drives the Value of
Analysts Recommendations: Earnings Estimates or Discount Rate Estimates?, Working
paper Cornell University.
[15] Kumar, Alok and Charles M.C. Lee, 2006, Retail Investor Sentiment and Return Co-
movements, Journal of Finance 5, 2451-2486.
[16] Liu Xiaoding and Jay. R. Ritter, 2010, The Economic Consequences of IPO Spinning,
Review of Financial Studies 5, 2024-2059.
[17] Ljungqvist, Alexander P. andWilliam J. Wilhelm, 2002, IPO allocations: discriminatory
or discretionary?, Journal of Financial Economics 65,167-201.

37
[18] Loughran, Tim and Jay R. Ritter, 1995, The New Issues Puzzle, Journal of Finance 1,
23-51.
[19] Loughran, Tim and Jay R. Ritter, 2004, Why has IPO underpricing changes over time?,
Financial Management 33, 5-37.
[20] Megginson, Willian and Kathleen Weiss, 1991, Venture capitalists certification in initial
public offerings, Journal of Finance 46, 879-904.
[21] Michaely, Roni and Wayne H. Shaw, 1995, The Choice of Going Public: Spin-offs vs.
Carve-Outs, Financial Management 24, 5-21.
[22] Nimalendran, M, Jay Ritter, and Donghang Zhang, 2007, Do today’s trades affect to-
morrows IPO allocations? Journal of Financial Economics 84, 87-109.
[23] Pulliam, Susan and Randall Smith, 2000, Trade-offs: Seeking IPO Shares, Investors
Offer to Buy More in the After Market, The Wall Street Journal December12, 2000.
[24] Pulliam, Susan and Randall Smith, 2000B, Linux Deal is focus of IPO-Commission
Probe, The Wall Street Journal, December 12, 2000.
[25] Reuter, Jonathan, 2006, Are IPO allocations for sale? Evidence from Mutual Funds,
Journal of Finance 5, 2289-2324.
[26] Ritter, Jay R.,1984, The ‘hot issue’market of 1980, journal of Business 32, 215-240.
[27] ____, 1987, The cost of going public, Journal of Financial Economics 19, 269-281.
[28] ____, 1991, The long run performance of Initial Public Offerings, Journal of Finance
46, 3-27.

38
[29] ____, 2003, Differences between European and American IPO markets, European
Financial Management 4, 421-434.
[30] Rogers, W. H.,1993, Regression standard errors in clustered samples, Stata Technical
Bulletin 13, 19-23. Reprinted in Stata Technical Bulletin Reprints 3, 88—94.
[31] White, Halbert, 1980, A heteroscedasticity-consistent covariance matrix estimator and
a direct test of heteroscedasticity, Econometrica 48, 817-838.
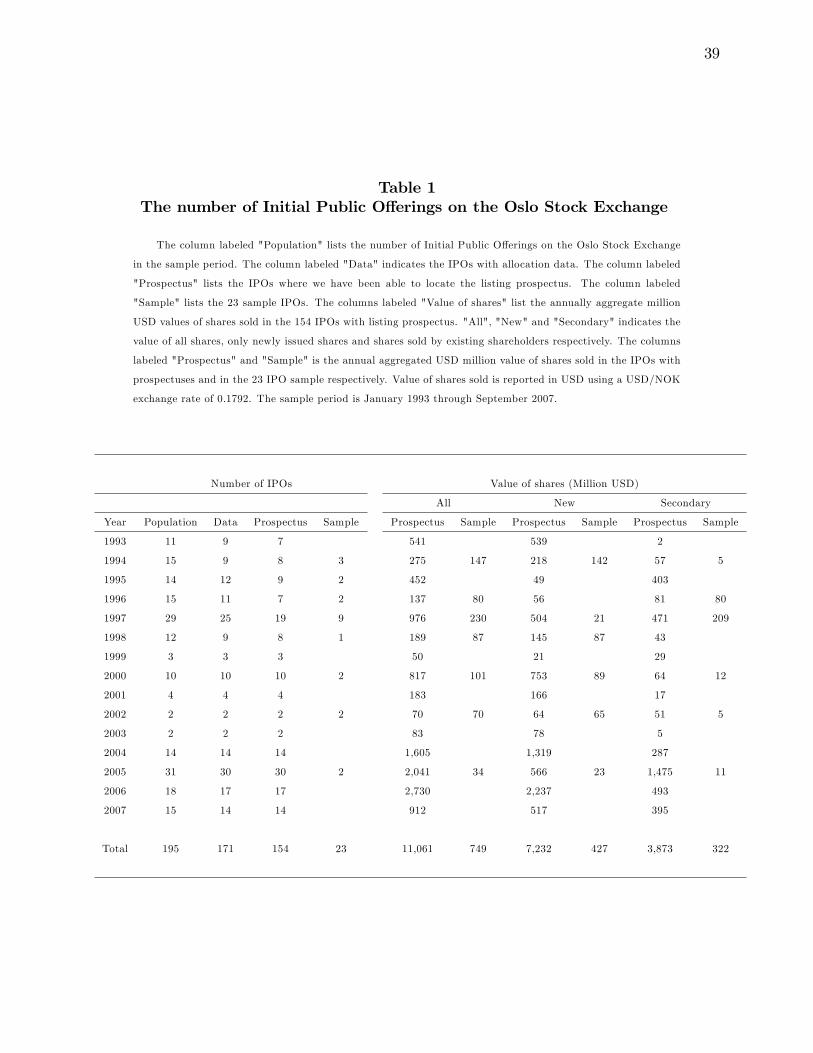
39
Table 1The number of Initial Public Offerings on the Oslo Stock Exchange
The column labeled "Population" lists the number of Initial Public Offerings on the Oslo Stock Exchange
in the sample period. The column labeled "Data" indicates the IPOs with allocation data. The column labeled
"Prospectus" lists the IPOs where we have been able to locate the listing prospectus. The column labeled
"Sample" lists the 23 sample IPOs. The columns labeled "Value of shares" list the annually aggregate million
USD values of shares sold in the 154 IPOs with listing prospectus. "All", "New" and "Secondary" indicates the
value of all shares, only newly issued shares and shares sold by existing shareholders respectively. The columns
labeled "Prospectus" and "Sample" is the annual aggregated USD million value of shares sold in the IPOs with
prospectuses and in the 23 IPO sample respectively. Value of shares sold is reported in USD using a USD/NOK
exchange rate of 0.1792. The sample period is January 1993 through September 2007.
Number of IPOs Value of shares (Million USD)
All New Secondary
Year Population Data Prospectus Sample Prospectus Sample Prospectus Sample Prospectus Sample
1993 11 9 7 541 539 2
1994 15 9 8 3 275 147 218 142 57 5
1995 14 12 9 2 452 49 403
1996 15 11 7 2 137 80 56 81 80
1997 29 25 19 9 976 230 504 21 471 209
1998 12 9 8 1 189 87 145 87 43
1999 3 3 3 50 21 29
2000 10 10 10 2 817 101 753 89 64 12
2001 4 4 4 183 166 17
2002 2 2 2 2 70 70 64 65 51 5
2003 2 2 2 83 78 5
2004 14 14 14 1,605 1,319 287
2005 31 30 30 2 2,041 34 566 23 1,475 11
2006 18 17 17 2,730 2,237 493
2007 15 14 14 912 517 395
Total 195 171 154 23 11,061 749 7,232 427 3,873 322

40
Table 2Summary Statistics of Firms Going Public on the Oslo Stock Exchange
Panel A reports the company characteristics for the 23 IPOs sample and all 171 IPOs with data. "(After-
listing shares/shares issued) %" is the additional shares purchased after the listing divided by the shares issued in
the IPOs. "-That sell shares within 6 months " is the "(After-listing shares/shares issued) %" for only investors
that sell all shares within six months of the listing date. "Market value (Mill USD)" is the number of shares
outstanding on the listing day times the first day closing price. "Book/Market" is the book value of equity
after the IPO divided by the market value on the listing day. "Offer price" is the USD IPO price in the listing
prospectuses. "VC dummy" is a dummy variable that takes the value of one if the company has venture capital
backing. "Tech. dummy" takes the values of one for IT -companies. "First day return" is the percentage price
change from the offer price to the first day closing price. USD values are calculated from a USD/NOK exchange
rate of 0.1792. In Panel B the 23 Sample IPOs are split into IPOs with high and low after-listing purchases by
investors that sell all shares within six months of the listing date. T —statistics are calculated as: Difference /
(square root [(variance sample 1/ numbers in sample 1) + (variance sample 2/ numbers in sample 2)].
Panel A Sample 23 IPOs All 171 IPOs Mean difference
N Mean Std.Dev Median N Mean Std.Dev Median Diff. t-stat.
(After-listing shares/shares issued) 23 8.7% 7.6% 6.2% 171 5.8% 6.2% 3.8% 2.9% (1.8)
-That sell shares within 6 months 23 3.3% 3.7% 2.3% 171 3.6% 5.0% 1.7% -0.3% (-0.3)
Market value (Mill USD) 23 $149.3 $145.2 $117.3 171 $311.4 $871.9 $108.3 -$162.1 (-2.2)
Offer price USD 23 $8.7 $6.9 $7.2 171 $8.2 $6.4 $6.8 $0.5 (0.3)
Book/Market 23 0.3 0.29 0.23 171 0.46 0.33 0.4 -0.16 (-2.4)
VC backed dummy 23 0.17 0.39 0.0 171 0.18 0.38 0.0 -0.01 (-0.1)
Tech dummy 23 0.09 0.29 0.0 171 0.12 0.32 0.0 -0.03 (-0.5)
First day return 23 0.13 0.19 0.09 171 0.08 0.19 0.03 0.05 (1.2)
Panel B 11 high laddering IPOs 12 low laddering IPOs Mean difference
N Mean Std.Dev Median N Mean Std.Dev Median Diff. t-stat.
(After-listing shares/shares issued) 11 12.6% 8.5% 8.4% 12 5.2% 4.7% 4.4% 7.4% (2.6)
-That sell shares within 6 months 11 6.2% 3.5% 5.2% 12 0.7% 0.8% 0.4% 5.5% (5.1)
Market value (Mill. USD) 11 $117.3 $67.1 $95.8 12 $178.8 $190 $144.9 -$61.5 (-1.1)
Book / Market ratio 11 0.34 0.3 0.26 12 0.26 0.29 0.22 0.08 (0.6)
Offer price (USD) 11 $9.0 $5.4 $8.1 12 $8.5 $8.3 $5.7 $0.5 (0.2)
VC backed dummy 11 0.09 0.3 0.0 12 0.25 0.45 0.0 -0.16 (-0.1)
Tech. dummy 11 0.0 0.0 0.0 12 0.17 0.39 0.0 -0.17 (-1.5)
First day return 11 0.16 0.16 0.18 12 0.1 0.21 0.06 0.06 (0.8)
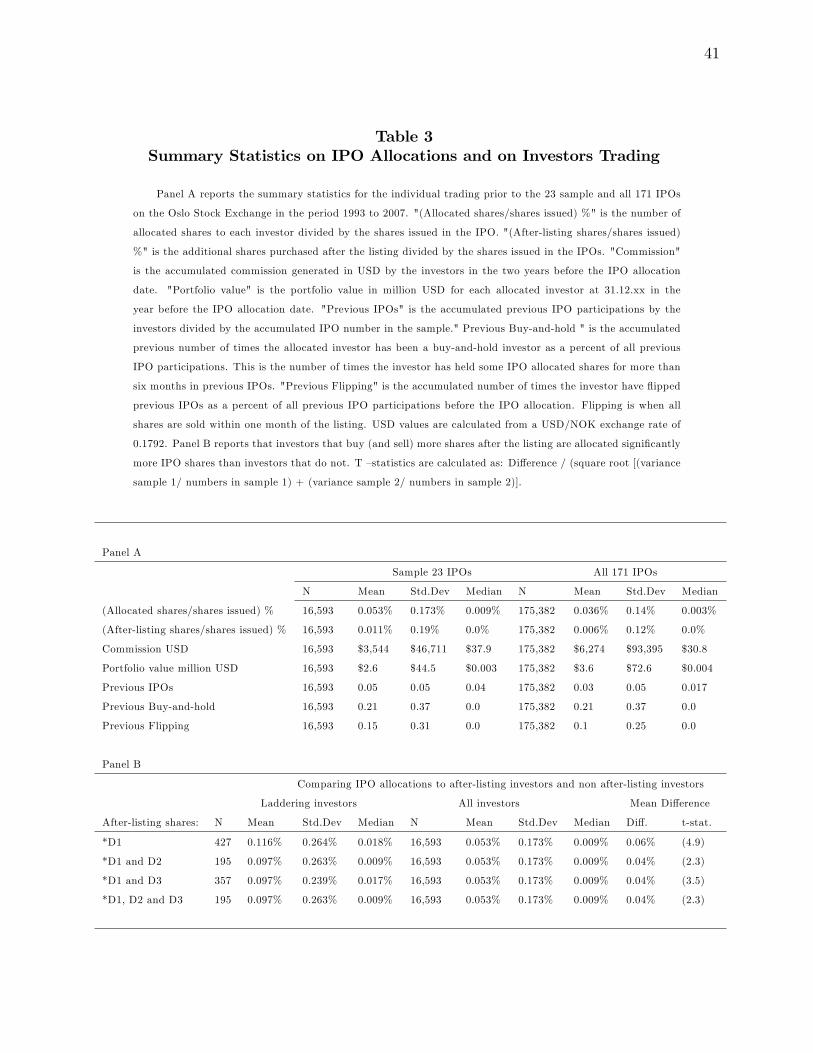
41
Table 3Summary Statistics on IPO Allocations and on Investors Trading
Panel A reports the summary statistics for the individual trading prior to the 23 sample and all 171 IPOs
on the Oslo Stock Exchange in the period 1993 to 2007. "(Allocated shares/shares issued) %" is the number of
allocated shares to each investor divided by the shares issued in the IPO. "(After-listing shares/shares issued)
%" is the additional shares purchased after the listing divided by the shares issued in the IPOs. "Commission"
is the accumulated commission generated in USD by the investors in the two years before the IPO allocation
date. "Portfolio value" is the portfolio value in million USD for each allocated investor at 31.12.xx in the
year before the IPO allocation date. "Previous IPOs" is the accumulated previous IPO participations by the
investors divided by the accumulated IPO number in the sample." Previous Buy-and-hold " is the accumulated
previous number of times the allocated investor has been a buy-and-hold investor as a percent of all previous
IPO participations. This is the number of times the investor has held some IPO allocated shares for more than
six months in previous IPOs. "Previous Flipping" is the accumulated number of times the investor have flipped
previous IPOs as a percent of all previous IPO participations before the IPO allocation. Flipping is when all
shares are sold within one month of the listing. USD values are calculated from a USD/NOK exchange rate of
0.1792. Panel B reports that investors that buy (and sell) more shares after the listing are allocated significantly
more IPO shares than investors that do not. T —statistics are calculated as: Difference / (square root [(variance
sample 1/ numbers in sample 1) + (variance sample 2/ numbers in sample 2)].
Panel A
Sample 23 IPOs All 171 IPOs
N Mean Std.Dev Median N Mean Std.Dev Median
(Allocated shares/shares issued) % 16,593 0.053% 0.173% 0.009% 175,382 0.036% 0.14% 0.003%
(After-listing shares/shares issued) % 16,593 0.011% 0.19% 0.0% 175,382 0.006% 0.12% 0.0%
Commission USD 16,593 $3,544 $46,711 $37.9 175,382 $6,274 $93,395 $30.8
Portfolio value million USD 16,593 $2.6 $44.5 $0.003 175,382 $3.6 $72.6 $0.004
Previous IPOs 16,593 0.05 0.05 0.04 175,382 0.03 0.05 0.017
Previous Buy-and-hold 16,593 0.21 0.37 0.0 175,382 0.21 0.37 0.0
Previous Flipping 16,593 0.15 0.31 0.0 175,382 0.1 0.25 0.0
Panel B
Comparing IPO allocations to after-listing investors and non after-listing investors
Laddering investors All investors Mean Difference
After-listing shares: N Mean Std.Dev Median N Mean Std.Dev Median Diff. t-stat.
*D1 427 0.116% 0.264% 0.018% 16,593 0.053% 0.173% 0.009% 0.06% (4.9)
*D1 and D2 195 0.097% 0.263% 0.009% 16,593 0.053% 0.173% 0.009% 0.04% (2.3)
*D1 and D3 357 0.097% 0.239% 0.017% 16,593 0.053% 0.173% 0.009% 0.04% (3.5)
*D1, D2 and D3 195 0.097% 0.263% 0.009% 16,593 0.053% 0.173% 0.009% 0.04% (2.3)

42
Table 4Relationship between After-listing Purchases and IPO Allocations
This table reports the coeffi cients and heteroscedastic consistent t -statistics (errors adjusted for clustering
across firms Rogers, 1993) in parentheses for the regressions with (allocated shares/issued shares) % as the
dependent variable. This is a standard OLS model. Only the 23 IPOs with exact allocations are included. All
variables are as described in Table 2 and Table 3. In regression 6 and 7 D1 indicates if more than 50% of shares
are sold within three and six months.
(Allocated shares/shares issued) %
Reg 1 Reg 2
Intercept 0.6366 0.7096
(2.3) (2.8)
(After-listing shares/shares issued) % 0.0738 0.054
(1.6) (1.4)
(After-listing shares/shares issued) %* D1 0.1306
(1.7)
D1 -Investors sell shares within months a listing -0.0283
(-1.3)
Log (commission) 0.0111 0.0096
(2.5) (2.2)
Log (portfolio value) 0.0014 0.0018
(0.6) (0.9)
Previous IPOs of possible 0.2242 0.2085
(0.7) (0.7)
Previous buy-and-hold of possible -0.0076 -0.0046
(-0.3) (-0.2)
Previous flipping of possible -0.019 -0.0207
(-0.6) (-0.6)
Financial institution dummy 0.0657 0.0743
(0.9) (1.1)
Log (market value) -0.0573 -0.0602
(-4.2) (-4.8)
BV / MV equity 0437 0.4309
(7.3) (6.7)
Offer price -0.0024 -0.0023
(-4.0) (-3.9)
VC backed dummy 1.0986 1.1027
(15.5) (14.5)
High-tech dummy -0.9268 -0.9488
(-12.0) (-14.5)
First day return dropped dropped
Company and year dummy yes yes
Observations (IPO allocations) 1,016 1,016
-of which are laddering investors 427
Adjusted R -squared 33.6% 35.2%
Investors sell within months of listing all 6m.

43
Continued... (Allocated shares/shares issued) %
Reg 3 Reg 4 Reg 5 Reg 6 Reg 7
Intercept 6.0717 1.9466 1.268 1.3036 1.1851
(16.8) (9.4) (10.6) (10.6) (13.7)
(After-listing shares/shares issued) % 0.0486 0.0587 0.0587 0.062 0.0487
(1.2) (1.4) (1.4) (1.5) (1.4)
(After-listing shares/shares issued) %* D1*D2 0.286
(4.2)
(After-listing shares/shares issued) %* D1*D3 0.2698
(4.9)
(After-listing shares/shares issued) %* D1*D2*D3 0.286 0.3013 0.2398
(4.2) (2.9) (7.7)
D1 -Investors sell shares within months a listing -0.0384 -0.0249 -0.0249 -0.0434 -0.0093
(-1.6) (-1.2) (-1.2) (-1.7) (-0.5)
D2 - Positive drift in share price after the listing -0.2606 -0.2075 -0.2138 -0.2053
(-5.3) (-4.5) (-4.5) (-4.5)
D3 - Underpriced IPO 0.5297 0.1551 0.1713 0.1267
(20.1) (2.6) (2.7) (2.0)
Log (commission) 0.0083 0.0085 0.0085 0.0103 0.0094
(1.8) (1.8) (1.8) (2.4) (2.3)
Log (portfolio value) 0.0024 0.0023 0.0023 0.0015 0.0019
(1.2) (1.2) (1.2) (0.8) (1.0)
Previous IPOs of possible 0.1996 0.2351 0.2351 0.2691 0.2274
(0.6) (0.8) (0.8) (0.9) (0.8)
Previous buy-and-hold of possible -0.002 -0.0072 -0.0072 -0.007 -0.0061
(-0.1) (-0.3) (-0.3) (-0.3) (-0.2)
Previous flipping of possible -0.0172 -0.0167 -0.0167 -0.011 -0.0194
(-0.5) (-0.5) (-0.5) (-0.4) (-0.6)
Financial institution dummy 0.0703 0.0641 0.0641 0.0644 0.0611
(1.1) (0.9) (0.9) (0.9) (0.9)
Log (market value) -0.3003 -0.0983 -0.0636 -0.0656 -0.0599
(-16.8) (-9.6) (-11.5) (-11.4) (-15.9)
BV / MV equity dropped dropped dropped dropped dropped
Offer price -0.009 -0.0016 -0.0023 -0.0025 -0.002
(-12.4) (-1.8) (-2.9) (-3.1) (-2.5)
VC backed dummy -0.4496 0.6022 0.5567 0.5428 0.6072
(-17.2) (-16.6) (7.0) (6.5) (7.4)
High-tech dummy -1.0434 -1.0831 -0.8529 -0.8437 -0.8859
(-12.7) (-16.8) (-8.8) (-8.5) (-9.6)
First day return dropped dropped dropped dropped dropped
Company and year dummy yes yes yes yes yes
Observations (IPO allocations) 1,016 1,016 1,016 1,016 1,016
-of which are laddering investors 357 195 195 145 217
Adjusted R -squared 38.3% 37.0% 34.5% 36.2% 37.9%
Investors sell within months of listing all 6m. all 6m. all 6m. 50% 3m. 50% 6m.

44
Table 5After-listing Purchases in Past IPOs Give More Future IPO Ownership
This table reports the coeffi cients and heteroscedastic consistent t -statistics (errors adjusted for clustering
across firms Rogers, 1993) in parentheses for the regressions with (allocated shares/issued shares) % as the
dependent variable. This is a standard OLS model. All variables are as described in Table 2 and Table 3.
Regression 1 includes all IPOs. Regression 2 and 3 includes hot and cold IPOs respectively. There are 171,
105 and 45 IPOs in regression 1, 2 and 3. Regression 4 to 6 drop all company specific control variables. Past
laddering includes only investors who have purchased more shares right after the listing and then sold some of
the shares within six months of the listing date in past IPOs.
(Allocated shares/shares issued) %
Reg 1 Reg 2 Reg 3 Reg 4 Reg 5 Reg 6
Intercept -0.12984 0.1096 0.7882 -0.0278 2.0078 0.0587
(-25.9) (6.9) (100.0) (-7.0) (90.8) (10.6)
Previous laddering 0.1114 0.1137 0.0877 0.1114 0.1137 0.0877
(9.3) (8.2) (3.4) (9.3) (8.2) (3.4)
Log (commission) 0.006 0.0051 0.012 0.006 0.0051 0.012
(4.1) (3.6) (8.9) (4.1) (3.6) (8.8)
Log (portfolio value) 0.0085 0.0007 0.0013 0.0009 0.0007 0.0013
(2.6) (2.3) (2.2) (2.6) (2.3) (2.2)
Previous IPOs 0.1535 0.1619 0.1865 0.1535 0.1619 0.1865
(3.8) (3.6) (3.0) (3.8) (3.6) (3.0)
Previous buy-and-hold -0.0156 -0.0153 -0.0177 -0.01558 -0.0153 -0.0177
(-7.8) (-7.0) (-3.0) (-7.8) (-7.0) (-3.0)
Previous flipping -0.0022 -0.0051 0.0061 -0.0022 -0.0051 0.0061
(-0.9) (-1.9) (0.9) (-0.9) (-1.9) (0.9)
Financial institution dummy 0.1779 0.1653 0.1807 0.1779 0.1653 0.1807
(9.5) (6.9) (5.3) (9.5) (6.9) (5.3)
Log (market value) 0.0121 -0.008 -0.0357
(21.4) (-9.8) (-109.1)
BV / MV equity -0.0108 0.0474 -0.2327
(-2.1) (10.3) (-90.3)
Offer price -0.0011 -0.001 0.0008
(-63.6) (-32.3) (64.4)
VC backed dummy 0.1196 0.0493 -0.2708
(29.7) (5.0) (-85.9)
High-tech dummy -0.1668 -0.44 0.0599
(-33.4) (-42.8) (27.3)
First day return 0.4163 0.3627 dropped
(16.3) (12.5)
Company and year dummy yes yes yes yes yes yes
Observations 175,382 145,392 22,114 175,382 145,392 25,891
Adjusted R -squared 22.0% 21.7% 20.1% 22.0% 21.7% 20.1%
IPOs all hot cold all hot cold

45
Table 6Actual Return from After-listing Purchases
This table reports the average USD return for the investors that buy more shares after the listing. Only
IPOs with exact IPO allocations are included in the analysis (23 IPOs). First day return $ is calculated as: the
number of shares allocated in the IPO * (first day closing price - offer price) * 0.1792 (The NOK/USD exchange
rate). First month return $ is calculated as: (The number of shares allocated in the IPO + The shares purchased
after the listing) * ( Price one month after the listing - first day closing price) * 0.1792 (The NOK/USD exchange
rate). Panel A investigate only IPO allocated investors with after-listing buying that sell early in hot IPOs.
Panel B investigate only IPO allocated investors with after-listing buying that sell early in IPOs with a positive
drift after the listing. Panel C investigate only IPO allocated investors with after-listing buying that sell early
in cold IPOs. Panel C includes all IPO trading for the 70 investors that buy more shares after the listing in
the cold IPOs. These 70 investors lose money on their cold IPO after-listing purchases, but they earn money in
total. Together these investors receive 447 allocations in the sample. Panel D and E investigates non-allocated
IPO investors who buy shares after the listing. Panel D investigates the 11 IPOs with high laddering. Panel E
investigates the 12 IPOs with low laddering.
Panel A: (IPOs=14)
First day return $ First month return $ Total return $ Std.Dev. Investors
All investors $6,526 $9,197 $15,723 $59,730 357
Institutions $16,400 $21,866 $38,265 $106,181 92
Panel B: (IPOs=6)
First day return $ First month return $ Total return $ Std.Dev. Investors
All investors $6,712 $15,592 $22,303 $61,822 195
Institutions only $17,217 $50,733 $67,949 $117,353 40
Panel C:
First day return $ First month return $ Total return $ Std.Dev. Allocations
All investors $17,705 $3,744 $21,449 $167,687 447
Institutions only $46,297 $13,428 $59,725 $266,893 169
Panel D: The 11 IPOs with high laddering
Six month return $ Std.Dev. Investors
All investors -$5,611 -$139,736 10,748
Institutions only -$22,189 -$339,564 1,806
Panel E: The 12 low laddering IPOs
Six month return $ Std.Dev. Investors
All investors -$324 -$327,450 6,554
Institutions only $1,276 $711,068 1,388

46
Table 7After-listing Purchases and Generated Brokerage Commissions
This table reports the coeffi cients and White (1980) heteroscedasticity consistent t-statistics in parentheses
for the regressions with the aggregate (after-listing shares/shares issued) % as the dependent variable. All
variables are as described in Table 2 and Table 3. All regressions are standard OLS models, and the sample
period is from January 1993 to September 2007. Only investors that sell some shares within six months of the
listing are included in Aggregate (After-listing shares/shares issued) %. Only investors that do not buy shares
after the listing are included in Log (average commission per share). Regression 2 and 4 drop the variables that
Hao (2007) and Aggarwal et al. (2006) predict increase laddering. Regression 3 and 4 use average commission
by shares instead of the sum of commission scaled by commission in all IPOs.
Log (aggregate after-listing shares/shares issued) %
Reg 1 Reg 2 Reg 3 Reg 4
Intercept 1.5289 1.5296 0.6737 0.3876
(1.5) (1.6) (0.7) (0.4)
(Combined commission) % 51.5725 44.7781
(3.9) (4.4)
Log (average commission per share) 0.2172 0.2116
(1.8) (1.7)
Log (market value) -0.0289 -0.03153 0.01 0.0306
(-0.5) (-0.5) (0.2) (0.5)
BV / MV equity -0.147 -0.1551 -0.2652 -0.2938
(-0.5) (-0.5) (-0.9) (-0.9)
VC backed dummy -0.4901 -0.6445 -0.505 -0.5339
(-1.5) (-2.3) (-1.5) (-1.7)
High-tech dummy -0.2395 -0.2797 -0.1333 -0.1139
(-0.7) (-0.9) (-0.4) (-0.3)
Absolute price revision -0.0305 -0.0044
(-0.2) (-0.2)
Sentiment investors (million) 0.0000 0.0001
(-0.3) (2.2)
Observations 171 171 171 171
Adjusted R -squared 7.8% 7.4% 4.7% 4.1%

47
Table 8Relationship between After-listing Purchases and IPO Allocations -Robustness
This table reports the coeffi cients and heteroscedastic consistent t -statistics (errors adjusted for clustering
across firms Rogers, 1993) in parentheses for the regressions with (allocated shares/issued shares) % as the
dependent variable. This is a standard OLS model. Only the 23 IPOs with exact allocations are included. All
variables are as described in Table 2 and Table 3. In regression 1 all PCC (savings banks) are included. In
regression 2 IPO allocations are trimmed at 0.1%.
Intercept 1.5432 1.0574
(14.3) (2.8)
(After-listing shares/shares issued) % 0.0772 0.249
(1.9) (4.6)
(After-listing shares/shares issued) %* D1 *D2 *D3 0.2674 0.5255
(3.7) (1.7)
D1 -Investors sell shares within six months a listing -0.0201 -0.0326
(-1.1) (-0.6)
D2 - Positive drift in share price after the listing 0.1242 -0.1165
(7.6) (-1.6)
D3 - Underpriced IPO -0.1832 -0.4437
(-15.0) (-5.5)
Log (commission) 0.0093 0.029
(2.5) (2.1)
Log (portfolio value) 0.0035 0.0005
(2.0) (0.1)
Previous IPOs of possible 0.0171 0.0135
(0.1) (0.0)
Previous buy-and-hold of possible -0.004 0.0311
(-0.2) (0.6)
Previous flipping of possible -0.0346 -0.0602
(-1.1) (-1.3)
Financial institution dummy 0.1086 0.4664
(1.5) (1.7)
Log (market value) -0.0779 -0.0727
(-19.2) (-4,2)
BV / MV equity 0.0331 dropped
(6.3)
Offer price 0.0002 0.0152
(1.4) (11.4)
VC backed dummy 0.7644 -0.4935
(23.7) (-4.8)
High-tech dummy 0.3245 0.4879
(12.8) (7.2)
First day return dropped dropped
Company and year dummy yes yes
Observations (IPO allocations) 1,251 1,064
-of which are laddering investors 209 200
Adjusted R -squared 34.2% 31.6%
Investors sell within months of listing all 6m. all 6m.
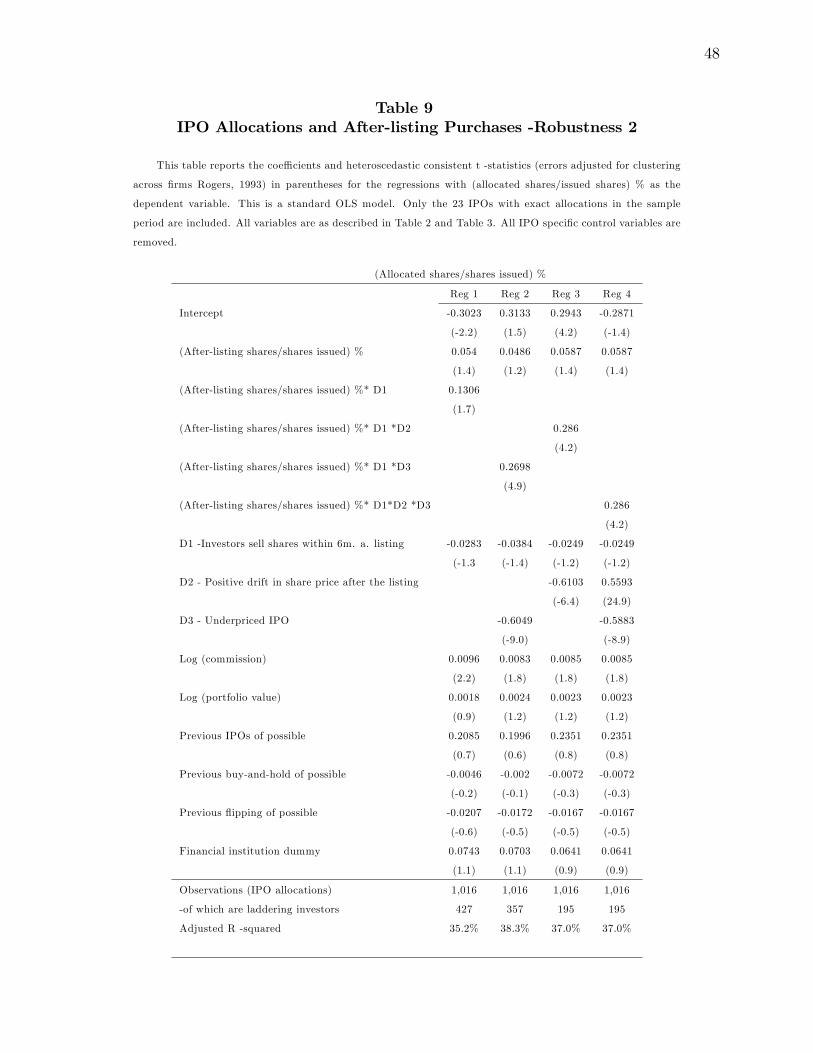
48
Table 9IPO Allocations and After-listing Purchases -Robustness 2
This table reports the coeffi cients and heteroscedastic consistent t -statistics (errors adjusted for clustering
across firms Rogers, 1993) in parentheses for the regressions with (allocated shares/issued shares) % as the
dependent variable. This is a standard OLS model. Only the 23 IPOs with exact allocations in the sample
period are included. All variables are as described in Table 2 and Table 3. All IPO specific control variables are
removed.
(Allocated shares/shares issued) %
Reg 1 Reg 2 Reg 3 Reg 4
Intercept -0.3023 0.3133 0.2943 -0.2871
(-2.2) (1.5) (4.2) (-1.4)
(After-listing shares/shares issued) % 0.054 0.0486 0.0587 0.0587
(1.4) (1.2) (1.4) (1.4)
(After-listing shares/shares issued) %* D1 0.1306
(1.7)
(After-listing shares/shares issued) %* D1 *D2 0.286
(4.2)
(After-listing shares/shares issued) %* D1 *D3 0.2698
(4.9)
(After-listing shares/shares issued) %* D1*D2 *D3 0.286
(4.2)
D1 -Investors sell shares within 6m. a. listing -0.0283 -0.0384 -0.0249 -0.0249
(-1.3 (-1.4) (-1.2) (-1.2)
D2 - Positive drift in share price after the listing -0.6103 0.5593
(-6.4) (24.9)
D3 - Underpriced IPO -0.6049 -0.5883
(-9.0) (-8.9)
Log (commission) 0.0096 0.0083 0.0085 0.0085
(2.2) (1.8) (1.8) (1.8)
Log (portfolio value) 0.0018 0.0024 0.0023 0.0023
(0.9) (1.2) (1.2) (1.2)
Previous IPOs of possible 0.2085 0.1996 0.2351 0.2351
(0.7) (0.6) (0.8) (0.8)
Previous buy-and-hold of possible -0.0046 -0.002 -0.0072 -0.0072
(-0.2) (-0.1) (-0.3) (-0.3)
Previous flipping of possible -0.0207 -0.0172 -0.0167 -0.0167
(-0.6) (-0.5) (-0.5) (-0.5)
Financial institution dummy 0.0743 0.0703 0.0641 0.0641
(1.1) (1.1) (0.9) (0.9)
Observations (IPO allocations) 1,016 1,016 1,016 1,016
-of which are laddering investors 427 357 195 195
Adjusted R -squared 35.2% 38.3% 37.0% 37.0%

49
Table 10Aggregate IPO Laddering and Allocations
This table reports the aggregate allocation and laddering at the IPO level. Panel A includes the 11 high
laddering IPOs. Panel B includes also the 12 low laddering IPOs.
Panel A
Group Investors Allocation Laddering Total IPOs
D1 363 3.6% 6.2% 9.8% 11
D1, D3 317 3.5% 6.3% 9.8% 9
D1, D2 174 4.5% 8.7% 13.2% 4
Panel B
D1 427 2.5% 3.5% 6.0% 20
D1, D3 357 2.5% 4.5% 7.0% 14
D1, D2 195 5.9% 3.2% 9.1% 6

50
Figure 1The Factors that Create the Incentives to Engage in IPO Laddering
Laddering investors are allocated some shares in the IPO and then they buy more shares after the listing
before they sell all shares. Commission investors are investors that generate high levels of brokerage commission
to the investment bank through trading in other shares. Investment bank is the lead manager in the IPO.
Hot and cold IPOs are high and low oversubscribed IPOs. Hot and cold IPOs are proxied for by positive and
non-positive first day return.
Hot IPOs
Laddering investors Agree to buy more shares after the listing to increase Pulliam and Smith (2000)
current hot IPO allocations and the SEC litigation
releases
Commission investors Pay increased brokerage commissions to the investment Reuter (2006) and
bank, through trades in other shares, to increase Nimalendran, Ritter
current and future hot IPO allocations and Zhang (2006)
Investment banks 1) Increase received commissions by allocating IPO Hao (2007)
shares to laddering investors and commission investors
2) Ensure a successful IPO by allocating shares to Hao (2007)
laddering investors that increase prices after the listing
Cold IPOs
Laddering investors Agree to buy more shares after the listing to increase Griffi n et al. (2007)
future hot IPO allocations
Investment banks 1) Ensure a more successful IPO by allocating shares to Griffi n et al. (2007)
laddering investors that increase prices after the listing and Hao (2007)
2) Reduces after-listing price uncertainty by allocating Griffi n et al. (2007)
shares to laddering investors
3) Reduces the risk of damaged reputation from IPOs Griffi n et al. (2007)
that fall in price by allocating shares to laddering investors

51
Figure 2Theoretical Predictions By Hao (2007) and Aggarwal et al. (2006)
Predictions made by Hao (2007)*
Laddering will increase the following variables: (Tested in Table 8)
1) Laddering results in a higher offer price if the investors are not expected to sell shares in the immediate after-listing (six m.)
2) Laddering is positively related to money left on the table. Investors must have a monetary incentive to buy the shares.
3) Laddering in itself does not necessarily increase underpricing. Both offer and the closing price are positively related to laddering.
4) Laddering contributes to long-run underperformance.
The following variables will increase laddering: (Tested in Table 7)
5) More expected underpricing (without laddering) leads to more laddering
6) When there are information momentum effects where positive initial returns induce more information there is more laddering.
7) When underwriters shares in on the profits from underpriced IPOs, the incentives to engage in laddering are increased.
Predictions made by Aggarwal et al (2006)*
Laddering will increase the following variables: (Tested in Table 8)
1) Returns should be higher for IPOs with laddering than for IPOs with no laddering over the six months after the listing
2) The long-run return should be lower for IPOs with laddering than for IPOs with no laddering
3) The number of sentiment investors increases IPO underpricing for IPOs with laddering.
4) Turnover and volume (shares traded) are greater for IPOs with laddering than for IPOs with no laddering
The following variables will increase laddering: (Tested in Table 7)
5) Underpricing is higher for IPOs with laddering than for IPOs with no laddering
6) When there are more sentiment investors there is a bigger likelihood of laddering
Major Differences
1) Hao (2007) predict intentional underpricing, and Aggarwal et al. (2006) predict price run ups that are corrected in the long-run
2) Hao (2007) and Aggarwal et al. (2006) predicts that laddering increases offer and closing prices and underpricing respectively

52
Figure 3Timeline of the IPO Allocations for the Different Groups
Listing in database is when the company list ownership records in the ownership database. This is when
the ownership records are observed in the data the first time. IPO allocation is when the companies distribute
the allocated shares in the ownership database. Listing is when the company is listed publicly. After-listing
purchases is when the laddering trades are calculated. Group 1 to 3 is the ordering of the group of detail in
the allocations. Group 1 is 100% accurate IPO allocations. Group 2 IPO allocations includes one to 30 days of
after-listing trading. Group 3 IPO allocations includes existing owners who have not sold all of their shares in
the IPO. There are 23, 143 and 5 companies in group 1, 2 and 3 respectively.
Timeline of the listing Six months before One month before Listing month One month after
the listing the listing the listing
Group 1 Listing in database IPO allocation Listing After-listing purchases
Group 2 Listing in database IPO allocation After-listing purchases
Listing
Group 3 Listing in database Listing After-listing purchases
IPO allocation
The CCGR Working Paper Series: Contents The papers may be downloaded without charge from our website http://www.bi.no/ccgr 2007
1/2007 Ole-Kristian Hope and John Christian Langli:
Auditor Independence in a Private Firm and Low Litigation Risk Setting
Revised April 2009
Accepted for publication in the Accounting Review June 2009
2008
1/2008 Paul Ehling:
Risk Management with Cash and Insurance in Non-Listed Firms
Revised May 2009
2009
1/2009 Øyvind Norli, Charlotte Ostergaard and Ibolya Schindele:
Liquidity and Shareholder Activism
Revised April 2010
2010
1/2010 Roland E. Kidwell and Arne Nygaard:
The Dual-Agency Problem Reconsidered: A Strategic Deviance Perspective
on the Franchise Form of Organizing
Revised September 2010
2/2010 Ole-Kristian Hope, John Christian Langli and Wayne B. Thomas:
Agency Conflicts and Auditing in Private Firms
March 2010
Revised September 2010
3/2010 Mohammad Abdolmohammadi, Erlend Kvaal and John Christian Langli:
Earnings Management Priorities of Private Family Firms
November 2010
4/2010 Sturla Lyngnes Fjesme, Roni Michaely and Øyvind Norli:
Using Brokerage Commissions to Secure IPO Allocations
November 2010

2011
1/2011 Charlotte Ostergaard, Amir Sasson, and Bent E. Sørensen:
The Marginal Value of Cash, Cash Flow Sensitivities, and Bank-Finance
Shocks in Nonlisted Firms
January 2011
2/2011 Sturla Lyngnes Fjesme:
Laddering in Initial Public Offering Allocations
January 2011

The Centre for Corporate Governance Research (CCGR) conducts research on the relationship between corporate governance, firm behavior, and stakeholder welfare. Our projects pay particular attention to the governance of closely held firms and family firms, and the research teams come from different disciplines in several countries. Financing is provided by private sponsors and the Research Council of Norway. The CCGR is organized by the Department of Financial Economics at BI Norwegian School of Management in Oslo, Norway (http://www.bi.no) Centre for Corporate Governance Research BI Norwegian School of Management Nydalsveien 37 N-0442 OSLO Norway http://www.bi.no/ccgr