lafarge africa plc n131.65 billion rights issue africa... · lekki-ikoyi bridge, lagos nigeria...
TRANSCRIPT

Lekki-Ikoyi Bridge, Lagos Nigeria
Lafarge Africa PlcN131.65 Billion Rights Issue
Facts Behind the Offer
November 30, 2017

The information in this presentation is given in confidence and may not be reproduced or redistributed to any other persons
This document has been prepared solely for use at the Facts Behind the Offer held in connection with the Lafarge Africa PLC
(“Lafarge Africa” or the “Company”) Rights Issue Programme. The information contained in this document has not been
independently verified and no representation or warranty, express or implied, is made as to, and no reliance should be placed
on, the fairness, accuracy, completeness or correctness of the information or opinions contained herein. The information set out
herein may be subject to updating, revision, verification and amendment and such information may change materially. Chapel
Hill Denham Advisory Limited (“Chapel Hill”), and Standard Chartered Capital & Advisory Nigeria Limited (“Standard
Chartered”), are not under any obligation to update the information contained in this presentation and any opinions expressed in
it are subject to change without notice. Chapel Hill, Standard Chartered or any of their respective affiliates, advisers or
representatives shall not have any liability whatsoever (in negligence or otherwise) for any loss whatsoever arising from any use
of this document or its contents, or otherwise in connection with this presentation
Any decision to purchase or subscribe for securities in connection with the Right Issuance should be made solely on the basis of
your own investigations with respect to Lafarge Africa and the Rights Issuance
None of the professional parties herein stated nor any of their representatives make any representation or warranty, expressed
or implied, as to the accuracy or completeness of any information contained in this document
Only those particular representation and warranties, if any, which may be made in a definitive written agreement, when, as and if
executed, and subject to such limitation and restrictions as may be specified therein, will have any legal effect
Any market analysis and estimates presented in this document represent the subjective views of Chapel Hill, and Standard
Chartered or the source reference if any
Disclaimer
2

Outline
3
Section Page
1. Company Overview 5
2. Nigerian Cement Industry Overview 11
3. Financial Overview 15
4. Business Outlook 21
5. Transaction Summary 24
6. Appendix 28

Company Overview

REVENUE CONTRIBUTION (FY’16)
Snapshot of Lafarge Africa
LISTING INFORMATION
► Listed on The Nigerian Stock Exchange in 1979
► 9th largest company on The NSE by market
capitalisation
► Market capitalization of N307 billion1
PRODUCTION INFORMATION
14.1 MTPA2
TOTAL
CAPACITY
OPERATIONS
3 COUNTRIES
(NIGERIA, SOUTH AFRICA, GHANA)
21
QUARRIES
PRODUCTS
► Cement
► Ready-Mix
► Aggregates
► Fly Ash
9th
70%
NIGERIA
30%
SOUTH
AFRICA
SELECT AWARDS
► Most innovative in manufacturing (2017,
2016), BusinessDay
► Best Company in Stakeholder Engagement
and Most Outstanding Company of the
Decade (2016), SERA
► Best Company in Sustainability Reporting
(2015), SERA
Revenue
(FY’16)
Revenue CAGR
(FY’12 – FY’16)
PAT
(FY’16)
Earnings per
share (FY’16)
Total assets
(FY’16)
Return on equity
(FY’16)
Sources: Lafarge Africa, NSE, Bloomberg
1. As at 20 October 2017
2. Excludes aggregates, RMC, Fly Ash
6
CEMENT
PLANTS
N220bn 24.7% N3.15N16.9bn N503bn 6.8%
6
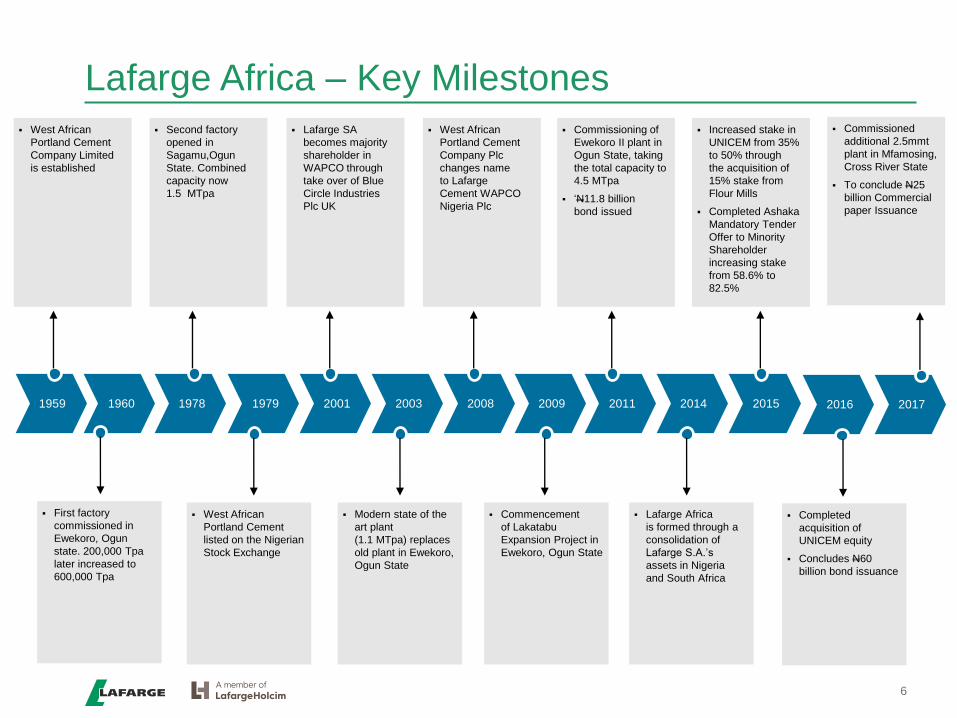
Lafarge Africa – Key Milestones
6
Increased stake in
UNICEM from 35%
to 50% through
the acquisition of
15% stake from
Flour Mills
Completed Ashaka
Mandatory Tender
Offer to Minority
Shareholder
increasing stake
from 58.6% to
82.5%
Commissioning of
Ewekoro II plant in
Ogun State, taking
the total capacity to
4.5 MTpa
‘N11.8 billion
bond issued
West African
Portland Cement
Company Plc
changes name
to Lafarge
Cement WAPCO
Nigeria Plc
Lafarge SA
becomes majority
shareholder in
WAPCO through
take over of Blue
Circle Industries
Plc UK
Second factory
opened in
Sagamu,Ogun
State. Combined
capacity now
1.5 MTpa
West African
Portland Cement
Company Limited
is established
1959 1960 1978 1979 2001 2003 2008 2009 2011 2014 2015
Lafarge Africa
is formed through a
consolidation of
Lafarge S.A.’s
assets in Nigeria
and South Africa
Commencement
of Lakatabu
Expansion Project in
Ewekoro, Ogun State
Modern state of the
art plant
(1.1 MTpa) replaces
old plant in Ewekoro,
Ogun State
West African
Portland Cement
listed on the Nigerian
Stock Exchange
First factory
commissioned in
Ewekoro, Ogun
state. 200,000 Tpa
later increased to
600,000 Tpa
2016
Completed
acquisition of
UNICEM equity
Concludes N60
billion bond issuance
Commissioned
additional 2.5mmt
plant in Mfamosing,
Cross River State
To conclude N25
billion Commercial
paper Issuance
2017
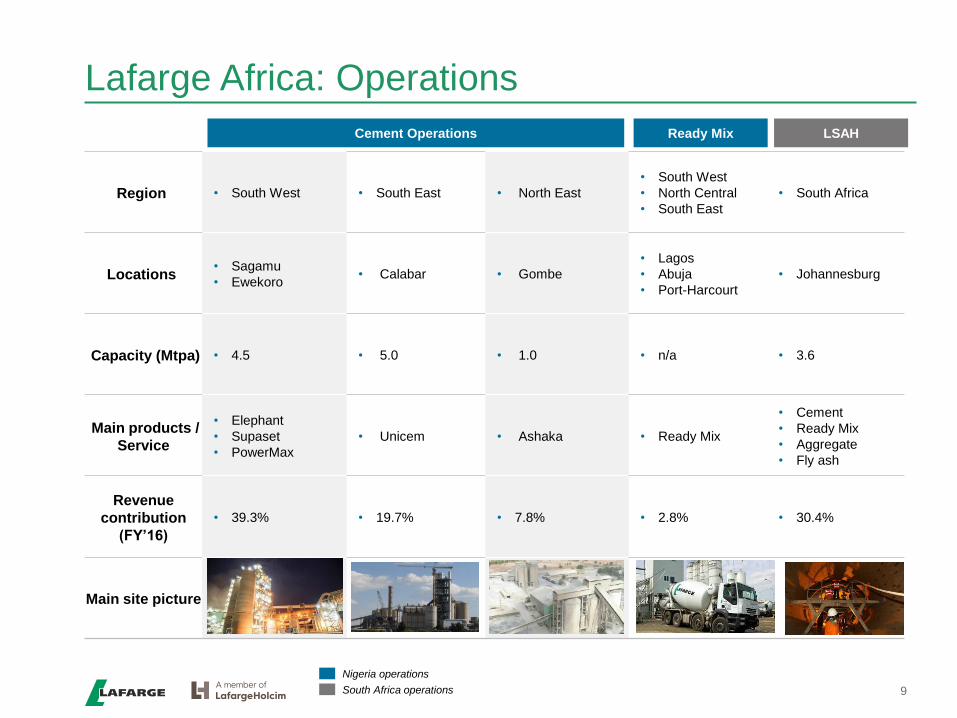
Lafarge Africa: Operations
Cement Operations
Region • South West • South East • North East
• South West
• North Central
• South East
• South Africa
Locations• Sagamu
• Ewekoro• Calabar • Gombe
• Lagos
• Abuja
• Port-Harcourt
• Johannesburg
Capacity (Mtpa) • 4.5 • 5.0 • 1.0 • n/a • 3.6
Main products /
Service
• Elephant
• Supaset
• PowerMax
• Unicem • Ashaka • Ready Mix
• Cement
• Ready Mix
• Aggregate
• Fly ash
Revenue
contribution
(FY’16)
• 39.3% • 19.7% • 7.8% • 2.8% • 30.4%
Main site picture
Ready Mix LSAH
Nigeria operations
South Africa operations 9
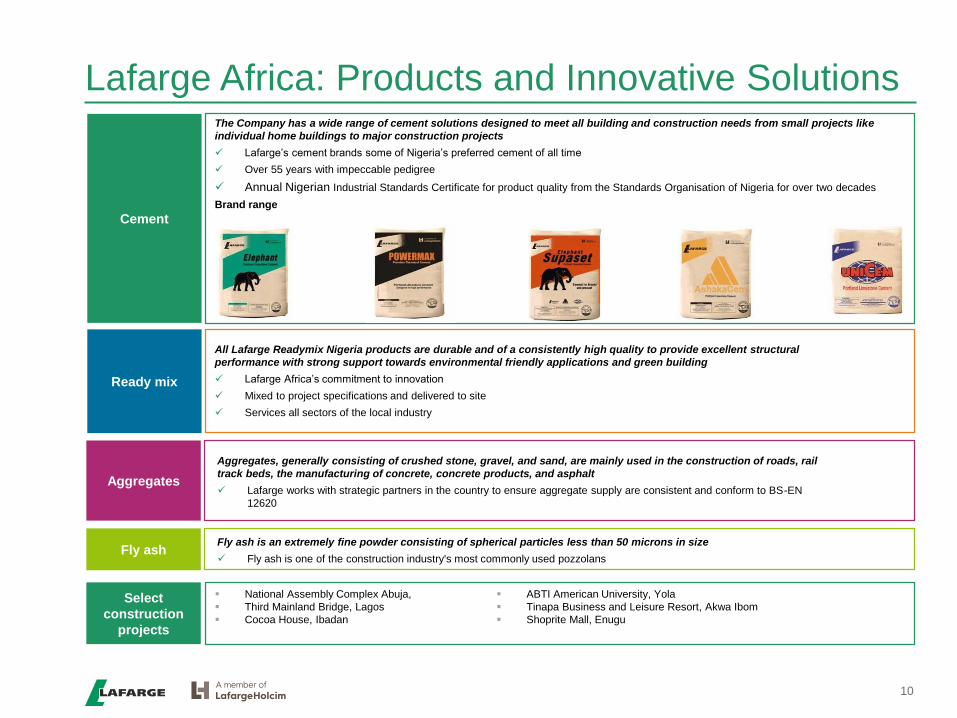
Lafarge Africa: Products and Innovative Solutions
Ready mix
All Lafarge Readymix Nigeria products are durable and of a consistently high quality to provide excellent structural
performance with strong support towards environmental friendly applications and green building
Lafarge Africa’s commitment to innovation
Mixed to project specifications and delivered to site
Services all sectors of the local industry
Aggregates
Aggregates, generally consisting of crushed stone, gravel, and sand, are mainly used in the construction of roads, rail
track beds, the manufacturing of concrete, concrete products, and asphalt
Lafarge works with strategic partners in the country to ensure aggregate supply are consistent and conform to BS-EN
12620
Fly ashFly ash is an extremely fine powder consisting of spherical particles less than 50 microns in size
Fly ash is one of the construction industry's most commonly used pozzolans
Cement
The Company has a wide range of cement solutions designed to meet all building and construction needs from small projects like
individual home buildings to major construction projects
Lafarge’s cement brands some of Nigeria’s preferred cement of all time
Over 55 years with impeccable pedigree
Annual Nigerian Industrial Standards Certificate for product quality from the Standards Organisation of Nigeria for over two decades
Brand range
10
Select
construction
projects
National Assembly Complex Abuja,
Third Mainland Bridge, Lagos
Cocoa House, Ibadan
ABTI American University, Yola
Tinapa Business and Leisure Resort, Akwa Ibom
Shoprite Mall, Enugu

Nigerian Cement Industry Overview

10
Nigeria as a key investment destination
US$457bn1
Nigeria’s 2016 GDP
18 yearsMedian age in Nigeria
77% of population
under
35 years
c.187mnNigeria’s population
Rural : urban mix
expected to shift from
52:48 in 2015 to
48:52 in 2021
2.5%Population growth to reach
212mn by 2021
One of Africa’s largest
economies
Economic recovery
expected in 2017, following
2016 recession; c.1%
growth expected in 2017
600%Nigeria’s middle class
growth from 2000 to
2014
Middle class
households expected
to grow from 4.1mn
to 11.7mn by 2030
Household
spending
expected to
grow by
US$26bn from 2015 –
2020
Sources: World Bank, EIU, AFDB Economic Outlook, National Bureau of Statistics, Standard Bank Research, McKinsey & Company, International Monetary Fund1 World Bank – Constant 2010 US$
11Cities with population
over 1 million people
Favourable Demography
and Economic Reforms
continue to position
Nigeria as a key
investment destination
Demography to drive
household demand
Urbanization and middle class
Young population
Support from key policy
reforms:
ERGP
Fiscal discipline
World Bank Housing Finance
Development Program
Improving Financial Stability
Improved currency liquidity
Successful Eurobond and
Diaspora Bond issuances
I&E Window for foreign
portfolio investors
Recovery of Stock Exchange
Agriculture, 22.97%
Industries, 23.31%
Services, 53.73%
A diversified economy with large
growth scope for industrials
US$2,178GDP Per Capita

Macro-economics at a glance
11
Strong fundamental in the
Long RunStrong improvement in
2017
Recovery expected in
2018-2019
• Population growth at
+2,6%p.a. (+5% for urban)
• Nominal GDP at +5% p.a.
(assumption oil price from
45-71$/bbl)
• Major housing gap (still
growing)
• Infrastructure gap (roads,
power, rail, …)
• Exit from recession but
mainly from Oil and Agric
sector. Construction and
Manufacturing still lagging
• Stabilization of FX rate but
strong Naira liquidity
squeeze
• In 2018-2019, recovery is
expected with real GDP
growth bouncing back
• IMF anticipate +1,9% in
2018 and 2019
• World Bank forecast +2,5%
Nigeria: medium-term macroeconomic outlook September 2017
TAC ECONOMICS - www.taceconomics.com
19
Macroeconomic outlook
In this chapter, we focus on the current economic situation and outlook taking into
consideration (1) the massive negative shock from much lower oil prices and (2) the
adjustment policy implemented so far, in particular since the 2016 currency depreciation
and subsequent economic recession.
1. Review of past episodes of lower oil prices
Nigerian GDP growth is closely related to the dynamics global oil prices. In order to assess
the macroeconomic outlook in the aftermaths of the oil price shock in 2014, past episodes
of oil price downfalls and their impact in terms of economic performances and of policies’
changes are reviewed. Indeed, several variables play a significant role in economic
recovery.
Exhibit 18
GDP and oil prices
Exhibit 19
GDP growth and oil prices
Source: TAC ECONOMICS
Box: Summary of Macroeconomic Adjustments for Past Oil Shocks in Nigeria
1982 Oil Crisis Oil price fell when President S. Shagari was in his third year of Presidency. He
was then ousted in a military coup in 1983 and President M. Buhari formed a
government. Within a year, his rule felt due to a coup and General I.B.
Babangida assumed Presidency from 1985 to 1993.
Meanwhile, the economy registered high inflation and unemployment level;
low foreign exchange reserves could barely cover one month of imports. It was
only as late as 1986 that IMF’s structural adjustment programs were
implemented and the economy slowly bounced back as oil prices too rose.
1999 Oil Crisis In 1999, O. Obasanjo came to power as the first democratically elected
President after the 6 years of General S. Abacha’s rule, considered one of the
most corrupt rulers of Nigerian history. The economy started to improve slowly

Nigerian Cement Industry: Demand
12
Main Drivers of
Cement Demand
in Nigeria:
Increasing urban
population (~50%)
growing twice as fast as
total population (~5%
p.a.)
Major housing gap of
17M houses still
increasing
$3,000bn of investment
required in infrastructure
Housing Deficit - Nigerian housing stock
per capita (units/1000)
-3
2
7
12
17
22
27
32
37
42
2005
2006
2007
2008
2009
2010
2011
2012
2013
2014
2015
Housing stock per capita Ideal
Infrastructure stock (%)
0%
20%
40%
60%
80%
100%
Nig
eri
a
Bra
zil
India
Chin
a
So
uth
Afr
ica
Indo
nesia
Po
lan
d
State of Infrastructure Benchmark
Source: National Planning CommissionSource: Chapel Hill Denham Research
Cement consumption per capita (kg) in 2015
125 150 180 210
430
600
970
400
560
0
200
400
600
800
1,000
1,200
Nigeria Senegal Algeria Libya GlobalAverage
Source: Global Cement Magazine, 2015
% of Construction in GDP
2010 2011 2012 2013 2014 2015
Non-construction Construction

Nigerian Cement Industry: Overview
13
GDP vs Cement
Growth
• Strong boom in
cement
consumption
between 2005-2013
(CAGR 9,7%)
• Cement market
stabilized around
21mt between
2013-2016
• Cement growth in
Nigeria at an avg
premium to GDP
growth of +2,5%
Source: Lafarge Africa Estimates Source: IMF, TAC, Economics Intelligence Unit, Lafarge Africa Estimates

Cement supply multiplied by 5 in 10 years
14
Cement nominal capacity (mn tonnes)
Source: BMI Research
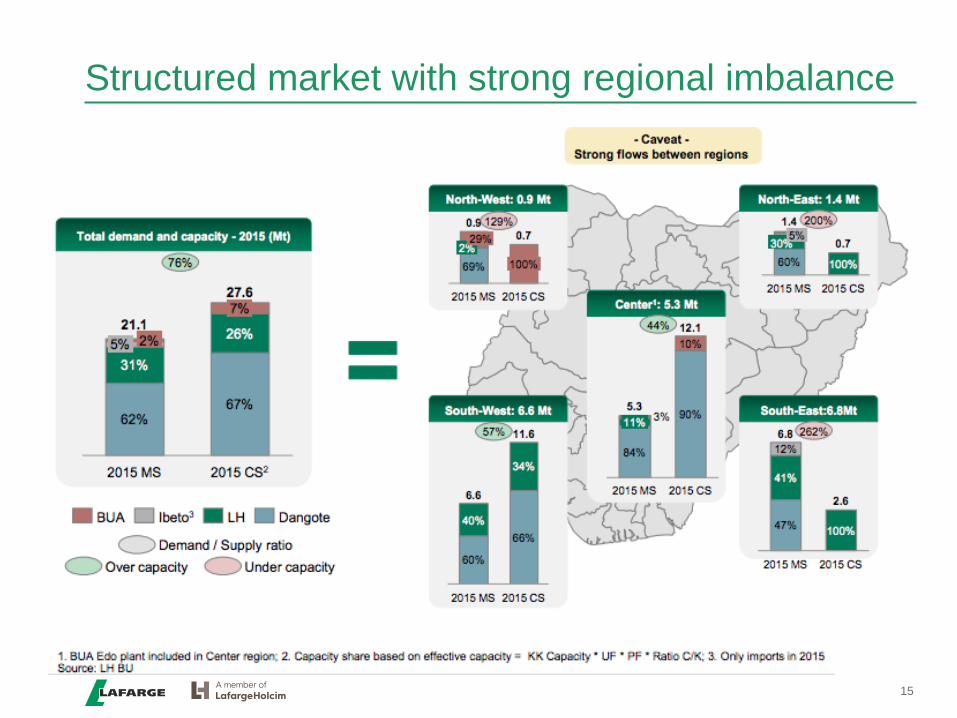
Structured market with strong regional imbalance
15

10.000
15.000
20.000
25.000
30.000
35.000
40.000
45.000
50.000
55.000
60.000
60
80
100
120
140
160
180
200
220
240
260
280
300
jan-14avr-14 jui-14 oct-14 jan-15avr-15 jui-15 oct-15 jan-16avr-16 jui-16 oct-16 jan-17avr-17 jui-17
LHCem
entN
etP
rice(N
GN/t)
LHCementNetPrice(CHF/t)
LHNetPrice(USD)@CBNRate LHNetPrice(USD)@AvgRate LHNetPrice(NGN)
Rational price changes and at the right level
16
BUA Sokoto 2
announcement
BUA Edo
Launch

Financial Overview

2016 Performance: Perfect Storm (1/2)
18
CAGR: 25.7% CAGR: 5.6%
Revenue (N’bn) and y-o-y growth Gross Profit (N’bn) and GP Margin
Source: Lafarge Africa PLC Audited Financials
88
206
261 267
220
41%
134%
27%
2%
-18%
-40%
0%
40%
80%
120%
160%
-
50
100
150
200
250
300
2012 2013 2014 2015 2016
Revenue % Growth
33
67
83 83
41
37%33%
32%
31%
19%
0%
40%
-
10
20
30
40
50
60
70
80
90
2012 2013 2014 2015 2016
Gross Profit Margin
EBITDA (N’bn) and EBITDA Margin PBT (N’bn) and PBT Margin
21
64
40
29
(23)
24%
31%
15% 11%
-10%
-40%
0%
40%
(40)
(20)
-
20
40
60
80
2012 2013 2014 2015 2016
PBT PBT Margin
32
56
69 68
26
36%
27%27% 25%
12%
0%
40%
-
10
20
30
40
50
60
70
80
2012 2013 2014 2015 2016
EBITA EBITA Margin

2016 Performance: Perfect Storm (2/2)
19Source: Lafarge Africa PLC Audited Financials
Total Debt (N’bn) Net Debt (N’bn)
Total Assets (N’bn) Shareholders Funds (N’bn)
37 28
121
148
128
2012 2013 2014 2015 2016
28
(6)
101
132
102
2012 2013 2014 2015 2016
152
298
416
452
502
2012 2013 2014 2015 2016
68
171 176 176
249
2012 2013 2014 2015 2016

Turnaround Plan in Nigeria to deliver our ambitions
20
Pricing
Key Indicators
Commercial
Performance
Industrial
Performance
Fuel
Flexibility
FX impact on
Cost
Re-
organisation
Turnaround Enablers
Impact
compared to
Q3 LY
+N16,3 Bn
Market share
sustained
~98% reliability
Stable industrial operations with all running kilns at
optimal levels, in spite of disruption in August in
Mfamosing
Strong contribution from coal, pet-coke and
alternative fuels
SAP implementation, Go live in Q1 2018
South West plants operations optimised
Reduced exposure to FX in our cost, mainly thanks to
higher reliance on coal & AF
N2,5 Bn
15%
improvement
in exposure
On track
Price adjustments in Q1 and April 2017 sustained
Product portfolio optimization on track
Route to market initiatives and Logistics Performance
improvement plan
Impact YTD
+N66 Bn
Market
share
improvement
N6,1 Bn
12,6%
improvement
in exposure
Unaudited Quarter 3 & 9 Months Results 2017
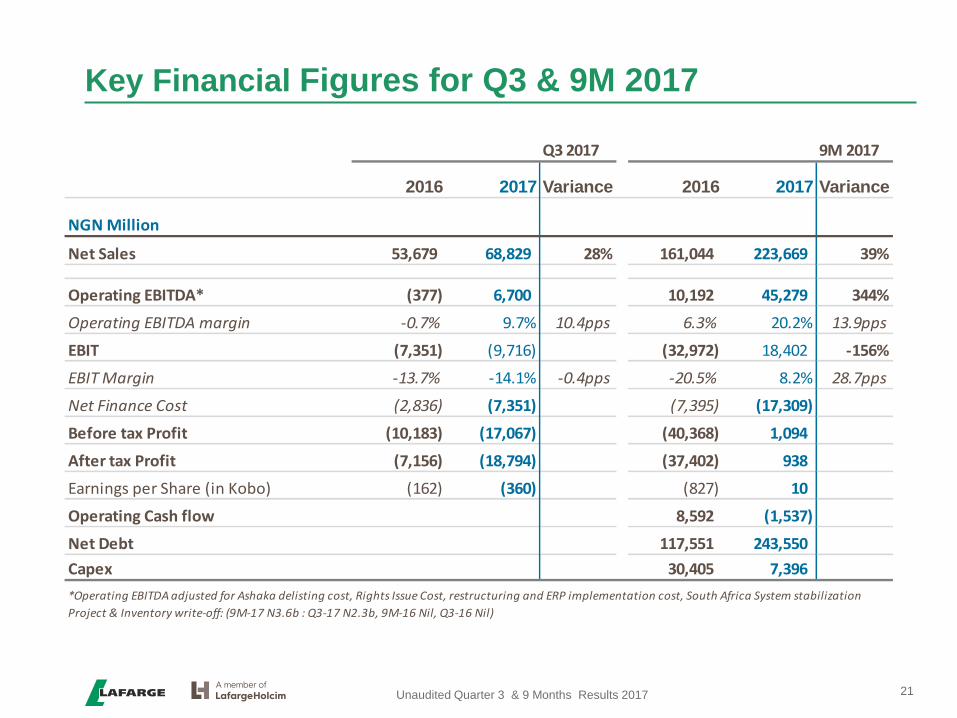
Key Financial Figures for Q3 & 9M 2017
21Unaudited Quarter 3 & 9 Months Results 2017
Q3 2017 9M 2017
2016 2017 Variance 2016 2017 Variance
NGN Million
Net Sales 53,679 68,829 28% 161,044 223,669 39%
Operating EBITDA* (377) 6,700 10,192 45,279 344%
Operating EBITDA margin -0.7% 9.7% 10.4pps 6.3% 20.2% 13.9pps
EBIT (7,351) (9,716) (32,972) 18,402 -156%
EBIT Margin -13.7% -14.1% -0.4pps -20.5% 8.2% 28.7pps
Net Finance Cost (2,836) (7,351) (7,395) (17,309)
Before tax Profit (10,183) (17,067) (40,368) 1,094
After tax Profit (7,156) (18,794) (37,402) 938
Earnings per Share (in Kobo) (162) (360) (827) 10
Operating Cash flow 8,592 (1,537)
Net Debt 117,551 243,550
Capex 30,405 7,396
*Operating EBITDA adjusted for Ashaka delisting cost, Rights Issue Cost, restructuring and ERP implementation cost, South Africa System stabilization
Project & Inventory write-off: (9M-17 N3.6b : Q3-17 N2.3b, 9M-16 Nil, Q3-16 Nil)

Nigeria Operations – Strong operational performance
22
Lafarge Africa Staff
Unaudited Quarter 3 & 9 Months Results 2017
Q3 2017 9M 2017
2016 2017 Variance 2016 2017 Variance
Cement (kt) 1,015 936 -7.8% 4,093 3,401 -16.9%
ReadyMix (km3) 41 41 0.0% 144 143 -0.7%
NGN Million
Net Sales 30,703 44,191 44% 107,406 155,611 45%
Operating EBITDA* (1,440) 12,198 8,619 49,873 479%
Operating EBITDA margin -4.7% 27.6% 32.3pps 8.0% 32.0%
EBIT (6,911) (2,331) (32,023) 26,779
EBIT Margin -22.5% -5.3% 17.2pps -29.8% 17.2%
Net Finance Cost** (2,697) (6,902) (6,660) (16,132)
Before tax Profit (9,608) (9,233) (38,683) 10,647
After tax Profit (7,276) (13,780) (36,796) 6,847
**S,G&A** inclusive of ERP Implementation cost, Ashaka delisting, Rights Issue and other resturcturing costs
**Net finance cost driven by finance charges on the shareholder loans & other borrowings
*Operating EBITDA adjusted for Ashaka delisting cost, Rights Issue Cost, restructuring and ERP implementation cost: (9M-17 N2.7b : Q3-17 N1.4b, 9M-16
Nil, Q3-16 Nil)
SG& A expenses higher than LY, due to SAP implementation cost & training of users across the business

Nigeria Operating EBITDA* 9M 2017 vs. LY
23
In N’ B
*Operating EBITDA adjusted for Ashaka delisting cost, Rights Issue Cost, restructuring and ERP implementation cost
Unaudited Quarter 3 & 9 Months Results 2017
8,6
49,9
-6,3
66,3
-17,1
-5,0 6,11,6 -4,3
OpEBITDA9M 2016
Volume Price Inflation andFX
Distribution Energy RawMaterials &
Others
Fixed costs OpEBITDA9M 2017

South Africa Operations
24
Lafarge Africa Staff
SA operations adversely impacted by:
Operational challenges at our Lichtenburg plant
On-going stabilization of SAP system implemented in January
Unaudited Quarter 3 & 9 Months Results 2017
Q3 2017 9M 2017
2016 2017 Variance 2016 2017 Variance
NGN Million
Net Sales 22,977 24,638 7% 53,638 68,058 27%
Operating EBITDA* 1,064 (5,498) 1,573 (4,593)
Operating EBITDA margin 4.6% -22.3% -26.9pps 2.9% -6.7% -9.7pps
EBIT (441) (7,385) (950) (8,377)
EBIT Margin -1.9% -30.0% -28.1pps -1.8% -12.3% -10.5pps
Net Finance Cost** (138) (449) (735) (1,176)
Before tax Profit (576) (7,834) (1,684) (9,553)
After tax Profit 120 (5,015) (606) (5,910)
*Operating EBITDA adjusted for ERP Stabilization project cost & inventory write-off: (9M-17 N0.88b : Q3-17 N0.88b, 9M-16 Nil, Q3-16 Nil)

Operating EBITDA to Net Income
25Unaudited Quarter 3 & 9 Months Results 2017
Q3 2017 9M 2017
NGN Million 2016 2017 Variance 2016 2017 Variance
Operating EBITDA* (377) 6,700 10,192 45,279
Depreciation & Amortisation (4,642) (4,802) (12,288) (16,174) -
One-Offs Adjustment - (2,280) - (3,614)
Current Operating income (5,019) (383) (2,096) 25,491 -
Net other operating income /(expenses) (2,332) (9,333) (30,876) (7,089) -
EBIT (7,351) (9,716) (32,972) 18,402
Net finance costs (2,836) (7,351) (7,395) (17,309) -
Share of net income from associates 3 - - -
Profit before Tax (10,183) (17,067) (40,368) 1,094 -
Income tax 3,027 (1,728) 2,965 (156) -
Profit after Tax (7,156) (18,794) (37,402) 938 -*Operating EBITDA adjusted for Ashaka delisting cost, Rights Issue Cost, restructuring and ERP implementation cost, South Africa System
stabilization Project & Inventory write-off: (9M-17 N3.6b : Q3-17 N2.3b, 9M-16 Nil, Q3-16 Nil)

Net Financial Debt Dec 2016 to September 2017
26
Net Debt (N’B)
South Africa debt included in Net debt position
Net debt position in Nigeria is N227 Billion (Net borrowing is largely 220mUSD converted from Quasiequity to loan)
Nigeria position is expected to improve to <N200 Billion by year-end after the Right Issue
Unaudited Quarter 3 & 9 Months Results 2017
**
* Excl Quasi Equity Instrument

Business Outlook

Cement market demand in Nigeria is expected to recover slightly in Q4 2017, to close theyear -14% to -12%, lower than LY :
Overall market rebound expected in Q1 2018
Sizeable infrastructure investments are foreseen to be initiated and executed from Q1 2018
Current low consumption per capita
Industrial & operational performance expected to remain stable in Nigeria
Stable pricing environment in Nigeria for Q4 2017 and Volume trend to reflect seasonality effect
On-going Logistic and Industrial Performance Improvement plan to deliver
Target EBITDA margin in mid-30s is expected to be achieved
Cement market in South Africa is expected to close the year lower, however:
Industrial stabilization team in place to ensure plant is operational
Cost containment programs in place
SAP stabilization process in place, with learning points established for other entities
Financial restructuring to be completed by year-end
Rights issue of N131,7 billion at a price of 42,5N/share to be concluded by Year-End
Commercial Paper of N25 billion to be completed beginning of November
Net Debt position for Nigeria to improve, to close the year at < N200 Billion
Expansion plans on track
Ashaka power plant on track to be delivered in Q4 2018
Outlook
28

Lafarge Africa: Key Investment Highlights
29
• The only vertically-integrated Cement Company in Nigeria
• Growing Aggregates & Concrete penetration
• Diversified Cement Product Line
Vertical Integration
• Strong track record of profitability with an annual CAGR of
33.5% from N8.5 billion in 2011 to N28.6 billion in 2015.
• Strong H1 2017 recovery with N19.7 billion net income from
operating loss in 2016 given the impact of naira devaluation
Consistent Profitability
Business reorganization to produce cost and revenue
synergies, driven by:
Optimising route to market,
Supplier Rationalisation,
Fixed-Cost Dilution from Mfamosing 2, etc.
Cost and Revenue Synergies
Regional diversification strengthening competitive position
and mitigating country-specific cycles
Regional Diversification
Leverages on the expertise of the Lafarge Holcim Group,
the Global Industry Leader, with access to:
World-Class R&D facilities (Lyon, France)
Global Best Practices, and
Wide product portfolio/knowledge
Access to Group Expertise
Resilient demand drivers for Building Materials including
the N117bn Marshall Plan for the North East, and FGN
infrastructure budgetary spend
Strong Industry Demand Drivers
Strong presence in Africa’s two largest economies –
Nigeria and South Africa
Strong Presence in Africa
Lafarge Africa is rated by two leading credit rating agencies:
A+ by Global Credit Ratings Co,
A+ by Agusto a& Co
Strong Credit Ratings

Rights Issue –Transaction Summary

Right Issue terms
31
Offering structure• Listing of new ordinary shares on the Nigerian Stock Exchange
• Issuer is Lafarge Africa Plc.
Offering size • N131,65bn through an offering of 3,098 million new ordinary shares
Subscription price • N42,5 per new shares - discount of 17,5% to closing price of 22nd Sept. 2017
Subscription ratio • Subscription ratio of 5 rights for every 9 shares held as at November 1, 2017
Use of proceeds
• Any convertible loan; shareholder loan or any other loan facility is due from the
company are authorized to apply for any shares subscribed for.
• The rights issue is being undertaken to de-leverage Lafarge Africa’s balance sheet,
finance working capital and the expansion of operations
Key dates• Qualification Date: November 1, 2017
• Rights trading and subscription period : November 24, 2017 to December 15, 2017
Issuing Houses• Lead Issuing House : Chapel Hill Denham Advisory Ltd
• Joint Issuing House : Standard Chartered Capital & Advisory Nigeria Ltd

Rights Issue Impact on Lafarge Africa
32
Rights Issue Impact
• Debt restructuring through the
rights issue reduces the impact
FX volatility has on Lafarge
Africa’s earnings
• Greater headroom to raise
additional capital to further
capitalize on the emerging
opportunities in Africa.
• Cashflow preservation-
reduction in interest expense
• Short term liquidity support
through financing working
capital
Deleveraged Balance Sheet
Headroom for Additional
Capital
Cashflow Preservation
Improved Liquidity

Lafarge Africa – Trading Performance
High
(N)Low (N) VWAP (N)
Share price
volatility
30 day 58 48.58 50.8054 2.35%
60 day 63 48.54 53.0098 2.10%
90 day 63 48.54 55.0245 2.62%
120 day 63 48.54 54.6579 2.48%
6 month 63 46.00 53.2889 2.54%
1 year 63 34.50 49.0804 2.82%
Market cap (N
billion) 307.469
RI Size (N billion) 131.7
RI size as % of
Market Cap 42.83%
Key statistics (as at 17 October 2017)
Description #
Share Price (N) 56.00
Shares outstanding ( billion) 5.49
Market cap (N ‘billions) 307.469
P/E 4.37
P/BV (2016) 3.99
Free float liquidity 35.76%
VWAP analysis
The volume
weighted average
price provides a
sense of trading
momentum on the
stock
The recent trading
performance of
Lafarge on the NSE
will be a core
benchmark for
shareholders
considering
participation in the
Rights Issue
30
35
40
45
50
55
60
65
0
20,000
40,000
60,000
80,000
100,000
120,000
Sep-16 Nov-16 Jan-17 Mar-17 May-17 Jul-17 Sep-17
Volume Traded Price 30 day VWAP 60 day VWAP
90 day VWAP 120 day VWAP 6 month VWAP 1 year VWAP

Lafarge Africa – Shareholder Options
5 for 9 rights issue
Investor holding 9 shares receives 5 rights
Sells the 5 rights
on the NSE to a
new investor No action taken
Accepts and
Subscribes to 5
new shares at the
rights price
New investor
subscribes for 5
new shares at
rights price
Unsubscribed
shares allotted to
shareholders who
applied for
additional rights
Issuer allots 5 new shares
• Subscription Ratio: Existing
shareholders receive subscription
rights based on their shareholding.
5 for 9 means shareholder receives
5 rights for every 9 shares they
own
• Oversubscription: When existing
shareholders apply for additional
rights above and beyond all the
shares available in the issue
• Partial subscription: When a
shareholder takes up some but not
all of their provisional rights
allocation
• Renunciation: When a shareholder
does not take up their rights
• Trade in Rights: When a
shareholder trades their right to
another investor
Shareholder
earns premium
on rights traded

LafargeHolcim
Group1
Ownership Structure Before & After Rights Issue
73% 27%
Subsidiary
Division
35
Lafarge Africa Plc
1Related entities before Ashaka Scheme of Arrangements ( Court Order Meeting October 23rd, 2017)2 Ownership will depend on subscription during the rights issue
Before Rights Issue
Minority
Shareholders
After Rights Issue
Egyptian
Cement
Holding BV.
100%
100%
100%86.51% 100%100%
LafargeHolcim
Group2
Minority
Shareholders
100%
72.4%
35%
Lafarge
ReadyMix
Nigeria Ltd
AshakaCem Atlas
Lafarge
South Africa
Holding
South
African
Operations
West
Operations
Nigeria
Cement
Holding BV.
UniCem
East & West
Operations
Lafarge
ReadyMix
Nigeria Ltd
AshakaCem
Lafarge
South Africa
Holding
72.4%
South
African
Operations
100% 100% 100%
Lafarge Africa Plc
CBI Ghana CBI Ghana35%
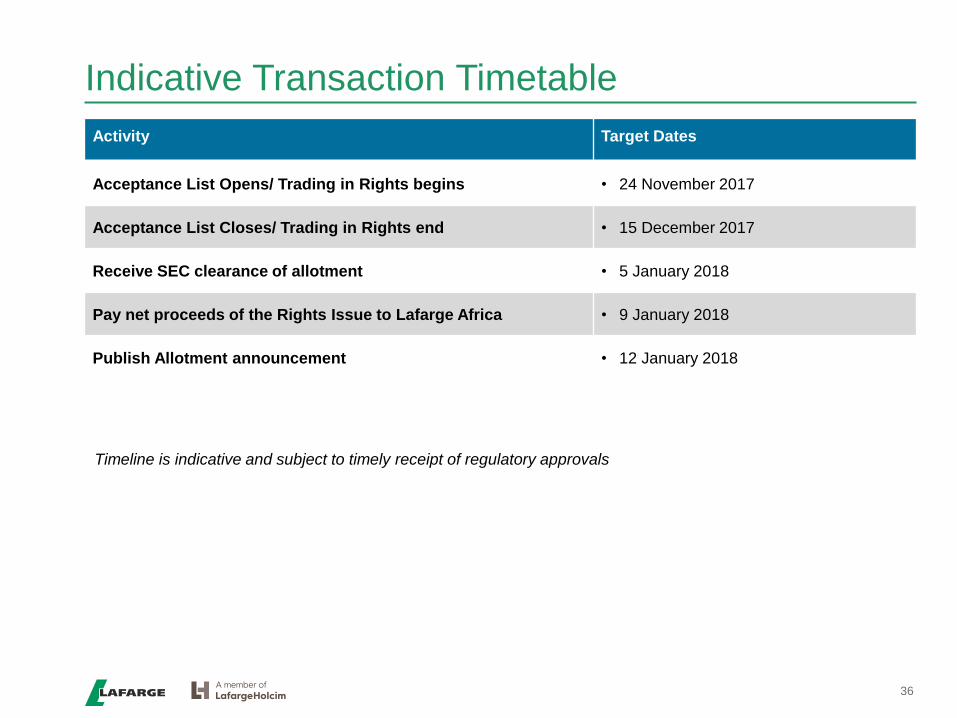
Indicative Transaction Timetable
36
Activity Target Dates
Acceptance List Opens/ Trading in Rights begins • 24 November 2017
Acceptance List Closes/ Trading in Rights end • 15 December 2017
Receive SEC clearance of allotment • 5 January 2018
Pay net proceeds of the Rights Issue to Lafarge Africa • 9 January 2018
Publish Allotment announcement • 12 January 2018
Timeline is indicative and subject to timely receipt of regulatory approvals

Thank You

Appendix
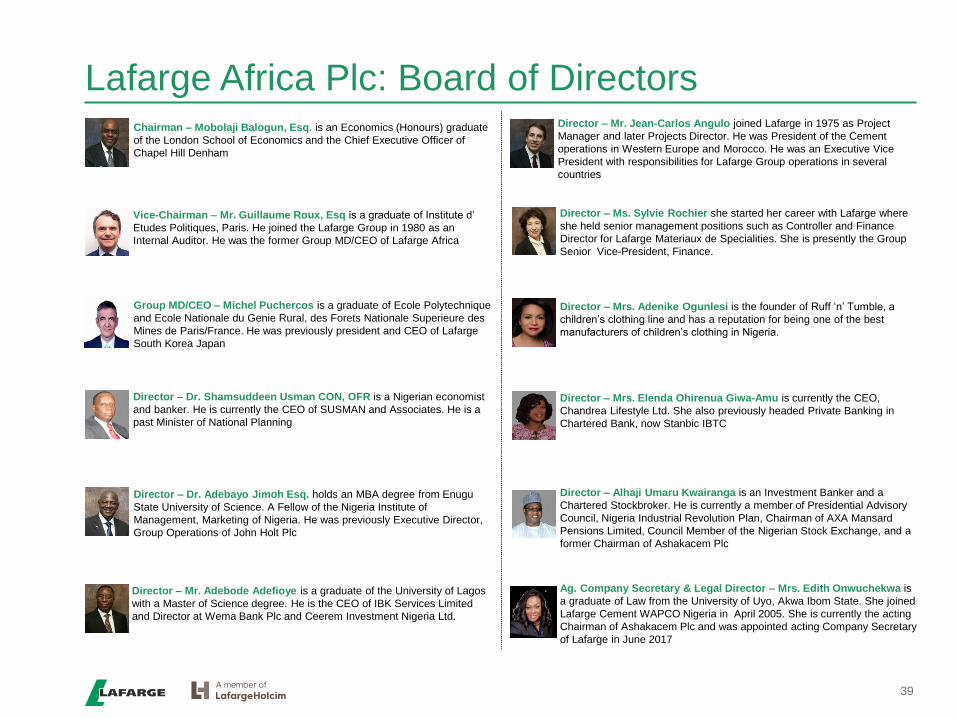
Lafarge Africa Plc: Board of DirectorsChairman – Mobolaji Balogun, Esq. is an Economics (Honours) graduate
of the London School of Economics and the Chief Executive Officer of
Chapel Hill Denham
Vice-Chairman – Mr. Guillaume Roux, Esq is a graduate of Institute d’
Etudes Politiques, Paris. He joined the Lafarge Group in 1980 as an
Internal Auditor. He was the former Group MD/CEO of Lafarge Africa
Director – Dr. Adebayo Jimoh Esq. holds an MBA degree from Enugu
State University of Science. A Fellow of the Nigeria Institute of
Management, Marketing of Nigeria. He was previously Executive Director,
Group Operations of John Holt Plc
Director – Ms. Sylvie Rochier she started her career with Lafarge where
she held senior management positions such as Controller and Finance
Director for Lafarge Materiaux de Specialities. She is presently the Group
Senior Vice-President, Finance.
Director – Mr. Jean-Carlos Angulo joined Lafarge in 1975 as Project
Manager and later Projects Director. He was President of the Cement
operations in Western Europe and Morocco. He was an Executive Vice
President with responsibilities for Lafarge Group operations in several
countries
Director – Mr. Adebode Adefioye is a graduate of the University of Lagos
with a Master of Science degree. He is the CEO of IBK Services Limited
and Director at Wema Bank Plc and Ceerem Investment Nigeria Ltd.
Director – Dr. Shamsuddeen Usman CON, OFR is a Nigerian economist
and banker. He is currently the CEO of SUSMAN and Associates. He is a
past Minister of National Planning
Director – Mrs. Adenike Ogunlesi is the founder of Ruff ‘n’ Tumble, a
children’s clothing line and has a reputation for being one of the best
manufacturers of children’s clothing in Nigeria.
Director – Mrs. Elenda Ohirenua Giwa-Amu is currently the CEO,
Chandrea Lifestyle Ltd. She also previously headed Private Banking in
Chartered Bank, now Stanbic IBTC
Director – Alhaji Umaru Kwairanga is an Investment Banker and a
Chartered Stockbroker. He is currently a member of Presidential Advisory
Council, Nigeria Industrial Revolution Plan, Chairman of AXA Mansard
Pensions Limited, Council Member of the Nigerian Stock Exchange, and a
former Chairman of Ashakacem Plc
Group MD/CEO – Michel Puchercos is a graduate of Ecole Polytechnique
and Ecole Nationale du Genie Rural, des Forets Nationale Superieure des
Mines de Paris/France. He was previously president and CEO of Lafarge
South Korea Japan
Ag. Company Secretary & Legal Director – Mrs. Edith Onwuchekwa is
a graduate of Law from the University of Uyo, Akwa Ibom State. She joined
Lafarge Cement WAPCO Nigeria in April 2005. She is currently the acting
Chairman of Ashakacem Plc and was appointed acting Company Secretary
of Lafarge in June 2017
39

Lafarge Africa Plc: Key Management
40
Bruno is a Mechanical Engineer graduate, a safety professional
and an alumnus of London Business School.
He joined Lafarge in the Middle East and Africa Regional office
in Cairo and held various senior management positions in
Egypt, France, Malawi, and NigeriaBruno Hounkpati
Logistics Director
Bruno holds a Business Engineering degree from Universite
Catholique de Louvain-la-Neuve in Belgium, and completed his
Master’s in Business Administration at Georgetown University,
specialising in Financial Risks Management
Mr. Bayet joined Lafarge in 2013 as a director in AshakaCem
Plc and added the role of Chief Financial Officer in September
2014
Bruno Bayet
Chief Financial Officer
Abdel-Ileh holds MBA from Georgetown University, Washington
D.C. and a post graduate degree in Financial Risks
Management with honours
He started his career as a Project Engineer with Lafarge in
1998 and has held various key positions in operations including
Production Manager and Plant Manager. In 2012, he became
the H&S Director, a role he held until 2015 when he was
appointed Director of Concrete Operations for Lafarge Morocco
Abdel-lleh Chouar
Industrial Director –
Cement
Michel Pucheros was appointed on 16th March 2016
He was the past MD at Bamburi Cement from September 2005 to 2009 and then appointed President and
CEO of Lafarge South Korea Japan OperationsMichel Puchercos
Group MD/CEO
He has over 35 years work experience spanning several
countries and several industries.
He joined Lafarge India and later moved into East Africa on
Technical Partnership support covering countries like Kenya,
Tanzania and Malawi.
Vipul joined Unicem in 2006 and worked as Marketing &
Technical Assistance capacity on the Excom of the BU, before
the eventual merger in 2015. He was appointed Acting
Marketing Director in May 2016
Vipul Agrawal
Marketing Director
He holds a Master of Business Administration from Heriot-Watt
University, Edinburgh and a Bachelor of Arts in Economics
from the University of Essex, Colchester.
Lolu joined Lafarge as the CFO for Lafarge WAPCO. Lolu Alade-Akinyemi
Procurement Director
She holds several degrees including M.Sc (Sociology) and
Masters in Business Administration
She joined Lafarge in December 2010 and prior to this was
General Manger, HRFidelia Osime
Organization and Human
Resource Director
She holds a Bachelor of Accounting degree from London
Guildhall and a Masters of Business Administration from the
Open University, Milton Keynes, UK
She was appointed as Director of Communications, Public
Affairs & Sustainable Development, Lafarge Africa Plc in
October 2016
Folashade Ambrose
Medebem
Communications, Public
Affairs & Sustainable
Development Director
Marlene has a BA, International Business and Marketing from
NEGOCIA ACI (Academie Commerciale Internationale) in Paris
as well as a General Management Progam from Harvard
Business School
She joined the organisation in January 2016 as Sales Director,
Key Accounts & IHB Precast Segment
Marlene Kiniffo-Zounon
Sales Director

41
Rabiu is a graduate of Accounting from Bayero University Kano
as well as General Management Program from Harvard
Business School
He joined Lafarge Nigeria in June 2014 as the Energy and
Power Director, and is currently the Managing Director Ashaka
Cem
Rabiu Umar
Managing Director,
Ashaka
Raymond joined LafargeHolcim Group Qatar- the Qatar
Readymix Group, as the Company Manager of both the quarry
company and the trading / transport company. Raymond was
then promoted to the role of Industrial Manager for the
aggregates business in South Africa.
Prior to this, he worked for Hanson Aggregates (now part of the
Heidelberg Cement Group) for 17 years in a range of line
management roles
Raymond Chambers
Head of Aggregates &
Concrete
Lafarge Africa Plc: Key Management (cont’d)
Edith is a graduate of Law 1997 (LLB)
She is a member of the Institute of Chartered Secretaries and
Administrators UK
She joined Lafarge WAPCO in 2005 and later became
Company Secretary/Legal Adviser of the Company in 2008
In 2011 moved to the Regional office in Cairo, Egypt as Legal
Counsel Sub-Saharan Africa and currently Lafarge Africa
General Counsel/Public Affairs Director
Edith Onwuchekwa
Legal & Public Affairs
Director
Helmut holds an Executive MBA (2006) from California State
University
He started his professional career as a military infantry officer
in Austria which included a number of command and staff
positions at home as well as overseas. Mr Korak resigned from
the armed forces in 2001 and became a diplomat appointed to
the Organization for Security and Co-operation in Europe
He joined Lafarge Africa in July 2016
Helmut Korak
Country Security
Manager
Graeme has a Mechanical Engineering degree from University
of Birmingham and an MBA from Manchester Business School.
He has over twenty years industrial experience in the power,
sugar and cement business. The last thirteen of these have
been spent in Asia and Africa in Cement.
In Lafarge, he has held manufacturing roles in plant line
management, head office and regional coordination.
Graeme Bride
Health and Safety
Director
42
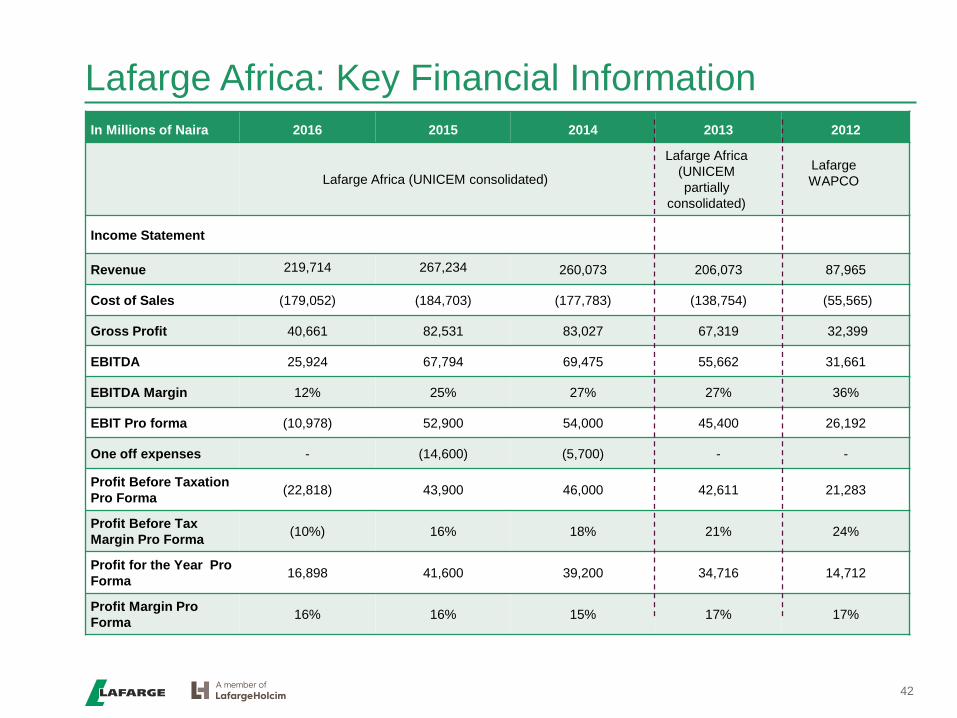
Lafarge Africa: Key Financial Information
In Millions of Naira 2016 2015 2014 2013 2012
Lafarge Africa (UNICEM consolidated)
Lafarge Africa
(UNICEM
partially
consolidated)
Lafarge
WAPCO
Income Statement
Revenue 219,714 267,234 260,073 206,073 87,965
Cost of Sales (179,052) (184,703) (177,783) (138,754) (55,565)
Gross Profit 40,661 82,531 83,027 67,319 32,399
EBITDA 25,924 67,794 69,475 55,662 31,661
EBITDA Margin 12% 25% 27% 27% 36%
EBIT Pro forma (10,978) 52,900 54,000 45,400 26,192
One off expenses - (14,600) (5,700) - -
Profit Before Taxation
Pro Forma(22,818) 43,900 46,000 42,611 21,283
Profit Before Tax
Margin Pro Forma(10%) 16% 18% 21% 24%
Profit for the Year Pro
Forma16,898 41,600 39,200 34,716 14,712
Profit Margin Pro
Forma16% 16% 15% 17% 17%
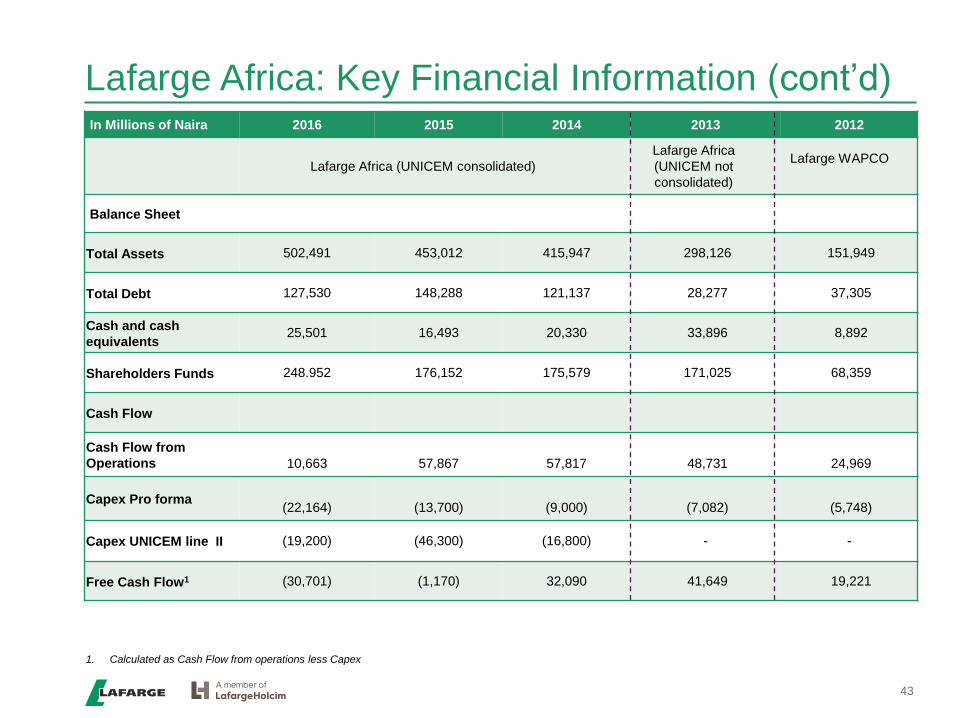
Lafarge Africa: Key Financial Information (cont’d)
43
In Millions of Naira 2016 2015 2014 2013 2012
Lafarge Africa (UNICEM consolidated)
Lafarge Africa
(UNICEM not
consolidated)
Lafarge WAPCO
Balance Sheet
Total Assets 502,491 453,012 415,947 298,126 151,949
Total Debt 127,530 148,288 121,137 28,277 37,305
Cash and cash
equivalents25,501 16,493 20,330 33,896 8,892
Shareholders Funds 248.952 176,152 175,579 171,025 68,359
Cash Flow
Cash Flow from
Operations 10,663 57,867 57,817 48,731 24,969
Capex Pro forma(22,164) (13,700) (9,000) (7,082) (5,748)
Capex UNICEM line II (19,200) (46,300) (16,800) - -
Free Cash Flow1 (30,701) (1,170) 32,090 41,649 19,221
1. Calculated as Cash Flow from operations less Capex
Contact Us
44
Kemi Awodein
Email:
Mobile: + 234 802 242 7729
Michelle Akinrinade
Email:
Mobile: +234 802 242 7750
Yemisi Deji - Bejide
Email:
Mobile: +234 802 3188 781
Yetunde Falore
Email:
Mobile: +234 703 480 9132
Wole Adeleke
Email: [email protected]
Mobile: + 234 802 3641894
Damilola Oni
Email: [email protected]
Mobile: +234 701 583 4293
27B Gerrard Road
Ikoyi
Lagos
Telephone: +234 1 271 3990
1st Floor, 45 Saka Tinubu Street
P.O. Box 74520
Victoria Island
Lagos
Telephone: +234 1 279 9563/4
142 Ahmadu Bello Way
Victoria Island
Lagos
Telephone: +234 1 236 8374
