lagos - eaumega in 2015 is 23,305,971 ... 1996). development in lagos state is so rapid that ......
TRANSCRIPT

1
LAGOS
The Lagos Megacity
Akomeno U. Oteri1
Rasheed A. Ayeni2
1. Director, Akute Geo-Resource Ltd
2. Director, Hanorado Global Solutions Nig Ltd

2
Part A
CHAPTER 1
Introduction
Geography
Lagos State is located on the south-western part of Nigeria on the narrow coastal flood
plain of the Bight of Benin. It lies approximately between longitude 2o 42’E and 3o 22’E
and between latitude 6o 22’N and 6o 42’ N. It is bounded in the North and East by
Ogun State of Nigeria, in the West by the Republic of Benin, and in the South by the
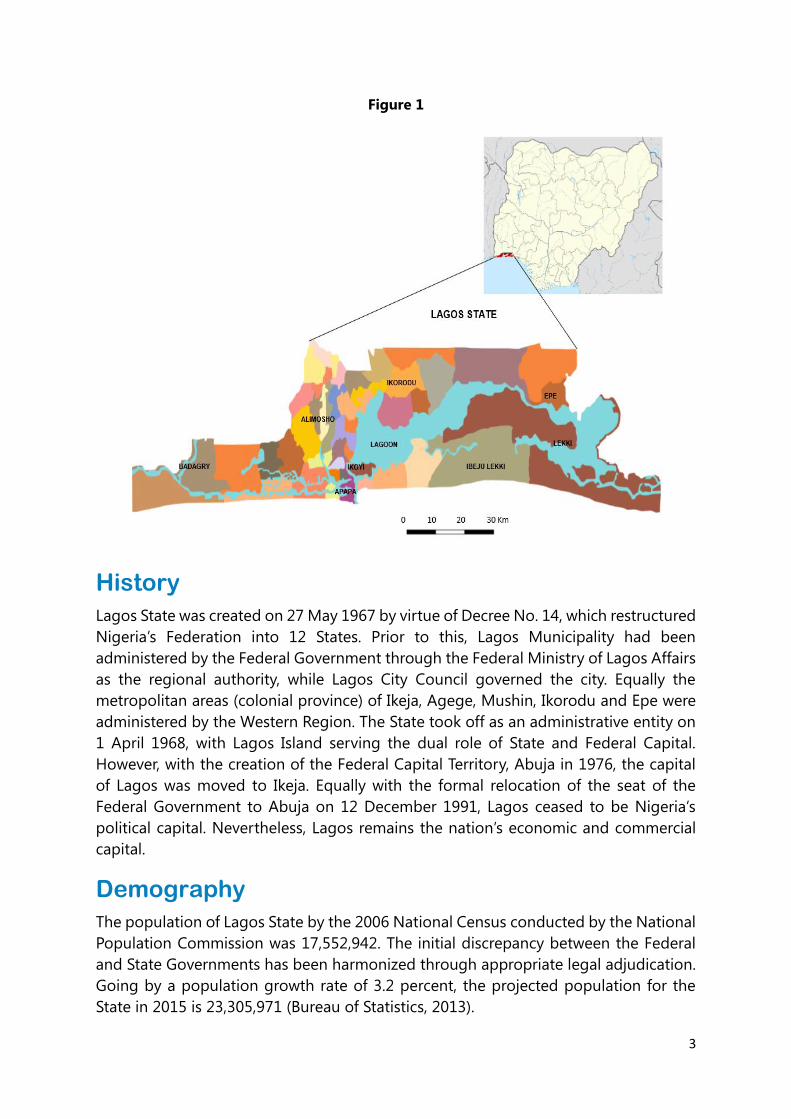
Atlantic Ocean. It has five administrative divisions of Ikeja, Badagry, Ikorodu, Lagos
Island and Epe which were subdivided to 20 Local Government Areas (LGAs) during
the creation of States and LGAs in Nigeria in 1999. Presently, there has been a creation
by the State Government of 37 Local Council Development Areas (LCDA) in addition to
the 20 LGAs making a total of 57 Local government administrative units. Territorially,
Lagos State encompasses an area of 358,862 hectares or 3,577 sq.km which is about
0.4 percent of the total land area of Nigeria (Figure 1).
Lagos State has a coastline 180 km long. Underlain by sedimentary rocks; it is on a
coastal plain characterized by predominantly flat terrain, with an average elevation of
less than 15m above sea level. The land slopes gently from the interior to the sea.
Water bodies and wetlands cover over 40% of the total land area of the State with
lagoons and creeks consisting 22 % of its area. An additional 12% is subject to seasonal
flooding. The coastal areas consist of lagoons, creeks and swamps separated from the
open sea by a strip of sandy land that varies in width from two to sixteen kilometres.
The entrance into Lagos Lagoon is the only major outlet through which the lagoons
and creeks drain into the sea (BNRCC, 2012).
The dominant vegetation of the State is the tropical swamp forest consisting of fresh
water and mangrove swamp forests both of which are influenced by the double rainfall
pattern of the State, which makes the environment a wetland region, hence, the
reference to Lagos as an environment of aquatic splendour. Its wetland environment is
characterized by rich alluvial and terrallitic red-yellow soil, on which would be found
dense luxuriant undergrowth, climbers, epiphytes and tropical hard woods (LASG, -
www.lagosstate.gov.ng –Information for Visitors).
3
Figure 1
History
Lagos State was created on 27 May 1967 by virtue of Decree No. 14, which restructured
Nigeria’s Federation into 12 States. Prior to this, Lagos Municipality had been
administered by the Federal Government through the Federal Ministry of Lagos Affairs
as the regional authority, while Lagos City Council governed the city. Equally the
metropolitan areas (colonial province) of Ikeja, Agege, Mushin, Ikorodu and Epe were
administered by the Western Region. The State took off as an administrative entity on
1 April 1968, with Lagos Island serving the dual role of State and Federal Capital.
However, with the creation of the Federal Capital Territory, Abuja in 1976, the capital
of Lagos was moved to Ikeja. Equally with the formal relocation of the seat of the
Federal Government to Abuja on 12 December 1991, Lagos ceased to be Nigeria’s
political capital. Nevertheless, Lagos remains the nation’s economic and commercial
capital.
Demography
The population of Lagos State by the 2006 National Census conducted by the National
Population Commission was 17,552,942. The initial discrepancy between the Federal
and State Governments has been harmonized through appropriate legal adjudication.
Going by a population growth rate of 3.2 percent, the projected population for the
State in 2015 is 23,305,971 (Bureau of Statistics, 2013).

4
Megacity: A mega-city by definition is a continuous urbanized area with population of
at least 10 million people (UNCHS, 1996). Development in Lagos State is so rapid that
the metropolitan area has expanded and absorbed the once rural communities. Hence
Lagos can be best described as a City – State. The population of the State has been
above 10 million people since the 2006 National census. Lagos State therefore qualifies
to be called a megacity - a Lagos megacity. Some four LGAs of Ogun State, adjoining
Lagos State have fused in to Lagos State forming Lagos Megacity Region (LMCR). In
terms of water issues – water supply, waste water and storm water, these four LGAs
have a lot of impact on Lagos State. In this monograph, the Lagos megacity not the
Lagos megacity region will be the bone of discussion.
Lagos megacity contains urban, semi–urban and rural communities, though rapid
expansion and development is changing the distribution rapidly. Urban areas are those
with a population greater than 20,000, semi-urban areas are those with a population
of between 5000 and 20,000 while rural areas are those communities with a population
of less than 5000. Figure 2 shows the classification of communities in Lagos megacity
in 2011. It shows 32.5 percent of the communities to be urban areas.
Figure 2: Classification of Communities in Lagos Megacity, 2011
0
100
200
300
400
500
600
700
800
900
1000
RuralCommunities
Semi-UrbanCommunities
UrbanCommunities
No 947 457 677
No
of
Co
mm
un
itie
s
Source Digest of Statistics, 2013

5
CHAPTER 2 Water Resources
Institutional framework
Nigeria is a Federation with 36 States and the Federal Capital Territory. Water comes
under concurrent legislation. Institutional arrangement as emphasized by the National
Water Policy responds to the vision of equal distribution of water resources between
consumers without compromising the environmental requirements and those of future
generations. A major institutional approach in Nigeria is that of co-operative
governance which recognizes that while many governmental functions are undertaken
on national, state and local levels, there must be a commitment to co-operation
between each level.
The institution responsible for water resources management at the Federal level is the
Federal Ministry of Water Resources (FMWR). Other Ministries and Agencies of the
Federal Government have some form of involvement or the other in the sector.
In Lagos State, the Water Sector is guided by the Lagos Water Sector Law (2004) and
Lagos State Water Sector Policy (2013). The Lagos State Water Sector, as with other
Sectors, has a Governance framework that stands on a tripod in accordance with the
Principles of Integrated Water Resources Management and international best practice.
These are:
Policy development, formulation review, monitoring, and evaluation,
Service Provision; water supply and sanitation/wastewater management and
Regulation.
These three activities though related and intertwined, are actually independent and are
the responsibilities of separate and identifiable Ministries, Departments and Agencies
(MDAs) of Government. While the State Ministry responsible for the Environment is
responsible for Policies and all matters relating thereto, Lagos Water Corporation
(LWC) and the Lagos Wastewater Management Office (LSWMO), other State Agencies
and the Private Sector undertake Service Provision while the Lagos State Water
Regulatory Commission (LSWRC) is responsible for Regulation. Regulations are rules
made by a Government Authority to control conduct either by prescription or directive
to achieve a stated objective. Rural water supply is the preview of the Ministry of Rural
Development.

6
Regulation of the Sector
The Lagos State Government has identified the need to institutionalize a Regulatory
framework to create governance for ordering activities in the State Water and
Sanitation/Wastewater Sector. The overarching Objectives of regulating the Water and
Wastewater Sector Include:
Production efficiency and minimized costs
Allocation efficiency and prices reflect costs
Sustainability and cost recovery/return on capital, reliability and availability
Fairness and level playing field (one regulatory regime for public and private
providers)
Improved access to Service for all and sustained development.
Ground water is unregulated in Nigeria. Boreholes are therefore drilled
indiscriminately, with inadequate data collection and storage, and no limits to amount
of water to be extracted. The Federal Ministry of Water Resources in conjunction with
the Standards Organization of Nigeria (SON) has drafted a Code of Practice for Water
Well Construction in Nigeria (SON, 2010). The code is yet to come into operation. Lagos
State Water Regulatory Commission has also produced a Lagos State Groundwater
Development Regulations - DRAFT – whose implementation is about to commence.
History of Institutional History of Water Development and Management in Lagos
(LWC, 2011, Jideonwo, 2014)
Potable water supply in Lagos started in 1910 with Iju water Waterworks
(capacity of 9160 m3 per day) plus ND 700mm trunk main “A” commissioned in
1915 to serve Lagos Island
Iju upgraded to 27,277 m3 per day with trunk main “B: ND 600 mm to serve
Lagos Island, Apapa and Ebutte-Meta.
Further expansion of Iju works in 1954 to 50,007 m3 per day with third trunk
main “C”, ND 1050 mm constructed in 1962 expanding coverage to
residential/industrial areas of Ikeja, Ikorodu Road via east of metropolis.
Iju modernization in 1982 to 204,574 m3 per day to boost pressure in existing
mains with additional 10 mini waterworks (Capacity 11,183 m3 per day)
Isashi waterworks commissioned in 1977 to serve west of metropolis – Isashi,
Satelite Town to FESTAC town.
Adiyan Phase 1, constructed and commissioned in 1992 under the Lagos Water

7
Supply Expansion project with 80 km trunk mains and other secondary and
tertiary mains and connections.
12.15 MW Independent Power Plant for Iju, Adiyan and Akute.
Construction of Micro Waterworks
Alongside these since 1980 have been provision of water schemes by the construction
of boreholes through National -, and State programmes and others such as the
Millennium Development Goals, Constituency Projects of Legislators at National and
State levels, Local Governments and Private Companies and individuals
Climate
Lagos has a tropical wet and dry climate. It experiences two rainy seasons, with the
heaviest rains falling from April to July and a weaker rainy season from September to
November. There is a brief relatively dry spell in August and a longer dry season from
December to March.
Rainfall varies from one location to the other in Lagos Megacity. Data obtained at six
different locations in the megacity in Table 1 illustrates the variation. The average
rainfall for the years 2000 to 2012 is shown in Figure 3 (from
www.worldweatheronline.com/lagos-weather-averages/lagos/ng.aspx)
Figure 3

8
TABLE 1: RAINFALL IN LAGOS STATE IN 2013.
(Lagos State Ministry of Environment )
Alausa,
Ikeja Meran Badagry
Igbonla,
Epe
Badore,
Lekki
Igbogbo,
Ikorodu
Month mm mm mm mm mm mm
JAN 45.21 46.23 17.018 17.02 21.08 17.02
FEB 74.17 31.24 12.95 59.18 32.77 36.58
MAR 118.62 76.45 39.12 19.56 16.76 14.73
APR 209.80 104.65 97.03 79.50 111.00 78.23
MAY 139.19 138.43 126.49 57.66 99.57 60.71
JUN 435.10 305.56 261.62 144.02 182.37 124.97
JUL 525.53 384.30 284.48 201.68 312.67 221.74
AUG 132.59 254.25 135.38 75.69 52.32 50.29
SEPT 101.09 70.61 256.54 43.69 46.23 96.01
OCT 36.07 14.48 176.53 48.01 23.37 71.88
NOV 65.28 43.43 52.07 54.36 56.13 29.46
DEC 44.20 45.21 26.16 24.89 76.45 26.92
TOTAL 1926.84 1514.86 1485.39 825.25 1030.73 828.55
Highest value of 1926.84 mm was obtained at Alausa, Ikeja with the least value of
825.25 mm being obtained at Igbonla near Epe.
With its high mean annual rainfall, Lagos Megacity has abundant water resources in
the form of surface water (rivers, lagoons, lakes and creeks) and groundwater. The
major surface water bodies are the Lagos-, Ologe – and Lekki - lagoons. Others are
Kuramo Waters and Badagry-, Five Cowries- and Omu -Creeks. The major rivers are
Ogun, Yewa, Aye, Owo, Oworu and Osun (Figure 4).

9
Figure 4: Map of Lagos Area showing the Surface Water Sources
The groundwater is contained in four aquifers in the sedimentary basin: the first and
shallow aquifer, is the Recent Sediments along the Atlantic Sea coast and along river
valleys. It is used for very small private domestic supplies through dug wells and
shallow boreholes. The second and third aquifers are in the Coastal Plains Sands
Formation. They are exploited through dug wells in places, shallow - and deep -
boreholes (maximum depth of 300 m at the coast). These aquifers provide substantial
quantities of water for private-, public- and industrial–water supplies. This is the main
aquifer exploited in Lagos megacity. The fourth aquifer is the deep and highly
productive Abeokuta formation. Only a few boreholes located mainly in Ikeja industrial
area, extract water from the fourth aquifer. The water from this aquifer is hot with
temperatures as high as 80 °C recorded in a few of the boreholes (Coode Blizard Ltd
et al, 1966). This aquifer is undergoing massive development in adjoining Ogun State
in recent times where it is encountered at shallower depths of between 300 to 550 m.
Figure 5 is a north – south geologic cross-section showing various Formations in the
sedimentary basin. In Figure 6, a hydrogeologic cross-section from west to east along

10
the coast shows both the lithologic and water quality variations in the Coastal Plains
Sands and Recent Sediments.
Figure 5: North – South Hydrogeologic Cross – Section of the Benin Sedimentary Basin;
SW Nigeria
Laterite
Sandy Clay
Sand
Clay / Shale
Limestone
Sandy Limestone
LEGEND
Saline Water
Fresh Water
N
0
- 50
- 100
- 150
- 200
- 250
- 300
- 350
- 400
- 450
- 500
- 550
- 600
150
100
50
Elevation (m) Ipara Sagamu RCCG Ikorodu
Lekki
Phase 1
OGUN STATE LAGOS STATE
Atlantic Ocean
S
BASEMENT
COMPLEX
ABEOKUTA
FORMATION
ILARO
FORMATION
EWEKORO FORMATION
COASTAL
PLAINS SANDS

11
Figure 6: West – East Hydrogeological Cross –Section along the Coast of Lagos State
( from Coode Blizard Ltd et al, 1996)
The estimated available water resources in Lagos Megacity are given in Table 2.
Afowo Ojo – 1 Apapa Victoria Island
Lekki Lakowe Akodo
W E
Meters b
elow
sea level ILARO FORMATION
50
0
-50
-
100
-
150
-
200
-
250
-
300
-
350
-
400
-
450
50
0
-50
-
100
-
150
-
200
-
250
-
300
-
350
-
400
-
450
30 20 10 0 Brackish Water
Saline Water
Sand
Clay
Fresh Water
Fault Fault
?
? ? ? ? ?

12
CHAPTER 3
Infrastructure
Water Supply
Public water supply in Lagos megacity is undertaken by the Lagos Water Corporation.
In rural areas of the city as well as peripheral areas, the Ministry of Rural Development
provides water from boreholes mainly through standpipes and to a lesser extent piped
distribution. The water supply equation is completed with inputs from Federal
Government of Nigeria and its agencies, the LGAs / LCDAs, Corporate bodies through
their Community Assistance Programmes (Corporate Social responsibility) and Private
S/N Type Quality of
Water
Source Safe Yield
(Mm3/d)
Surface Area
Km2
1 Surface Water Fresh Ogun River 2.092
2 Oshun River 0.207
3 Yewa River 0.1889
4 Aye River
0.11271
5 Oworu/Solodo 0.0944
6 Brackish Lagos Lagoon 500
7 Badagry Creek 200
( part in Benin Repu.)
8 Lekki Lagoon 300
9 Ologe Lagoon 64
Ground Water Fresh Groundwater Modeled aquifer through put
10 650,000 m3
Table 2: Water Resources of Lagos Megacity
Surface water data from LWC (2011), Groundwater data from Coode Blizard Ltd et al
(1996)
13
Individuals. In Lagos, the total water demand is estimated at 2.452 million cubic metres
per day (Mm3/d) using per capita water demand at 0.136 m3/d. Water production by
the Lagos Water Corporation is 0.9534 Mm3/d (LWC, 2011). The demand gap of
1.498 Mm3/d is met by individuals mainly through dug wells and boreholes (Table 3).
Industrial water supply demand and to a lesser extent agricultural demand are not
included in this estimate. Industrial water supply is predominantly if not fully from
groundwater. The water from the Lagos Water Corporation is of good quality and
conforms to the Nigerian Standard for Drinking Water Quality (NSDQW) for potable
water at the point of production. Quality impairment does occur as the water goes
through the transmission system and usage (home –point of usage).
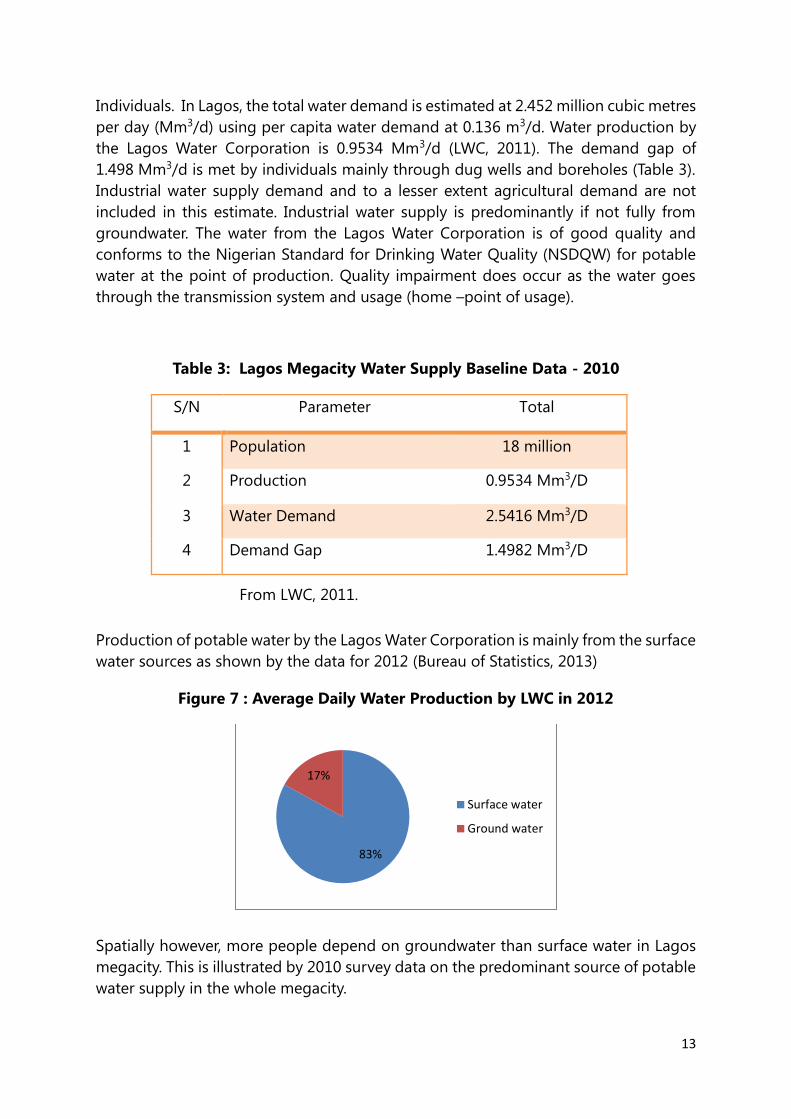
Table 3: Lagos Megacity Water Supply Baseline Data - 2010
S/N Parameter Total
1 Population 18 million
2 Production 0.9534 Mm3/D
3 Water Demand 2.5416 Mm3/D
4 Demand Gap 1.4982 Mm3/D
From LWC, 2011.
Production of potable water by the Lagos Water Corporation is mainly from the surface
water sources as shown by the data for 2012 (Bureau of Statistics, 2013)
Figure 7 : Average Daily Water Production by LWC in 2012
Spatially however, more people depend on groundwater than surface water in Lagos
megacity. This is illustrated by 2010 survey data on the predominant source of potable
water supply in the whole megacity.
83%
17%
Surface water
Ground water

14
Figure 8 : Predominant source of water in all the 20 LGAs of Lagos Megacity
( after Erinosho, 2013)
In order to meet the demand gap, Lagos Water Corporation has developed a Lagos
Water Supply Master Plan (2010 – 2020) which outlines into the short, medium and
long term infrastructure development programme (Table 4) to address:
Development of new schemes
Sustaining current operational assets with a sustainable management plan.
The goal stated in the Master Plan is to supply water to all residents of the
Megacity by December 2020.
Table 4: Water Supply Sector Realities (LWC, 2011)
S/N ITEM QUANTTY
(Mm3/d)
1 Operates 11 Service Arena
2 3 Major Water Works i. Adiyan 0.324
ii Iju 0.218
iii Ishashi 0.218
4 24 Mini Waterworks 0.253
5 19 Micro Water Works 0.09
6 Transmission Mains (ND 2000 – 600
mm)
180 km
7 Distribution Mains (ND 500 – 75
mm)
2215 km
5% 5%
80%
10%Surface waterfrom LWC

15
8 Total Connections ( size 50 mm –
19mm)
178,900 km
9 12.15 MW Independent Power Plant
(IPP) for Iju, Adiyan and Akute
10 Level of Service before IPP 21.6 %
11 Level of Service after IPP 57.2 %
12 Network Coverage 44 %
13 Unaccounted for Water 60 %
As a coastal and highly industrialized State, water resources in Lagos megacity faces
huge pollution challenges. Two of these are from:
Salt water intrusion
Salt water occurs in the lagoons and during the dry season extends considerable
distance in to the rivers flowing in to the lagoons. This necessitated the construction
of a weir on the Ogun River near the intake of the Lagos Water Corporation at Akute
in Ogun State. Salt water also occurs all along the coastline and has caused many
boreholes and wells to be abandoned. Salt water intrusion in aquifers is not restricted
to the coastline but goes far inland in the valley of the River Ogun (Oteri, 2013, AGR
and GWD & ENG LTD, 2011). Figures 5 and 6 above illustrate the variation of saline
water in the Coastal Plains Sands aquifer. Water supply in the coastal belt including
highbrow areas of Ikoyi, Apapa, Victoria Island and parts of Lekki Peninsular is adversely
affected as most inhabitants cannot afford to drill deep boreholes in to the fresh water
aquifer underlying saline water aquifers. A 30 m deep borehole at Agiliti in Kosofe LGA
of Lagos (sample 14, Table 5 below) shows the chemical analysis data. The water is
brackish and the borehole was abandoned. They are therefore restricted to the shallow
fresh water aquifer overlying the saline zone which is polluted by soakaways, septic
tanks and contaminated water in drains. Climate change will adversely enhance
saltwater intrusion in to surface - and ground – water
Oil Pollution
Pollution of groundwater from underground storage tanks in petrol stations and
storage tanks in factories and homes has been reported in Nigeria in general and Lagos
in particular. Leakage which is thought to be mainly due to vandalization of the
petroleum product pipelines from Atlas Cove at the sea coast to the Nigerian National
Petroleum Corporation pipeline Depot at Mosimi Ogun State has given and is giving
rise to extensive contamination of groundwater along the pipeline route. At Baruwa,
groundwater pollution of the aquifer occurred in 1994 affecting an area of 81.4
hectares (AGR, 2005). The maximum thickness of floating hydrocarbon on water was
0.65 m. Figure 9 shows samples of products recovered from dug wells in Baruwa .

16
One and half kilometres to the south of Baruwa is another groundwater hydrocarbon
pollution plume at Diamond Estate, on LASU Road, Isheri –Olofin., which was first
reported in 2010 (The Guardian, 2010). Hydrocarbon product floating on groundwater
also occurs. In both cases, remediation is yet to be carried out. Many of the affected
residents have no access to public water supply and cannot use their groundwater
through dug wells or boreholes. Many of the affected residents have no access to
public water supply and cannot use their groundwater through dug wells or boreholes.
Waste Water
Lagos has no main sewerage system apart from a few scattered treatment plants within
its housing estates and at the Secretariat. This poor sanitation situation is compounded
by the frequent and severe flooding affecting many areas (World Bank 2006). Sewage
disposal from domestic sources in Lagos megacity is predominantly through the use
of septic tanks as shown in Figure 10 from a household survey as published by the
Lagos State Bureau of Statistics in 2013 but reported by Department of Water and
Sanitation (LSMRD, 2015).
Petroleum product skimmed
from dug wells in Baruwa,
Lagos
Figure 9

17
Disposal and management of waste water and sewage in Lagos megacity in the past
was characterized by disposal of raw sewage in to the Lagos lagoon and other surface
water bodies (Awomeso et al, 2010). Waste water from industrial premises were sent
in to the drains without treatment or monitoring. All these have changed or are
changing gradually. The Lagos State Waste Management Office (LSWMO) was excised
from the Sewage department of the Office of Drainage Services, Lagos State Ministry
of The Environment in 2010. Since then it has aggressively pursued the rehabilitation
of old waste water treatment plants (WWTPs) and construction of new ones. The
WWTPs at three Housing Estates have been rehabilitated while a new 25 million litters
per day WWTP is being built at Odo Iya Ro near Ojota and eight more planned are for
other Government Housing Estates. LSWMO also has gone into Public Private
Partnership arrangement with some firms to construct and operate treatment plants.
Many Private and Government organizations and companies have built or rehabilitated
WWTPs. Aggressive public enlightenment on waste water disposal and construction of
the best type of septic tank for differing terrain is on - going through radio and
television. Overall, the total functional waste water infrastructure has increased from
0.04 to 6 % due to the upgrade of existing Lagos Megacity owned WWTPs.
Regulation and monitoring of waste water from industries in Lagos megacity is under
the preview of the Lagos State Environmental Protection Agency (LASEPA). The Agency
is saddled with the responsibility of maintaining a healthy environment through
adequate regulatory mechanism. These industries have been mandated by law to have
preliminary treatment plants in their premises but a lot of them have not complied and
those that have often bypass the treatment processes due to its high operation cost
(LASG, 2013).
55%
22%
2%
10%
2%3%
6%
11%
Figure 10 : Household Survey of Sewage Disposaal
Methods in Lagos Megacity
Flush toilet to Septic tank Flush toilet to Pit
Flush to Street Drain Pit latrine
Hanging toilet/ Toilet in water Bush / Fields
Conneced to Sewage network

18
The pollution of surface water by industries in the past is illustrated by the case of
Abuja / Igbo -Agbowa creek polluted by waste water effluent from a Textile factory.
Samples 1 – 3 in Table 5 illustrates the impact of the effluent on the water in the river.
The effluent is coloured, acidic (low pH) and high value of electrical conductivity, total
dissolved solids, biochemical oxygen demand (BOD) and chemical oxygen demand
(COD). Samples 4 to 7 show the chemical characteristics of waste water from some
industries in Lagos. These are found to have low pH, high values of COD and Bod as
well as higher than normal heavy metals.
Solid Waste
Solid waste management in Lagos has been the responsibility of the Lagos State Waste
Management Authority (LAWMA) since 2005 with a significant upgrade of its mandate
in 2007. Prior to 2007, the waste management operations were inadequate resulting
in Lagos being one of the dirtiest cities in the world. The situation has drastically
changed with good to very good refuse collection system in close to 70 percent of the
Megacity. The megacity now wears a new look. By the statistics, 4,171,899 metric tons
of solid waste were deposited in five landfill sites in Lagos Megacity in 2012. LAWMA
also operates three (3) Transfer Loading Stations in addition to smaller satellite disposal
sites. It has also gone into added services such as recycling of wastes and production
of gas from the sites. However, the landfill sites are not sanitary landfills. Contamination
of ground water has been detected in a number of the landfill sites such as Olusosun,
Solous and Abule Egba. In a groundwater contamination studies carried out on the
Solous dumpsites ( The Project Team, 2014), evidence of contamination by the
leachate in the form of high values of Chloride, BOD, COD and heavy metals of private
boreholes used for domestic water supply was found.
Figure 11:
Polluted Abuja/Igbo Agbowa
Creek, Ibeshe by Industrial
Waste Water from a Textile
Factory. Taken May 11, 2015

19
Table 5: Physicochemical Properties of Water around Lagos State
Samples 1 – 3 from Eruola et al, 2011, Samples 4 – 7 from Siyanbola et al, 2011. Samples 8 – 13 from Coode Blizard Ltd et al, 1996.
Sample 14 from Akute Geo- Resource Ltd, 2008.
CPS – Coastal Plains Sands Aquifer, ABK – Abeokuta Formation, Recent – Recent Sediments. TDS – Total Dissolved Solids, DO –
Dissolved Oxygen
COD – Chemical Oxygen Demand, BOD – Biochemical Oxygen Demand.
Samples 1 – 3: Surface water samples, Samples 4 – 7: Industrial effluents, Samples 8 – 14: Groundwater samples
Unit 1 2 3 4 5 6 7 8 9 10 11 12 13 14
Parameter Palapo Abuja Oripodi Oba Akran
Adeniyi Jones
ACME Odogunyan Badagry Ibeju NBL PLC
Shomolu MWW
Eredo Ikorodu
Agiliti
Ibeshe River, Ibeshe Ikeja Ikorodu Dug wells Recent
CPS Aquifers ABK Formation Recent
Source Waste outlet
Discharge @ Lagoon
Waste Industrial Effluents
Appearance Clear Blue Dark
pH 6.6 3.0 6.8 3.08 1.36 4.91 1.61 5.95 6.30 5.2 5.85 5.2 7.38 6.8
Temperature oC 28 28 28 28 31.5 30 35.35
Conductivity µS/cm 170 305 540 18.65 32.23 349 24.2 109.5 190. 90.9 65.2 105.5 410 2338
TDS mg/l 80 155 60 69 143 58 44 59 398.2 1520
DO 5 3.5 7 ND 2.34 ND 4.2
BOD 44 115 68 560 340 444.5 400
COD 96 245 150 1034 642 1254 670
Chloride 7.75 27 69 10.4 14 20.9 195
Copper 0.23 0.26 4.5
Lead 0.05 0.5 0.5
Chromium 0.055 0.56 ND
Zinc 11.93 5.22 3.41 1.25
Total Iron

20
Storm Water
Most parts of Lagos megacity are low lying with high water table which in some areas
along the coast less than 0.15 m below ground level. In 2011, Lagos was submerged in
flood due to water released through the Ogun and Oyan Rivers in Ogun State into
Lagos megacity as well as unprecedented rain intensity which combined to flood many
parts of City (Aderogba, 2012). Some of the causes of floods here are:
Blocked canals
Inadequate drainage canals
Non-compliance with environmental laws
Planlessness
Encroachment on drainage channels
Maintenance of drains
High tide and Ocean/ Lagoon surges
Photographs of some of the storm water drainage channels taken in September
2015 are shown below:
Figure 12: Photographs of
storm drainage channels in
Lagos.
The Ministry of The
Environment is making serious
efforts at effective flood
management.

21
Economy
Nigeria is Africa’s most populous country with a population of over 170 million. Lagos
megacity is the nation's economic nerve centre with over 2,000 industries. 65% of the
country's commercial activities are carried out in the megacity. Two of the nation's largest
seaports -Apapa and Tin-Can Ports are located in Lagos megacity and a new one is
planned for the Lekki Free Zone. The Business News (2014) stated that Lagos Megacity is
arguably the most economically important State in the country. Research has proved that
Lagos megacity is set to become the continent’s 13th biggest economy, with a per capital
income set at about $2,900 which is currently double the amount of the national average
of $1,700. According to the Punch Newspaper (2015), the GDP of Lagos megacity is
estimated at $91bn. The Executive Governor of Lagos State Mr Akinwunmi Ambode, is
reported to have in August 2015 declared that the GDP of Lagos State has hit US131bn,
which is per capita of US$5620.87 (Ayinla, 2015).
Lagos megacity has as many as 200 different slums with two out every three people living
in slums (Jideonwo, 2014, Akanda and Hossain, 2012, Lawanson, 2008). Monthly
Household income brackets in Lagos are as follows (1 US$ = N198.54)
Low Income - Less than N50,000
Middle Income - N50,000.00 to N100,000.00
High Income - Above N100,000.00
From a survey of three Local Government Areas, Oloke et al (2013), found 49 percent were
Low income earners, 28 percent were Middle income earners with 23 percent were High
income earners.
The Lagos Water Corporation charges a very low tariff, much lower than what is charged
by the Cross River State Water Board Ltd, which operates a Public Private Partnership and
much lower still than Private Water Supplies in Lagos Megacity. Table 6 compares the
tariffs charged by the different organizations (LWC, 2011, ORTECH, 2007)

22
Table 6: Comparison of Water Tariffs Charged (1 US$ = N198.54)
ORGANIZATION OR AGENCY UNIT COST PER
UNIT
Naira (N)
COST PER
LITRE
Naira (N)
Lagos Water Corporation m3 50 0.05
Cross River State Water Board Ltd ( Nigeria)-
Industrial
m3 150 0.150
Cross River State Water Board Ltd ( Nigeria) -
Domestic
m3 100 0.10
Private Ikeja 30 litres 50 1.67
Ikorodu 30 litres 30 1
Baruwa 30 litres 30 1
Victoria Island 25 litres 70 2.8
Main Trends and Forthcoming Issues
Water issues (water supply, waste water and storm water) have experienced upward trend
in the last 16 years and the prospect are that advancement will continue to be recorded
in tackling the challenges and meeting set targets. Many of the problems bedevilling the
sector have been identified and development being pursued aggressively. Public
enlightenment is in top gear.
In water supply, short–, medium-, and long- term infrastructure development
programmes in the Lagos Water Supply Master Plan (2010 – 2020) have been outlined
and are being pursued. However, for this to be successful the issues of management
structure of the Lagos Water Corporation and water tariff among others will have to be
tackled. The over-reliance of the future water sources on surface water especially
desalination of brackish water, with regards to energy shortfall and cost in Nigeria are
other concerns. The Lagos Water Corporation has a poor record of operating and
maintaining groundwater schemes in an environment where most Industries and Private
Housing Estates exploit groundwater for their water supply. The record of groundwater
schemes by other government Ministries, Departments and Agencies (MDGs) is worse
than that of the Lagos water Corporation.

23
Waste water treatment and central sewage facilities are still rudimentary. The Lagos State
Waste Water Management Office is aggressively developing and running this sector. New
laws are now in place for Estates and big establishments to build and operate WWTPs. It
is unlikely that a central sewage system can be constructed covering large percentage of
the megacity in the next 10 to 20 years.
Though Lagos is a low lying city with high water table especially along the coastal belt
that is prone to flooding, a lot has been achieved by the Government in the last few years.
Drainage master plans have been produced for most of the city and efforts enumerated
above are being vigorously pursued to ensure flood – free megacity.
Two issues that can throw the spanner in the works in the development and management
of water issues in Lagos megacity are:
1. Climate change – Climate change in form of rising sea level, and or higher rainfall
as well as higher sea surges can have a negative impact on water issues in Lagos
megacity especially water supply and flooding.
2. Development in Ogun State – Ogun State surrounds Lagos megacity in the north
and east. All the rivers coming in to Lagos megacity come through Ogun State.
Very rapid urban development is going on in Ogun State. Factories, Housing
estates and towns are springing up whereby forests in recharge areas of the
aquifers exploited in Lagos are being turned to paved cities and roads.
Uncontrolled drilling and exploitation of the aquifers is going on in Ogun State and
these could negatively affect Lagos megacity. There is a need for both States to
work together in developing and sustainably managing the water resources in the
two States.
On the positive side, development, both industrial, agricultural and urban are increasingly
taking place in Ogun State. Unfortunately, planning is absent in this development.
The Role of Civil Society Organizations
The Role of Civil Society Organizations (which includes Women, youth groups) is well
articulated in section 4.2.6 of the National Water Supply and Sanitation Policy (2000),
which stipulates that NGOs shall make use of their presence and acceptability in the
community to complement government efforts in promoting sanitation programmes
especially health and hygiene education. In particular, the NGOs shall be involved but not
limited to the following:

24
1. Advocacy and mobilization
2. Health, hygiene education and sanitation promotion in the community
3. Development of community sanitation programme
4. Training & capacity building of the community
5. Developing communication materials that are easily understood and accepted by the
community
6. Sourcing and providing necessary finance for projects
7. Bridging existing gaps between government and communities
8. Working with lead government agencies to ensure generation and consolidation of
relevant data

25
Part B
Water Specific Problems in Lagos Megacity
Water specific problems in Lagos megacity include the following:
A. Water Supply
i. Poor water infrastructure and utility performance – This involves the production
of insufficient quantity of water by the Lagos Water Corporation (LWC).
ii. Quality impairment due to unplanned layout of most consumers to the
distribution network necessitating the running of water distribution pipes along
gutters and drainage channels over long distances from the consumers’ houses
to LWC network.
iii. Many of the mains pipes are old and rusty.
iv. Unreliable power supply
v. Inadequate and poor water storage and supply infrastructure
vi. Low tariff charges
vii Poor operation and maintenance culture
These issues have been fully discussed by LWC, 2012; Oyegoke et al, 2012;
Jideonwo, 2014 and Ohwo, 2014.
B. Waste Water.
i. Very poor sewage and sanitation infrastructure
ii. Ensuring proper treatment and disposal of industrial effluent from both major
and small industrial enterprises before being released to the drains and surface
water sources 24/7
iii. Proper maintenance and operation of waste water treatment
iv. Public awareness of need for proper disposal of domestic waste water

26
v. Availability of land for provision of waste water treatment infrastructure
vi. High operational and maintenance costs
Vii Technical under capacity and Lack of lending facilities to investors coupled with
high investment costs.
Figure 13 is a photograph showing the Alausa State Secretariat Wastewater Treatment
Planted upgraded in 2010.
Figure 13: Alausa Ikeja Upgraded Wastewater Treatment Plant
C. Storm Water
i. Blocked and Insufficient number of drains
ii. Maintenance of the drainage system
iii. Planning – Land use planning eg establishment of industries like Abattoirs and
building on River floodplains
Climate Change and Lagos Megacity
Lagos State is likely to experience significant negative impacts as a result of climate
change. The risks are particularly high as a result of its long coastline, flat topography,
high water table, growing population and a heavy concentration of gross domestic

27
product (GDP) generating industry and infrastructure near the coast. In addition, sea-
level rise and repeated storm surges will worsen the problems of coastal erosion that are
already a menace in the Niger Delta, while the associated inundation will increase
problems of floods, intrusion of sea-water into fresh water sources and destroying such
stabilizing system as mangrove, and affecting agriculture, fisheries and general livelihoods
(LSMOE, 2012). Likely impacts of climate change are:
i. Projections of climate change suggest that Lagos State will experience a slight increase
in rainfall, a slight increase in rainfall variability and a temperature rise of about 3° C
by 2100 (Triple “E” Systems and Pennsylvania State University, 2010).
ii. Similar studies by the Climate Systems Analysis Group of University of Cape Town and
commissioned by the Building Nigeria’s Response to Climate Change (BNRCC, 2011)
indicates a 2º C increase by the year 2065 and of 3.5 º C by the end of the century for
southern Nigeria. Rainfall increases are also projected, with a peak increase of about
2 mm/day in monthly rainfall in the 2046-2065 period in various communities
throughout Lagos State, which means that they will be more affected if the quantity
and quality of water and/or its accessibility change as a result of climate change.
iii. In addition, some communities as a result of being low -lying, may be flooded and
submerged thereby resulting to migration and food security.
iv. BRNCC (2011), also projected wetter rainy seasons (ie high intensity rainfall associated
with flooding) and drier dry season (meteorological drought). Occurrence of more
frequent intense floods will cause damage to water infrastructure.
v. Sea level rise of about 40 cm by the year 2050 in the Lagos area. Lagos State would
be exposed to increased erosion, storm damage, inundation in low lying areas, and
intrusion of salt/sea water into groundwater aquifers and estuaries
vi. Over-abstraction of groundwater resources in some locations to meet the increasing
demand of the rapidly growing population and industry are likely to lead to sea water
intrusion and land subsidence.
Strategy to Combat Climate Change in Lagos
Megacity
Lagos State Government has listed the key elements of the State’s existing strategy to
combat climate change and are as follows (LSMOE, 2012):
1. Launching a public awareness and sensitization programme to educate Lagosians
about the threat of climate change and what needs to be done to address it. In an
attempt to 3catch them young and use them (i.e. school children) as agents of change
in reaching out to the larger society”, the State has launched a School Advocacy

28
Programme in which climate change clubs have been established in some primary
schools and post primary institutions in the State.
2. Launching a climate change mitigation and adaptation programme. Various measures
have been put in place to mitigate climate change and its impacts and adaptations.
These include:
a) A tree planting campaign and criminalization of indiscriminate tree felling;
b) Landscaping of virtually all open spaces, road verges and medians, and triangular
lay-bys;
c) Introduction of a mass transportation system, including the BRT (Bus Rapid Transit
scheme, rail transport and water transport;
d) Establishment of a waste-to-wealth programme.
e) Rehabilitation of the drainage infrastructure in Lagos;
f) Shoreline protection, especially at the Bar Beach on Victoria Island;
g) Erosion control;
h) Urban renewal programme;
i) Engaging the mass media (radio, television and print) to deliver warnings and
weather predictions to vulnerable communities;
j) Organizating quarterly meetings of Community Development Associations (CDAs)
and Community Development Committees (CDCs) to inform and sensitize the
public on climate change threats;
k) Cultivating the use of social networking platforms to communicate real-time
climate related threats.
Sea level rise is likely to be the most significant impact of climate change in Lagos State
in the long term and this will have adverse impacts on virtually every sector of the
economy.
Therefore, it is recommended that the State, working with the Nigerian Institute for
Oceanography and Marine Research (NIOMR) and the Federal Ministry of Works /
Environment, should conduct a statewide sea level rise vulnerability assessment as a
matter of urgency.
Innovations in Technology, Management and Governance.
Innovations in technology, management and governance that have been imagined as
solutions or partial solutions to these problems are as follows (LSMOE. 2012)
i. Water Supply:
The current status of public water supply in Lagos megacity is very poor. As stated
above for the year 2012 for which production data has been published, production

29
from all the waterworks was 12 percent of domestic demand. Out of this 12 percent,
a good percentage does not get to the consumers due to losses on the way. The
Lagos Water Corporation (LWC) has come up with a Master Plan aimed at meeting
the demand by 2020 through the planned construction of new Water Treatment
Plants (WTP) and associated network. The WTP will include desalination plants of
brackish water from the lagoons. However, it is debatable whether all the projects
will be completed and be operational by 2020. The execution of the Master Plan is
anchored on the involvement of Public -Private – Partnership. Unfortunately,
Worker’s Unions in the Water Corporation and some Civil Society Groups are
opposing the participation of Private enterprises in the water supply sector due to
a fear of overpricing and denial of access to this essential commodity to the under-
privileged (Ebosele, 2015 and Ezeamalu, 2015). Figure 14 shows a march against
privatization of water.
Our assessment and recommendations are as follows: In Nigeria, The Cross River
State Water Board Ltd had operated a form of public – private – partnership (PPP)
from 2004 to 2015, with Ortech Nigeria Ltd as the Private organization. The
achievement indicators for the project for the years are shown in Table 7 below
(Ekabua, 2014). Water production increased by 270 percent while efficiency
Figure 14: Protest against privatization of water by the
Public Unions and Civil Society Groups in 2015

30
increased by 18 percent. The number of connections increased by 1,113 percent.
Most households had meters installed. PPP had obviously been a success in
Calabar, Cross River State.
In Lagos Megacity, Private operators are involved in the collection of refuse with
the Lagos State Waste Management Board. This has contributed greatly in moving
Lagos from one of the dirtiest cities in the World to a pretty clean city, though
much still needs to be done. The telecommunications sector and more recently the
Power sector have been unbundled with private companies taking over from State
Authorities – NITEL /MTEL and PHCN respectively. Improvements have been
recorded in both sectors with the participation of the private sector. Jideonwo
(2014) also recommended privatization of the water supply sector in Lagos in her
thesis.
Involvement of private sector alone will not change radically the poor water supply
except other changes are made. Some operators in the water industry are of the
opinion that one agency in charge of water supply for over 23 million inhabitants
is not –sustainable. It is the opinion that the PHCN model may be better applicable
to the water sector.
Table 7

31
ii. Storm Water
The reasons espoused by Aderogba (2011) in his paper are very much with us.
Climate change will lead to a worsening of the flooding in Lagos megacity. Apart
from the impact from higher amount of rain and its intensity, as well as storm
surges from the ocean, the rapid urban development in Ogun State will mean more
run off into the rivers which all flow to Lagos. Lagos State Government has
produced drainage master plans as well as designed implementation strategy.
However, a solution to flooding in the city rests in well-known solutions - which
are:
Keeping the drainage channels clean and ensuring they are not blocked by any
refuse or structure at any time through constant and regular maintenance at the
various levels of governance.
Enforcing planning regulations – both individuals and even government agencies
build on drainage floodplains. In essence, the wetlands should be preserved as
they serve as withholding reservoir during peak flood.
Public awareness – through radio jingles, drama, electronic and print media, town
hall meetings et al
Legislation – applying penalties to offenders
iii. Waste Water
The Lagos State Waste Water Management Office is on the right track in
mounting enlightenment campaigns through Radio, Television and
Stakeholders meetings educating the populace on waste water and sanitation
with a view to changing the bad habits in the society.
The Federal Government and its agencies have many waste water treatment
facilities in Lagos megacity which are not functioning. There is a need for
cooperation between the two levels of Government so that they can work in
tandem.
Issues of availability of land to construct waste water facilities need urgent
attention of Government. The agencies of the State Government responsible
for waste water management in Lagos – Lagos State Environmental Protection
Agency (LASEPA) and Lagos State Waste Management Office (LSWMO) need

32
to redouble efforts especially in ensuring that waste water treatment plants are
of the right design, work 24/7 and are utilized. Therefore, due to land economy
in the State and the current use of septic tank as treatment option by a majority
of the populace, the option of decentralization and co-treatment of sewage
and septic tank liquor (feacal sludge) should be explored.

33
REFERENCES
Aderogba, K.A. 2012. Global warming and challenges of floods in Lagos metropolis,
Nigeria. Academic Research International Vol. 2(1), 448 – 468.
AGR (Akute Geo-Resource Ltd), 2005. Hydrogeological survey of the oil seepage and
groundwater pollution in Baruwa community, Ipaja, Alimosho LGA of Lagos State.
Unpublished Report submitted to Pipelines and Products Marketing Company of
NNPC, 76pp
AGR (Akute Geo-Resource Ltd) and GWD & ENG. LTD (Groundwater Development and
Engineering Company Ltd) , 2011. Saline intrusion into aquifers in the coastal
areas of Nigeria. Unpublished report submitted to Council of Nigerian Mining
Engineers & Geoscientists (COMEG), 59 pp.
Akanda , A.S. and Hossain, F. , 2012. The climate – water – health nexus in emerging
megacities. EOS Transactions, American geophysical Union, EOS Vol 93 (37), 353 -
360.
Awomeso, A.J., Taiwo, A.M., Orebiyi, E.O. Orekoya, E.O. and Odjegba, E.E. 2010. Effect of
untreated sewage dump on the quality of groundwater in Iddo community, Lagos,
Nigeria. Journal of Agricultural Science and Environment, 10 (1), 98 – 106.
Ayinla, M. 2015. Lagos GDP hits $13bn says Ambode. New Telegraph Newspaper,
August 3. newtelegraphonline.com/lagos-gdp-hits-131bn-says-ambode.
BNRCC (Building Nigeria’s Response to Climate Change Project), 2012. Towards a Lagos
State climate change adaptation strategy. Report prepared for the Honourable
Commissioner of Environment, Lagos State.
Business News, 2014. Nigeria’s new GDP status: Lagos maintains position as the national
commercial nerve centre. April 10, 2014.
businessnews.com.ng/2014/04/10/nigerias-new-gdp-status-lagos...
Coode Blizard Ltd, Akute Geo-Resource Ltd and Rofe, Kennard & Lapworth Ltd, 1996.
Hydrogeological investigation of Lagos State. Final Report to Lagos State Water
Corporation, Vols 1 & 2.
Ebosele, Y. 2015. AUPTRE faults alleged plans to privatize water supply in Lagos. The
Guardian Newspaper (Nigeria), 11 September 2015.
www.ngrguardiannews.com/2015/03/aupctre
Eruola, A.O. , Ufoegbune, G.C., Eruola, A.O., Awomeso, J.A., Adeofun, C.O., Idowu, O.A.,
and Abhulimen, S.J., 2011. An assessment of the effect of industrial pollution on
Ibese river, Lagos, Nigeria. African Journal of Environmental Science and
Technology, 5 (8), 608 -615.

34
Erinosho, A. E., 2013. Realities and incidence of water – borne diseases in Lagos State.
Paper presented at a workshop organized by the Lagos State Water Regulatory
Commission June 2013.
Ezeamalu, B. 2015. Labour, civil society march against Lagos Government’s plan to
privatize water. Premium Times, March 10.
www.premiumtimesng.com/regional/ssouth-west/178269-labour-civil...
Federal Ministry of Water Resources. 2000. National water and sanitation policy of
Nigeria www.studymode.com/.../National-Water-Supply-And-Sanitation-
Policy...
Jideonwo, J.A., 2014. Ensuring sustainable water supply in Lagos, Nigeria.
( http://repository.upenn.edu/mes_capstones/58)
Lagos State Government, 2004. Law No 14, A law to provide for the Lagos State Water
Sector and for connected matters. 77pp.
Lagos State Government, 2013a. Digest of Statistics 2013. Lagos Bureau of Statistics,
Ministry of Economic Planning and Budget.
Lagos State Government, 2013b. Lagos State Water Sector Policy- Draft. 95 pp.
Lawanson, T.O. 2008. Poverty and environmental conditions in the Lagos megacity,
consequences for environmental health. Journal of the Nigerian Institute of Town
Planners 21 (1), 53 – 70.
LSMOE (Lagos State Ministry of The Environment), 2015.
LSMOE (Lagos State Ministry of The Environment), 2012. Lagos State Climate Change
Policy 2012 – 2014, First Draft. developmentdiaries.com/.../Lagos-State-Climate-
Change-Policy-First...
LSMRD (Lagos State Ministry of Rural Development), 2010. Study needs for rural water
schemes in Lagos State. 66pp
LSMRD ( Lagos State Ministry of Rural Development),2015. Before, now and the way
forward: strategic planning for rural development blueprint. Paper presented at a

35
Retreat Workshop of the Department of Water and Sanitation of the Ministry of
Rural Development.
LWC (Lagos Water Corporation), 2011. Lagos Water Supply Master Plan, 33pp.
LWC (Lagos Water Corporation), 2012. Stakeholder / CSO Interaction Policy with LSWC.
nnngo.org/.../LSWC_POLICY...INTERACTION_FINAL-2012.pdf ·. 23pp
Ohwo, O. 2014. The impact of pipe distribution network on the quality of tap water in
Ojota, Lagos State Nigeria. American Journal of Water resources 2 (5): 110 -117.
Oloke, O. C., Ajibola, M.O. and Irohan, O.C. 2013. Cost of urban rental housing and its
implications on home ownership drive of middle and low – income earners in Lagos
State, Nigeria. International Journal of Arts and Commerce, Vol..2 (8), 65 – 75.
ORTECH, 2007. Technical and financial overview of CRSWBL – ORTECH Public – Private
partnership. Paper presented to the World Bank.33pp
Oyegoke, S.O. , Adeyemi, A.O. and Sojobi, A.O., 2012. The challenges of water supply for
a megacity. A case study of Lagos metropolis. International Journal of scientific and
engineering research Vol 3 (2), 1 – 10.
Oteri, A.U. 2013. Coastal groundwater resources, abstraction, quality and related
environmental concerns. www.lagoswaterreg.org.ng/events.php?p=191.
Punch Newspaper Nigeria, 2015. Lagos fifth biggest economy in Africa – Ambode. 8
March 2015. www.punchng.com/news/lagos-fifth-biggest-economy-in-africa-
%e2%94
Siyanbola, T.O., Ajanaku, K.O., James, O.O., Olugbuyiro, J.A.O., and Adekoya, J.O. 2011.
Physico-chemical characteristics of industrial effluents in Lagos State, Nigeria. JPA
Journal of Science and Technology (www.gjpast.com) , Vol. 01 : 49-54.
36
Standard Organization of Nigeria (SON), 2010. Code of practice of water well
construction. Nigerian Industrial Standard NCP 027:2010. 67pp
The Guardian, 1997. Sprouting oil spills threaten Lagos communities. 8 September 1997<
Environment page by Tunde Atere.
The Guardian, 2010. Our boreholes bring forth fuel –Residents of Diamond Estate, Idimu
, Lagos . The Guardian Newspaper, February 3, pp 12.
The Project Team (Environmental Engineering Research Group), 2014. Joint study on
groundwater contamination near municipal landfill sites in Lagos State: The Soluous
Dumpsites (Phase I). Final project report submitted to Lagos State Ministry of The
Environment.
Triple “E” Systems Inc. in collaboration with Pennsylvania State University and Triple “E”
Systems Associates Ltd. 2010. Climate Change Scenarios, Sea Level Rise Impacts
and Adaptation Strategy for Lagos State.
UNCHS-Habitat (United Nations Centre for Human Settlements), 1966. An urbanizing
World - Global report on human settlements. pp 11-24.
ACKNOWLEDGEMENTS
We acknowledge with thanks the support of the Lagos State Government, its
Ministries, Agencies and Officials for giving us access to data on the Megacity.
We also acknowledge the support and assistance of Mr Samuel Brown, Engineer
James Ekabua, George Garbi and Abideen Sanni.