lagos state government ministry of economic, budget …
TRANSCRIPT
LAGOS STATE GOVERNMENT MINISTRY OF ECONOMIC, BUDGET AND PLANNING
(LAGOS BUREAU OF STATISTICS)
FINAL REPORT
LLAAGGOOSS HHOOUUSSEEHHOOLLDD SSUURRVVEEYY
22000066
i
TABLE OF CONTENTS Page TABLE OF CONTENT……………………………………………………………………………1&II PREFACE………………………………………………………………………………………….1& 2 CHAPTER ONE…………………………………………………………………………………….3 INTRODUCTION…………………………………………………………………………………3-5 Background…………………………………………………………………………………6 Objective……………………………………………………………………………………6 Survey Sponsorship…………………………………………………………………………6 Organization of the Report…………………………………………………………………6-7 CHAPTER TWO……………………………………………………………………………………8 METHODOLGY…………………………………………………………………………………..8-11 Sample Design………………………………………………………………………………12 Survey Methodology………………………………………………………………………..12-14 Survey Instrument and Equipment……………………………………………………………14 Field Organization……………………………………………………………………………15 Training of Field Staff………………………………………………………………………..16 Fieldwork……………………………………………………………………………………..16 Data Capture and Processing………………………………………………………………….17 CHAPTER THREE: DATA ANALYSIS…………………………………………………………..17 DEMOGRAPHY……………………………………………………………………………………..17 Household Gender……………………………………………………………………………..18 Average Household Size……………………………………………………………………….18 Age Categorisation……………………………………………………………………………..18 Relationship to Head…………………………………………………………………………...18 Length of Stay in Area………………………………………………………………………....18-19 Educational Level………………………………………………………………………………19 Occupational classification/mode of Transportation…………………………………………...19-20 HOUSEHOLD ASSETS AND AMENITIES…………………………………………………………21-22 LAND TENURE…………………………………………………………………………………….23 Dwelling Unit…………………………………………………………………………………...23 Building Materials………………………………………………………………………………23-24 WATER………………………………………………………………………………………………25 Sources of Water………………………………………………………………………………...25 Treatment of Water……………………………………………………………………………...26 Water Tariff……………………………………………………………………….……………..26 Solving Water Problem………………………………………………………………………….26-27 FLOODS……………………………………………………………………………………………….28 Floods experienced in the House………………………………………………………………...28 Flood experienced in the Street………………………………………………………………….28-29 Repair of Items damaged by Floods……………………..………………………………………29 Availability of Gutters.…………………………………………………………………………29-30 TOILET FACILITIES ………………………………………………………………………………...31 Types of Toilet Facilities………………………………………………………………………..31 Sharing/Location of Toilet Facilities……………………………………………………………31-32 Number of Families sharing Toilet Facilities …………………………………………………….32 Location of Toilet Facilities ……………………………………………………………………...32 Payment for the use of Toilet Facilities …………………………………………………………..32-33 SANITATION………………………………………………………………………………………….34 Solid Waste Removal…………………………………………………………………………….34 Solution to Waste/Water Problem..………………………………………………………………34-35 ELECTRICITY………………………………………………………………………………………….36 Primary Sources of Energy……………………………………………………………………….36 Type of Electricity Conventional Meter………………………………………………………….36 Mode of Payment of NEPA Bill………………………………………………………………….36

ii
Unexpected Interruption of Electricity……………………………………………………………37 Opinion on Power Source in the State……………………………………………………………37 Estimated Value of Damages on Repairs or Replacement (In Naira) ……………………………37-38 EDUCATION………………………………………………………………………………………….39 Awareness………………………………………………………………………………………39 Problem Faced in Government School…………………………………………………………39 Ranking of Problems……………………………………………………………………………40 Educational Group……………………………………………………………………………...40-41 ECONOMY……………………………………………………………………………………………..42 Average Monthly Expenditure…………………………………………………………………..42
Receiving Money from Abroad………………………………………………………………….42 Sending Money within State…………………………………………………………………….42 Sending Money within/Outside the Country…………………………………………………….43
PERFORMANCE OF GOVERNMENT IN PROVISION OF SERVICES……………………………44 Federal Government……………………………………………………………………………..44
State Government………………………………………………………………………………..44 Local Government……………………………………………………………………………….44
PAYMENT FOR SERVICES………………………………………………………………………….45 Road Services……………………………………………………………………………………45 Drainage Services ………………………………………………………………………………..45 Streetlights……………………………………………………………………………………….46 Water Supply…………………………………………………………………………………….46 Public Toilets……………………………………………………………………………………46-47 Health Care………………………………………………………………………………………47 School Services………………………………………………………………………………….47 Solid Waste Disposal…………………………………………………………………………….48 Recreation Facilities……………………………………………………………………………..48 Post Office……………………………………………………………………………………….49 Telephone………………………………………………………………………………………..49 Market……………………………………………………………………………………………50 Maintenance of these Services…………………………………………………………………...50 SECURITY…………………………………………………………………………………………….51-52 SOCIAL NETWORK………………………………………………………………………………….53 Membership with association/ Group……………………………………………………………..53-54 Decision Making…………………………………………………………………………………..54
Connection with other Organisation………………………………………………………………54 Gender Characteristics of Member of the Group…………………………………………………55 Income Level……………………………………………………………………………………....55 Educational Level…………………………………………………………………………………55 Marital Status………………………………………………………………………………………56 Home Ownership………………………………………………………………………………....56 Reasons for Joining the social Network…………………………………………………………..56
SERVICE DELIVERY…………………………………………………………………………………..57 Health ……………………………………………………………………………………………..57 Access to Adequate sanitation Services…………………………………………………………...57 Water Services…………………………………………………………………………………... 57-58 Waste Management Control………………………………………………………………..……...58 Contact with Other Groups………………………………………………………………………...58-59 NEIGHBOURHOOD………………………………………………………………………………………60 Various Problems Faced by Households…………………………………………………………..60 Littering…………………………………………………………………………………………….60 Public Urination……………………………………………………………………………………60 Land invasion by Hawkers…………………………………………………………………………61 Illegal trading………………………………………………………………………………………61 Poor Traffic Control………………………………………………………………………………..61
iii
Corruption of Service Delivery Officials…………………………………………………….…….62 RECOMMENDATION ……………………………………………………………………………………..63 CONCLUSION ……………………………………………………………………………………………...64 APPENDIX 1…………………………………………………………………………………………………65 STATISTICAL TABLES……………………………………………………………………..66-123 APPENDIX 2………………………………………………………………………………………………....124 SURVEY QUESTIONAIRE………………………………………………………………………………125-134

1
PREFACE This report presents the main results of a Household Survey carried out in 2005. The
fieldwork covered a period of four (4 )weeks. The survey was designed to furnish
policy makers, planners and programme managers with a set of simple indicators for
monitoring welfare and poverty and measuring service delivery of State Government
to the citizenry of the State. The survey aims at providing reliable data on a timely
basis for monitoring changes in the welfare status by local government areas in the
State.It also provides estimates at local government level. The outcome of the survey
will be used to assess the social and economic situation in the State and provides
relevant data required to monitor growth and development in the state.
The survey was carried out by the Central Office of Statistics, Ministry of Economic
Planning and Budget in collaboration with the World Bank. The methodology of the
survey is such that it does not require a large human resources and monetary support
like other surveys such as the Living Standards Measurement Surveys and Core
Welfare Indicators Questionnaire Survey. The survey uses Hand-Held Pocket
Computer technology and Perseus Mobile Survey Software to generate statistical
data rapidly. This technology eliminates keyboard entry of questionnaire data,
therefore, making it possible for data processing to keep pace with data collection.
Incidentally, timely release of data and presentation of results are achieved in
astonishing way.
The Household survey was a state-wide survey which collected detailed information
on a variety of topics including demographic characteristics of the household,
education, health, infrastructure, income and expenditure, economic activity, housing
conditions, access to social amenities, asset ownership, violence, crime and safety
and subjective well-being among others.
2
Additional information on the survey can be sought from the Director, Central Office
of Statistics, Ministry of Economic Planning and Budget, Lagos State Secretariat,
Alausa, Ikeja or through e-mail address: [email protected]
This report is particularly useful to the State and Local Governments. It is hoped
that all the results will be made adequate use of. The public generally, not only in
the State but also through out the Federation of Nigeria, can also make use of the
information in the report. This Office welcomes comments on the results.
Adesoji Oyenusi Director, Central Office of Statistics For Permanent Secretary Ministry of Economic Planning and Budget Lagos State Secretariat, Alausa, Ikeja
3
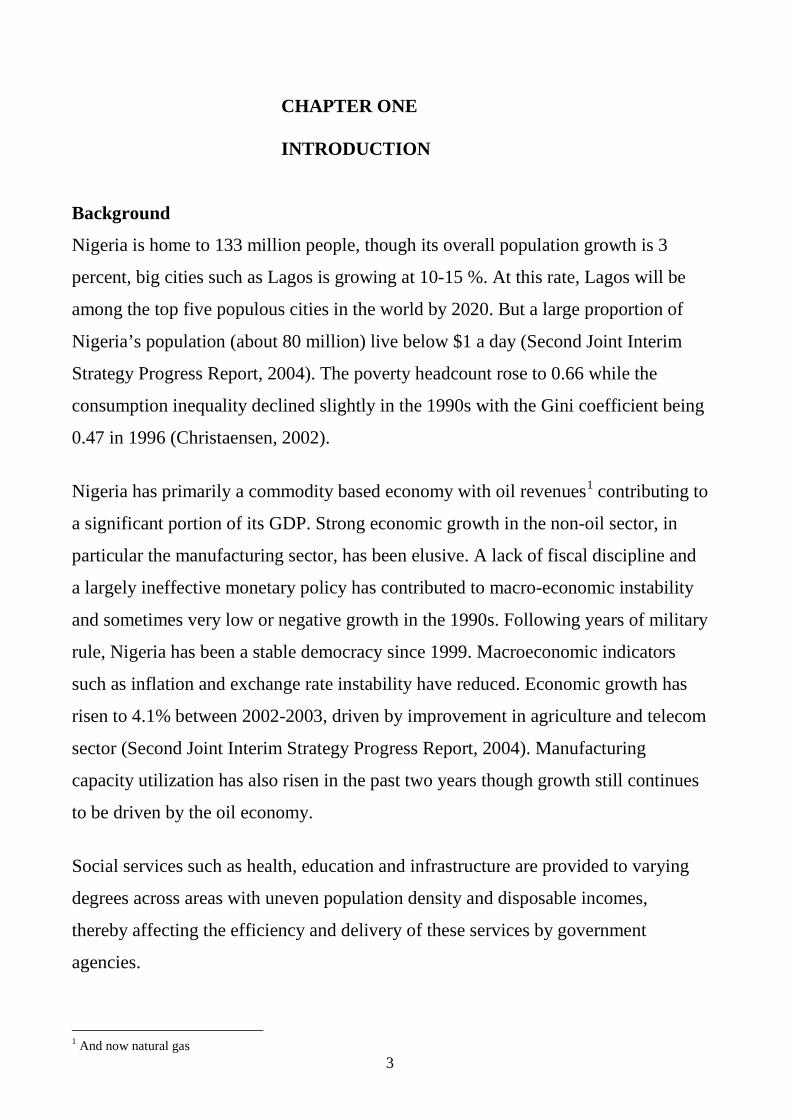
CHAPTER ONE INTRODUCTION Background
Nigeria is home to 133 million people, though its overall population growth is 3
percent, big cities such as Lagos is growing at 10-15 %. At this rate, Lagos will be
among the top five populous cities in the world by 2020. But a large proportion of
Nigeria’s population (about 80 million) live below $1 a day (Second Joint Interim
Strategy Progress Report, 2004). The poverty headcount rose to 0.66 while the
consumption inequality declined slightly in the 1990s with the Gini coefficient being
0.47 in 1996 (Christaensen, 2002).
Nigeria has primarily a commodity based economy with oil revenues1 contributing to
a significant portion of its GDP. Strong economic growth in the non-oil sector, in
particular the manufacturing sector, has been elusive. A lack of fiscal discipline and
a largely ineffective monetary policy has contributed to macro-economic instability
and sometimes very low or negative growth in the 1990s. Following years of military
rule, Nigeria has been a stable democracy since 1999. Macroeconomic indicators
such as inflation and exchange rate instability have reduced. Economic growth has
risen to 4.1% between 2002-2003, driven by improvement in agriculture and telecom
sector (Second Joint Interim Strategy Progress Report, 2004). Manufacturing
capacity utilization has also risen in the past two years though growth still continues
to be driven by the oil economy.
Social services such as health, education and infrastructure are provided to varying
degrees across areas with uneven population density and disposable incomes,
thereby affecting the efficiency and delivery of these services by government
agencies.
1 And now natural gas
4
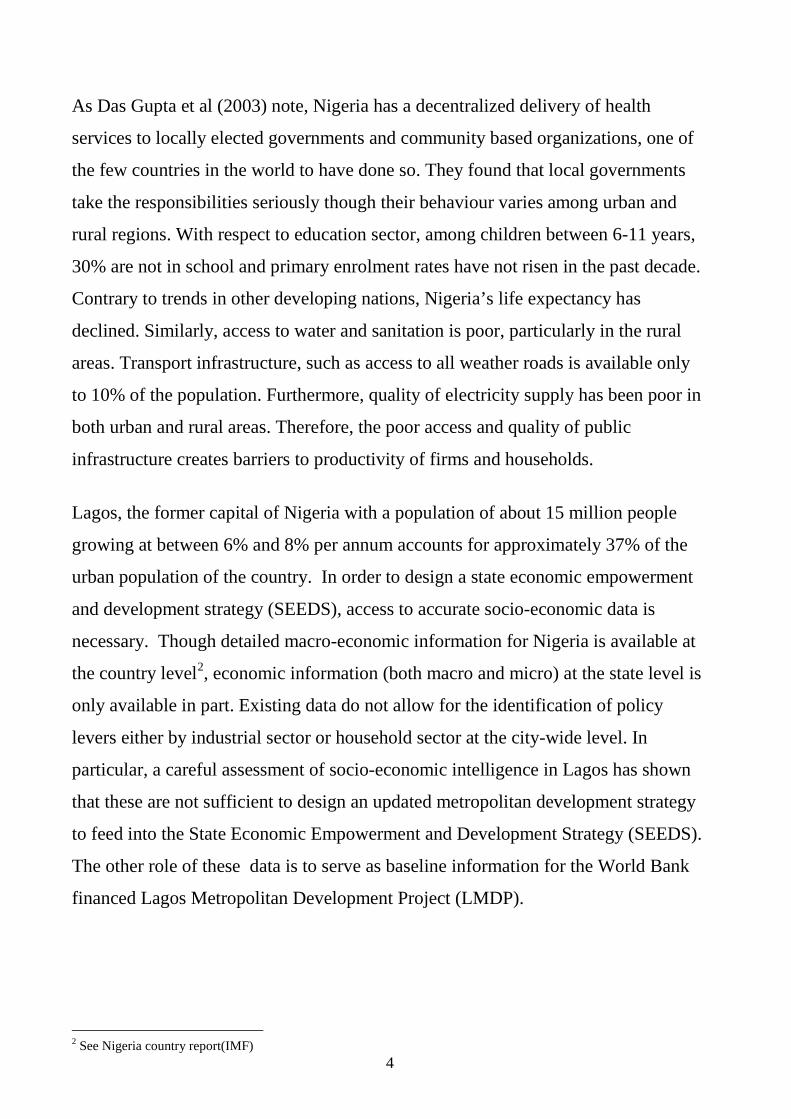
As Das Gupta et al (2003) note, Nigeria has a decentralized delivery of health
services to locally elected governments and community based organizations, one of
the few countries in the world to have done so. They found that local governments
take the responsibilities seriously though their behaviour varies among urban and
rural regions. With respect to education sector, among children between 6-11 years,
30% are not in school and primary enrolment rates have not risen in the past decade.
Contrary to trends in other developing nations, Nigeria’s life expectancy has
declined. Similarly, access to water and sanitation is poor, particularly in the rural
areas. Transport infrastructure, such as access to all weather roads is available only
to 10% of the population. Furthermore, quality of electricity supply has been poor in
both urban and rural areas. Therefore, the poor access and quality of public
infrastructure creates barriers to productivity of firms and households.
Lagos, the former capital of Nigeria with a population of about 15 million people
growing at between 6% and 8% per annum accounts for approximately 37% of the
urban population of the country. In order to design a state economic empowerment
and development strategy (SEEDS), access to accurate socio-economic data is
necessary. Though detailed macro-economic information for Nigeria is available at
the country level2, economic information (both macro and micro) at the state level is
only available in part. Existing data do not allow for the identification of policy
levers either by industrial sector or household sector at the city-wide level. In
particular, a careful assessment of socio-economic intelligence in Lagos has shown
that these are not sufficient to design an updated metropolitan development strategy
to feed into the State Economic Empowerment and Development Strategy (SEEDS).
The other role of these data is to serve as baseline information for the World Bank
financed Lagos Metropolitan Development Project (LMDP).
2 See Nigeria country report(IMF)
5
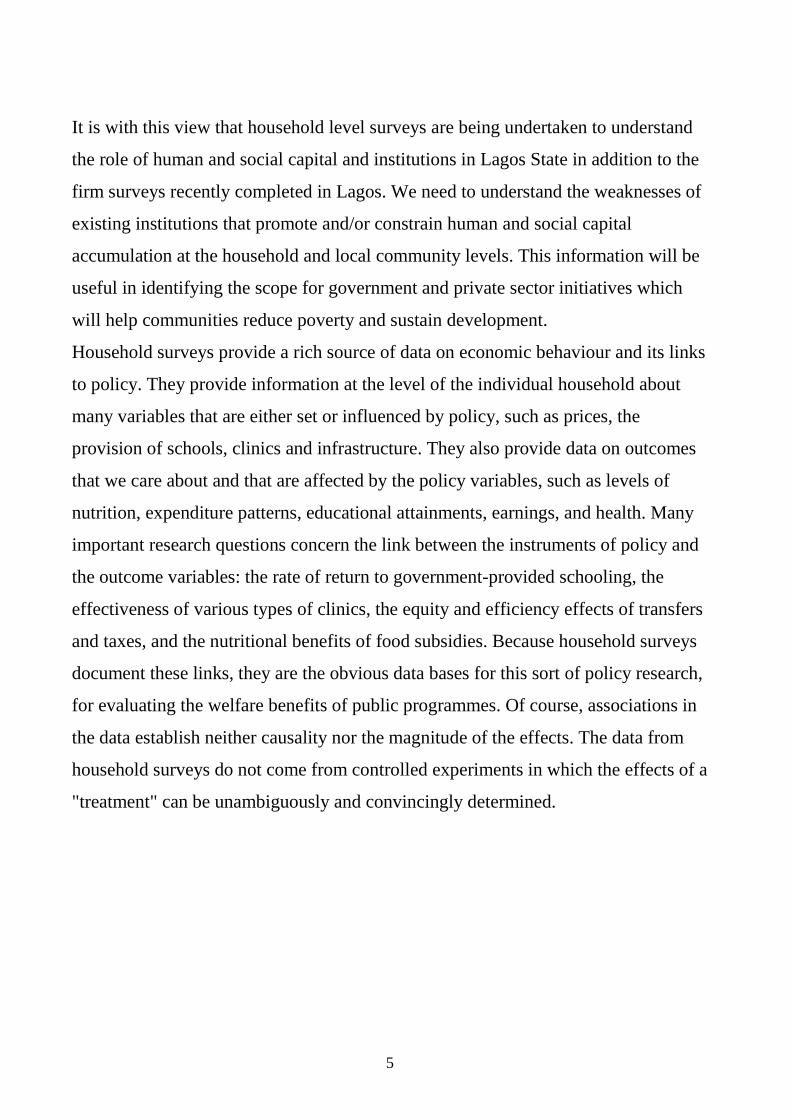
It is with this view that household level surveys are being undertaken to understand
the role of human and social capital and institutions in Lagos State in addition to the
firm surveys recently completed in Lagos. We need to understand the weaknesses of
existing institutions that promote and/or constrain human and social capital
accumulation at the household and local community levels. This information will be
useful in identifying the scope for government and private sector initiatives which
will help communities reduce poverty and sustain development.
Household surveys provide a rich source of data on economic behaviour and its links
to policy. They provide information at the level of the individual household about
many variables that are either set or influenced by policy, such as prices, the
provision of schools, clinics and infrastructure. They also provide data on outcomes
that we care about and that are affected by the policy variables, such as levels of
nutrition, expenditure patterns, educational attainments, earnings, and health. Many
important research questions concern the link between the instruments of policy and
the outcome variables: the rate of return to government-provided schooling, the
effectiveness of various types of clinics, the equity and efficiency effects of transfers
and taxes, and the nutritional benefits of food subsidies. Because household surveys
document these links, they are the obvious data bases for this sort of policy research,
for evaluating the welfare benefits of public programmes. Of course, associations in
the data establish neither causality nor the magnitude of the effects. The data from
household surveys do not come from controlled experiments in which the effects of a
"treatment" can be unambiguously and convincingly determined.

6
Objectives
The main objective of the Household Survey component of the Lagos Metropolitan
development project, funded through the Japan Policy and Human resources
development (PHRD) technical assistance program, is to establish baseline socio-
economic data to provide meaningful input into SEEDS and LMDP.
The Lagos Household Survey was undertaken by the Central Office of Statistics of
the Lagos State Ministry of Economic Planning and Budget. The Office was building
the socio-economic database with assistance from the World Bank which has
successfully implemented similar methodology in several other cities around the
world. This entails the collection of economic and social data from households that
was representative of the delivery of services to the population of the state,
including: health, education and public infrastructure. The survey would be spatially
disaggregated to cover all the communities of Lagos state.
Survey Sponsorship
The household survey, a component of baseline data project under Lagos
Metropolitan Development project (LMDP) was funded by the World Bank through
the Japanese grant policy Human Resources development (PHRD). While Lagos
State Ministry of Economic Planning & Budget where the central Office of Statistics
is domiciled also supported the program by providing funds for the monitoring.
Organization of the Report
Chapter 1 of the report consists of the background, objectives and the sponsors of the
survey while Chapter 2 outlines methodology including a very brief description on
the sampled units, sample frame and design, survey instrument and technology used
in capturing the data from the field. Chapter 3 deals with data analysis and findings
on various sectors such as Demography, Household assets and amenities, Water,
Land Tenure and others as listed under the table of contents

7
Conclusion and Recommendations feature in Chapter 4 and Chapter 5 respectively.
Staitistical tables on main findings are presented in the appendix, followed by a copy
of the survey instrument (Questionaire)

8
CHAPTER TWO METHODOLGY This chapter shows how the baseline data on the target sampled households were
generated, covering some survey-related important issues including sample design,
construction of questionnaire, training of interviewers and pre-testing of
questionnaires, fieldwork and data processing.
Sample Design
A sample in any household survey is desired to be representative of the various
social and economic strata that exist in the society, as defined by basic demographic
variables. In Nigeria, an urban settlement like Lagos exhibits some visible social
strata and these must be of keen interest, in addition to geographic spread, in order to
minimize bias. The sampling design adopted in this survey was essentially Stratified
Multi-stage Sampling.
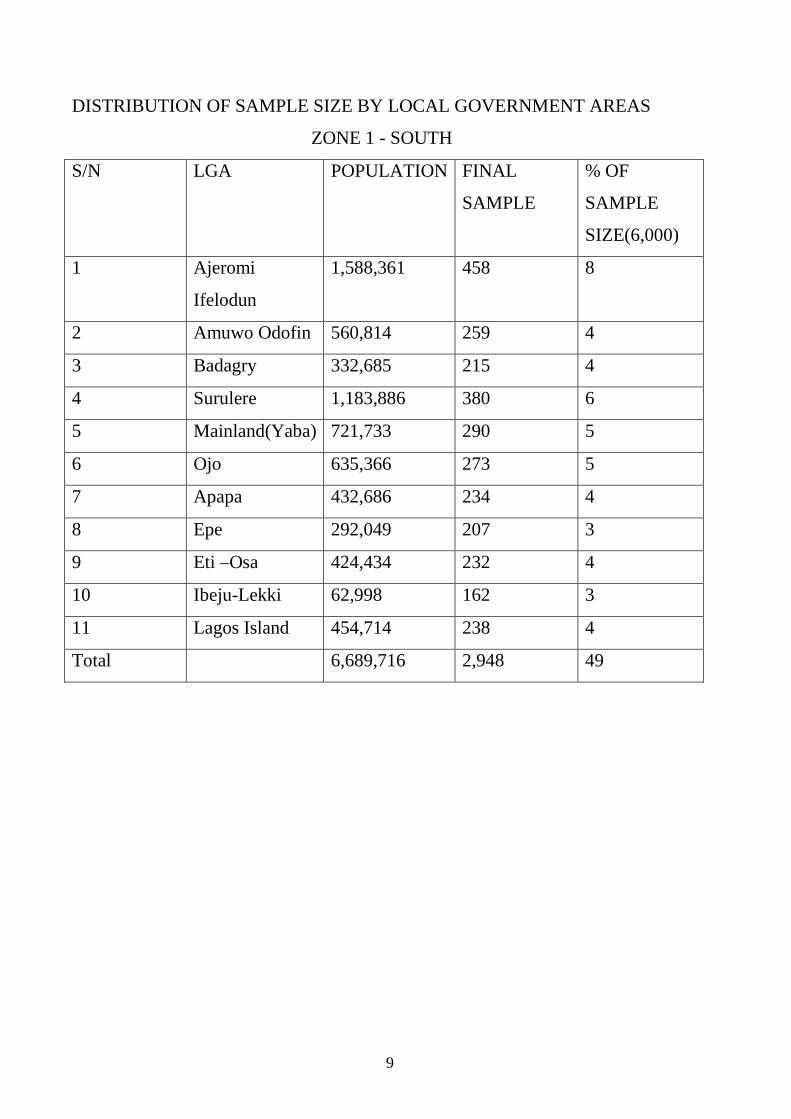
The 6,000 samples were divided into equal parts .The first half of the sample size
was scientifically selected using probability proportional to size (PPS) of the
populace and the other half was divided equally (ES) among the entire local
government areas. The two values were added to arrive at the actual sample size.
In summary, PPS + ES = ACTUAL SAMPLE SIZE.
9
DISTRIBUTION OF SAMPLE SIZE BY LOCAL GOVERNMENT AREAS
ZONE 1 - SOUTH
S/N LGA POPULATION FINAL
SAMPLE
% OF
SAMPLE
SIZE(6,000)
1 Ajeromi
Ifelodun
1,588,361 458 8
2 Amuwo Odofin 560,814 259 4
3 Badagry 332,685 215 4
4 Surulere 1,183,886 380 6
5 Mainland(Yaba) 721,733 290 5
6 Ojo 635,366 273 5
7 Apapa 432,686 234 4
8 Epe 292,049 207 3
9 Eti –Osa 424,434 232 4
10 Ibeju-Lekki 62,998 162 3
11 Lagos Island 454,714 238 4
Total 6,689,716 2,948 49
10
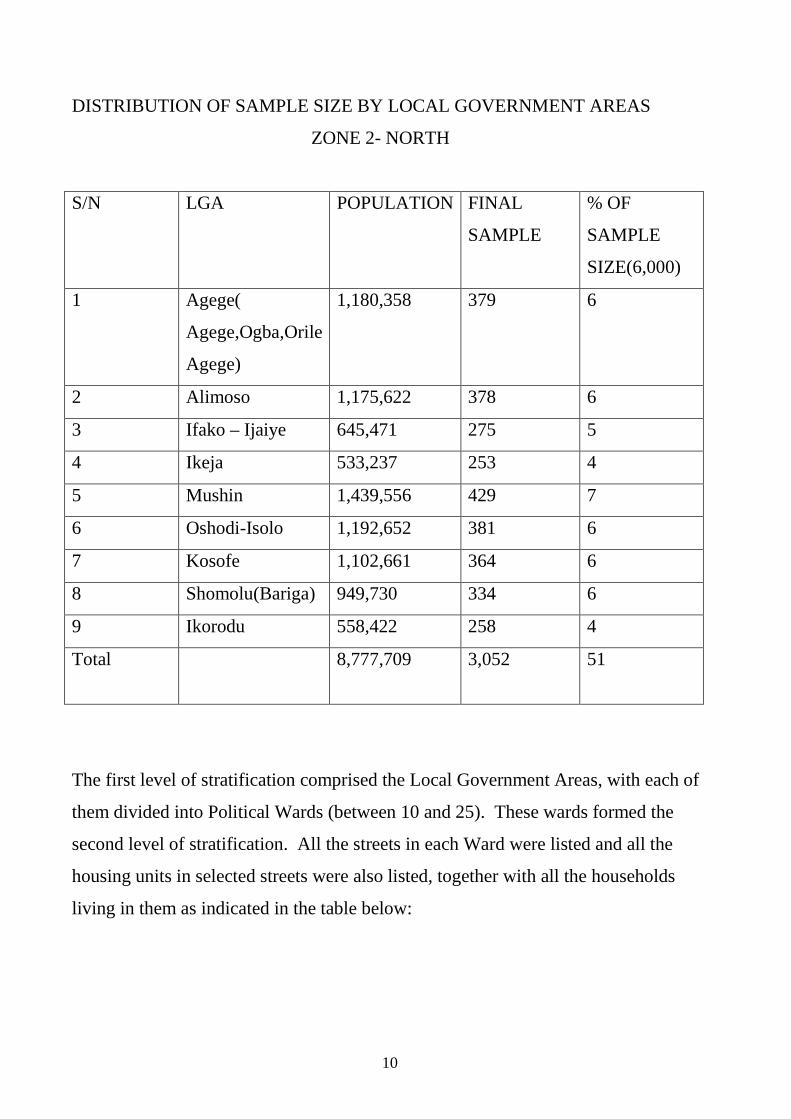
DISTRIBUTION OF SAMPLE SIZE BY LOCAL GOVERNMENT AREAS
ZONE 2- NORTH
S/N LGA POPULATION FINAL
SAMPLE
% OF
SAMPLE
SIZE(6,000)
1 Agege(
Agege,Ogba,Orile
Agege)
1,180,358 379 6
2 Alimoso 1,175,622 378 6
3 Ifako – Ijaiye 645,471 275 5
4 Ikeja 533,237 253 4
5 Mushin 1,439,556 429 7
6 Oshodi-Isolo 1,192,652 381 6
7 Kosofe 1,102,661 364 6
8 Shomolu(Bariga) 949,730 334 6
9 Ikorodu 558,422 258 4
Total 8,777,709 3,052 51
The first level of stratification comprised the Local Government Areas, with each of
them divided into Political Wards (between 10 and 25). These wards formed the
second level of stratification. All the streets in each Ward were listed and all the
housing units in selected streets were also listed, together with all the households
living in them as indicated in the table below:
11
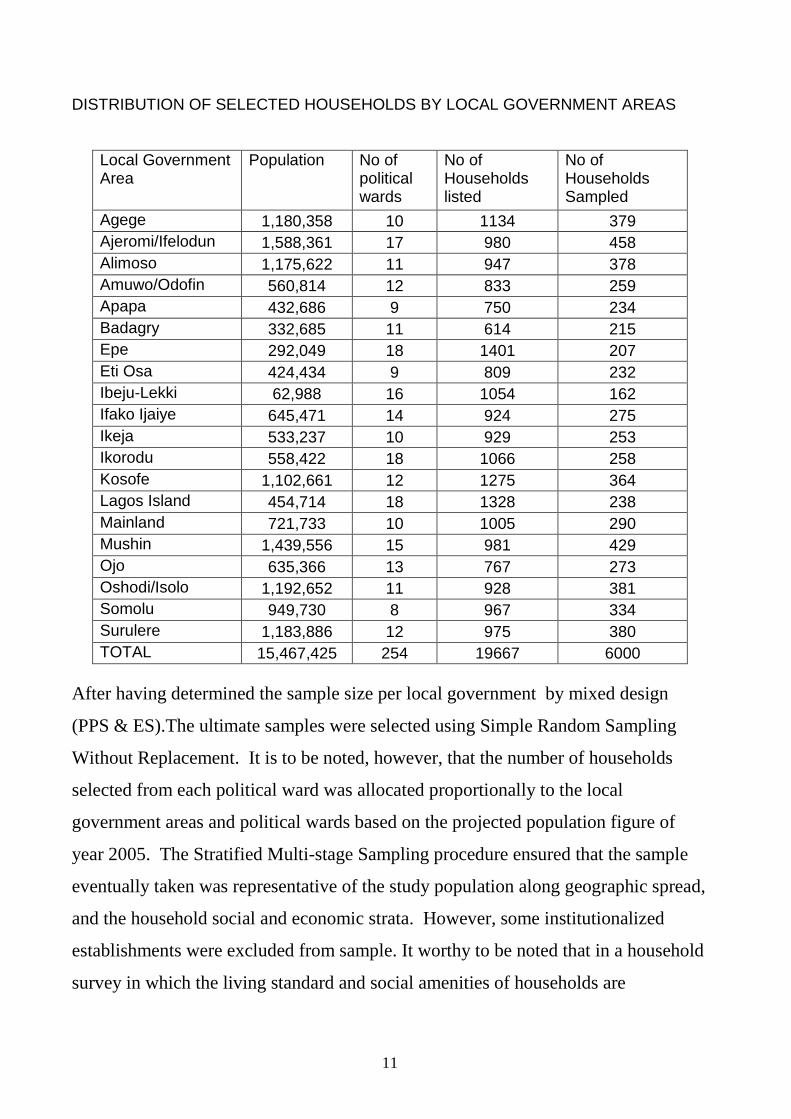
DISTRIBUTION OF SELECTED HOUSEHOLDS BY LOCAL GOVERNMENT AREAS
Local Government Area
Population No of political wards
No of Households listed
No of Households Sampled
Agege 1,180,358 10 1134 379 Ajeromi/Ifelodun 1,588,361 17 980 458 Alimoso 1,175,622 11 947 378 Amuwo/Odofin 560,814 12 833 259 Apapa 432,686 9 750 234 Badagry 332,685 11 614 215 Epe 292,049 18 1401 207 Eti Osa 424,434 9 809 232 Ibeju-Lekki 62,988 16 1054 162 Ifako Ijaiye 645,471 14 924 275 Ikeja 533,237 10 929 253 Ikorodu 558,422 18 1066 258 Kosofe 1,102,661 12 1275 364 Lagos Island 454,714 18 1328 238 Mainland 721,733 10 1005 290 Mushin 1,439,556 15 981 429 Ojo 635,366 13 767 273 Oshodi/Isolo 1,192,652 11 928 381 Somolu 949,730 8 967 334 Surulere 1,183,886 12 975 380 TOTAL 15,467,425 254 19667 6000
After having determined the sample size per local government by mixed design
(PPS & ES).The ultimate samples were selected using Simple Random Sampling
Without Replacement. It is to be noted, however, that the number of households
selected from each political ward was allocated proportionally to the local
government areas and political wards based on the projected population figure of
year 2005. The Stratified Multi-stage Sampling procedure ensured that the sample
eventually taken was representative of the study population along geographic spread,
and the household social and economic strata. However, some institutionalized
establishments were excluded from sample. It worthy to be noted that in a household
survey in which the living standard and social amenities of households are
12
investigated, decisions may be taken in advance to exclude certain segments of the
society whose activities are predetermined.
These include institutionalized establishments like Hospitals, Schools, Prisons,
Police Barracks, Military Settlements, Hostels, Hotels, Charity Homes, etc. Such
establishments were not listed and therefore did not fall into the sample; hence, they
were not surveyed.
Survey Methodology
This is the first time in West Africa that data were captured through hand-held
pocket PC. The survey instrument was uploaded into Dell Pocket PCs using Perseus
Solutions Mobile Survey Software. To ensure that spatially distribution were carried
out on local government areas, Global Positioning System (GPS) instruments were
used to record the latitude, longitude and altitude of each surveyed household
housing/dwelling unit. Everyday of each survey week, the captured data are synced
into the laptop specifically meant for the purpose in the Central Office of Statistics.
To ensure that there exist back-ups for the data, they were saved in a Compact Disk
and also e-mailed to the World Bank in Washington at regular intervals.
Survey Instrument and Equipment
Questionnaire was finalised after the pilot survey was carried out, following the
discussions with the World Bank; numerous suggestions were made to further tailor
the questionnaire to be most effective to the State and to the Nigerian environment.
However, as the survey questionnaire was initially programmed by the mobile
survey vendor, Perseus Development Corporation, changes to questions were
conducted very carefully. The household survey adopted a household-based
questionnaire which consisted of eighty (80) pages. To ensure concise responses for
the interviews, pre-coded multiple-choice response questions were used. The
questionnaire was designed based on fifteen (15) distinct modules consisting of:
13
Household Information
Type of Housing
Land and Tenure Access to infrastructure-Storm water drainage
Sanitation
Water supply
Solid waste removal
Energy and Electricity
Telephone
Transportation and local roads
Education
Health
Emergency and policing services
Community preference
Household income and expenditure
Modelled after the work undertaken by the bank in Johannesburg, South Africa, the
household survey was a technologically advanced approach to capturing information.
This was the first time in West and Central Africa that household information was
recorded in Pocket PC and spatial coordinates of households included using GPS
instruments. This allowed immediate information availability and greatly reduced
chances of error in data capture and data entry. There was in-built validation that
ensured that questions were not skipped or accidentally missed. Other advanced
features like branching enable enumerators to ask only the relevant questions,
making the process more efficient (for example, if a person says he owns a piece of
land, he gets questions specific to land ownership, whereas someone renting the
person’s house, gets rent specific questions). Possible responses have been keyed in
ahead of time, to standardize the way responses were recorded while allowing the
flexibility to record unique responses (e.g. list of consumable assets). This
standardization of data entry allows for more accurate data analysis. The GPS

14
technology was utilized in recording the exact coordinates of each location which
made it beneficial not just for mapping, but also for drainage, solid waste, and other
infrastructure projects. This overall process of electronic data capture compacted the
number of steps required in a paper survey and therefore also reduced the
opportunities for data error. The enumerators entered the data into the Pocket PC as
they interviewed the head of household. Data was then uploaded directly into the
database where analysis could take place. Data quality checks were put in place to
ensure data accuracy. A schedule for regular data backup was also put in place.
Field Organization
Two teams were formed for the main fieldwork, with each team comprising five
supervisors and twenty interviewers. The interviewers were mainly recruited from
the State. Each team was assigned to one zone each as the State was divided into two
zones namely North which consisted 3,052 selected households (Agege, Alimosho,
Ifako-Ijaiye, Ikeja, Ikorodu, Kosofe, Mushin, Oshodi/Isolo and Somolu Local
Government Areas) and South with 2,948 selected households (Ajeromi/Ifelodun,
Amuwo Odofin, Apapa, Badagry, Epe, Eti-Osa, Ibeju Lekki, Lagos Island, Lagos
Mainland, Ojo and Surulere Local Government Areas). Each interviewer was
expected to cover 3 households per day, thus each team could complete 75
households (i.e. one zone) per day. An interviewer could therefore cover a maximum
of 18 households per week, assuming 6 effective working days per week. Hence the
sample size of 6000 households could be covered within 4 weeks.
15
Training of Field Staff
Experienced field staff of two consulting firms-University of Ibadan Consultancy
Services and University of Lagos Consult were to assume supervisory role for all the
data collection teams participating in the main fieldwork and staff of Central Office
of Statistics attended the training on field management and of enumerators and
supervisors – The training programme which spanned through 14th to 16th June 2005
at Centre for Management Development (CMD), Shangisa, Lagos had World Bank
Officials as facilitators, which comprised Sudeshna Ghosh Banerjee (Economist
Consultant, AFTU2 in Washington), Kim Pimenta and Virginie Bocard (Africa IT in
Washington) and Paul Kalu (Economist Consultant, AFTU2 in Lagos). The training
started with a presentation on field management that included all the different
components of the household survey implementation. This was followed by the
training for the enumerators selected to work on this survey, which focussed on the
use of Pocket PCs. There were many suggestions by the enumerators on interview
process or content of questions but very little on use of technology. The supervisors
proved to be equally adept with the technology and monitoring the work of the
enumerators and also the Central Office of Statistics Staff have the IT capacity to
handle the advanced technology associated with this survey. In addition, Central
Office of Statistics Staff went through the entire process of creating a new survey in
the Perseus software, uploading to the Pocket PCs, synchronizing the responses into
the laptop and sending data files to the World Bank.

16
Fieldwork
The data collection exercise for the main survey commenced on 6th July 2005 and
ended on September 2nd 2005. Sixty fieldworkers and supervisors were involved in
the fieldwork which comprised a team of five supervisors and twenty-five
fieldworkers per zone. As a quality control measure and also to boost the morale of
the fieldworkers, both scheduled and unannounced extended/extensive field trips
were made by the senior project management personnel of Central Office of
Statistics to check on the logistics, quality and progress of work.
Data Capture and Processing The survey methodology used a technique of hand-held pocket computer where
interviewers entered responses of the heads of households while on the field. Before
the commencement of the fieldwork, the pockets PCs were loaded with the copy of
the final questionnaire using the Perseus Survey Solutions 6 software which was
used to design the questionnaire. The software was used to automate the entire
process of data capture, evaluation, validating and storage of the data. It permitted
fast processing of data and timely release of results. Data were synchronizing from
Pocket PC to laptop every day of the survey week. As part of data quality control,
editing was carried out to ensure that the household name, address and Questionnaire
number was correct. Also automatic correction was done for some selected fields by
the Perseus Survey Solutions application based on some validation rules within the
system.
17
CHAPTER THREE: DATA ANALYSIS DEMOGRAPHY
Part of demographic characteristics that had been adjudged world wide as an
indicator for measuring standard of living of a household is the household size. It is
believed that the bigger the household size the lower their standard of living.
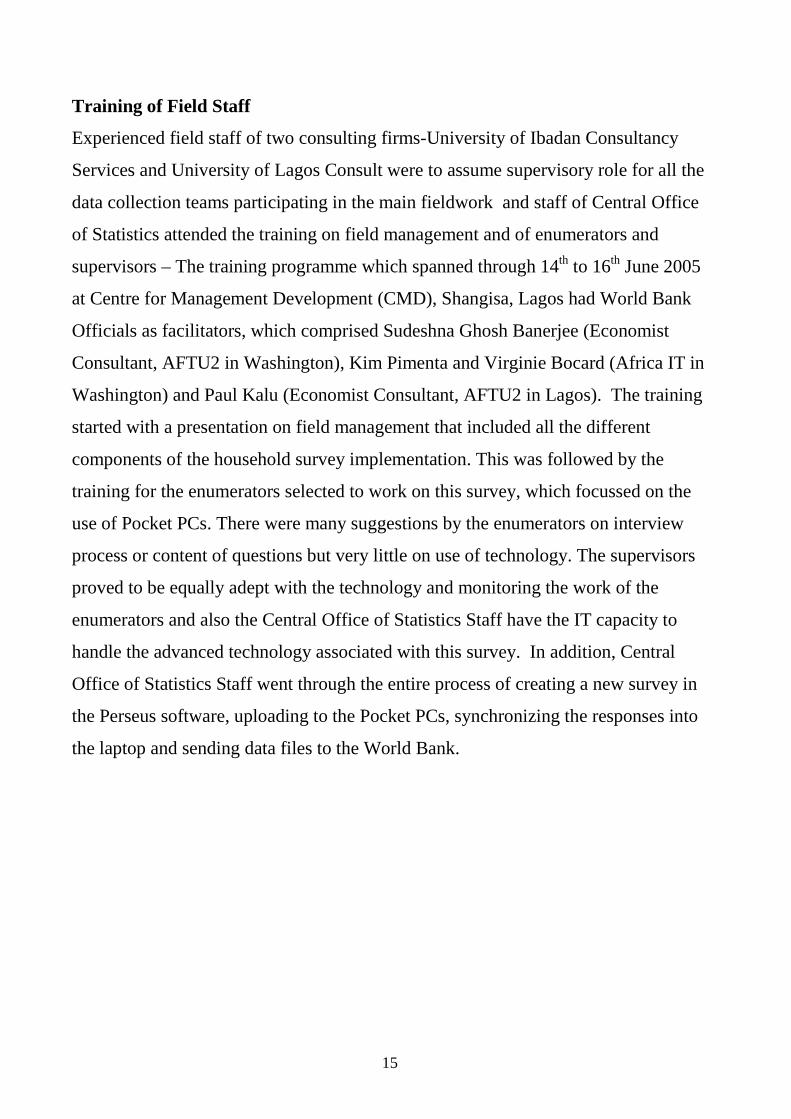
Household-Head Gender In compliance with gender disaggregation of demographic information, the survey
revealed that the household leadership by gender in the State was largely dominated
by male. About 81% of the households were headed by male compared to 19%
recorded for female. Ibeju Lekki LGA recorded the highest rate of households
headed by male with 94% followed by Ajeromi Ifelodun with 90% while Surulere
(76%) had the least figure.
PERCENTAGE DISTRIBUTION OF HOUSEHOLDS-HEAD BY GENDER
81%
19%
Male Female

18
Average household Size
The survey revealed that the average size for the State was five. Similarly, average
number of persons living in a room was 4 persons. Interestingly, at the Local
Government level, the room density was between 3 and 4persons.
In addition, the survey confirmed that 13% of Lagos inhabitants had household size
(1-2) members each , 26% have households size with 3 to 4 members each, 42% also
have households comprising of 5 to 6 members each, 16% of the sampled
households have households size of 7 to 8 members each. Those households with
more than 9 members each accounted for 4% only.
Age categorisation
It is evident that the Age of members or head of sampled households fell within the
working class (15-65years) and they constituted 97% while the remaining
households (3%) comprised adults above 65 years.
Relationship to the Head
Majority of the member of households that responded to the interviewers were
household head with a figure of 93.1% in the State. The survey revealed further that
about 5.5% were spouses to the head, and 0.7% children to the head while the
remaining 0.6 % represented other relatives: brothers/sisters, parents and non
relatives.
Length of Stay in area
The survey conducted in the State showed that the proportion of the head of
households with 1 to 3 members that had lived more than 9 months in the locality
stood at 81%, those with 4 to 6 members stood at 18% while the households with 7
to 9 members in the area represented only 1%.
19
However, percentage distribution of children that had lived more than 9 months in
the neighbourhood in the households with 1 to 3 members each was 79.1% in the
State while those with 4 to 6 members each stood at 20.6% while only 0.3% of the
children sampled households with more than 7 members per household actually
claimed to have lived in the locality for more than 9 months.
Educational Level
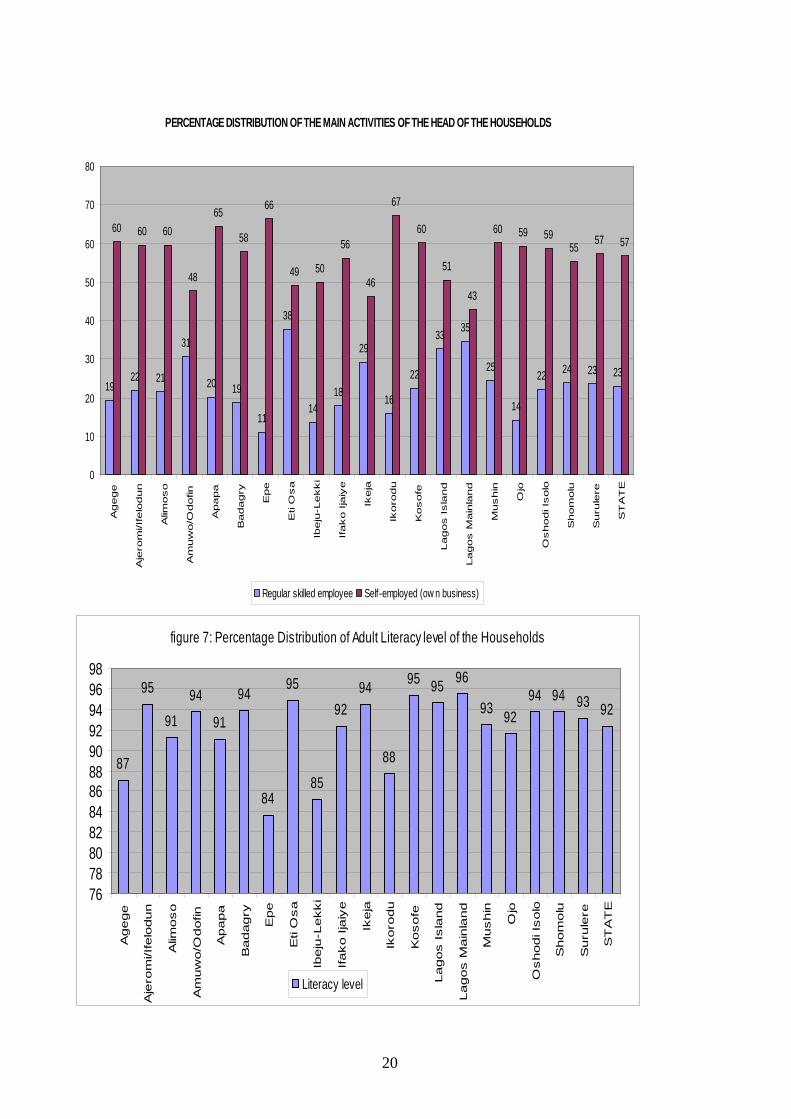
Educational level is one of the key determinants for measuring standard of living. In
confirmation, the survey showed that the State has a very high adult literacy level
(93%) irrespective of geographical and local government spread. The least rate of
adult literacy level was from Epe LGA (83%) while the highest came from Eti-Osa,
Ikeja, Lagos Mainland, Lagos Island and Surulere LGAs each with 96%.
Furthermore, the survey revealed that 46% of the household’s heads in the State had
secondary school certificate, 15% were university graduates, 10% had primary
school leaving certificates while 9% and 5% also had Diploma certificates and
Vocational certificates respectively.
Similarly, the survey showed that 92% of the households’ heads are literate with
Lagos mainland having the highest (96%) while Epe had the lowest number of the
households’ heads that are literate. It should be stressed that ‘literacy’ in the context
of the household survey means reading or writing in English language or any of the
indigenous languages.
Occupational Classification/Mode of Transportation
More than half of the head of households (57%) in the State had their own business
(self employed), 23% were regular skilled workers, 5% were casual skilled and
unskilled employee while about 3% accounted for household heads that were
unemployed, apprentices and pensioners.
On the convenient primary mode of travel to their respective place of work, the
survey also revealed that 77.6% of the sampled households used public buses, 9.4%
go by cars, 6.0% walked while about 3% each choose Okada, Boat and Shared taxi
as their primary mode of travel respectively to their place of work.
20
PERCENTAGE DISTRIBUTION OF THE MAIN ACTIVITIES OF THE HEAD OF THE HOUSEHOLDS
1922 21
31
20 19
11
38
1418
29
16
22
33 35
25
14
22 24 23 23
60 60 60
48
65
58
66
49 50
56
46
67
60
51
43
60 59 5955 57 57
0
10
20
30
40
50
60
70
80
Agege
Aje
rom
i/Ife
lodun
Alim
oso
Am
uw
o/O
dofin
Apapa
Badagry
Epe
Eti
Osa
Ibeju
-Lekki
Ifako Ija
iye
Ikeja
Ikoro
du
Kosofe
Lagos Isla
nd
Lagos M
ain
land
Mushin
Ojo
Oshodi I
solo
Shom
olu
Suru
lere
ST
AT
E
Regular skilled employee Self-employed (ow n business)
figure 7: Percentage Distribution of Adult Literacy level of the Households
87
95
9194
91
94
84
95
85
9294
88
95 95 96
93 9294 94 93 92
767880828486889092949698
Agege
Aje
rom
i/Ife
lodun
Alim
oso
Am
uw
o/O
dofin
Apapa
Badagry
Epe
Eti
Osa
Ibeju
-Lekki
Ifako Ija
iye
Ikeja
Ikoro
du
Kosofe
Lagos Isla
nd
Lagos M
ain
land
Mushin
Ojo
Oshodi I
solo
Shom
olu
Suru
lere
ST
AT
E
Literacy level
21
HOUSEHOLD ASSETS AND AMENITIES
Lagos State the third Global City in the World and reputed to be one of the fastest
growing city in Africa. One wonders about the Assets & Amenities of the economic
and social capital of Nigeria. Ownership of Assets and Amenities is highly
influenced by the economic and social status of a household. However, climate and
geographic area of residence are important contributing factors to ownership of
assets. The survey captured information on ownership of some household assets in
the State.
Interpretations of some of the Assets and Amenities of residents of the State are as
follows:
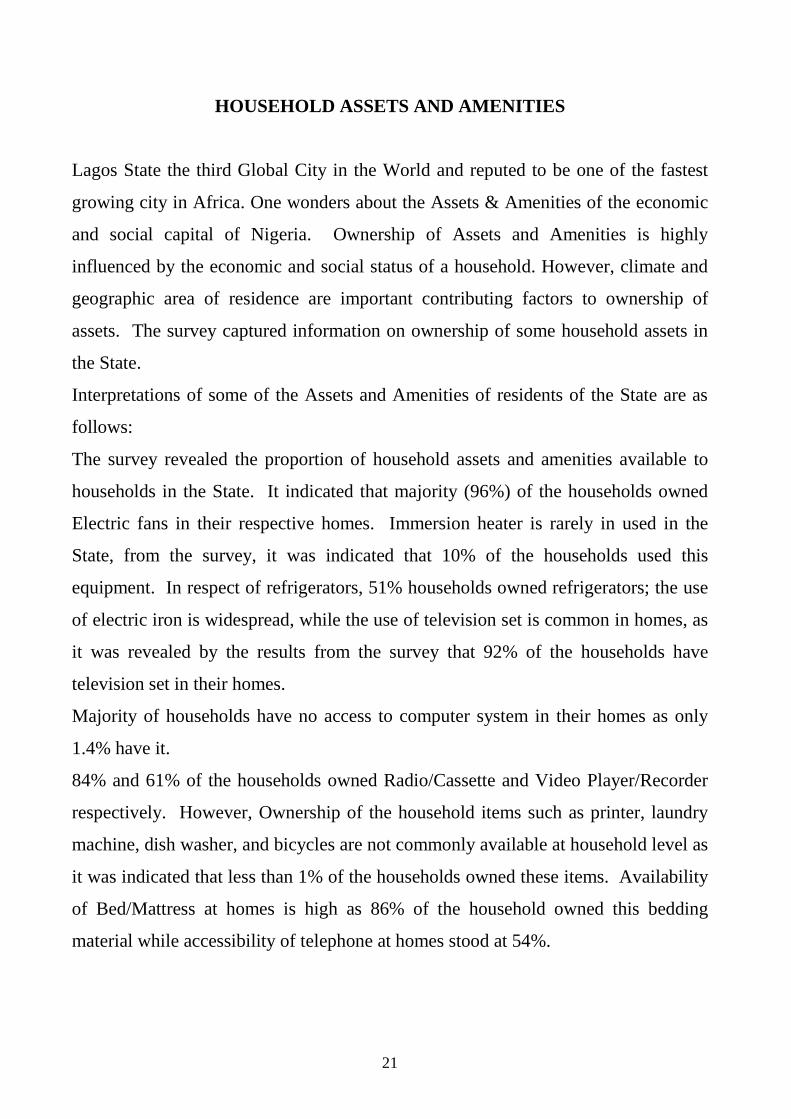
The survey revealed the proportion of household assets and amenities available to
households in the State. It indicated that majority (96%) of the households owned
Electric fans in their respective homes. Immersion heater is rarely in used in the
State, from the survey, it was indicated that 10% of the households used this
equipment. In respect of refrigerators, 51% households owned refrigerators; the use
of electric iron is widespread, while the use of television set is common in homes, as
it was revealed by the results from the survey that 92% of the households have
television set in their homes.
Majority of households have no access to computer system in their homes as only
1.4% have it.
84% and 61% of the households owned Radio/Cassette and Video Player/Recorder
respectively. However, Ownership of the household items such as printer, laundry
machine, dish washer, and bicycles are not commonly available at household level as
it was indicated that less than 1% of the households owned these items. Availability
of Bed/Mattress at homes is high as 86% of the household owned this bedding
material while accessibility of telephone at homes stood at 54%.
22
PERCENTAGE OF HOUSEHOLDS THAT OWN ASSETS/ AMMENITIES BY TYPE
15%
2%
8%
13%
1%8%1%14%
0%
0%
0%
0%
1%
0%
0%
13%
13%
0%10% 0%
ELECTRIC FANS IMMERSION HEATER FRIDGE IRONHOT PLATE PHONE AIR CONDITIONER TabCOMPUTER PRINTER LAUNDRY MACHINE DISH WASHERCAR/TRUCK MOTORCYCLES BICYCLES MATTRESS/BEDRADIO/CASSETTE SEWING MACHINE VIDEO PLAYER/RECORDER CAMERA
23
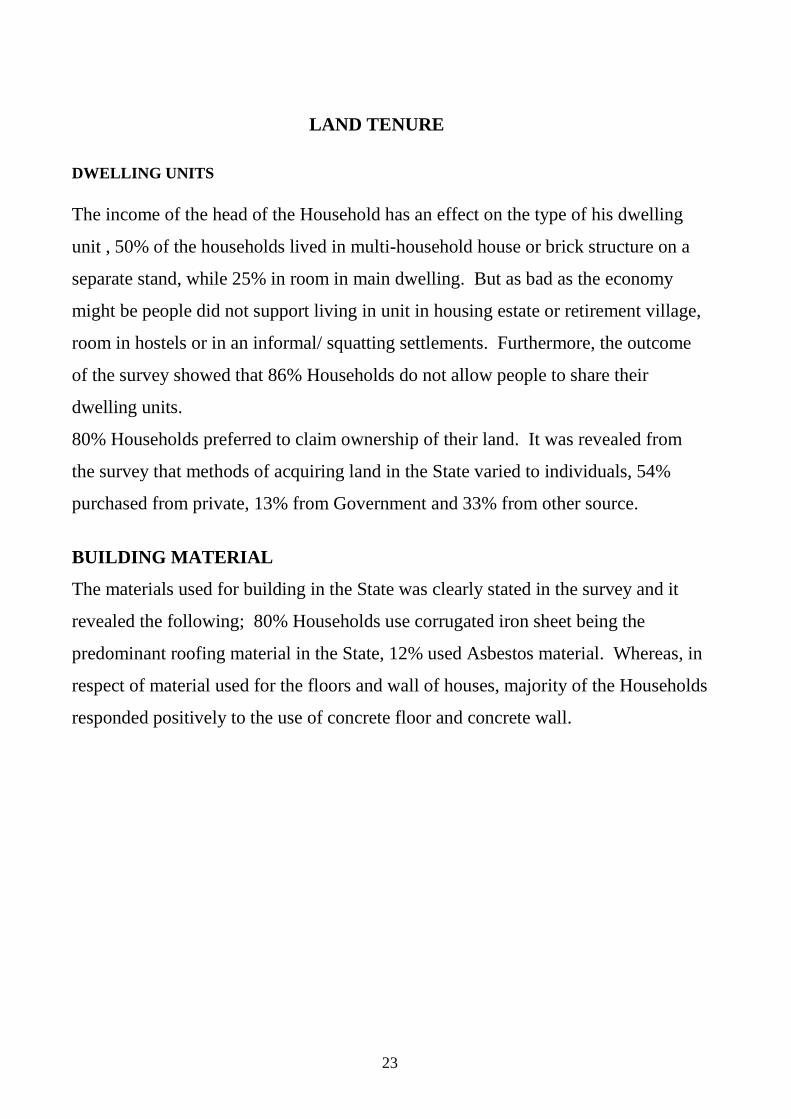
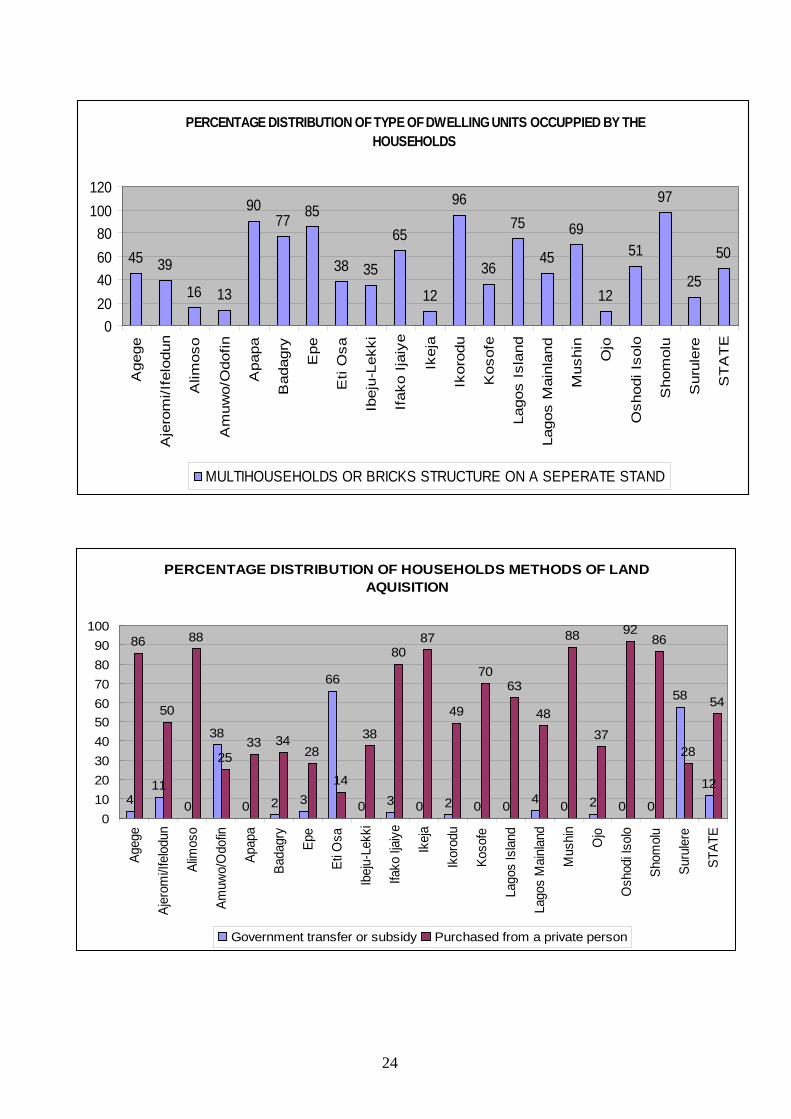
LAND TENURE DWELLING UNITS The income of the head of the Household has an effect on the type of his dwelling
unit , 50% of the households lived in multi-household house or brick structure on a
separate stand, while 25% in room in main dwelling. But as bad as the economy
might be people did not support living in unit in housing estate or retirement village,
room in hostels or in an informal/ squatting settlements. Furthermore, the outcome
of the survey showed that 86% Households do not allow people to share their
dwelling units.
80% Households preferred to claim ownership of their land. It was revealed from
the survey that methods of acquiring land in the State varied to individuals, 54%
purchased from private, 13% from Government and 33% from other source.
BUILDING MATERIAL
The materials used for building in the State was clearly stated in the survey and it
revealed the following; 80% Households use corrugated iron sheet being the
predominant roofing material in the State, 12% used Asbestos material. Whereas, in
respect of material used for the floors and wall of houses, majority of the Households
responded positively to the use of concrete floor and concrete wall.
24
PERCENTAGE DISTRIBUTION OF TYPE OF DWELLING UNITS OCCUPPIED BY THE HOUSEHOLDS
45 39
16 13
9077 85
38 35
65
12
96
36
75
45
69
12
51
97
25
50
020406080
100120
Age
ge
Aje
rom
i/Ife
lodu
n
Alim
oso
Am
uwo/
Odo
fin
Apa
pa
Bad
agry
Epe
Eti
Osa
Ibej
u-Le
kki
Ifak
o Ija
iye
Ikej
a
Ikor
odu
Kos
ofe
Lago
s Is
land
Lago
s M
ainl
and
Mus
hin
Ojo
Osh
odi I
solo
Sho
mol
u
Sur
uler
e
ST
AT
E
MULTIHOUSEHOLDS OR BRICKS STRUCTURE ON A SEPERATE STAND
PERCENTAGE DISTRIBUTION OF HOUSEHOLDS METHODS OF LAND AQUISITION
411
0
38
0 2 3
66
0 3 0 2 0 0 4 0 2 0 0
58
12
86
50
88
2533 34
28
14
38
8087
49
7063
48
88
37
9286
28
54
0102030405060708090
100
Ageg
e
Ajer
omi/I
felod
un
Alim
oso
Amuw
o/O
dofin
Apap
a
Bada
gry
Epe
Eti O
sa
Ibeju
-Lek
ki
Ifako
Ijaiy
e
Ikeja
Ikor
odu
Koso
fe
Lago
s Is
land
Lago
s M
ainlan
d
Mus
hin Ojo
Osh
odi I
solo
Shom
olu
Suru
lere
STAT
E
Government transfer or subsidy Purchased from a private person

25
WATER
SOURCES OF WATER As the saying goes “Water is life” the importance of access to reliable primary
source of water should be stressed in any Service Delivery Assessment Survey. Of
great importance to service delivery is the provision and availability of water to all
and sundry. The survey revealed that 44% of Lagos inhabitants relied on tube
well/borehole as their main source of water supply, 12% depended on public
tap/stand pipe while 11% use protected dug well. Worthy of note is the significant
contributions of the following main water sources: 7% use piped water into dwelling,
8% depends on piped water into yard/plot, 7% rely on unprotected dug well and 7%
also depended on small scale vendor. Other main sources of water like tanker truck,
Surface water: creeks, Lagoon, Rivers, dams attracted only 3%. While 59% of the
households claimed to have safe good primary water for drinking. Meanwhile, 48%
patronized water vendors, a complimentary water production and services outfit
usually established by private individual and corporate organization. Disaggregating
further by type of water vendor, it was revealed that 90% of the households actually
patronized both the Mobile/Street vendors and private neighborhood. However,
minority people use additional source of water supply represented with 29%.
The survey revealed that 65% of the households shared main water source with 10
households and more, 14% shared water source among 4-6 households. Also, 12%
shared the same water source among 7-9 households while only 8% shared same
water source among 1-3 households respectively.

26
TREATMENT OF WATER
However, 39% of the households actually treated their water for safe drinking
amongst these households, 35% boiled their water, 3% used water filter, 2% added
bleach/chlorine, 1% sieved water through cloth and 5% just allowed the water to
settle down.
WATER TARRIFF Water tariff are charges payable on the use of a specific volume of water, usually
collected by Lagos State Water Corporation (LSWC). Private Water Vendors also
charge some fees, this is not regulated and it is subject to individual/corporate
fixtures. It is evidently clear that respondents seldom complained about water tariff,
14% Households shared regular bill from Lagos State Water Corporation (LSWC).
However, in spite of the low patronage of Lagos State Water Corporation (LSWC),
62% households revealed that they have reliable source of primary source of water.
Similarly, only few households complained about water quality statewide.
SOLVING WATER PROBLEM
Meanwhile, 55% of the households in the State were very likely to solve their water
problems individually, 17% each were somewhat likely and very unlikely, 6% were
neither likely nor unlikely, 5% were somewhat unlikely to try to solve waste/water
problem. Conversely, the survey results revealed that solving waste/water problem
by constituting a pressure group, 54% of the households would very likely, 32%
would somewhat likely, 4% unlikely, 5% would somewhat unlikely while 5% would
very unlikely try to solve waste/water problem by using the group.
In conclusion, it was observed that across the State, majority of the households did
not belong to water user or management. In the case of Youth group/association
dealing with water, the percentage was insignificant. On the main benefit of joining
the group/association, only 4.1% of the households claimed to have improved access
to adequate water services.
27
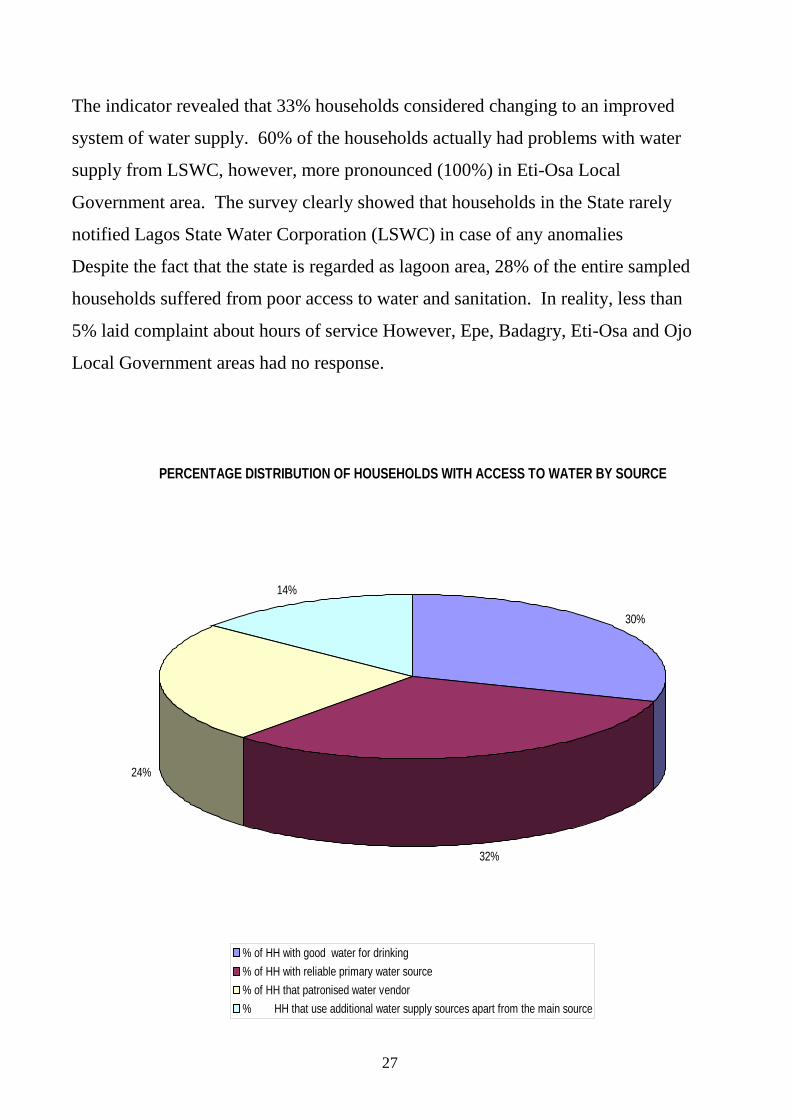
The indicator revealed that 33% households considered changing to an improved
system of water supply. 60% of the households actually had problems with water
supply from LSWC, however, more pronounced (100%) in Eti-Osa Local
Government area. The survey clearly showed that households in the State rarely
notified Lagos State Water Corporation (LSWC) in case of any anomalies
Despite the fact that the state is regarded as lagoon area, 28% of the entire sampled
households suffered from poor access to water and sanitation. In reality, less than
5% laid complaint about hours of service However, Epe, Badagry, Eti-Osa and Ojo
Local Government areas had no response.
PERCENTAGE DISTRIBUTION OF HOUSEHOLDS WITH ACCESS TO WATER BY SOURCE
30%
32%
24%
14%
% of HH with good water for drinking% of HH with reliable primary water source% of HH that patronised water vendor% HH that use additional water supply sources apart from the main source

28
FLOODS Floods are menace to the development and growth of any nation if not given
adequate attention. This has caused a lot of damages which have led to lost of lives,
properties, and destruction of infrastructural facilities. The result of the survey as
regards flood situation at State and Local Government levels revealed the following:
Floods experienced in the House The survey revealed that sixteen percent (16%) of the households in the State
claimed to have experienced floods in their houses in the last one year. Households
in Epe, Oshodi Isolo and Mushin Local Government Areas (LGAs) were less
affected with insignificant level of 3%, 7% and 9% respectively while Lagos
Mainland, Lagos Island and Ajeromi Ifelodun LGAs were mostly affected with 34%,
30% and 25% respectively. The problem of floods was attributed to lack of drainage
system and stagnant water due to blockage.
Floods experienced in the Street
Generally, forty-three (43%) percent of households resided in the State experienced
floods during raining season in their respective streets.
Households in Surulere, Lagos Mainland and Eti-Osa LGAs were highly affected
with 65% and 64% respectively. The dump of refuse in the gutters and canals were
responsible for the problems. Oshodi Isolo (22%) recorded the lowest followed by
Agege and Ifako Ijaiye with 28% each respectively.
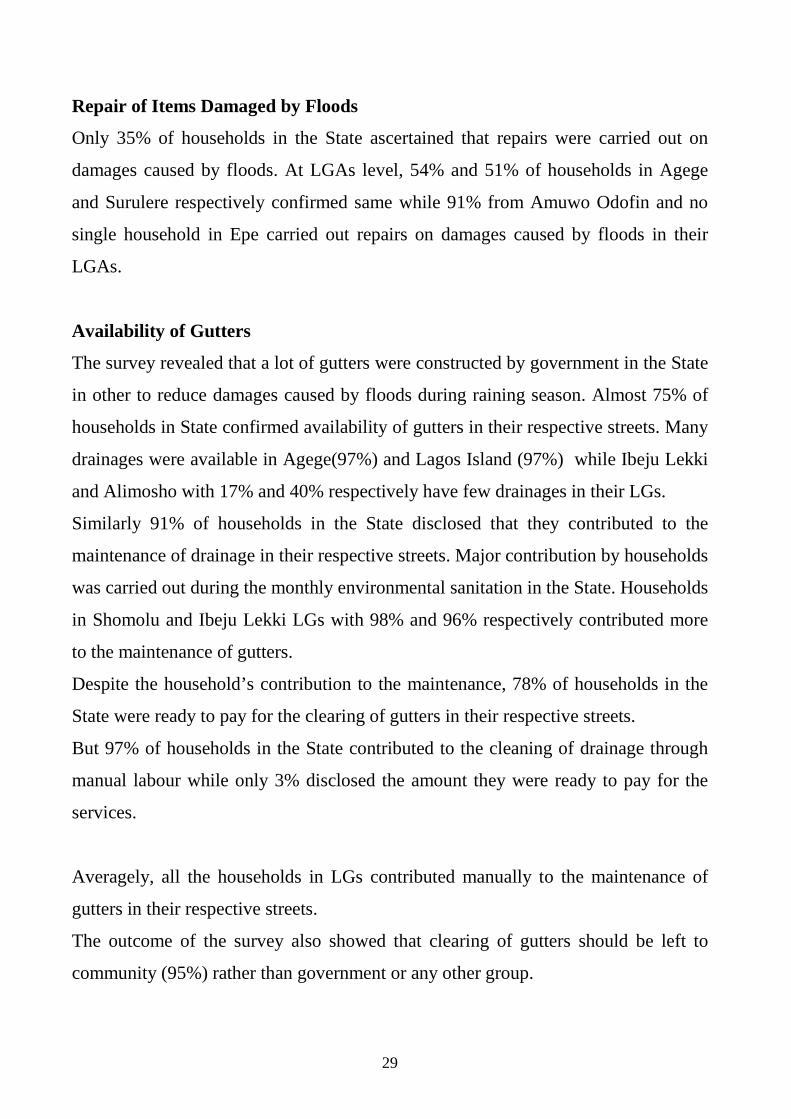
During flooding, 69% of sampled households in the state experienced water level up
to the ankle deep while 23% experienced it up to knee deep. Few households (5%)
experienced water level during floods up to waist while 3% up to higher parts
of the body. Amuwo Odofin (100%) and Badagry (100%) LGAs were highly
affected but reduced in Ibeju Lekki (33%) being a rural area. No households in
Amuwo Odofin and Oshodi Isolo LGs experienced water level up to knee deep
during floods.
29
Repair of Items Damaged by Floods
Only 35% of households in the State ascertained that repairs were carried out on
damages caused by floods. At LGAs level, 54% and 51% of households in Agege
and Surulere respectively confirmed same while 91% from Amuwo Odofin and no
single household in Epe carried out repairs on damages caused by floods in their
LGAs.
Availability of Gutters
The survey revealed that a lot of gutters were constructed by government in the State
in other to reduce damages caused by floods during raining season. Almost 75% of
households in State confirmed availability of gutters in their respective streets. Many
drainages were available in Agege(97%) and Lagos Island (97%) while Ibeju Lekki
and Alimosho with 17% and 40% respectively have few drainages in their LGs.
Similarly 91% of households in the State disclosed that they contributed to the
maintenance of drainage in their respective streets. Major contribution by households
was carried out during the monthly environmental sanitation in the State. Households
in Shomolu and Ibeju Lekki LGs with 98% and 96% respectively contributed more
to the maintenance of gutters.
Despite the household’s contribution to the maintenance, 78% of households in the
State were ready to pay for the clearing of gutters in their respective streets.
But 97% of households in the State contributed to the cleaning of drainage through
manual labour while only 3% disclosed the amount they were ready to pay for the
services.
Averagely, all the households in LGs contributed manually to the maintenance of
gutters in their respective streets.
The outcome of the survey also showed that clearing of gutters should be left to
community (95%) rather than government or any other group.
30
PERCENTAGE DISTRIBUTION OF HOUSEHOLDS THAT EXPERIENCE FLOODS BY TYPES
10%
28%
44%
15%3%
Flood in House Experience of flood on the street Ankle deep Knee deep Waist level or above
31
TOILET FACILITY Access to good toilet facilities such as piped sewer, septic tanks and covered pit
enhance the well being and clean environment in our society. To this end, the survey
result had given the State Government the true picture of these facilities among its
people.
Types of Toilet Facilities
The survey showed that the usage of piped sewer toilets (16%) were not popular
among the households in the State but higher percentage(33%) were using septic
tank toilet facilities. Few households(21%) were still using covered pit toilet in the
state while 4% was recorded for uncovered pit toilet. None of Households in Eti Osa
and Surulere were still using as they recorded no percentage from using. Usage of
pail/bucket, hanging bucket and bush/field has been totally eradicated as they
constituted 0.2%, 0.9% and 4.0% respectively. Households in Badagry and Ibeju
Lekki in rural areas with highest figure (24.9% and 38.9%) were still using
bush/field as toilet. It was revealed further that about one third of households in the
State used septic toilet facilities as they accounted for 31%.
Sharing/Location of Toilet Facility
The survey conducted in the State revealed that one to three members of a family
shares the same toilet facility which accounted for 19%. The number was reduced in
Apapa, Ajeromi and Ojo as they recorded 4%, 5% and 7% respectively. Households
with 4-6 and 7-9 members recorded 23% each respectively. Moreover, the
percentage of families with over 10 members sharing the same toilet facilities was
35% in the State. Ajeromi had the highest figure of 53%, followed by Mushin with
47% and Shomolu having 46%. The three mentioned LGs recorded the highest
figure because were over populated and have old structures. The survey also showed
that 49% of households in the State located the toilet outside their houses while 50%
located their own inside the house or elsewhere around the house.
32
Only 6% of households surveyed paid for the usage of toilets. Payment for the usage
of private toilets was common in Apapa and Ajeromi with 13% and 10%
respectively.
Number of Families sharing Toilet Facilities
The analysis of number of families that shared one or another type of toilet in the
State indicated that over 10 families (35%), 7-9 families (25%) and 4-6 families
(21%). There are high percentage of 1-3 families sharing toilet facilities in Local
Governments like Surulere (50%) and Eti-Osa (49%). However in Ajeromi Ifelodun
and Mushin LGAs had 51% and 50% of the Households respectively had over 10
families sharing toilet facility.
Location of Toilet Facilities
Less than half of Lagosians had their Toilet facility located outside the house on the
plot; a little above 50% had their facility located inside the house, while 1% had
theirs outside the plot or public chemical toilet. In Surulere Local Government Area,
majority (81%) had their toilet facility inside the houses. While in Eti-Osa LGA 39%
had theirs inside the houses. The highest percentage of Households using outside
toilet facility were found in Ojo (70%) and Ajeromi Ifelodun (65%).
Payment for the use of Toilet Facilities
It was indicated that 5.9% of the people of the State pay for use of toilet facilities.
Nearly all Local Governments in the State with the exception of Ibeju Lekki pay to
use toilet facility. The highest percentages of households were found in Apapa
(13.2%), Ajeromi Ifelodun (10.3%) and Epe (8.2%).

33
PERCENT OF HOUSEHOLDS THAT FLUSH TO SEPTIC TANK
1418 18 18 20 22 24
26 28 2932 35 35 35
3841 42
44 4548
31
0
10
20
30
40
50
60
Ibej
u-Le
kki
Epe
Ikor
odu
Age
ge
Bad
agry
Ojo
Apa
pa
Ifak
o Ija
iye
Alim
oso
Aje
rom
i/Ife
lodu
n
Osh
odi I
solo
Kos
ofe
Ikej
a
Mus
hin
Lago
s Is
land
Sho
mol
u
Am
uwo/
Odo
fin
Sur
uler
e
Lago
s M
ainl
and
Eti
Osa
ST
AT
E
PERCENTAGE DISTRIBUTION OF HOUSEHOLDS THAT USE COVERED PIT LATRINE
4442
3832
29 2925 25
23 23 22 2015 13
7 6 6 51 0
21
05
101520253035404550
Alim
oso
Agege
Epe
Aje
rom
i/If
elo
dun
Ikoro
du
Badagry
Oshodi Is
olo
Ikeja
Ifako I
jaiy
e
Mushin
Apapa
Ojo
Shom
olu
Kosofe
Am
uw
o/O
dofin
Ibeju
-Lekki
Eti O
sa
Lagos M
ain
land
Suru
lere
Lagos I
sla
nd
ST
AT
E
34
SANITATION
Solid Waste Removal
Environmental sanitation was defined as the cleaning of surroundings and dumping
of refuse at designated places.
Large number of households (74%) in the State had access to sanitation and water.
43% of households suffer from poor quality of water and sanitation in the State. Ojo
and Surulere LGs were highly affected with 61% and 59% respectively.
The survey revealed that 42% of households dumped refuse through government
(PSP) while 39% employed the services of truck pusher/private collectors.
Households that dumped refuse through government were common in Shomolu
(90%), Mushin (87%) and Oshodi Isolo (77%). Households in Surulere and
Alimosho preferred to engage the service of private collector/truck pusher with a
figure of 74% and 69% respectively.
Dumping of refuse in unauthorized places, within compound and government bins
was not common in the State as they constituted only 11%, 4% and 1% respectively.
The outcome of the survey showed that households (100%) in the State did not used
to notify government (LAWMA) of unauthorized dumping of refuse. The proportion
of households (71%) that satisfied with dumping of refuse in the State was higher
than households not satisfied.
Solution to Waste/Water Problem
In solving waste/water problem, 25% households in the State were ready to join
association, community or government while 33% were not prepared. Only Eti Osa
was ready to give their total support with a figure of 100%. Few households (11%)
could not decide whether to join any group to solve waste/water problem.

35
PERCENTAGE DISTRIBUTION OF HOUSEHOLDS MODE OF SOLID WASTE DISPOSAL
4144
2823
18
0 1
35
2
36
62
19
55 52 52
87
20
77
90
24
42
59
46
69
56
75
35
10
24
5
63
23
48
26
44
36
11
2821
10
74
39
0
10
20
30
40
50
60
70
80
90
100
Ag
eg
e
Aje
rom
i/If
elo
du
n
Alim
oso
Am
uw
o/O
do
fin
Ap
ap
a
Ba
da
gry
Ep
e
Eti O
sa
Ibe
ju-L
ekki
Ifa
ko
Ija
iye
Ike
ja
Iko
rod
u
Ko
so
fe
La
go
s I
sla
nd
La
go
s M
ain
lan
d
Mu
sh
in
Ojo
Osh
od
i Is
olo
Sh
om
olu
Su
rule
re
ST
AT
E
Collected by the government house to house (PSP) Truck pusher / private refuse collector

36
ELECTRICITY Primary Source of Energy
The survey showed that 98% of households in Lagos State used electricity direct
from NEPA as their primary source of energy. Half of the local governments
(Agege, Ajeromi Ifelodun, Apapa, Epe, Eti-Osa, Ikorodu, Lagos Island, Lagos
Mainland, Shomolu and Surulere) in the State had NEPA as their primary source of
energy with 100% while Ibeju Lekki recorded the lowest of 65%.
The usage of other sources of energy such as solar/generator, candles, battery, gas,
paraffin/kerosene and wood was not common in the State. 10% of the households
used solar/generator as their primary source of energy, 14% of all the households
used candles, 18% used paraffin/kerosene, 3% for battery, while gas and wood/coal
stood at 1%.
Type of Electricity By Conventional Meter
About 99% of the households in the State used conventional NEPA meter. 100% of
Households in the following local government areas Apapa, Badagry, Lagos Island,
Lagos Mainland, Oshodi Isolo, Shomolu and Surulere used conventional meter. The
prepaid metering of electricity consumption was rare in the State as some households
in the Eti-Osa Local Government Area indicated the usage with only 8%. However,
some households in Ibeju-Lekki, Kosofe and Ojo Local Government Areas indicated
that their houses were without meters.
Mode of Payment NEPA Bills
Majority of the households (95%) in the State used cash to settle their electricity
bills. While very few of the households used Bank or Cheque as medium of payment
of electricity bill.
37
Unexpected interruption of Electricity
A measure of satisfaction with service rendered by NEPA was obtained through the
number of days without electricity before the survey. The result showed that
preponderance of the households (83%) in the State experienced unexpected
interruptions of power supply in electricity daily; while very few (9%) households
had experience few times a week and less than 3% experience few times a month.
Only 1% of households in State had no experience of the power interruption. The
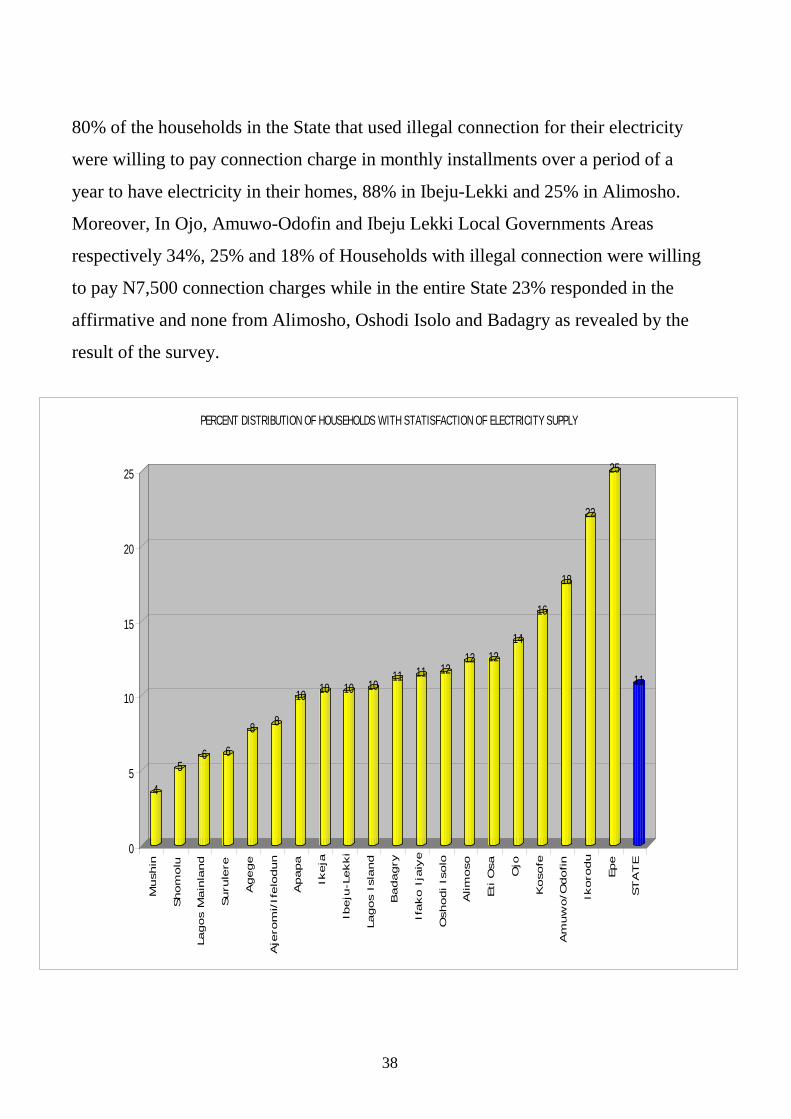
level of satisfaction of electricity supply in the State stood at 11%.
Opinion on Power Source in the State
47% (Forty seven percent) of households in the State responded that they
experienced damage to household appliances due to low/high voltage, while the
highest 67% came from households in Lagos Island and Surulere LGAs, Epe and
Badagry LGAs had the lowest 24% each.
Estimated Value of Damages on Repairs or Replacements (In Naira)
Majority of the households spent in the range of 1001 to 5000 naira to replace/repair
equipment damaged due to power surge in the State. Few of the households spent
between 5001 to 10000 naira while less than 1% households spent no amount to
repair/replace their equipment.
On the opinion of use of standby power source, the survey revealed that only 10% of
the households had a standby power source. Local government disaggregation
showed that households in Eti-Osa LGA had 26%, Amuwo Odofin had 19%, Lagos
Island 13% and Epe had none. Willingness of households to buy electricity if
available from third party was also measured; it was surprising that 62% of
Lagosians were willing to buy power from third party. 71% and 69% in Ojo and
Amuwo-Odofin LGAs respectively, while 52% and 41% in Epe and Apapa LGAs
respectively.
38
80% of the households in the State that used illegal connection for their electricity
were willing to pay connection charge in monthly installments over a period of a
year to have electricity in their homes, 88% in Ibeju-Lekki and 25% in Alimosho.
Moreover, In Ojo, Amuwo-Odofin and Ibeju Lekki Local Governments Areas
respectively 34%, 25% and 18% of Households with illegal connection were willing
to pay N7,500 connection charges while in the entire State 23% responded in the
affirmative and none from Alimosho, Oshodi Isolo and Badagry as revealed by the
result of the survey.
45
6 68 8
10 10 10 10 11 11 1212 12
14
16
18
22
25
11
0
5
10
15
20
25
Mush
in
Shom
olu
Lagos
Main
land
Suru
lere
Agege
Aje
rom
i/If
elo
dun
Apapa
Ikeja
Ibeju
-Lekki
Lagos
Isla
nd
Badagry
Ifako I
jaiy
e
Osh
odi Is
olo
Alim
oso
Eti O
sa
Ojo
Koso
fe
Am
uw
o/O
dofin
Ikoro
du
Epe
STATE
PERCENT DISTRIBUTION OF HOUSEHOLDS WITH STATISFACTION OF ELECTRICITY SUPPLY

39
EDUCATION AWARENESS
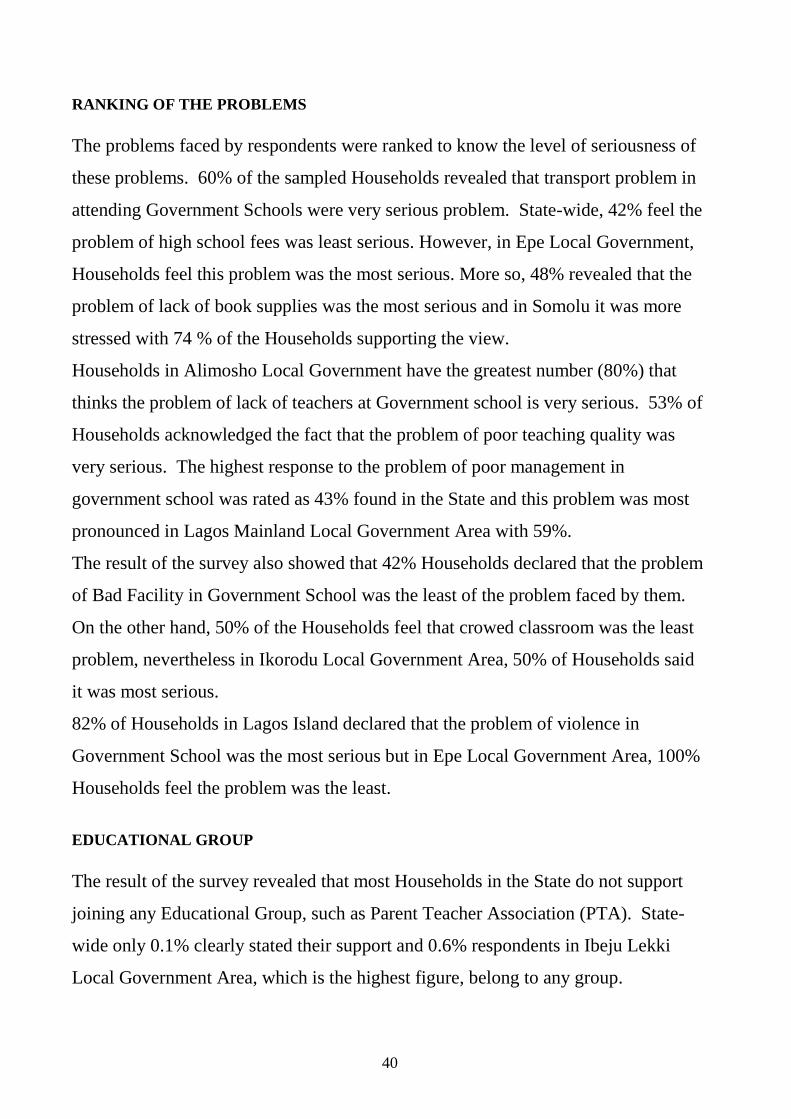
The survey revealed that 86% of the sampled Households know that Government
Primary Schools exist and 69% knows of the existence of Government Secondary
Schools in their communities. 64% Households indicated that their Children attend
school in their immediate neighbourhood. However, negligible proportion of
Children did not attend Schools outside their neighbourhood due to the following;
quality of education, language/ religion and cost.
PROBLEMS FACED IN GOVERNMENT SCHOOLS
All respondents in almost all the Local Governments in the state are satisfied with
services provided by the State Government in their community; on the average 68%
Households were satisfied. Moreover, the various reasons for not sending
Children/Wards to Government Schools was well expressed by respondents in the
survey; 14% say because of lack of teachers, 25% poor school management, 21%
facilities in bad condition, 15% crowded classroom, 4% Households expressed
transportation, 12% lack of books and supplies as the major problem in attending
Government Schools. 59% are satisfied with services provided by Government in
their community. Also, the insignificant response of respondents showed that a high
school fee at Government Schools was not a problem. The problem of non-safety at
government schools was also expressed, 3% of the respondents attested to this
declaration with 9% of inhabitants in Lagos Island stressing the problem.
40
RANKING OF THE PROBLEMS The problems faced by respondents were ranked to know the level of seriousness of
these problems. 60% of the sampled Households revealed that transport problem in
attending Government Schools were very serious problem. State-wide, 42% feel the
problem of high school fees was least serious. However, in Epe Local Government,
Households feel this problem was the most serious. More so, 48% revealed that the
problem of lack of book supplies was the most serious and in Somolu it was more
stressed with 74 % of the Households supporting the view.
Households in Alimosho Local Government have the greatest number (80%) that
thinks the problem of lack of teachers at Government school is very serious. 53% of
Households acknowledged the fact that the problem of poor teaching quality was
very serious. The highest response to the problem of poor management in
government school was rated as 43% found in the State and this problem was most
pronounced in Lagos Mainland Local Government Area with 59%.
The result of the survey also showed that 42% Households declared that the problem
of Bad Facility in Government School was the least of the problem faced by them.
On the other hand, 50% of the Households feel that crowed classroom was the least
problem, nevertheless in Ikorodu Local Government Area, 50% of Households said
it was most serious.
82% of Households in Lagos Island declared that the problem of violence in
Government School was the most serious but in Epe Local Government Area, 100%
Households feel the problem was the least.
EDUCATIONAL GROUP The result of the survey revealed that most Households in the State do not support
joining any Educational Group, such as Parent Teacher Association (PTA). State-
wide only 0.1% clearly stated their support and 0.6% respondents in Ibeju Lekki
Local Government Area, which is the highest figure, belong to any group.
41
PERCENTAGE OF HOUSEHOLDS BY EDUCATION AWARENESS/ ATTENDANCE
29%
24%10%
22%
5%
0%
2%
1% 7%
Knowledge of govt. primary sch in communityKnowledge of govt. Sec. Sch in communityChildren attending govt. Sec. Sch. In communityChildren attending sch in the immediate neighbourhoodChildren attending sch. Outside neighbourhood due to quality of educationChildren schooling outside neighbourhood due to language/religionChildren attending sch. Outside neighbourhood due to safetyChildren attending sch outside neighbourhood due to costChildren attending sch outside neighbourhood for other reasons

42
ECONOMY Average Monthly Expenditure The survey revealed that 52% of households in the State incurred expenses above
=N=10, 000 on monthly basis, this indicated high cost of living in the State. It was
revealed from the study again that 2% and 6% responsible for households average
monthly expenditure between below =N=2, 000 and =N=2, 000 to =N= 4, 000.
Households in Alimosho, Amuwo Odofin, Apapa, Eti Osa, Ikorodu, Ikeja and others
disclosed that they did not spend up to =N=2, 000 on monthly basis.
Receiving Money from Abroad The result of the study shows that 8% and 5% of households in the State received
money both formally and informally respectively from abroad via banks and friends.
Households in Eti-Osa, Lagos Island and Lagos Mainland were the three top ranked
local governments that received remittances from abroad having 17%, 13% and 13%
respectively. Households in Epe and Kosofe L.G recorded the lowest figure in
receiving remittance from abroad with 2% each respectively, which put them among
the least L.G.A that received money from abroad.
Sending money within State The percentage of households that sent money to their relatives informally in the
State stood at 45% while through formal channels was only 1%. The survey
indicated that sending of money through formal channels was not popular among the
households in the State. Only insignificant number of households in Lagos Island
(5%), Surulere (3%) and Badagry (3%) send money formally. Furthermore, only
19% households sent money to other people within the State.

43
Sending Money within /outside the country Few number of households (27%) in the State sent money within the country while
only 1% sent money outside. Averagely, all Local government in the State sent
money within the country in exception of Badagry, Epe and Ibeju Lekki from rural
areas that recorded the lowest percentage of 8%, 7% and 4% respectively.
PERCENTAGE DISTRIBUTION OF HOUSEHOLDS MONTHLY EXPENDITURE
1114
1016 18
1119
1118
104
10 8 7 7 1018
106
14 11
59
37
59
48 49
31
21
63
20
6368
51
6055
60 60
27
5761 63
52
0
10
20
30
40
50
60
70
80
Agege
Aje
rom
i/Ifelo
dun
Alim
oso
Am
uw
o/O
dofin
Apapa
Badagry
Epe
Eti O
sa
Ibeju
-Lekki
Ifako Ija
iye
Ikeja
Ikoro
du
Kosofe
Lagos Isla
nd
Lagos M
ain
land
Mushin
Ojo
Oshodi Is
olo
Shom
olu
Suru
lere
ST
AT
E
4000 - 6000 Above 10000

44
PERFORMANCE OF GOVERNMENT IN PROVISION OF SERVICES Federal Government {FG}
Service delivery by the Federal Government to the public had been rated differently
by Households in the State. Generally, about 48% of households in the rated
services provided by Federal government as being bad, while only 26% and 25%
households considered the service as satisfactory and good respectively. 3% of
households from Ikeja and Ikorodu LGAs scored Federal Government excellent,
36% Households in Ifako Ijaiye and Ikorodu LGAs each scored FG well. In
Amuwo-Odofin, Epe and Lagos Island LGAs, 20% each of Households were
satisfied with the performance of Federal Government in Public Service delivery
while in Apapa LG, 65% of Households did not rate Federal Government well.
State Government {LASG} About 33% of households were satisfied with the services provided by the State
government while 25% scored the services well. But 2% households considered the
services as excellent. Moreover, 40% of households in the State were not satisfied
with the services provided by the State government. The analysis further indicated
that less than 7% Households in Amuwo-Odofin LGA rated State performance as
excellent, 40% from Ikorodu as good, 45% in Lagos Island were satisfactory with
the performance.
Local government {LG}
The survey revealed that 60% of households in the State rated the services provided
by Local government as not satisfactory (bad) while only 25% were satisfied. In
addition, only 19% of households graded the LGAs as good and less than 1% rated
performance of LGAs as excellent.
Less than 3% Households in Amuwo and Epe LGAs rated LG performance as
excellent in Pubic Service delivery to the citizenry. Furthermore, the survey pointed
out that majority of Households (71%) in Apapa LGA scored Local government bad,
36% of the households in Lagos Island LG were satisfied with the service delivery
provided by, while 28% in lkorodu LG rated the Ikorodu LG as good.

45
PAYMENT FOR SERVICES
Road services
From the view of the households surveyed, majority of households(43%) in the State
believed that roads servicing should be paid for by the Federal Government while
39% felt it was the responsibility of the State. Some households (17%) believed that
Local government should pay for roads maintenance while only 1% prefer
community. No households in the State prefer Private provider and others to pay for
roads maintenance.
3% (Three percent) of households in Ifako LGA felt that community should pay for
roads maintenance, 34% from Kosofe believed that it was the responsibility of the
Local Governments, 62% each from Apapa and Eti-Osa considered the payment for
servicing of the roads as duties of the Federal Government while 53% from Epe says
it is the State Government’s duty. It was noticed from the survey that households in
the State did not support the assistance of a private provider except 1% of
households in Amuwo and Oshodi Local Government Areas.
Drainage services
The survey revealed that about 42% of households expected State government to pay
for clearing of drainage while 39% of households preferred Local government to pay
for the services. Only (11%) and (8%) of the households prefer Federal government
and community to pay for drainage services.
Moreover, 17% of households in Surulere LGA felt that drainage services should be
paid by the community, 51% from Eti-Osa says that it is the responsibility of the
Local Governments, 19% from Ibeju –Lekki feel it is the duties of the Federal
Government, 63% from Epe says it is the State’s duty . Although most of the LGA
do not support the assistance of a private provider except 1% of responses in
Alimosho, Ifako, Lagos Mainland, Oshodi and Shomolu Local Government Area.
46
Street Light
Majority of the sampled households (49%) expressed their view that they preferred
State government to pay for the street lighting services. These services range from
provision of transformer, cables, poles and servicing. Only 21% and 25% of
households expected Federal and Local government to pay for the services while 3%
and 1% preferred Community and and private provider. At Local government level,
6% of households in Ikeja and Lagos Mainland felt that street lighting services
should be paid by the community, 35% from Ikorodu, Mushin and Oshodi -Isolo
says that it is the responsibility of the Local Governments, 32% from Ifako –Ijaiye
felt it is the duties of the Federal Government, 72% from Epe says it is the State’s
duty.
Water supply
A large number of households (78%) expressed their opinion that the State
government should be responsible for the payment of water supply to its people.
Households that wanted payment by Federal and Local government constituted 12%
and 6% respectively, community (1%), private provider (3%). About 12% and 10%
of households in Lagos Island/Mainland preferred private provider to pay for water
supply.
Public toilet
Payment for the public toilet services by Local government was highly supported by
(50%) of households sampled in the State while 24% households expected State
government to pay for the services. Moreover, only 10% households wanted the
payment to be left for the private providers and few households expected community
(9%) and Federal government (5%) to pay for the services. 20% (Twenty percent) of
households in Lagos Island LGA felt that Public Toilet services should be carried out
by the community, 58% in Oshodi -Isolo confirmed that it was the responsibility of
the Local Governments while 10% from Ifako –Ijaiye believed it was the duties of
the Federal Government. Therefore, it was shown clearly from the survey that
47
majority of people in the State expected local government to pay for public toilet
services.
Health Care
The survey showed that 59% of households signified that payment for health care
services should be made by the State Government rather than federal and Local
government which constituted 30% and 9% respectively. People in the State believed
that payment for the services should not be left in the hands of community and
private with 1% each respectively. Furthermore, 4% of households in Ifako and
Kosofe Eti-Osa LGA felt that health services should be paid by the community, 12%
from Ikeja, Ikorodu, Oshodi and Shomolu wanted the responsibility to be shouldered
by Local Governments. 67% from Epe said it was the duty of State, 5% of
respondents from Lagos Island and Lagos Mainland LGAs felt that the service
should be paid by private provider and none supported other Agency.
School Services The survey revealed that 61% of households expected the State government to pay
for schools services such as payment of exam fees, provision of textbooks,
maintenance of school buildings etc. while 32% and only 4% households in the State
preferred Federal and Local governments respectively to made payment for the
services. Moreover, lowest figure (1%) was recorded for households in support of
community paying for schools services in Lagos Mainland and Shomolu. 12% from
Ikorodu felt that payment for school services should be the responsibility of the
Local Governments while half of sampled households in Eti-Osa wanted Federal
Government. Households from Ikeja and Ibeju Lekki with figure 4% each believed
that the services should be paid by private provider and no household’s in the State
supported the involvement of any other Agency.

48
Solid Waste Disposal
The report of the study showed that (43%) of households agreed that the payment for
solid waste disposal should be the responsibility Local Government rather than
Community, private provider and Federal Government with figures of 8%, 7% and
4% respectively. Also, 15% each of households in Epe and Lagos Island LGAs felt
that waste disposal services should be paid by the community, 52% from Eti-Osa
chooses Local Governments, 8% responses from Ifako and Ikeja wanted the payment
by Federal Government while 46% from Lagos Island said it was the duty of State
government. 17% responses from Apapa referred the services paid by private
provider.
Recreation Facilities From the survey result, 32% of households agreed that State government should pay
for services of recreation facilities in the State. 24% of the households believed that
the services be provided by Federal Government and 21% of the household believed
that the services should be provided by the Local Governments, while insignificant
figure of 1% preferred private providers. Moreover, only 20% of households in Eti-
Osa LGA felt that services of recreation facilities should be paid by the community,
33% from Ikorodu, disclosed that it was the responsibility of the Local Governments,
31% from Ibeju-Lekki confirmed that it was the duties of the Federal Government
and 41% from Agege said it was the State’s duty. 26% of the households in Lagos
Island LGA felt that the services should be paid by private provider and 5%
responses in Apapa supported the assistance of any other Agency.

49
Post Office
Post office services to households by the survey was defined as postage of mails,
sales of postal documents, assisting in sending money in any form within and outside
the Country, etc.
The survey revealed that almost half of sampled households (49%) expressed their
view that federal government should paid for services rendered by post office in the
State while 36% resident of the State preferred State government to pay for the
services. Kosofe (60%) had highest figure of households that preferred federal
government, followed by Oshodi and Agege with 57% and 56% respectively.46% of
households in Amuwo Odofin, 44% from Ojo wanted State to pay for post office
services while Kosofe had the lowest of 27%. Insignificant figure of households in
the State viewed that the payment should be handled by Local government(7%),
private provider (5%) and community (2%).
Telephone
By this survey, telephone services were provision of telephones at strategic areas at a
very reasonable rate for the resident of households in the State
The study revealed that households in the State indicated that payment for telephone
services should be handled by private sector with a figure of 39%. Also, 37% of
households in the State expected the federal government to pay for the services while
17% preferred State government and 5%, community.
14% of households in Shomolu LGA believed that Telephone Services should be
paid by the community, 5% each from Kosofe and Oshodi -Isolo said that it was the
responsibility of the Local Governments. 52% from Kosofe wanted Federal
Government while 27% from Ibeju-Lekki believed it was the duty of the State.
Meanwhile, 63 % responses from Ojo felt the service should be paid by private
provider and 4% in Mushin supported the assistance of any other Agency.
50
Markets Above average households (51%) in the State signified that the payment for markets
services should be made by the Local Government, 26% preferred Local government
while 15% community. Only few households preferred federal government (4%) and
private provider (3%).
The survey further revealed that 26% of households in Surulere LGA felt that
services of markets should be paid by the community, 60% from Alimosho, said that
it was the responsibility of the Local Governments, 9% from Ikeja indicated that it
was the duties of the Federal Government and 42% from Epe said it was the State’s
duty .
Maintenance of these Services
From the result of the survey conducted, it was revealed that 37% of households in
the State were ready to contribute both cash and labour in maintenance of services
provided by the government while 35% were ready to contribute only their labour.
Households (23%) in the State were ready to contribute only cash and 5% were not
prepared to contribute anything towards the maintence. 53% of households in Ibeju-
Lekki were ready to contribute labour to the maintenance of the services, 36% from
Lagos Island by only cash while (50%) of households in Apapa were ready to
contribute both cash and labour. 11% (Eleven percent) households from Mushin did
not wish to contribute nothing in maintenance of the services.
51
SECURITY
Provision of safety and security for the lives and properties of the state inhabitants is
cardinal to the effective governance at state and local level. Contrary to the widely
held opinion on the crime situation in the state, the survey revealed that only 2%
(two percent) of the respondents had actually been victims of any crime. Similarly
only 4% (four percent) of the sampled households experienced crime against their
properties.
On the other hand, households that had adequate access to Community Policing
Services and Government Policing Services stood at 11% (eleven percent) each.
Taken into consideration the population and metropolitan nature of Lagos State, the
survey results showed that provision of Ambulance and Fire Brigade Services were
grossly inadequate, since 99% (ninety nine percent) of the sampled households did
not have adequate access to them indicating that only one percent of the sampled
households had enough access to the facilities.
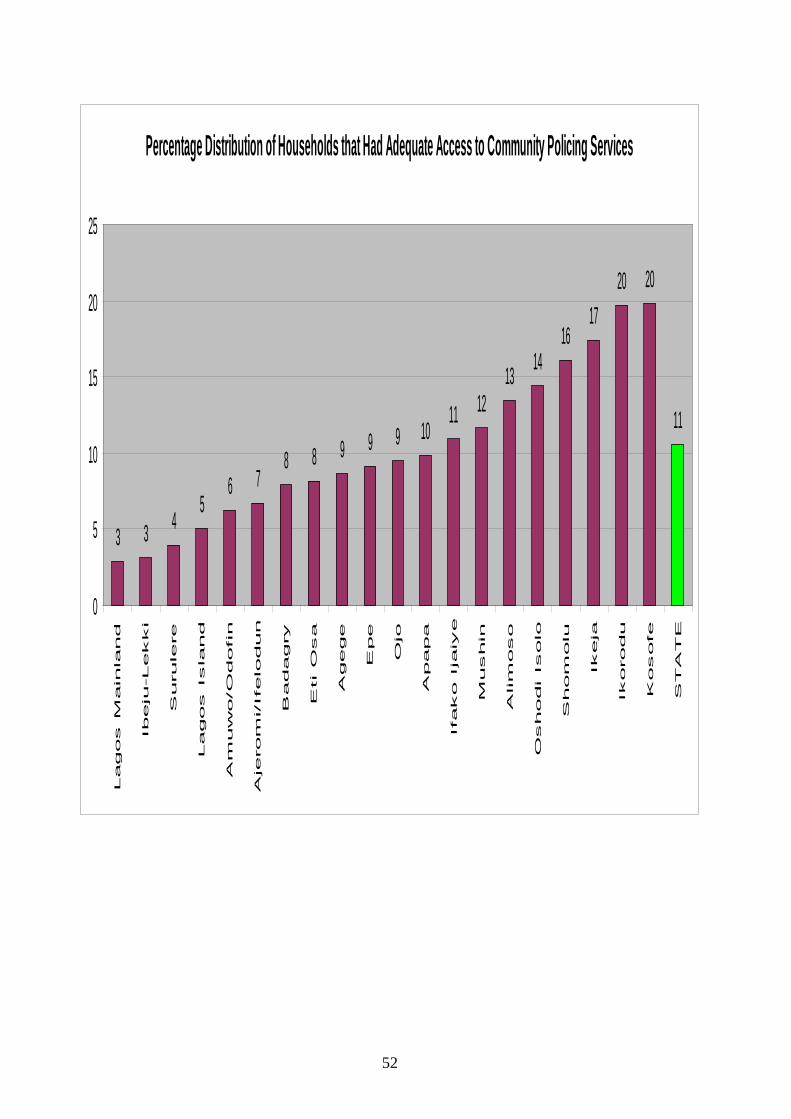
52
Percentage Distribution of Households that Had Adequate Access to Community Policing Services
3 3 45
6 78 8 9 9 9 10
11 1213 14
1617
20 20
11
0
5
10
15
20
25
Lagos M
ain
land
Ibeju
-Lekki
Surule
re
Lagos Isla
nd
Am
uw
o/O
dofin
Aje
rom
i/Ifelo
dun
Badagry
Eti O
sa
Agege
Epe
Ojo
Apapa
Ifako Ija
iye
Mushin
Alim
oso
Oshodi Isolo
Shom
olu
Ikeja
Ikorodu
Kosofe
ST
AT
E
53
SOCIAL NETWORK This is a social project initiative by group of individuals or corporate organization to
compliment government efforts at assisting the communities in the provision and
maintenance of infrastructures and social services to ensure better life, growth and
sustainable development in terms of access, utilization and satisfaction.
MEMBERSHIP WITH ASSOCIATION/GROUP In order to understand the level of interaction amongst the households as regards
socio-economic related association/group, the following social network indicators
were generated. It was observed that Households that did not belong to water user or
management association were very large and cut across the entire Local Government
Areas in the state. Consequently, responses from the survey revealed further that all
the sampled households across the Local Government Areas, with the exception of
Lagos Island and Ibeju-Lekki, did not belong to any consumer association. State-
wide, the survey revealed that almost all the Households did not belong to the
Environmental and Waste Management Group. This indicated that only a sprinkle of
Households in the affected areas actually joined the waste management group.
Trade/ Labour union is an effective mouthpiece where industrial/ occupational
related disputes were settled. To this end, the contribution of such association to
industrial harmony is worthy of assessment. It was noticed that a large proportion of
the selected Households across the state did not belong to labour/ trade union, this
could possibly be attributed to inadequate awareness on the accruable benefits for
joining such unions.
Neighborhood Committees and Community Development Agencies are social
project initiatives consisting of group of individuals and corporate Organization with
specific objectives to support the Community in the provision of infrastructural
facilities and services through self help projects that would guarantee better life for
the inhabitants, most of the Households did not belong to any Neighborhood
54
Committees and Community Development Agency. Similarly, only negligible
proportions of the sampled Households actually belonged to groups like; health
related association, Youth group/association dealing with water and non-
Governmental Organization, Civil group, Religious or Spiritual Group/Organization,
Political Group and Finance, Credit/Saving Association . The consequence of not
joining the later indicates that low level membership of finance and credit
association could possibly be responsible for the low economic growth thus
increasing the poverty rate in the state.
On households’ membership of Culture Group or Association only Ifako-Ijaiye and
Ajeromi- Ifelodun Local Government Areas with 0.4% and 0.2% respectively had
households socially related to Culture Group or Association throughout the State. In
the same vain, a miniature number of the households are socially related to any
Educational Group/Association. Similarly, less than 0.1% of the entire sampled
household actually belonged to Ethnic based Community Group.
DECISION MAKING It was observed that 10% of the Households are active decision makers, 70% of the
entire sampled households in the state actively participated in decision making and
less than 5% did not participate at all. CONNECTION WITH OTHER ORGANISATIONS As regards Households that are connected with other organizations, nearly all the
Local Governments had connection with one organization or the other; this was more
pronounced in Amuwo Odofin, Badagry, Epe and Eti-Osa Local Government Areas
with 100% each.
55
GENDER CHARACTERIZATICS OF MEMBERS OF THE GROUP It was observed that the gender characteristics of the members of the group were
men (50%), 5% women while 5% did not divulge the gender characteristics of their
group. However, all the sampled households in Epe and Eti-Osa were mostly men.
In the same vain, Age Characterization of household members in the group revealed
that only 20% were young, 70% about the same age while the remaining 10% did not
divulge their age. However, Ikorodu, Epe, Eti-Osa and Ajeromi Ifelodun households
sampled were about the same age (100%) but Amuwo Odofin had the highest
households that are young (90%). INCOME LEVEL Percentage distribution of income level characteristics of members showed that state
wise, 50% of the sampled Households indicated that about half of the sampled
households belong to either the higher or lower income level while 30% households
did not make known their income level. EDUCATIONAL LEVEL Using Educational level characteristics, the State indicator revealed that 45% higher
Educational level, while the remaining 40% households did not disclose their
educational level. However, it should be pointed out that Amuwo-Odofin and Epe
had the highest households without educational level. Whereas, Households in Epe
and Ikorodu Local Government Areas had the highest level of with higher
educational level.
According to the survey result, on Professional characteristics, it was revealed that
77% of the sampled Households belonged to diverse professions while the remaining
13% did not divulge their professional characteristics.
56
MARITAL STATUS On marital status distribution of group members, the State statistics revealed that
20% of the entire sampled households were mostly bachelors, 60% are mostly
married while the remaining 20% had no information as regards their marital status.
However, Epe and Eti-Osa had the highest percentage of mostly married households’
member. Also, Amuwo Odofin had the highest percentage of Bachelors. It was also
found out that Lagos Island, Lagos Mainland and Ifako-Ijaiye had the highest
proportion of households that did not disclose their marital status. HOME OWNERSHIP 35% of the entire sampled Households were mostly tenants; 45% were mostly
owners while the remaining 20% had no information on their ownership status. REASONS FOR JOINING THE SOCIAL NETWORK GROUP On households that actually joined the social network group because of importance
in times of emergency, less than 5% of the sample households actually joined the
social network group because of importance in times of emergency. Meanwhile, the
survey revealed that only 0.8% of the entire sampled households joined the groups
based on benefits from the community rainwater drainage. However Eti-Osa,
Ikorodu, Kosofe were not affected. And less than 1% of the entire sampled
households actually joined the group for other reasons not therein stated.
57
SERVICE DELIVERY HEALTH Furthermore, on percentage distribution of health of member of the group revealed
that only 3% of the sampled households were physically handicapped, no records
was given on mentally handicapped households while a significant percentage of
92% of the entire sampled households were generally in good health. However,
Lagos Island, Lagos Mainland and Ojo Local Government Areas had sprinkles of
physically handicapped respondents. ACCESS TO ADEQUATE SANITATION SERVICES
Households benefiting from the improved access to adequate sanitation showed that
Lagos Island Areas were the highest while Epe, Eti-Osa and Surulere did not have
any beneficiary amongst the sampled Households. However, 3.8% among the
sample households statewide actually had improved access to adequate sanitation
services as main benefits of joining the group which is small for a State like Lagos. WATER SERVICES
That water is crucial to life and cannot be doubted. In the State, access to adequate
water services is very low as revealed from the concluded survey. However, the
problems associated with water supply across the state were enormous. The survey
result revealed that 60% of the sampled households actually had problems with their
water supply. But it was only in Epe local Government Area that no response was
received.
In conformity with the principle of access, utilization and satisfaction, complaint
about water pressure could only be expected from Pipe-borne-water from Lagos
State Water Corporation(LSWC) since other sources of water was self-determined.
However, few of the entire sampled Households actually complained about water
pressure.
Water Tariffs are charges payable on the use of a specific volume of water, usually
collected by Lagos State Water Corporation (LSWC). Private Water Vendors also
58
charge some fees, but it is not regulated and it is subject to individual/corporate
fixtures. WASTE MANAGEMENT CONTROL
In accordance with the statutory responsibilities of both Lagos Waste Management
Authority (LAWMA) and the Authority and Private Sector Participation (PSP)
Operators, which among other things includes; the evacuation/ removal of domestic
and industrial wastes. However, hitches in the discharge of the assigned
responsibilities, a times, could affect the frequency of waste disposal and hence
create health hazards in the state. The indicator revealed that almost the entire
sampled households state-wide did not notify Lagos Waste Management Authority
of any waste related problems with the exception of Lagos Island. The above
indication shows that tremendous efforts should be made towards changing the
carefree attitudes of the households to such problems and the concerned Authorities
should leave up to their expectation.
In order to further determine the contribution of the various social network groups in
terms of the swift reporting of problems and difficulties as regard service deliveries,
only few members of the various groups actually reported problems to the group.
This actually indicated a wide gap between the Government and the governed due to
low level of exchange of information as regards inadequacies in some areas of
service deliveries. CONTACT WITH OTHER GROUPS In this democratic dispensation, the communities are expected to interact both
individually and collectively with the Politicians representing their constituencies.
The survey showed that less than 1% of the sample households across the state
actually contacted the politicians in their domain as regards problems associated with
social network group.
59
Similarly, with the exception of Lagos Island Area where few selected Households
constantly showed evidence of social network, almost the entire Households’ group
members neither took part in protest/demonstration in the state nor across the Local
Government Areas. Negligible number of the sampled Households actually
participated in neighbourhood council meetings.
Involvements of social network group members in information/election campaign
will go along way in assisting the electorate to determine the individual and
organization that best serve their interest through critical examination of the quality
of the candidates as well as careful appraisal of the party manifestos. In view of this,
the survey revealed that 99.5% of the sampled Households did not participate in
information or election campaign related association or group. This showed a very
low level of involvement among the social network group related households.
By and large, according to this survey, appreciation and contribution of social
network group, was very poor in most cases. This could possibly be attributed to low
level of awareness about the existence of such groups as well as accruable benefit on
the part of the populace including traditional/religious barrier as regards interaction
between the rulers and the ruled. To this end, more efforts should be geared towards
sensitizing the populace on the need to join socio-economic network group and the
inherent benefits should be stressed as much as possible.
60
Neighborhood
Various Problems Faced by Households
The survey revealed that environmental pollution in form of haphazard disposal of
wastes such as used papers, nylons and other waste products as well as public
urination are two major problems that pervade the length and breath of the state.
53% (Fifty three percent) of the entire respondents claim to have experienced
littering problem, 44% rated public urination as major problem while land invasion
by hawkers (18%) and illegal trading (20%) were least considered as problems by
the sampled households.
It is also worthy of note that Poor traffic control and corruption of the service
delivery officers were rated as problems by 32% and 38% of the respondents
respectively.
Households from Ajeromi- Ifelodun, Surulere, Ojo, Lagos Mainland and Oshodi
Isolo Local Government Areas were mostly affected by the stated problems.
Littering Disaggregating further by Local Government Areas, the survey showed that more
than 70% Households in Ajeromi, Surulere and Badagry Local Government Areas,
were mostly faced with the problem of littering while Ikeja (33%), Alimosho (35%)
and Ifako Ijaye Local Government Areas with 38% were least faced with such
problem respectively. However the survey indicates that the problems were very
severed in Apapa (65%) Followed by Amuwo Odofin LGA (52%)
Public urination Similarly, the survey showed that the Problem of public urination faced by the
households were relatively high in Ajeromi 71%, Apapa 67%, Surulere 63%.
However, in terms of severity, the problem was more severe in Apapa, Amuwo
Odofin and Ajeromi Ifelodun Local Government Areas. Also, the public urination’s
severity level for the state stood at 76% accordingly.

61
Land invasion by hawkers
In addition, hawkers otherwise called mobile street traders portends serious
environmental and traffic problem at community and household levels. This was
indicated in the survey because virtually all the Local Government Areas suffered
from this menace. However, the survey revealed that Households in Eti Osa 92%,
Ajeromi 81%, Lagos Island 82%, Alimosho 77% and Amuwo Odofin 72% LGAs
were mostly affected respectively. While households in Ibeju Lekki area , only 10%,
was least affected by the problems.
Illegal trading
Part of the problems affecting the environmental condition of the state is the wide
spread illegal trading activities. The survey revealed that 55% of the entire sampled
households were severely affected by the problem of illegal trading. This problem
was more pronounced in Lagos island- 80%, Alimosho-72%, Lagos Mainland-66%,
Ikeja-65%, Agege-64%, Surulere-63% while households in Badagry local
Government Area (30%) were least affected respectively.
Poor traffic control
A lot of avoidable traffic problems are daily being experienced in Lagos State due to
poor traffic control mechanism, impatience and lawlessness on the part of the road
users especially the commuters. The severity of the problem was generally rated
very high (above 60%) in almost all the Local Government Areas with the exception
of Ikorodu, Ibeju- lekki and Somolu where the poor traffic control were less
severe. The state severity level stood at 72%. However, thirty two percent (32%) of
the state-wide respondents claimed to have suffered from poor traffic control.

62
Corruption of service delivery officials The survey result also showed that service delivery official were generally rated as
corrupt by more than 38%of the respondents state-wide irrespective of the
geographical location. The severity of the problem was also attested to by more than
sixty percent of the sampled households.
PERCENTAGE DISTRIBUTION OF COMMUNITY PROBLEMS EXPERIENCED BY THE HOUSEHOLDS
33
49
41 42
59
30
36
55
46
27
39
35
30
58
52
36
41 42
38
58
42
39
57
41
50
59
30
36
59
46
30
38
34 34
64
48
40
47
35
48
61
45
0
10
20
30
40
50
60
70
Ageg
e
Ajer
omi/I
felo
dun
Alim
oso
Amuw
o/O
dofin
Apap
a
Bada
gry
Epe
Eti O
sa
Ibej
u-Le
kki
Ifako
Ijai
ye
Ikej
a
Ikor
odu
Koso
fe
Lago
s Is
land
Lago
s M
ainl
and
Mus
hin
Ojo
Osh
odi I
solo
Shom
olu
Suru
lere
STAT
E
POOR STREETLIGHTING FLOODING
63
CONCLUSION The household survey brought into limelight most of the contending issues on the
structure, size, gender parity and other demographic characteristics of the inhabitant
of the State.
The sectoral indicators have shown the service delivery rating at the household
level.Socio-economic baseline information is now available and the efforts of the
government to enhance a better living standard of the citizenry could now be
determined with a view of correcting and advising the policy makers on the
implication of the indicators.
In accordance with the LMDGP timeline, a repeat survey would be carried out
in no distance future in order to understudy the effect of various intervention
programmes put in place based on the findings and recommendations of the
household report so as to determine the changes in the welfare/standard of living of
the populace.
64
RECOMMENDATIONS
• Sensitization of the populace about the Government lofty programme
through the use of television/ radio for wider coverage
• Improvement on the provision of adequate quality water supply so as to
prevent water borne diseases.
• Regular refuse disposal and clearing of drains to eradicate flooding
• reopening and creation of more channels for drains.
• Empowerment of Waste Management Authority for effective discharge of
duties.
• Widening the scope of waste management PSP to cover more areas of the
state.
• Large refuse bins should be located in all the streets while incinerators should
be located in each local government areas.
• Policy of recycling of waste generated in the state should be integrated into
our waste management authority
• Comprehensive welfare package to improve the standard of living of the
people
• Intensification of efforts on HIV/ AIDS advocacy
• Encouraging more IPP projects as greater percentage (62%) of the inhabitants
of the state are willing to buy from third party
• A deliberate policy that will continue to improve the quality and standard of
education in the state
• Strengthening of the community and government policing services.
• Illumination of all the streets in the state
• Price control mechanism
• Poverty reduction programme should be intensified