lait brochure corpo en cor 3avrillait.org/wp-content/uploads/2014/11/br2014_final_en.pdf · 2 fplq...
TRANSCRIPT

supply managementand collectivemilk marketing
Proud of our collective achievements
2%
10%
15%
3.25%
35%
1%
years

2 FPLQ supply management and collective milk marketing
vision statements*
The Quebec dairy secTor and milk markeTing in 20171 in 2017, the dairy sector will base its development
on a renewed social contract with the population and governments, rooted in the principles of food sovereignty and effective supply management. dairy farms will earn their income from the market, supported by green government programs to fulfill their social, environmental and land use missions.
2 the solidarity of Quebec and canadian milk producers, combined with national pooling of returns and markets, will enable them to operate profitable farms in a context of increased competition.
3 By cooperating with their industry partners and becoming involved in processing and distribution, producers will ensure sustainable and profitable development of all canadian mass or niche markets. through their marketing programs, dairy producers will encourage the marketing of superior quality dairy products, certified as 100% canadian milk, and will favour the manufacturing of niche products by processors, artisans and producer-processors established in regional dairy pools.
Quebec dairy farms in 20174 in 2017, all Quebec regions will have numerous
family-owned dairy farms throughout their territory.
5 these farms will be well managed by trained producers, be in good financial health and have a reduced debt load. they will offer a good quality of life and working conditions to the people who work on them. For this purpose, they will rely on their own advisory services, specialization of tasks and contract work, as well as pooled machinery and labour. these living and working conditions will ensure a motivated and competent succession of young farmers.
6 dairy farmers will practise sustainable, ecological agriculture, relying on the advantages of production that combine livestock farming and a variety of plant crops. By their investments in animal health and welfare and in milk quality, they will achieve the highest dairy production standards.
7 dairy producers will win the support of the Quebec public through communication efforts, transparency and ethical practices. the public will recognize their essential nutritional, economic, social and environmental roles.
* these statements emerged from input by some 3,000 producers participating in a vast consultation process, and were adopted at the april 2007 annual general meeting.
in this document, the masculine pronoun refers to both men and women.

FPLQ supply management and collective milk marketing 3
feed our oWn PeoPle first
suPPly managemenT and collecTiVe milk markeTing most major countries have laid the foundations for a prosperous economy primarily by developing their agricultural sector. since the great depression of the 1930s, most states have intervened to solve what economists called “the farm problem” in reference to the weakness and chronic instability of farm incomes. the “agricultural exception” has justified special treatment for the sector. as a result, governments have implemented support policies, market regulation and measures to exclude agriculture from trade agreements.
However, beginning in the 1980s, there was a strong wind of economic liberalism in favour of state withdrawal and the opening of agricultural markets. the World trade organization, the World Bank, the international monetary Fund and a number of states believed that the free market would solve the “farm problem” and ensure world food security.
But thirty years of that policy have solved nothing. the recent food crises are primarily due to the abandonment of policies fostering a degree of food self-sufficiency through local production and protection of the domestic markets of the most severely affected countries. there will be no lasting solution to these problems without recognizing the right of states to adopt their own agricultural policies so as to ensure a measure of food sovereignity to their population.
dairy supply management has been in place in canada since 1971. it ensures local production of high-quality food while providing producers with stable and equitable income, derived entirely from the marketplace, without income support subsidies and without dumping surplus products on the markets of developing countries. along with collective marketing, it is a concrete model for the application of food sovereignty for canadian milk producers and consumers.

4 FPLQ supply management and collective milk marketing
the fédération des Producteurs de lait du Québec
the Fédération des producteurs de lait du Québec (FplQ), affiliated with the union des producteurs agricoles, was founded in 1983 as a federation of 14 regional syndicates and is the product of the merger of two federations, one representing fluid milk producers since 1970, and the other representing industrial milk producers since 1966.
collecTiVe milk markeTingQuebec’s 5,956 dairy farms collectively market nearly 3 billion litres of milk through the Quebec milk producers’ Joint plan (plan conjoint [1980] des producteurs de lait du Québec). they have delegated to the FplQ the responsibility for negotiating all sales conditions on their behalf with the processors’ representatives. the producers and processors negotiate and work together through marketing agreements and the various resulting committees on questions of plant supply, milk quality rules and raw material prices. these prices are negotiated on the basis of a target price established at the canadian level, taking into account the production costs of the most efficient farms.
the conditions of transporting milk from the farm to the plant, the costs of which are borne by the producers, are negotiated with the carriers by the FplQ in a provincial agreement. this collective marketing system enables milk producers to draw their income from the marketplace without government subsidies.
suPPly managemenTQuebec and canadian producers manage their production to meet all domestic requirements. the representatives of producers in all provinces, in consultation with the industry, set an annual production target called market sharing quota. When production exceeds this target, the surplus must be sold on other markets, in particular, the animal feed market, at a price well below the average price received for planned domestic markets.
the proceeds of all planned milk sales are pooled by the producers who receive an average price based on their monthly milk deliveries within the target.
the quality of the milk they market is an important concern for producers. various quality improvement programs are managed by the Federation. producers also invest more than $41 million annually in promotion and advertising of milk and dairy products, as well as in research.
5,956 dairy farms
nearly 3 billion liTres
of milk

FPLQ supply management and collective milk marketing 5
collecTiVe milk markeTing by Producers
ProVides…
• a single spokesman to negotiate all marketing conditions
• a fair, uniform and stable price to all producers for the milk they put on the market
• production adjusted to market requirements
• a guaranteed supply to processors on the same conditions and at the same prices for everyone, also available to new businesses
• priority to high value-added and developing markets
• High standards of quality negotiated with the processors
• investments in promotion, advertising and nutrition education
• Joint investments by producers and processors in research
• centrally coordinated routing of milk to 108 plants in Quebec
• provincial negotiations for optimum milk transportation conditions
• a single average rate for all producers to have their milk transported…
• By 262 tank trucks…
• that travel 29 million kilometres a year…
• on 594 streamlined pickup routes
Profile of the Quebec dairy industry – 2013
number of dairy farms 5,956number of owner/operators on farms 12,329production volume 2.94 billion litres of milkshare of canadian market 37%Farm receipts $2.36 billionannual investment by dairy farmers $345 millionQuébec’s share of total farm cash receipts 29 %
number of jobs in the primary sector 39,531 on dairy farms 23,661 at suppliers of goods and services to farms 15,870
number of jobs in in the dairy processing sector 21,634 at dairy processing plants 8,708 at suppliers of goods and services to dairy processing plants 12,926
total number of jobs in the dairy industry 61,165 number of induced jobs* 21,931
total number of jobs generated by the dairy industry 83,096
contribution of the entire dairy chain to the gdp $5.49 billionprimary sector (farms and suppliers of goods and services to farms) $2.72 billionprocessing sector (dairy processing plants and suppliers) $2.77 billion
revenue from dairy chain taxation $1.26 billionFederal $678 millionprovincial $454 millionmunicipal $123 million
* induced economic impacts are generated by the personal expenses of employees and operators active on dairy farms and dairy processing plants, as well as their suppliers.
sources: FplQ, statistics canada and data taken from the study on the economic impacts of the dairy industry in canada conducted in 2011 and updated in 2012 by Écoressources consultants based on a cross-sectoral model.

6 FPLQ supply management and collective milk marketing
suPPly management and collective marketing
… sTabilize farmers’ income and enable Them To obTain a beTTer share of The consumer dollarthe income of Quebec and canadian dairy producers from the sale of their milk is considerably more stable than that of their american counterparts, as the graphs show. and, during the same period, the price of dairy products rose more rapidly in the united states than in canada.
in addition, canadian producers obtain a more equitable share of the consumer dollar without consumers having to pay any more for their products than elsewhere.
$
retail price index for dairy products (u.s.)
producer price index (u.s.)
$
comparison of dairy product retail prices and producer milk prices in the united states, 1991-2013
190
170
150
130
110
90
70
501991 1993 1995 1997 1999 2001 2003 2005 2007 2009 2011 2013
sources: united states Bureau of labor statistics (Bls) and united states department of agriculture (usda).

FPLQ supply management and collective milk marketing 7
producer target price index (canada)
retail price index for dairy products (canada)
retail price index for dairy products (canada)
retail price index for dairy products (u.s.)
comparison of dairy product retail prices and target price in canada, 1991-2013
190
170
150
130
110
90
70
501991 1993 1995 1997 1999 2001 2003 2005 2007 2009 2011 2013
sources: statistics canada and canadian dairy commission.
comparison of dairy product retail prices in canada and in the united states, 1991-2013
190
170
150
130
110
90
70
501991 1993 1995 1997 1999 2001 2003 2005 2007 2009 2011 2013
sources: statistics canada and united states Bureau of labor statistics (Bls).
8 FPLQ supply management and collective milk marketing
suPPly management and collective marketing
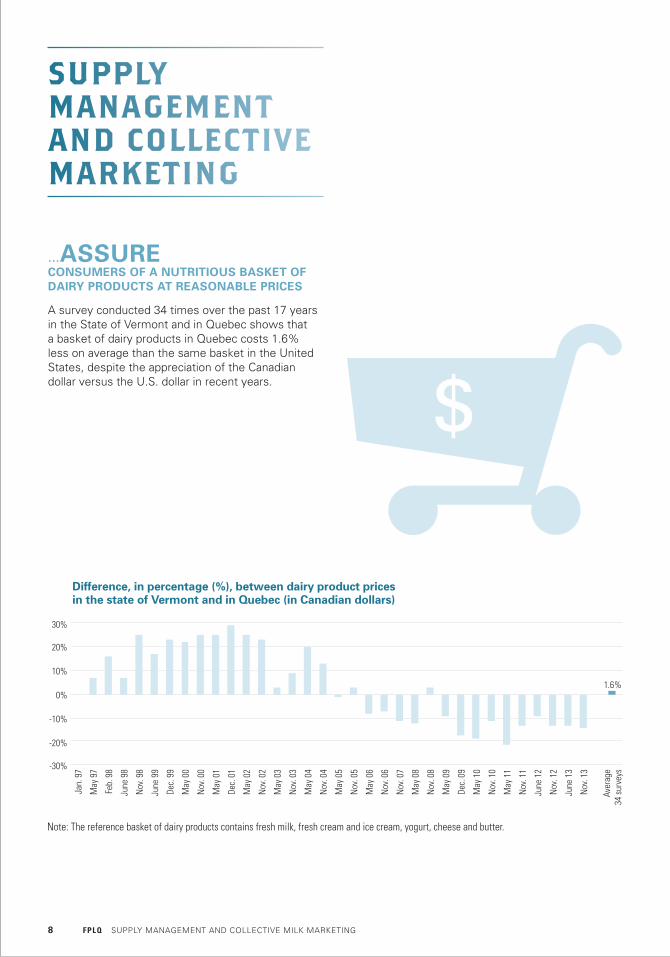
…assure consumers of a nuTriTious baskeT of dairy ProducTs aT reasonable Prices
a survey conducted 34 times over the past 17 years in the state of vermont and in Quebec shows that a basket of dairy products in Quebec costs 1.6% less on average than the same basket in the united states, despite the appreciation of the canadian dollar versus the u.s. dollar in recent years.
$
difference, in percentage (%), between dairy product prices in the state of Vermont and in Quebec (in canadian dollars)
30%
20%
10%
0%
-10%
-20%
-30%
Jan.
97
may
97
Feb.
98
June
98
nov
. 98
June
99
dec.
99
may
00
nov
. 00
may
01
dec.
01
may
02
nov
. 02
may
03
nov
. 03
may
04
nov
. 04
may
05
nov
. 05
may
06
nov
. 06
nov
. 07
may
08
nov
. 08
may
09
dec.
09
may
10
nov
. 10
may
11
nov
. 11
June
12
nov
. 12
June
13
nov
. 13
aver
age
34 s
urve
ys
note: the reference basket of dairy products contains fresh milk, fresh cream and ice cream, yogurt, cheese and butter.
1.6%

FPLQ supply management and collective milk marketing 9
… ensure income securiTy for dairy farmers wiTh liTTle goVernmenT suPPorT
a study conducted in 2004 and updated in 2008 by daniel-mercier gouin, director of the groupe de recherche en économie et politique agricoles (grepa) and a professor in the agri-Food economics and consumer sciences department at université laval demonstrates that canada is one of the countries where government support to the dairy sector is lowest. in 2004, subsidies granted per ton of milk produced in canada was twice as low as in the united states and more than six times lower than in the european union.
in fact, canadian dairy farmers receive no income support subsidies and have access to only the minimum support generally offered all farmers like the tax refund program.
… faVoura TyPe of agriculTure ThaT resPecTs resources and PeoPle and is efficienT and human-scale
collective marketing and supply management are not an impediment to improving efficiency and productivity, as these results show.
With an average of 66 cows per farm in 2012, Quebec dairy farms continue to be family businesses on a human scale. By comparison, california dairy farms have an average of 1,080 cows.
Technical characteristics of dairy farms participating in the 1996-2012 cost of production survey
index
250
200
150
100
50
0 annual production per farm (hl)
number of cows per farm
milk per cow in litres
total work hours per hectolitre
19962012
source: ageco group – survey of production costs of Quebec dairy enterprises.
2,978
6,679
42.66
65.95
6,981
10,123
1.531.12
Trends in direct payments to dairy producers and export subsidies in canadian dollars per ton of milk produced, by country, 1995 to 2004
$ can/ton
60
50
40
30
20
10
01995 1996 1997 1998 1999 2000 2001 2002 2003 2004
canadaunited states new Zealandaustraliaeuropean union
sources: oecd data base on pse; usda, Fas export assistance; Feoga, Financial report.
10 FPLQ supply management and collective milk marketing
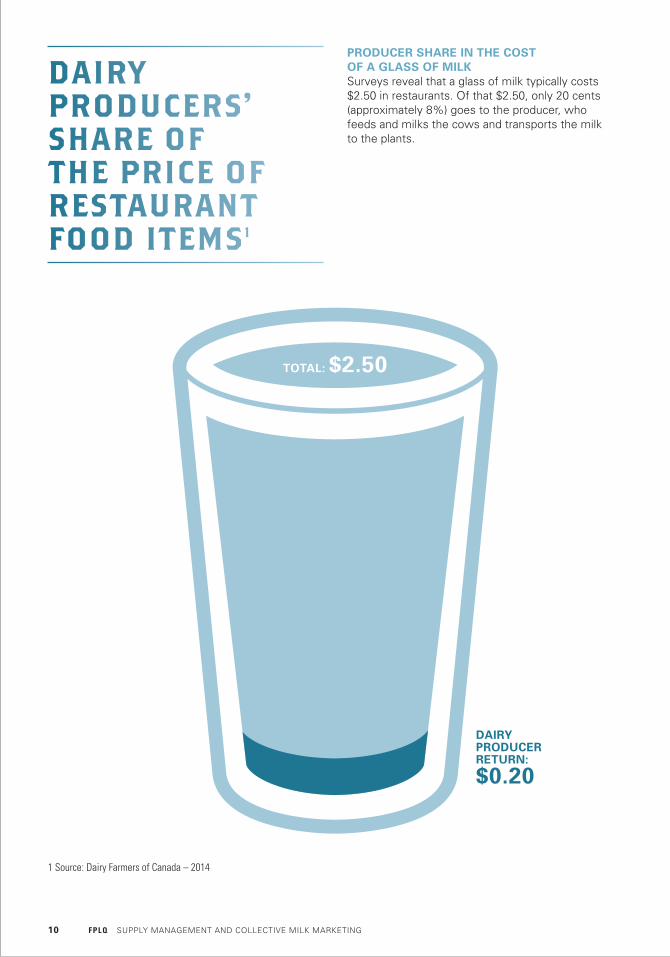
dairy Producers’ share of the Price of restaurant food items1
Producer share in The cosT of a glass of milksurveys reveal that a glass of milk typically costs $2.50 in restaurants. of that $2.50, only 20 cents (approximately 8%) goes to the producer, who feeds and milks the cows and transports the milk to the plants.
ToTal: $2.50
dairy Producer reTurn:
$0.20
1 source: dairy Farmers of canada – 2014
FPLQ supply management and collective milk marketing 11
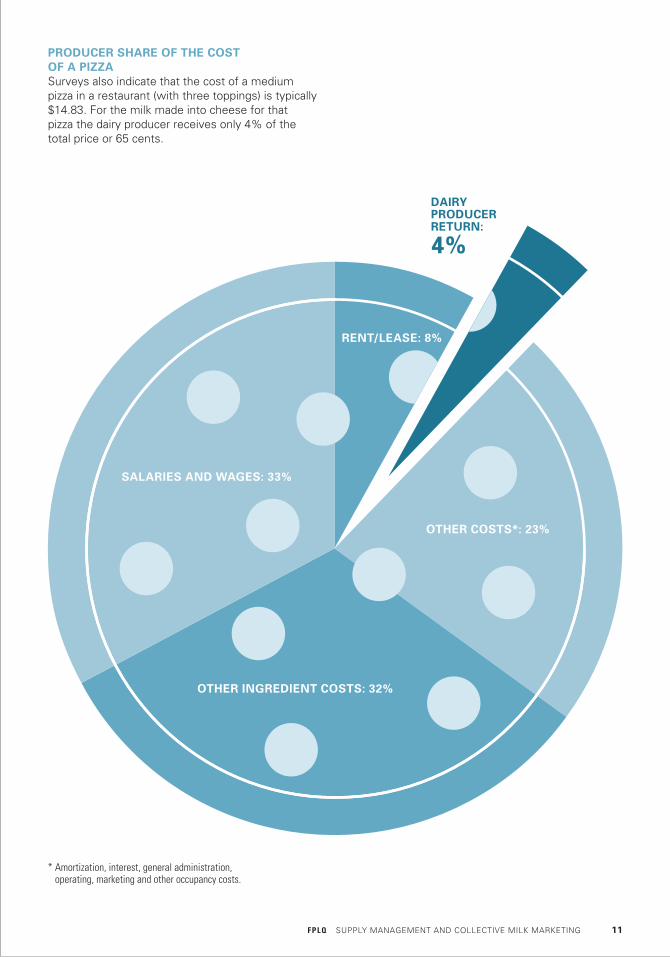
Producer share of The cosT of a Pizza surveys also indicate that the cost of a medium pizza in a restaurant (with three toppings) is typically $14.83. For the milk made into cheese for that pizza the dairy producer receives only 4% of the total price or 65 cents.
dairy Producer reTurn:
4%
salaries and wages: 33%
renT/lease: 8%
oTher ingredienT cosTs: 32%
oTher cosTs*: 23%
* amortization, interest, general administration, operating, marketing and other occupancy costs.
555, roland-therrien Blvd suite 415longueuil (Quebec) J4H 4g3tel.: 450 679-0530Fax: 450 [email protected]
www.lait.orgwww.lafamilledulait.comwww.nourrirnotremonde.orgwww.go5quebec.cawww.ourcheeses.com g3 11 10 n822 – april 2014
isBn 978-2-923457-24-6