lake charles harbor and terminal district charles dmmp case...source: martin associated, 2007,...
TRANSCRIPT
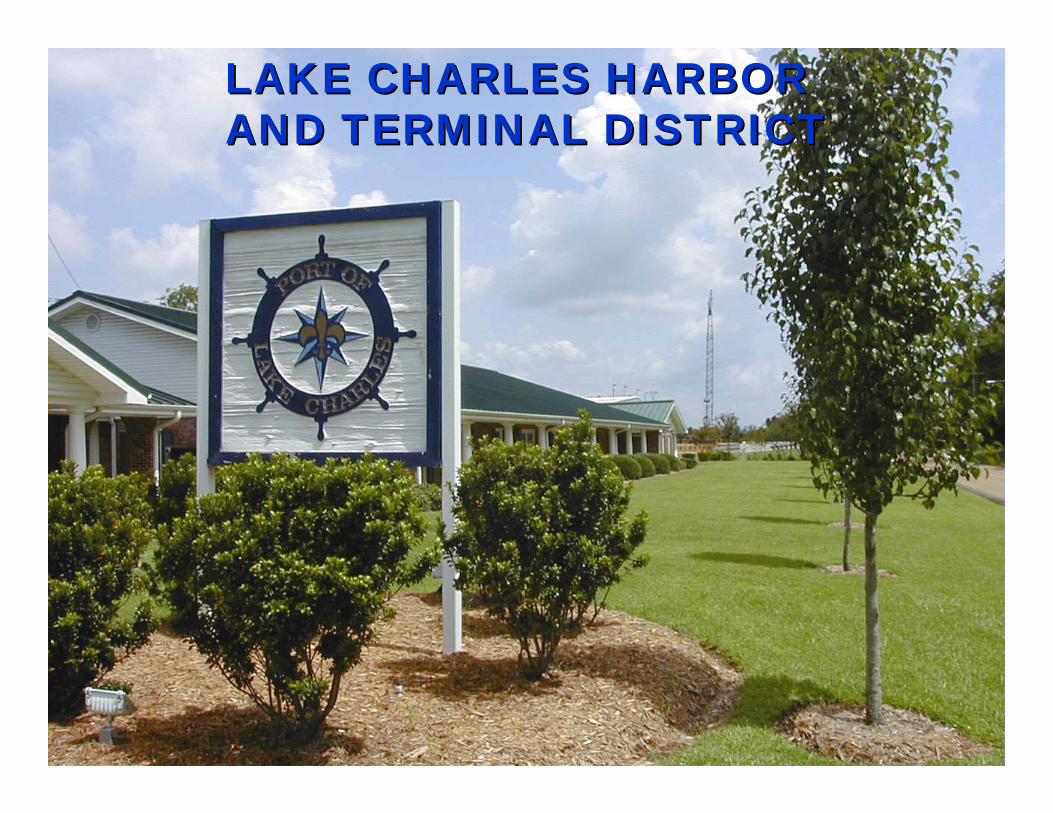
LAKE CHARLES HARBOR LAKE CHARLES HARBOR AND TERMINAL DISTRICTAND TERMINAL DISTRICT
Calcasieu River and PassCalcasieu River and Pass
Dredge Material Management PlanDredge Material Management Plan
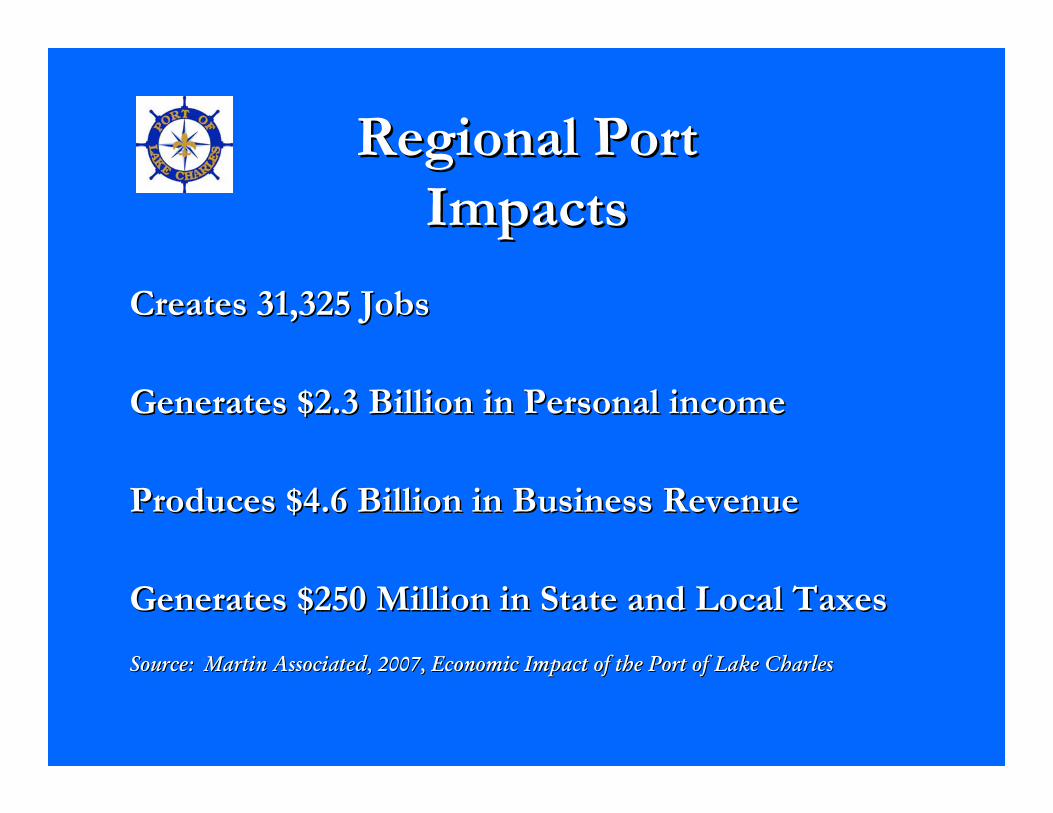
Regional Port Regional Port ImpactsImpacts
Creates 31,325 JobsCreates 31,325 Jobs
Generates $2.3 Billion in Personal incomeGenerates $2.3 Billion in Personal income
Produces $4.6 Billion in Business RevenueProduces $4.6 Billion in Business Revenue
Generates $250 Million in State and Local TaxesGenerates $250 Million in State and Local Taxes
Source: Martin Associated, 2007, Economic Impact of the Port ofSource: Martin Associated, 2007, Economic Impact of the Port of Lake CharlesLake Charles
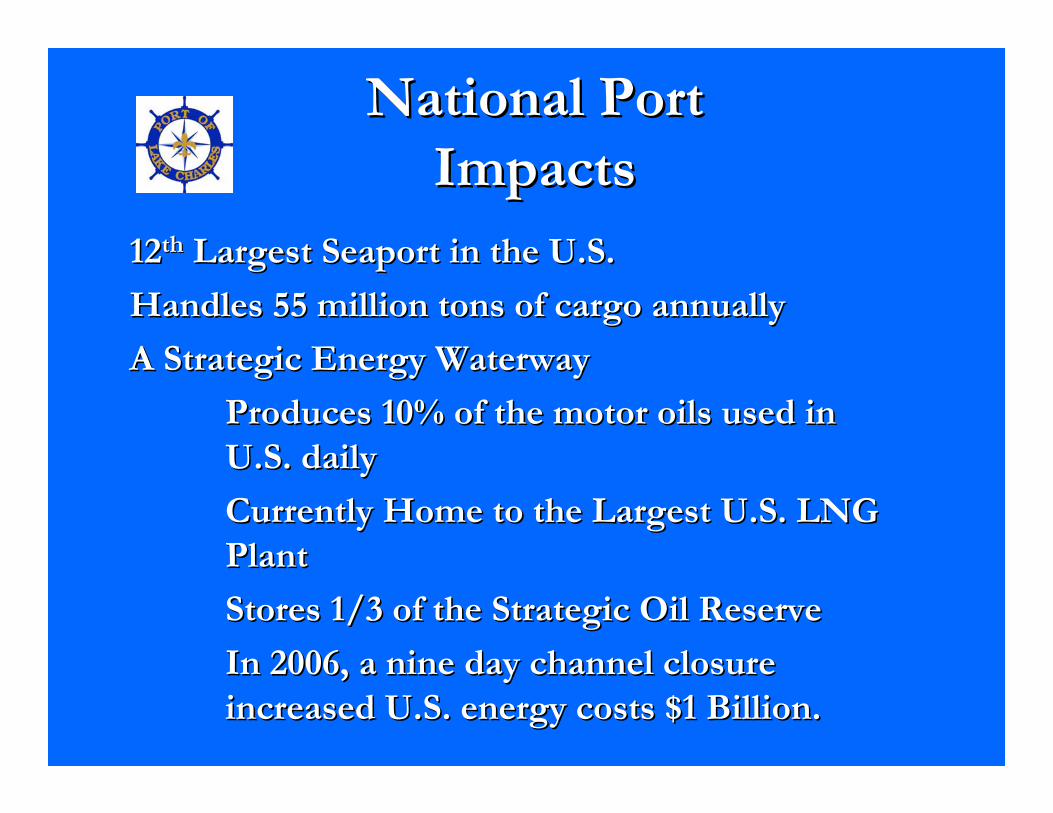
National Port National Port ImpactsImpacts
1212thth Largest Seaport in the U.S.Largest Seaport in the U.S.
Handles 55 million tons of cargo annuallyHandles 55 million tons of cargo annually
A Strategic Energy WaterwayA Strategic Energy Waterway
Produces 10% of the motor oils used in Produces 10% of the motor oils used in U.S. dailyU.S. daily
Currently Home to the Largest U.S. LNG Currently Home to the Largest U.S. LNG PlantPlant
Stores 1/3 of the Strategic Oil ReserveStores 1/3 of the Strategic Oil Reserve
In 2006, a nine day channel closure In 2006, a nine day channel closure increased U.S. energy costs $1 Billion.increased U.S. energy costs $1 Billion.
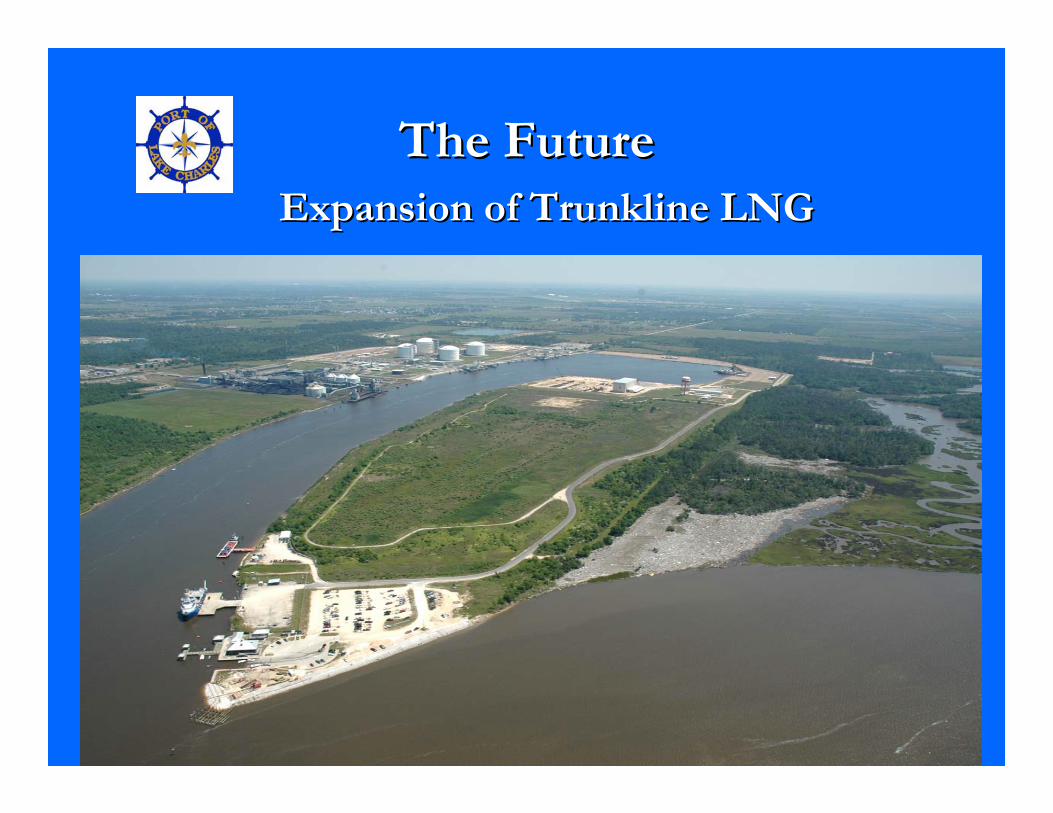
The FutureThe FutureExpansion of Trunkline LNGExpansion of Trunkline LNG
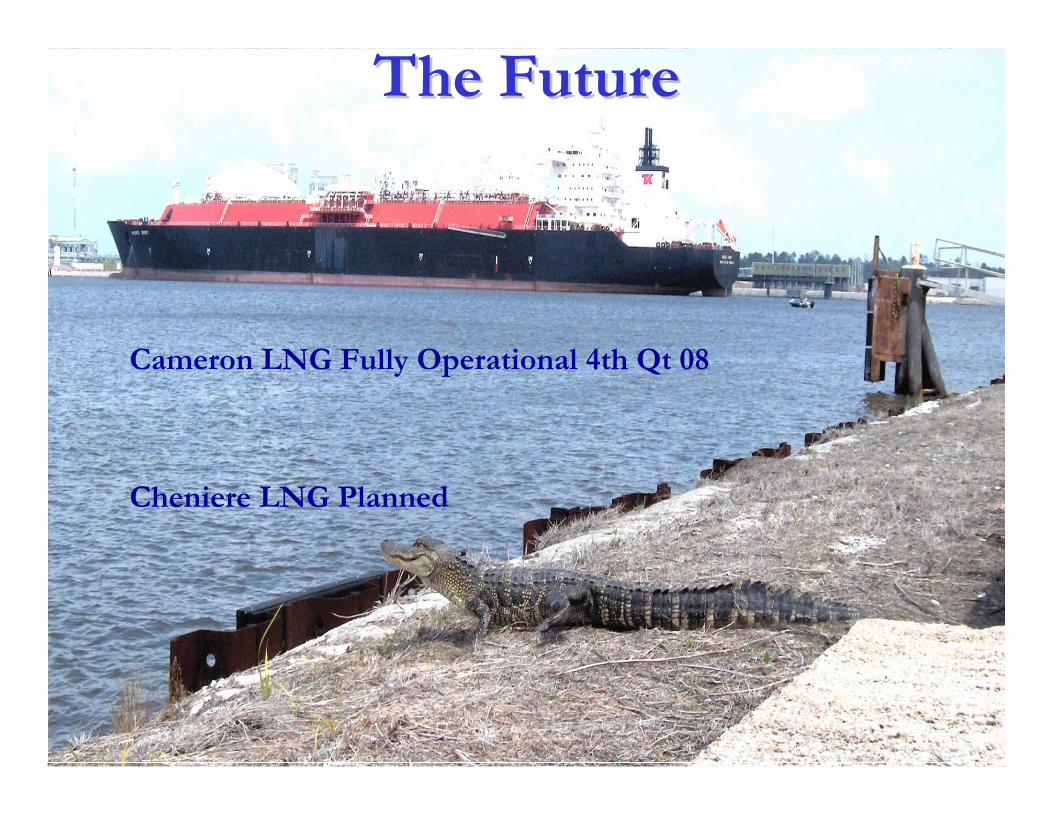
The FutureThe Future
Cameron LNG Fully Operational 4th Qt 08
Cheniere LNG Planned
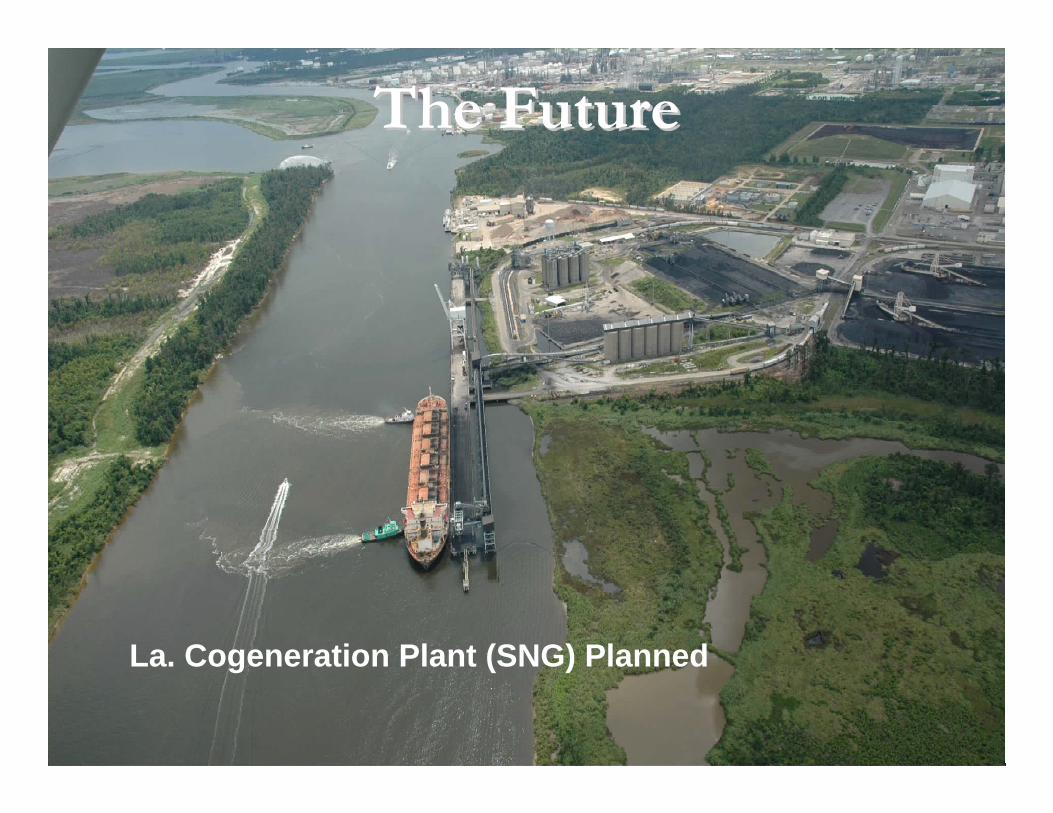
The FutureThe Future
La. Cogeneration Plant (SNG) Planned
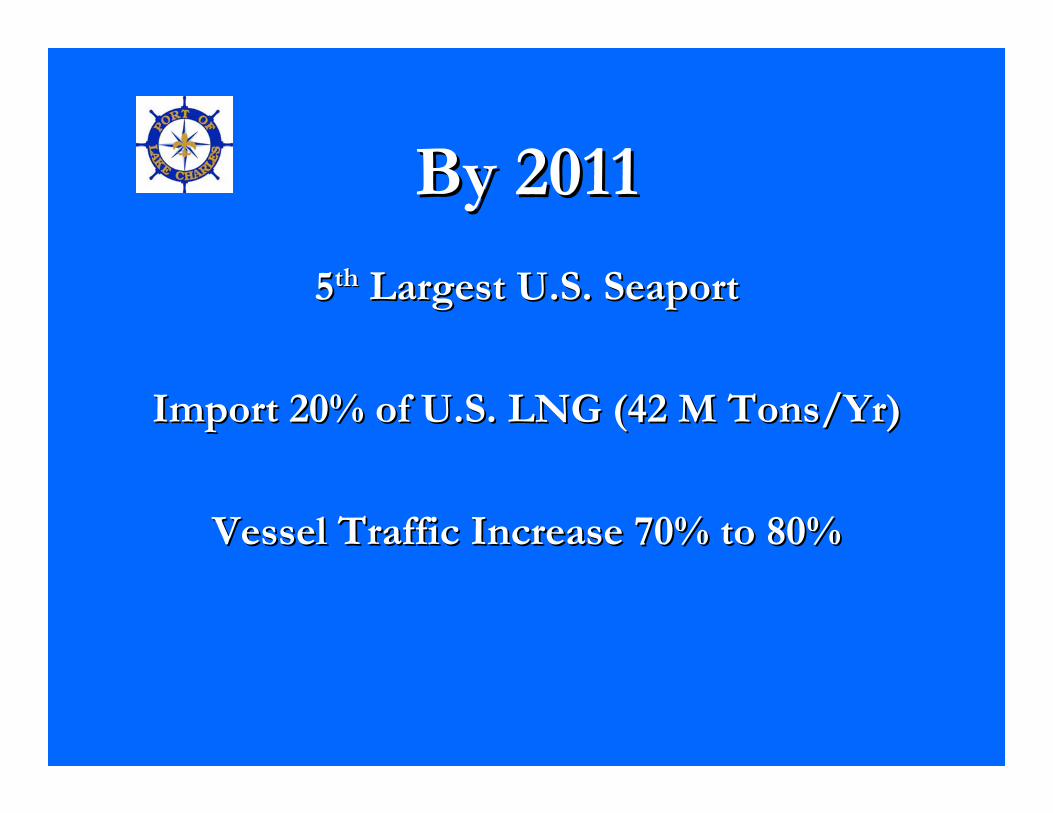
By 2011By 2011
55thth Largest U.S. SeaportLargest U.S. Seaport
Import 20% of U.S. LNG (42 M Tons/Yr)Import 20% of U.S. LNG (42 M Tons/Yr)
Vessel Traffic Increase 70% to 80%Vessel Traffic Increase 70% to 80%
Lake CharlesLake Charles
The biggest little port you’ve never heard ofThe biggest little port you’ve never heard of
What if the Port had to What if the Port had to Close?Close?
Is That Possible?Is That Possible?
Yes!Yes!

The Port Faces The Port Faces A Major ChallengeA Major Challenge
Lack of Dredge Material Disposal Lack of Dredge Material Disposal CapacityCapacity
Project DimensionsProject Dimensions
Bar Channel (32 Miles) : 600 X Bar Channel (32 Miles) : 600 X -- 4040
Inland Reach (36 Miles): 400 X Inland Reach (36 Miles): 400 X -- 4040
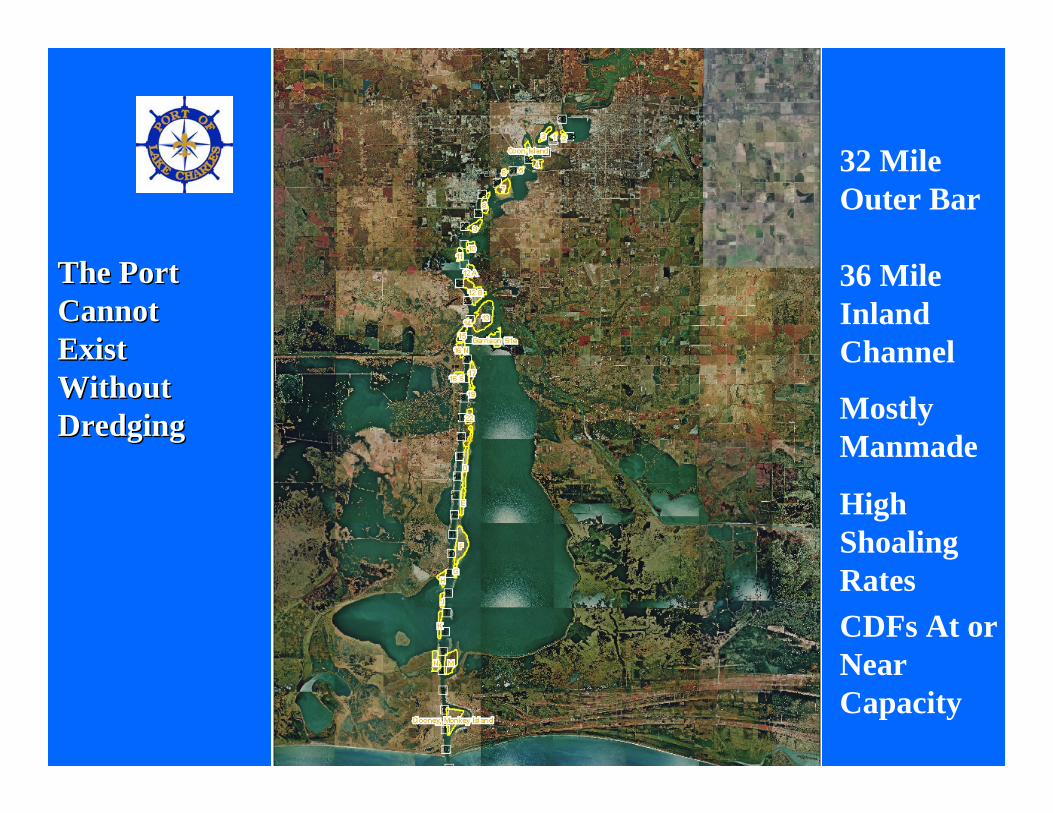
The Port The Port Cannot Cannot Exist Exist Without Without DredgingDredging
32 Mile Outer Bar
36 Mile Inland Channel
Mostly Manmade
High Shoaling RatesCDFs At or Near Capacity
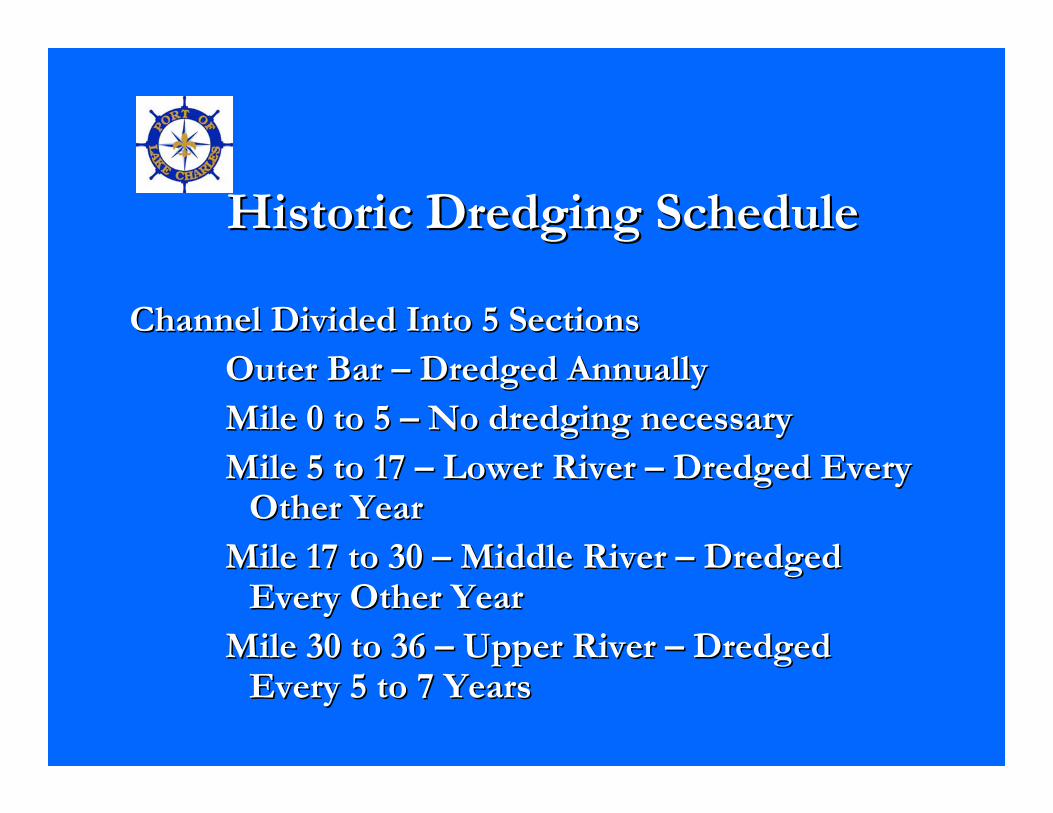
Historic Dredging ScheduleHistoric Dredging Schedule
Channel Divided Into 5 SectionsChannel Divided Into 5 SectionsOuter Bar Outer Bar –– Dredged AnnuallyDredged AnnuallyMile 0 to 5 Mile 0 to 5 –– No dredging necessaryNo dredging necessaryMile 5 to 17 Mile 5 to 17 –– Lower River Lower River –– Dredged Every Dredged Every
Other Year Other Year Mile 17 to 30 Mile 17 to 30 –– Middle River Middle River –– Dredged Dredged
Every Other YearEvery Other YearMile 30 to 36 Mile 30 to 36 –– Upper River Upper River –– Dredged Dredged
Every 5 to 7 YearsEvery 5 to 7 Years
Historic Disposal StrategyHistoric Disposal Strategy
Outer Bar Outer Bar –– Ocean DumpingOcean Dumping
Inland Reach Inland Reach –– Confined Upland Disposal Sites Confined Upland Disposal Sites Along the ChannelAlong the Channel
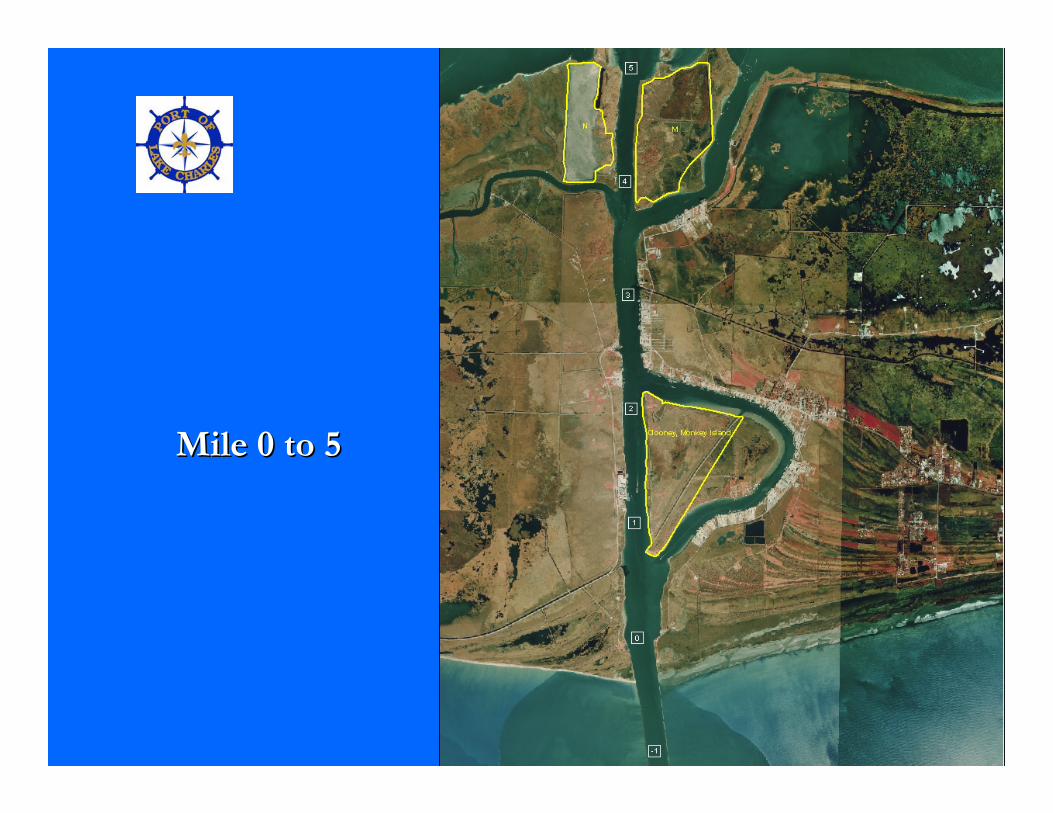
Mile 0 to 5Mile 0 to 5

Lower RiverLower RiverMile 5 to 17Mile 5 to 17
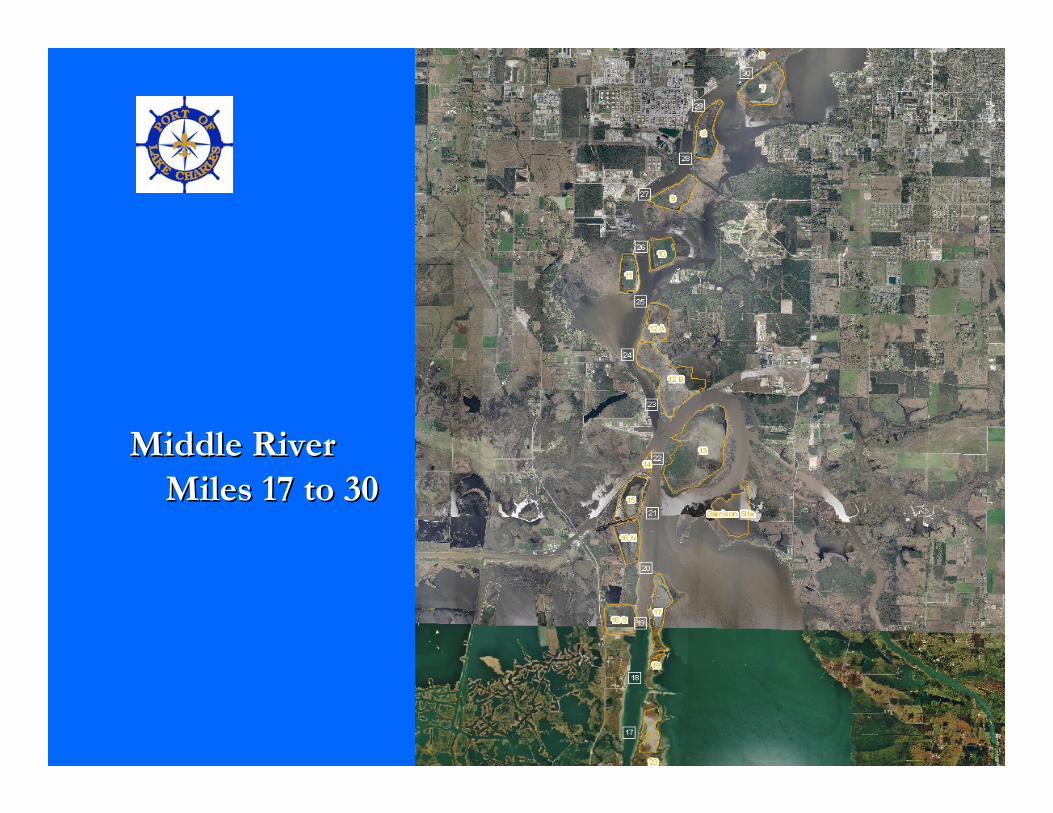
Middle River Middle River Miles 17 to 30Miles 17 to 30
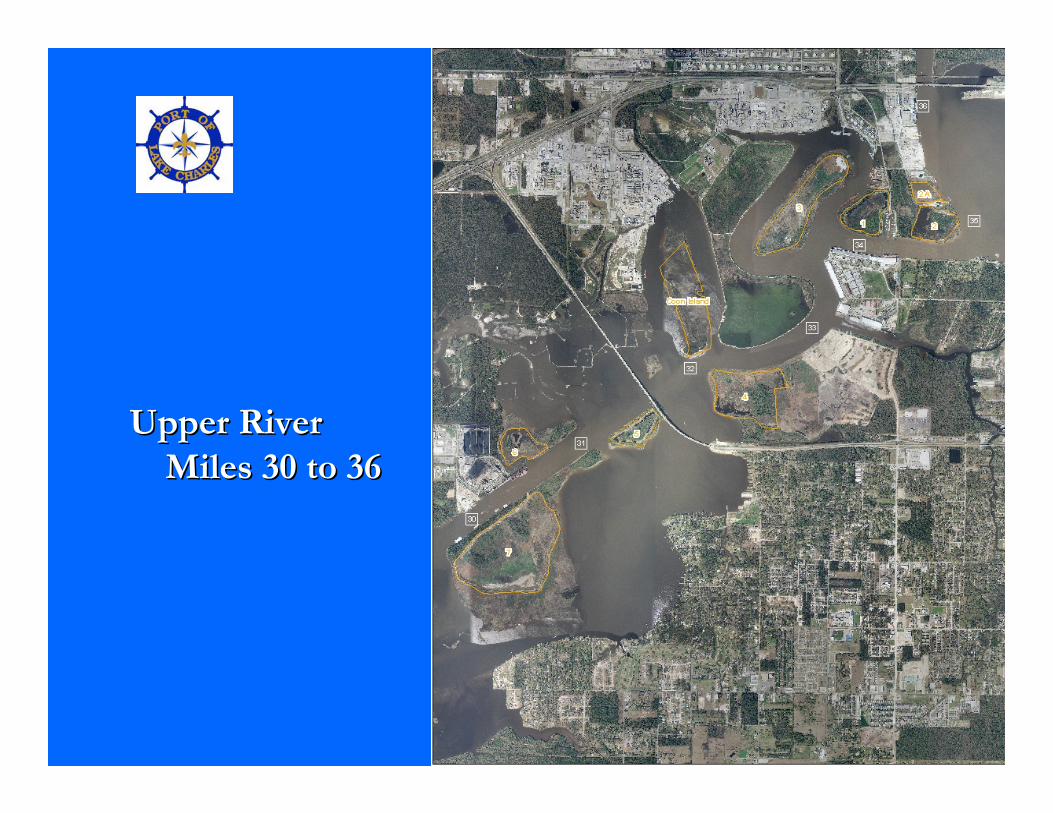
Upper River Upper River Miles 30 to 36Miles 30 to 36
The ChallengeThe Challenge
Better Manage Current Disposal SitesBetter Manage Current Disposal Sites
Identify Additional Disposal SitesIdentify Additional Disposal Sites
The SolutionThe Solution
Develop A Dredge Material Management PlanDevelop A Dredge Material Management Plan
DMMPDMMP
20 Year Plan for Dredge Material Disposal20 Year Plan for Dredge Material Disposal
To Be Updated Every 5 YearsTo Be Updated Every 5 Years
Identify Dredge Material Disposal Strategies That Identify Dredge Material Disposal Strategies That Maintain the Channel at Project DimensionsMaintain the Channel at Project Dimensions
The DMMP ProcessThe DMMP Process
LongLong
ArduousArduous
Often FrustratingOften Frustrating
Expected to Take 2 yearsExpected to Take 2 years
Likely 2 ½ Years Plus ApprovalLikely 2 ½ Years Plus Approval
Determine Future Disposal NeedsDetermine Future Disposal Needs (20 years)(20 years)
Determine Future Disposal Capacity of Determine Future Disposal Capacity of Existing Sites If Well ManagedExisting Sites If Well Managed
Identify Additional Disposal Sites to Cover Any Identify Additional Disposal Sites to Cover Any ShortfallShortfall
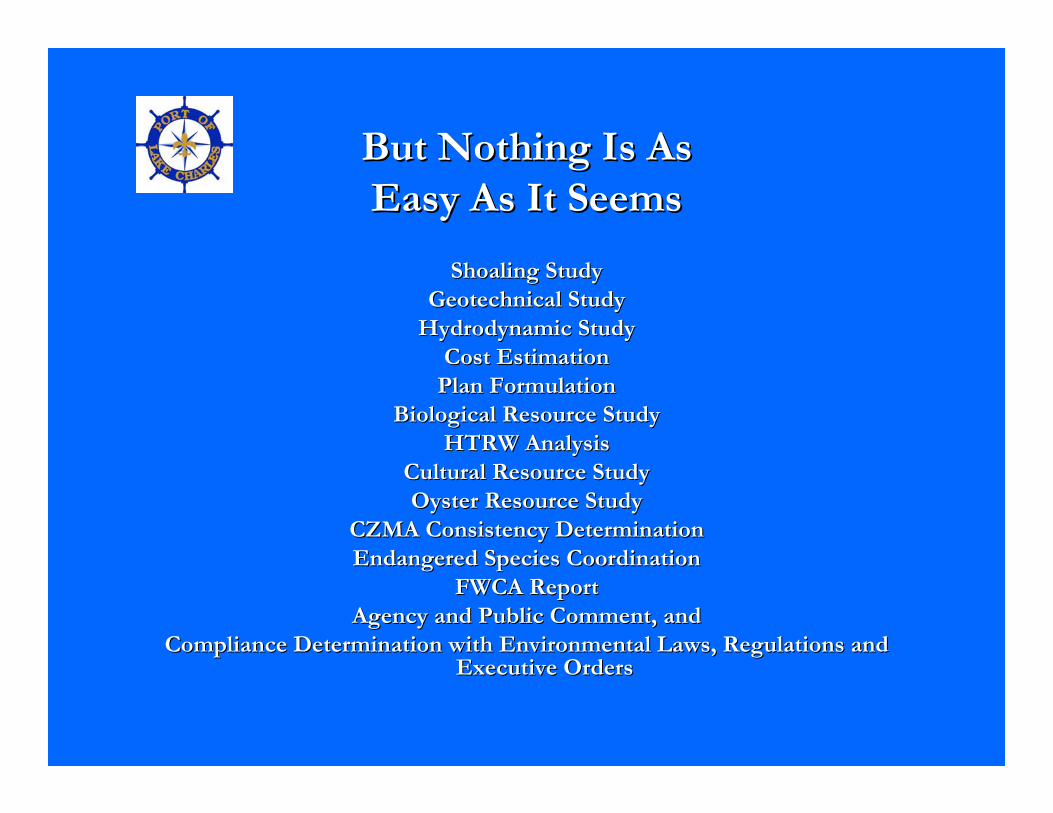
But Nothing Is As But Nothing Is As Easy As It SeemsEasy As It Seems
Shoaling StudyShoaling StudyGeotechnical StudyGeotechnical Study
Hydrodynamic StudyHydrodynamic StudyCost EstimationCost Estimation
Plan FormulationPlan FormulationBiological Resource StudyBiological Resource Study
HTRW AnalysisHTRW AnalysisCultural Resource StudyCultural Resource StudyOyster Resource StudyOyster Resource Study
CZMA Consistency DeterminationCZMA Consistency DeterminationEndangered Species CoordinationEndangered Species Coordination
FWCA ReportFWCA ReportAgency and Public Comment, andAgency and Public Comment, and
Compliance Determination with Environmental Laws, Regulations anCompliance Determination with Environmental Laws, Regulations and d Executive OrdersExecutive Orders
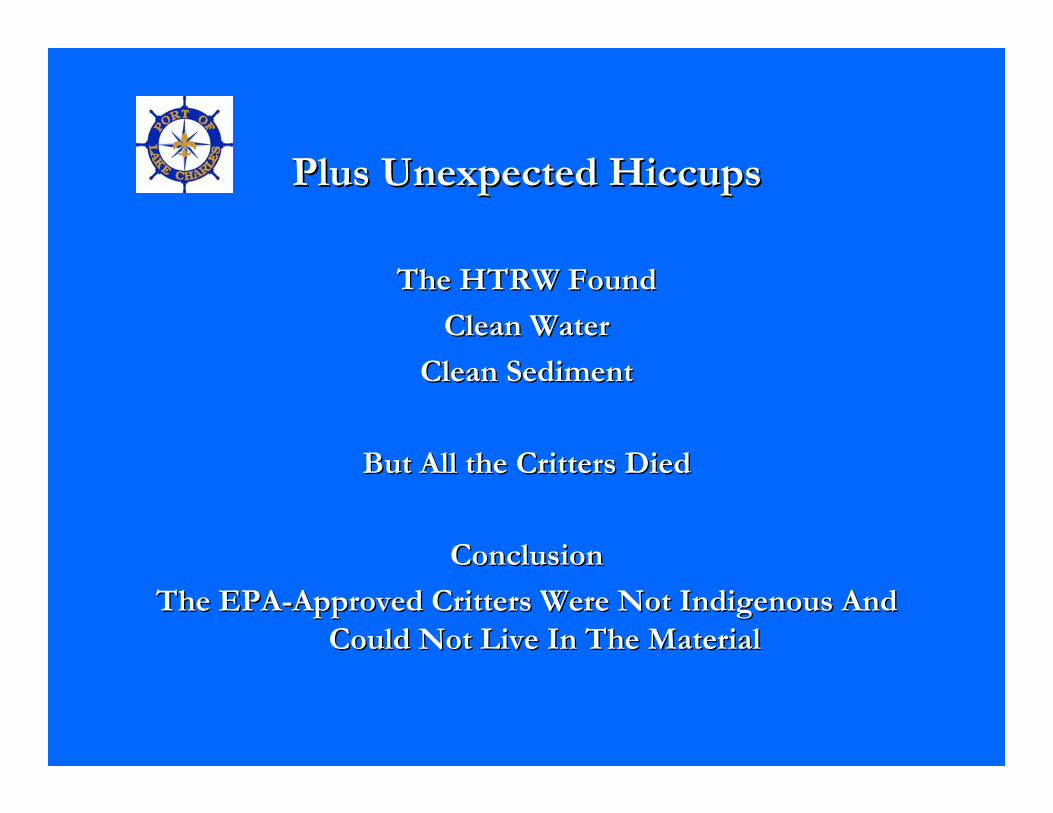
Plus Unexpected HiccupsPlus Unexpected Hiccups
The HTRW FoundThe HTRW Found
Clean WaterClean Water
Clean SedimentClean Sediment
But All the Critters DiedBut All the Critters Died
ConclusionConclusion
The EPAThe EPA--Approved Critters Were Not Indigenous And Approved Critters Were Not Indigenous And Could Not Live In The MaterialCould Not Live In The Material

Four Alternatives ConsideredFour Alternatives Considered
Do NothingDo Nothing
Closes the ChannelCloses the Channel
Ocean DumpingOcean Dumping
Least Cost Least Cost -- $400 Million$400 Million
Port/State/Public Won’t Port/State/Public Won’t ApproveApprove
CDF Expansion and BU CDF Expansion and BU –– Option 1Option 1
CDFs Plus 8 BU SitesCDFs Plus 8 BU Sites
$422 Million$422 Million
Optimize BU Optimize BU –– Option 2Option 2
CDFs Plus 14 BU SitesCDFs Plus 14 BU Sites
$405 Million$405 Million
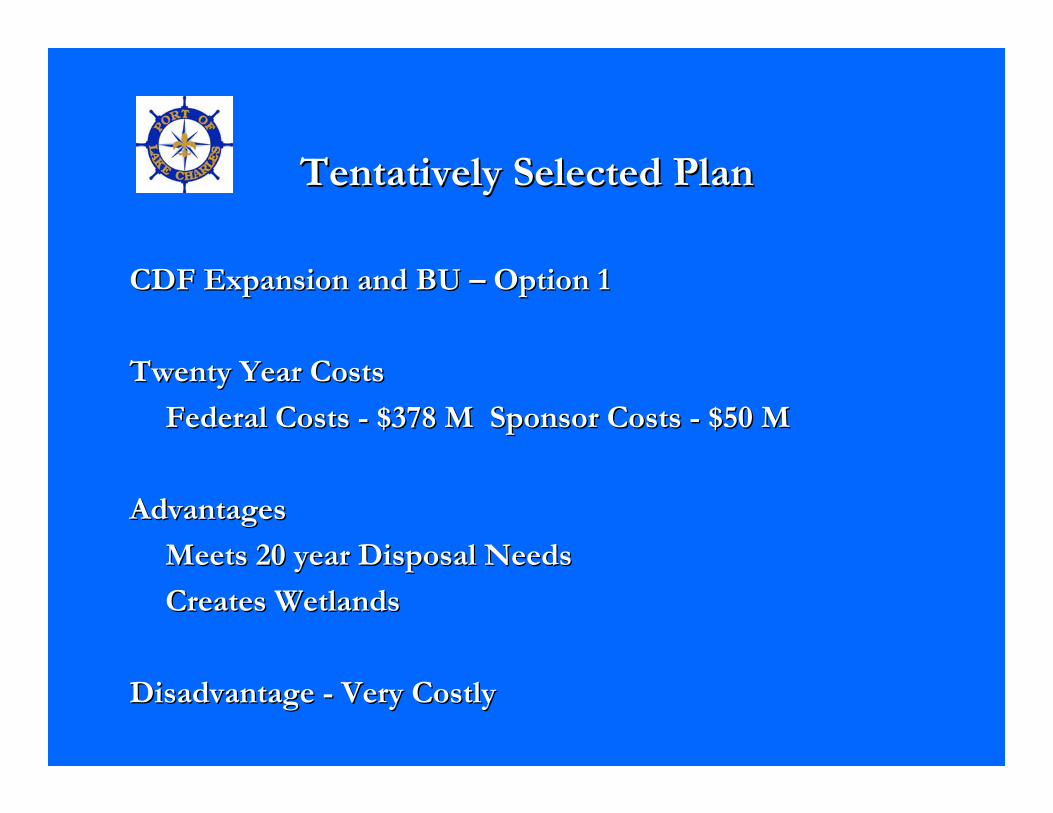
Tentatively Selected PlanTentatively Selected Plan
CDF Expansion and BU CDF Expansion and BU –– Option 1Option 1
Twenty Year CostsTwenty Year Costs
Federal Costs Federal Costs -- $378 M Sponsor Costs $378 M Sponsor Costs -- $50 M$50 M
AdvantagesAdvantages
Meets 20 year Disposal NeedsMeets 20 year Disposal Needs
Creates WetlandsCreates Wetlands
Disadvantage Disadvantage -- Very CostlyVery Costly
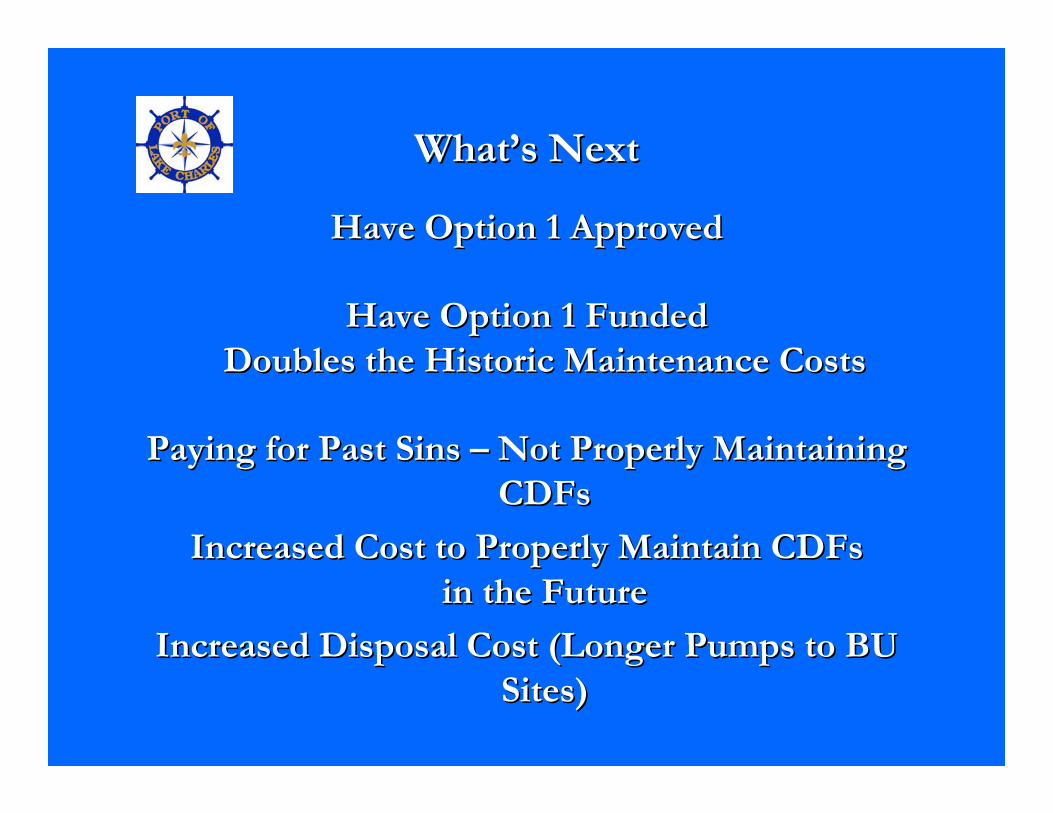
What’s NextWhat’s Next
Have Option 1 ApprovedHave Option 1 Approved
Have Option 1 Funded Have Option 1 Funded Doubles the Historic Maintenance CostsDoubles the Historic Maintenance Costs
Paying for Past Sins Paying for Past Sins –– Not Properly Maintaining Not Properly Maintaining CDFsCDFs
Increased Cost to Properly Maintain CDFs Increased Cost to Properly Maintain CDFs in the Futurein the Future
Increased Disposal Cost (Longer Pumps to BU Increased Disposal Cost (Longer Pumps to BU Sites)Sites)
What’s NeededWhat’s Needed
Joint Action by All Ports Similarly Situated to Joint Action by All Ports Similarly Situated to Increase Maintenance FundingIncrease Maintenance Funding
Appropriate Total Annual HMF Collections for Appropriate Total Annual HMF Collections for MaintenanceMaintenance
Spend Down the HMF SurplusSpend Down the HMF Surplus

LAKE CHARLES HARBOR LAKE CHARLES HARBOR AND TERMINAL DISTRICTAND TERMINAL DISTRICT
Thank YouThank You
QuestionsQuestions