lake kemp firm yield analysis - texas water development board · 2011-02-24 · final report lake...
TRANSCRIPT


FINAL REPORT
LAKE KEMP FIRM YIELD ANALYSIS
Report to
Texas Water Development Board
TWDB Contract No. 1000011065
January 2011
Prepared by
Kennedy Resource Company
in Association With
R. J. Brandes Consulting
EXECUTIVE SUMMARY
This research study has been undertaken by Kennedy Resource Company (KRC) under contract to the Texas Water Development Board (TWDB) and was authorized by the TWDB on April 23, 2010 pursuant to Contract No. 1000011065 between the TWDB and KRC. Funding for the work has been provided through the TWDB’s Research and Planning Fund with assistance from the U. S. Army Corps of Engineers (COE). The primary purpose of this study was to investigate the increase in the firm annual yields of Lake Kemp and the Lake Kemp/Diversion Lake system that would be realized by increasing the top of the conservation pool of Lake Kemp from the current elevation of 1144 feet above mean sea level (msl) to 1148 feet msl, an increase of four feet. Previous analyses conducted by the TWDB and COE arrived at conflicting results, with the TWDB, through the regional planning process, concluding that a significant increase would be realized and the COE concluding that little increase would occur. The two entities utilized different models as the basis for determining firm annual yield. The TWDB used a variation of the Water Availability Model (WAM) as previously developed by the Texas Commission on Environmental Quality (TCEQ) for the Red River Basin, whereas the COE applied its own SUPER/RiverWare model of the Wichita River. The hydrologic record specified in the WAM consisted of monthly flows for the period from 1948 through 1998; the COE’s RiverWare model utilized daily flows covering the 1924 through 2002 period. In this study an assessment was made to determine if the different yield values were due to one model’s ability to more accurately represent Lake Kemp’s available water supply or if the differences were the result of variations in some of the specific model input parameters. Both models were executed for numerous common sedimentation conditions, and several minor differences between the models’ input parameters were altered to make the models as consistent and compatible as possible. The firm annual yields of Lake Kemp and the Lake Kemp/Diversion Lake system were computed for various sedimentation conditions without and with the increase in conservation pool elevation, and all model inputs and outputs were compared between the companion versions of the WAM and the RiverWare model for each model’s critical period. Differences in firm yield results were noted, and the reasons for the differences were explored and quantified in terms of their hydrologic component contributions to the firm yield estimates during the respective critical drought periods. Considering the current (2006) sedimentation condition of Lake Kemp, results from this investigation using either the WAM or the RiverWare model indicate that there is little increase in the firm yield of Lake Kemp associated with increasing its conservation pool elevation. However, assuming projected 2060 sedimentation conditions for Lake Kemp, which translates to considerably less conservation storage capacity both without and with the increase in the conservation pool level, the WAM results indicate a significant increase in the firm yield, whereas the RiverWare model again predicted only a minor increase. The reason for these differences in firm yield has been determined to be directly linked to differences in the inflows to Lake Kemp as used in the WAM and in the RiverWare model, with the WAM inflows being significantly lower in the early portion of the two models’ common hydrologic record. With
Page 1 of 44
Lake Kemp’s reduced storage capacity for the 2060 sedimentation condition, the firm yield of the reservoir based on the WAM simulation without the four-foot increase in the conservation pool elevation is constrained by a short but severe drought that occurs in the 1950s, whereas with the four-foot elevation increase and the associated additional storage capacity, the yield is not affected by this drought. Instead, it is controlled by a much longer drought that occurs during the 1970s and 1980s. For the RiverWare model, with its higher inflows during the early period of record, the 1950s drought does not constrain the firm yield of Lake Kemp, and the longer drought of the 1970s and 1980s is the critical drought for determining firm yield under conditions both without and with the four-foot increase in the conservation pool elevation under 2060 sedimentation conditions. The procedures used to develop inflows for each of the models were reviewed during this investigation. The WAM inflows to Lake Kemp for the early period of record, i.e. before 1959, are somewhat questionable because of the techniques that were used to estimate inflows during periods when measured streamflow and other data were missing. The inflows determined by the COE for the RiverWare model during this same period appear to reflect a better approach for making these estimations, because the inflows were based on a more reliable and case-specific data. Numerous re-calculations of firm annual yield have been made with various assumptions regarding inflows to Lake Kemp and corresponding rainfall and evaporation conditions to gain understanding of the significance of the WAM and RiverWare inflow assumptions. As a result, it has been determined that the 1950s drought inflows used in the WAM should not be relied upon as the constraint for determining the firm yield of the reservoir for the 2060 sedimentation condition. With this refinement to the WAM inflows, the firm annual yield increase due to raising the conservation pool elevation of Lake Kemp was found to be insignificant based on current sedimentation conditions and only minimal under the 2060 projected sedimentation conditions.
Page 2 of 44

TABLE OF CONTENTS Page 1.0 INTRODUCTION 7
1.1 BACKGROUND 7
1.2 STUDY OBJECTIVES 7 2.0 OVERVIEW 9 2.1 FIRM ANNUAL YIELD 9 2.2 TCEQ WATER AVAILABILITY MODEL 11 2.3 COE RIVERWARE MODEL 11 2.4 RESERVOIR SEDIMENTATION 12 2.4.1 Current Sedimentation Conditions 15 2.4.2 2060 Sedimentation Conditions 15 2.5 MINOR REFINEMENTS TO MODEL INPUTS 15 2.5.1 Seasonal Rule Curve 16 2.5.2 Demand Pattern for Lake Kemp Diversions 16 2.5.3 Representation of Lake Diversion 17 3.0 FIRM ANNUAL YIELD RESULTS 18
3.1 WAM LAKE KEMP STANDALONE RESULTS 18
3.1.1 WAM Current Sedimentation Simulations 20 3.1.2 WAM 2060 Sedimentation Simulations 20
3.2 RIVERWARE LAKE KEMP STANDALONE RESULTS 20
3.2.1 RIVERWARE Current Sedimentation Simulations 22 3.2.2 RIVERWARE 2060 Sedimentation Conditions 22
3.3 LAKE KEMP STANDALONE YIELD INCREASE 22
3.3.1 Current Sedimentation Conditions 22 3.3.2 2060 Sedimentation Conditions 23 3.4 LAKE KEMP/LAKE DIVERSION SYSTEM YIELD 23
Page 3 of 44

4.0 DIFFERENCES BETWEEN MODEL INPUTS 26 4.1 EVAPORATION RATES AND INFLOWS 27 4.2 REPRESENTATION OF FLOOD OPERATIONS 27
5.0 RESERVOIR INFLOWS 28 5.1 EVAPORATION EFFECTS ON CALCULATED INFLOWS 28 5.2 WAM RESULTS USING RIVERWARE INFLOWS AND EVAPORATION RATES 34
5.3 TCEQ WAM MODEL INFLOWS 38 5.4 COE RIVERWARE MODEL INFLOWS 38
6.0 OBSERVATIONS AND CONCLUSIONS 39
6.1 SUMMARY OF FINDINGS 39 6.2 RECOMENDATIONS 39 6.3 OTHER QUESTIONS POSED BY TWDB 40 6.4 COMPARISON WITH REGION B RESULTS 41
7.0 REFERENCES 44
Page 4 of 44

LIST OF TABLES Page Table 1 Factors Affecting Firm Annual Yield Results 10 Table 2 Lake Kemp Elevation, Area, and Capacity Tables Used in Study 13 Table 3 Summary of WAM Model Results for Lake Kemp 19 Table 4 Summary of RiverWare Model Results for Lake Kemp 21 Table 5 Summary of WAM Model Results for Lake Kemp/Lake Diversion
System 25 Table 6 Comparison of Hydrologic Parameters for Drought #1 and Drought #2. 26 Table 7 Estimated Monthly Flow Generated by Rainfall on Lake Kemp 30 Table 8 Comparison of Special WAM Model Results 37 Table 9 Final Firm Annual Yield of Lake Kemp 40 Table 10 Comparison of Firm Annual Yield Results with Region B Results 42
LIST OF FIGURES Page Figure 1 WAM and RiverWare Storage Results for 2060 Condition Without
Pool Raise 32 Figure 2 Altered WAM and RiverWare Storage Results for 2060 Condition
Without Pool Raise 33 Figure 3 Monthly Comparison of RiverWare and WAM Lake Kemp Inflows for
Drought #1 35 Figure 4 Monthly Comparison of RiverWare and WAM Lake Kemp Inflows for
Drought #2 36
APPENDICES
Apendix A TWDB Summary of Yield Discrepancy Apendix B TWDB Summary of Potential Reasons for Yield Discrepancy
Page 5 of 44

Apendix C Excerpt from COE’s Documentation Pertaining to Methodology used to
Determine Inflows for Lake Kemp Apendix D TWDB Comments to the Final Draft Report (with KRC’s Responses)
Page 6 of 44

1.0 INTRODUCTION 1.1 BACKGROUND Lake Kemp is located on the Wichita River in the Red River Basin about 40 miles west of the City of Wichita Falls. The Wichita County Water Improvement District #2 and the City of Wichita Falls are the owners of Certificate of Adjudication No. 5123 that authorizes the impoundment of 318,000 acre-feet in Lake Kemp and 45,000 acre-feet in Lake Diversion downstream of Lake Kemp. This water right authorizes, with a priority date of October 2, 1920, a total diversion of 193,000 acre-feet per year for municipal, industrial, irrigation, mining, and recreational uses from both Lake Kemp and Lake Diversion. In addition, the water right owner is also authorized to use the bed and banks of the Wichita River to deliver water from Lake Kemp to Lake Diversion and then to deliver water through a canal to Lake Wichita. Through its Tulsa District Office, the U. S. Army Corps of Engineers (COE) operates Lake Kemp for flood control purposes. Lake Kemp has a seasonally-varying conservation pool, meaning that the conservation storage capacity for water supply purposes fluctuates throughout the year. Since the COE operates the Lake Kemp flood control pool, extensive real time and historical hydrologic data, as well as other reservoir information, are available on the COE's home page on the internet. Lake Kemp is located in the Region B Water Planning Area of the statewide regional water planning program administered by the Texas Water Development Board (TWDB). The 2007 Region B Plan indicates that the firm supply from the Lake Kemp/Lake Diversion System is 82,659 acre-feet/year under 2010 conditions and 36,104 acre-feet/year under 2060 conditions. The primary difference in these yield estimates is due to sedimentation in Lakes Kemp and Diversion that is expected to occur in the future, thereby reducing the reservoirs’ available conservation storage capacity. 1.2 STUDY OBJECTIVES The primary purpose of this study was to investigate the increase in the firm annual yields of Lake Kemp and the Lake Kemp/Diversion Lake system that would be realized by increasing the top of the conservation pool of Lake Kemp from the current elevation of 1144 feet above mean sea level (msl) to 1148 feet msl, an increase of four feet. A fundamental objective has been to resolve discrepancies in existing firm yield estimates for the Lake Kemp/Lake Diversion system as derived using the Water Availability Model (WAM) of the Red River Basin that was developed by the Texas Commission on Environmental Quality (TCEQ) and the COE's Wichita River SUPER/RiverWare model. Specifically, the TWDB is seeking to understand the reasons why raising the conservation pool elevation of Lake Kemp results in a significant increase in the firm yield based on the WAM but an insignificant yield increase based on the COE's SUPER/RiverWare model. TWDB has noted that there are several fundamental differences between the two models and has undertaken this study to determine: (1) which of these, or other differences, may be related to the differences in the firm yield values calculated with the two models; and (2) what amount of firm yield from the Lake Kemp/Lake Diversion system can be
Page 7 of 44

expected if the elevation of the top of the conservation pool of Lake Kemp were raised from 1,144 feet msl to 1,148 feet msl. The TWDB has compiled a summary describing the yield discrepancy issue (see Appendix A), as well as a list of possible reasons for the discrepancies in the firm yield estimates from the WAM and the RiverWare model (Appendix B). The apparent reasons for the discrepancies listed in Appendix B are addressed in Chapter 4 and 5 of this report.
Page 8 of 44

2.0 OVERVIEW 2.1 FIRM ANNUAL YIELD The firm annual yield of a water supply reservoir is an important characteristic that is used in many aspects of water management. The firm annual yield of a reservoir is generally accepted as the default maximum amount of water that the TCEQ will support for an application for a new appropriation of water that is being proposed for the purpose of municipal use without an alternate supply. Also, for purposes of regional water planning, the TWDB uses the firm annual yield to establish the dependable supply of water that is assumed to be available from a proposed water supply strategy to meet projected water demands. The firm annual yield of a reservoir is generally defined as the maximum amount of water that can be withdrawn on a uniform annual basis without causing a shortage to occur. Normally, the firm yield is determined by considering a wide range of hydrologic conditions that includes a reasonable representation of both wet and dry flow variations that are known to have occurred in the past 50 to 60 years and, most importantly, that also includes a severe drought period consisting of extremely low flows and dry climatic conditions that limit water availability. This severe drought period is the basis for determining the firm annual yield, and it is referred to as the drought of record. The firm annual yield of a reservoir is normally expressed in terms of the annual volume of water that can be withdrawn without shortages, with the withdrawals made in accordance with a prescribed monthly or seasonal pattern corresponding to an assumed type of use, for example municipal, industrial, or irrigation. The firm annual yield is usually determined using a reservoir simulation model in which all aspects of the reservoir’s physical, hydrologic, and operational characteristics are specified. The model is operated for the entire hydrologic period in order to simulate how the reservoir storage responds to wet and dry inflow conditions. An iterative process is utilized with the annual demand on the reservoir systematically changed until the simulated reservoir storage is fully depleted without experiencing a demand shortage. Once this process has been completed, the resulting annual demand is deemed to be the firm annual yield of the reservoir, and the critical drought period is defined as the period of reservoir drawdown from the point in time when the reservoir is completely full to the point in time when the minimum simulated storage occurs. Only activities occurring within this period influence the firm annual yield; all activities that occur outside of this time period have no effect on the resulting firm yield. By having an operational model available with a long-term hydrologic record, any of the reservoir’s descriptive parameters can be altered, and the firm annual yield can be re-determined, thereby affording the ability to quantify the effects of such changes on the ability of the reservoir to supply water. Of course, altering these reservoir parameters can result in a change in the critical drought period by making it longer or shorter or even occurring during a different portion of the hydrologic record altogether. This can make comparison of firm yield results among different model simulations very complicated and sometimes misleading.
Page 9 of 44

Firm yield values are determined and constrained by: (1) the volume of water the reservoir has in storage at the beginning of the critical drought period, (2) the quantities of inflows the reservoir receives during the critical drought period, and (3) the rainfall and evaporation amounts that occur during the critical drought period. The conservation storage capacity of a reservoir is often a parameter that is changed in order to test the impacts of future sedimentation and other factors on the reservoir’s ability to capture and store water. Significantly reducing reservoir capacity to reflect future sedimentation conditions can cause the critical drought period to be shifted or shortened to a period with reduced inflows, with a corresponding reduction in the firm annual yield. Under these circumstances, comparison of the resulting firm yield with the firm yield of the larger reservoir under current sedimentation conditions can be meaningless because the withdrawals from the two reservoirs are constrained by different periods of hydrology (different inflows, rainfall and evaporation). In effect, the critical drought period that is associated with the larger capacity reservoir has absolutely no bearing on the firm annual yield of the reduced capacity reservoir. Consequently, when comparing firm annual yield results for different prescribed conditions in a model or in different models, it is important to also identify and examine the different critical drought periods that influence the firm yields. Other factors that influence the firm annual yield should also be quantified and tabulated for each critical drought period in order to help understand the reasons for the yield differences between model simulations. These contributing factors are best categorized simply as inflows and outflows and can be algebraically checked to ensure that all water is quantified. Table 1 below itemizes the principal factors that can influence firm yield.
TABLE 1 FACTORS AFFECTING FIRM ANNUAL YIELD RESULTS
FOR RESERVOIR SIMULATION DURING CRITICAL PERIOD CATEGORY DESCRIPTION INFLOWS
(1) RESERVOIR INFLOWS (2) WATER IN STORAGE AT BEGINNING OF DROUGHT minus WATER REMAINING IN STORAGE AT END OF DROUGHT
OUTFLOWS (3) DIVERSIONS (4) RELEASES (5) EVAPORATION
MASS BALANCE (1) + (2) - (3) - (4) - (5) = 0
Page 10 of 44
2.2 TCEQ WATER AVAILABILITY MODEL The Water Availability Model (WAM) used in this study was obtained from the TCEQ in early 2010 and is referred to as the Run 3 version of the TCEQ’s Red River Basin WAM. The TCEQ maintains WAMs for each river basin in Texas and continually updates these models to reflect the granting of new water right permits, as well as amendments to existing water rights. Each of these WAMs, including the Red River WAM, utilizes a monthly time step to perform the water availability simulations, and all WAMs are structured using the Water Rights Analysis Package (WRAP) software developed by Texas A&M University in the mid 1980s. The WAMs are capable of simulating the interaction of an almost unlimited number of individual water rights, reservoirs, river reaches, and environmental flow requirements. The WAMs use naturalized flows as the basic hydrologic input to the model. Naturalized flows represent flows that would have occurred historically in the absence of man’s water development and water use activities. Naturalized flows are determined outside of the WAM by adjusting historical measured flows from gaging stations for the effects of historical surface water diversions, reservoir storage and evaporation, and return flows. The Run 3 version of the WAM, including that for the Red River Basin, is used primarily in the evaluation of requests for new appropriations of water, and it contains numerous assumptions consistent with this purpose. The most important of these include the following:
(1) Prior Appropriation – Water is made available to senior water rights first, up to their full authorized amounts, before the more junior water rights are considered. (2) Reservoir Sedimentation – All reservoirs are represented with their full authorized reservoir capacity, regardless of actual sedimentation conditions. (3) Return Flows – All water rights are represented as fully consuming the water they are authorized to divert, unless specific conditions in the controlling water right permit dictates otherwise. (4) Red River Compact – The terms of the Red River Compact are represented in the model such that Texas users, regardless of priority date, are limited to waters consistent with the requirements described in the compact.
The period of record simulated with the Red River WAM extends from 1948 to 1998, inclusive. This period encompasses the 1950s drought, which is the critical drought of record for most basins in the state. 2.3 COE RIVERWARE MODEL The SUPER/RiverWare model of the Wichita River, hereafter referred to as the RiverWare model, was obtained from COE in early 2010 along with documentation describing how to operate the model to determine the firm annual yield of Lake Kemp. The RiverWare model utilizes a daily time step for simulations, and it incorporates all of the daily operational aspects of
Page 11 of 44

Lake Kemp and Lake Diversion, including a seasonal rule curve that dictates the maximum level of conservation storage that is to be maintained in Lake Kemp throughout a calendar year. The Center for Advanced Decision Support for Water and Environmental Systems (CADSWES) originally developed the RiverWare model code circa 1986, and the COE migrated much of the operations logic from their previous simulation model (known as SUPER) into the current version of the RiverWare model. Similar to the TCEQ’s Red River WAM, the COE’s RiverWare model for Lake Kemp simulates the operation of Lake Kemp over a multi-year period encompassing numerous wet and dry flow sequences. The RiverWare simulation period extends from 1924 to 2002, inclusive. It should be noted that RiverWare model does not explicitly represent any water rights either upstream of Lake Kemp or downstream of Lake Wichita and thus the RiverWare model’s predominant use is specifically to simulate the operation of the Lake Kemp system. Furthermore, the RiverWare model obtained from the COE does not explicitly represent Lake Diversion as a reservoir; rather simply as a demand node in the model. The RiverWare model uses unimpaired daily flows as the inflows to the model, which were calculated by the COE. Unimpaired flows are similar to the naturalized flows used in the WAM, but typically they do not account for the historical effects on flows associated with smaller water use activities within a watershed. In addition, the methodology used to calculate unimpaired flows is somewhat different than that used to determine naturalized flows for the WAM. More discussion of these differences is included in Chapter 5. 2.4 RESERVOIR SEDIMENTATION Sedimentation has been a significant issue with Lake Kemp, and projections of the volume of conservation storage that will be lost in the future due to sedimentation was one of the driving forces for exploring the strategy of raising the level of the conservation pool in order to recover some of reservoir’s capacity to store water for water supply purposes. Current and projected 2060 sedimentation conditions for Lake Kemp were considered for quantifying the impacts of raising the conservation pool four feet on the firm yield of the reservoir. The current sedimentation condition is based on results from the TWDB’s sedimentation survey conducted in 2006 (TWDB, 2006). For the 2060 sedimentation condition, two different cases were considered, with both based on elevation-area-capacity projections obtained from Freese and Nichols (TWDB’s Region B consultant). The first, referred to herein as the 2060 standard sedimentation condition, reflects sedimentation in Lake Kemp assuming that the conservation pool would not be raised. The second is based on the assumption that the conservation pool would be raised in the year 2020, such that some sedimentation could occur between the existing top of conservation pool at elevation 1144 feet msl and the raised conservation pool at elevation 1148 feet msl. Both of these sets of data were input into of the WAM and the RiverWare model, and the firm annual yield of Lake Kemp was determined for both the existing and proposed higher conservation pool elevations. Table 2 contains the elevation, area, and capacity data used to represent the different sedimentation conditions considered in this study.
Page 12 of 44

Elevation Area Capacity Area Capacity Area Capacityfeet acres ac-ft acres ac-ft acres ac-ft0.00
1080.00 0 01081.00 0 01082.00 0 01083.00 0 01084.00 0 01085.00 0 01086.00 0 11087.00 0 11088.00 3 21089.00 63 331090.00 118 1261091.00 192 2771092.00 280 5121093.00 383 8481094.00 469 1,2711095.00 561 1,7861096.00 685 2,4031097.00 819 3,160 0 01098.00 903 4,022 47 241099.00 1,001 4,971 145 1201100.00 1,121 6,030 265 3251101.00 1,246 7,216 390 6531102.00 1,339 8,507 483 1,0901103.00 1,480 9,908 624 1,6441104.00 1,725 11,528 869 2,3911105.00 1,897 13,342 0 0 1,041 3,3461106.00 2,065 15,322 115 58 1,209 4,4721107.00 2,241 17,477 291 261 1,385 5,7691108.00 2,386 19,792 436 625 1,530 7,2271109.00 2,520 22,244 570 1,128 1,664 8,8241110.00 2,645 24,828 695 1,761 1,789 10,5511111.00 2,766 27,534 816 2,517 1,910 12,4011112.00 2,886 30,360 936 3,394 2,030 14,3711113.00 3,014 33,310 1,064 4,394 2,158 16,4661114.00 3,148 36,390 1,198 5,525 2,292 18,6911115.00 3,265 39,598 1,315 6,782 2,409 21,0421116.00 3,385 42,921 1,435 8,158 2,529 23,5111117.00 3,516 46,371 1,566 9,659 2,660 26,1061118.00 3,695 49,975 1,745 11,315 2,839 28,8561119.00 3,895 53,772 1,945 13,160 3,039 31,7961120.00 4,085 57,765 2,135 15,200 3,229 34,9301121.00 4,256 61,938 2,306 17,421 3,400 38,2451122.00 4,430 66,278 2,480 19,815 3,574 41,7321123.00 4,619 70,802 2,669 22,390 3,763 45,4011124.00 4,806 75,514 2,856 25,152 3,950 49,2581125.00 4,984 80,408 3,034 28,098 4,128 53,2971126.00 5,193 85,493 3,243 31,237 4,337 57,530
March 3, 2006 TWDB SURVEY2060 PROJECTED
SEDIMENTATION WITHOUT POOL RAISE
2060 PROJECTION WITH POOL RAISE IN 2020
TABLE 2ELEVATION, AREA CAPACITY USED IN LAKE KEMP ANALYSIS
Page 13 of 44

Elevation Area Capacity Area Capacity Area Capacityfeet acres ac-ft acres ac-ft acres ac-ft
1127.00 5,432 90,802 3,482 34,600 4,576 61,9871128.00 5,679 96,357 3,729 38,206 4,823 66,6871129.00 5,918 102,157 3,968 42,054 5,062 71,6301130.00 6,142 108,187 4,192 46,135 5,286 76,8041131.00 6,356 114,437 4,406 50,434 5,500 82,1981132.00 6,601 120,906 4,651 54,963 5,745 87,8201133.00 6,876 127,646 4,926 59,752 6,020 93,7031134.00 7,165 134,667 5,215 64,823 6,309 99,8681135.00 7,455 141,977 5,505 70,183 6,599 106,3231135.50 7,597 145,740 5,648 73,007 6,742 109,9351136.00 7,772 149,578 5,790 75,831 6,885 113,5481137.00 8,905 157,862 6,092 81,773 7,171 120,7731138.00 10,152 167,340 6,651 88,145 7,456 127,9981139.00 11,077 177,976 7,577 95,259 7,742 135,2231140.00 12,075 189,527 8,118 103,107 8,028 142,4481141.00 13,237 202,134 8,836 111,584 8,314 149,6731142.00 14,158 215,849 9,754 120,880 8,599 156,8981142.30 14,403 220,135 9,953 123,905 8,685 159,0661143.00 14,819 230,375 10,415 130,965 8,885 164,1231144.00 15,357 245,434 10,953 141,649 9,456 178,5731145.00 16,038 261,130 11,634 152,943 9,742 185,7991145.50 16,379 269,319 11,975 158,845 12,895 194,9381146.00 16,719 277,507 16,048 204,0781147.00 17,399 294,565 16,334 211,3031148.00 18,080 312,304 17,378 237,5051148.20 18,216 315,988 17,436 238,9501148.49 18,414 321,329 17,518 241,0461149.00 18,761 330,723 17,664 244,7301150.00 19,442 349,824 18,698 273,5821151.00 20,123 369,605 18,984 280,8071152.00 20,804 390,067 20,068 312,3491153.00 21,484 411,210 20,354 319,5741154.00 22,165 433,034 21,518 353,9361155.00 22,846 455,539 21,804 361,1611156.00 23,527 478,724 23,018 398,473
March 3, 2006 TWDB SURVEY 2060 PROJECTED SEDIMENTATION
2060 PROJECTION WITH POOL RAISE IN 2020
TABLE 2 (cont)ELEVATION, AREA CAPACITY USED IN LAKE KEMP ANALYSIS
Page 14 of 44

2.4.1 Current Sedimentation Conditions The TWDB’s 2006 Sedimentation Survey of Lake Kemp was used as the basis for simulating reservoir storage response in both the WAM and RiverWare models for current conditions. In TWDB’s 2006 Survey report, it is noted that there are flat, shallow areas of Lake Kemp (north and south of the Wichita River as it enters the reservoir) that are described as isolation pools. Specifically, the TWDB designated the southern area as Isolation Pool A and the northern area as Isolation Pool B. These isolation pools result in some of the water that is stored in Lake Kemp above certain elevations being trapped once the level of Lake Kemp recedes. Thus. the water that is stranded in these pools does not appear to contribute to the effective storage of Lake Kemp for water supply purposes. The TWDB made numerous additional survey measurements to quantify the area and capacity of these isolation pools, including the elevation at which each isolation pool is hydraulically connected to the main body of Lake Kemp. In an effort to quantity the impact of the isolation pools on the firm annual yield of Lake Kemp, a special version of the WAM was constructed in which each isolation pool was represented as a separate reservoir with its only water supply being water deducted from Lake Kemp each time Lake Kemp rose above each isolation pool’s respective connection elevation. Results from this model indicated that there is no apparent difference in the firm annual yield of Lake Kemp whether the isolation pools are modeled correctly as separate pools or simply as an integral part of and connected to the main body of Lake Kemp. It appears this occurs because much of the water stored at the higher elevations of Lake Kemp at the beginning of the critical drought period is lost to evaporation regardless of whether the isolations pools are assumed to be truly separate from or constantly connected to Lake Kemp. As a result of these analyses, the firm yield results for the 2006 sedimentation condition derived from the WAM and the RiverWare model for the purposes of evaluating the effect of the four-foot increase in the conservation pool were made with the simplified assumption that the isolation pools are constantly connected to Lake Kemp. 2.4.2 2060 Sedimentation Conditions Projections of 2060 sedimentation conditions in the form of elevation-area-capacity tables for Lake Kemp were used in this study as originally developed by Freese and Nichols for the Region B planning study (FNI, 2010). One scenario was analyzed to represent the conditions without the conservation pool level of the reservoir raised four feet and the other analyzed to represent the condition with the conservation pool level of the reservoir raised four feet. The data set without the increase in the conservation pool level is referred to as the 2060 Projected Sedimentation without Pool Raise and the second data set is referred to as the 2060 Projected Sedimentation with Pool Raise in 2020. As noted, the second data set assumes that the pool will be raised in the year 2020, and that sedimentation begins to accumulate in the upper four feet of the reservoir in that year. This second data set was used in the Region B water planning study for assessing the water supply strategy involving raising the conservation pool elevation of Lake Kemp. 2.5 MINOR REFINEMENTS TO MODEL INPUTS There were several model input and structure differences between the WAM and RiverWare models that were viewed as minor differences, several of which are more related to how the
Page 15 of 44

model inputs were specified by the previous users of each model rather than fundamental logic differences in the models themselves. These differences were discussed with TWDB staff, and it was decided that one or the other of the models should be modified so that both would reflect the same input conditions to the extent possible. The purpose of these modifications was to simply eliminate these inconsistencies that might obscure the later model comparisons. 2.5.1 Seasonal Rule Curve The COE’s RiverWare model has the capability to utilize a seasonal rule curve in which the top of the conservation pool of Lake Kemp is represented at two different elevations depending on the time of the year. In general, this rule curve begins in November of each year with the top of the conservation pool set at a specified elevation, then continues through March of the following year, after which it is raised a small amount and held at this higher level through October. In the RiverWare model, several different rule curves are available for Lake Kemp. The WAM, as received from TCEQ, had no such variable conservation storage capacity. However, for consistency when comparing results from the WAM and the RiverWare model, it was decided to modify the WAM data input files to reflect the following two seasonal rule curves as stipulated in the RiverWare model: For the existing top of conservation pool, Operating Level 5: 1144 feet msl November to March 1145.5 feet msl April to October For the top of conservation pool raised four feet, Operating Level 9: 1148.2 feet msl November to March 1148.49 feet msl April to October 2.5.2 Demand Pattern for Lake Kemp Diversions The COE’s RiverWare model and the associated documentation provides for a Multiple Run Management (MRM) solution for iterating within a single operation of the model to determine the firm annual yield of Lake Kemp (CADSWES, 2007). In this approach, multiple simulations are made with systematically varying daily demands until the proper value is determined that reflects the firm annual yield of the reservoir. The benefit of this process is that it enables the firm yield of Lake Kemp to be determined, in most cases, in 20 or 30 minutes of run time. The drawback of this process is there are limitations on certain data input parameters, including the representation of the demand pattern for making diversions from Lake Kemp throughout the course of a year. In the WAM model, as received from TCEQ, each of the various diversion authorizations stipulated in the Lake Kemp water right is individually represented. Since Lake Kemp is authorized to divert water for numerous types of beneficial uses, the total demand placed on the reservoir reflects the net result of all of these water use patterns, which, of course, is different from the single fixed demand pattern used in the RiverWare model. Because the firm yield of a
Page 16 of 44

large reservoir typically is not significantly influenced by the daily or monthly pattern of diversions from the reservoir, it was decided to change the WAM to reflect a uniform diversion pattern to be consistent with the RiverWare model. In addition, since the RiverWare model operates using a daily time step, leap years are represented, and thus annual diversions are higher in leap years than in non-leap years. The WAM’s monthly time step does not address leap years, and therefore, the simulated diversions from the WAM are the same each year of the simulation period. In order to make meaningful comparisons of firm yield results from the two models, the average annual demand from the RiverWare model’s firm yield simulations was used. 2.5.3 Representation of Lake Diversion The COE’s RiverWare model represents Lake Diversion as a diversion node downstream of Lake Kemp to facilitate deliveries of water from Lake Kemp, rather than a separate water supply reservoir that can be operated either on its own or as part of a system with Lake Kemp. In addition, as described above, the documentation received from the COE pertaining to determining the firm yield of Lake Kemp was specific with regard to iterating the demand from Lake Kemp with no inclusion of Lake Diversion diversions. As a result of this and the fact that the underlying purpose of this study was to determine the increase in firm annual yield of Lake Kemp due to increasing to the conservation storage capacity of Lake Kemp, it was decided that comparing the yield results for Lake Kemp as a standalone water supply from both the WAM and the RiverWare model would be the most useful. It should be noted, as described in Section 3.4, additional analyses were also conducted using the WAM to evaluate the total Lake Kemp/Diversion system yield without and with the increase in conservation storage capacity of Lake Kemp.
Page 17 of 44
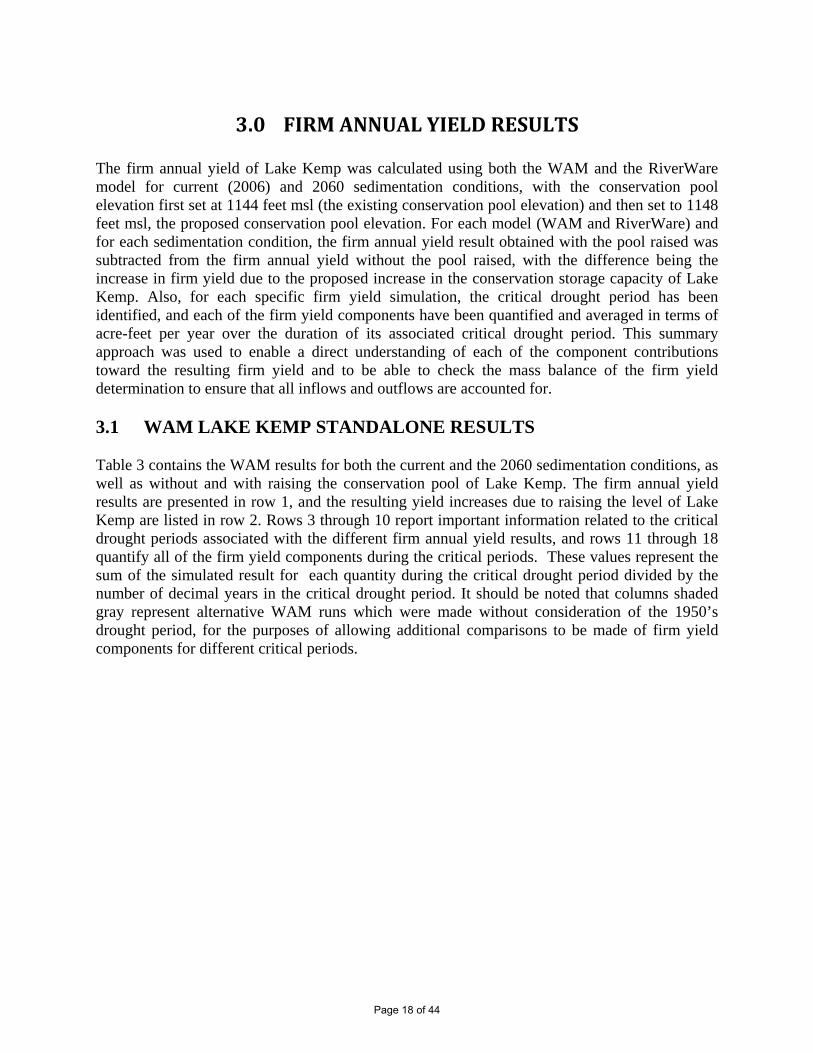
3.0 FIRMANNUALYIELDRESULTS The firm annual yield of Lake Kemp was calculated using both the WAM and the RiverWare model for current (2006) and 2060 sedimentation conditions, with the conservation pool elevation first set at 1144 feet msl (the existing conservation pool elevation) and then set to 1148 feet msl, the proposed conservation pool elevation. For each model (WAM and RiverWare) and for each sedimentation condition, the firm annual yield result obtained with the pool raised was subtracted from the firm annual yield without the pool raised, with the difference being the increase in firm yield due to the proposed increase in the conservation storage capacity of Lake Kemp. Also, for each specific firm yield simulation, the critical drought period has been identified, and each of the firm yield components have been quantified and averaged in terms of acre-feet per year over the duration of its associated critical drought period. This summary approach was used to enable a direct understanding of each of the component contributions toward the resulting firm yield and to be able to check the mass balance of the firm yield determination to ensure that all inflows and outflows are accounted for. 3.1 WAM LAKE KEMP STANDALONE RESULTS Table 3 contains the WAM results for both the current and the 2060 sedimentation conditions, as well as without and with raising the conservation pool of Lake Kemp. The firm annual yield results are presented in row 1, and the resulting yield increases due to raising the level of Lake Kemp are listed in row 2. Rows 3 through 10 report important information related to the critical drought periods associated with the different firm annual yield results, and rows 11 through 18 quantify all of the firm yield components during the critical periods. These values represent the sum of the simulated result for each quantity during the critical drought period divided by the number of decimal years in the critical drought period. It should be noted that columns shaded gray represent alternative WAM runs which were made without consideration of the 1950’s drought period, for the purposes of allowing additional comparisons to be made of firm yield components for different critical periods.
Page 18 of 44

(1) (2) (3) (4) (5) (6) (7)
1144 1148W1 W2 W3 W4 W5 W6 W7
(1) FIRM YIELD (af/y) 114,000 114,400 85,800 104,800 98,700 108,400 113,200(2) INCREASE DUE TO RAISING CONSERVATION ELEVATION (af/y) BASE1 400 BASE1 12,900 27,400
RESERVOIR PARAMETERS(3) CAPACITY @ MAX CONSERVATION ELEVATION (af) 269,319 321,329 158,845 158,845 197,692 197,692 241,046(4) AREA @ MAX CONSERVATION ELEVATION (acres) 16,379 18,414 11,975 11,975 14,010 14,010 17,518
CRITICAL DROUGHT INFORMATION(5) KEMP CAPACITY @ BEGINNING OF DRT (af) 245,434 315,988 158,845 141,649 197,692 197,692 241,046(6) MINIMUM STORAGE OF LAKE KEMP (af) 9 90 43 6,080 51 54 92(7) BEGINNING OF CRITICAL DROUGHT Apr-68 Apr-68 Jul-51 Dec-75 Jul-51 Apr-68 Apr-73(8) END OF CRITICAL DROUGHT Apr-82 Apr-82 Jun-53 Apr-82 Jun-53 Apr-82 Apr-82(9) NUMBER OF MONTHS IN CRITICAL DROUGHT 169 169 24 77 24 108 108(10) NUMBER OF YEARS IN CRITICAL DROUGHT 14.08 14.08 2.00 6.42 2.00 9.00 9.00
YIELD COMPONENTS FOR CRITICAL DROUGHT (b)(11) TOTAL INFLOWS (af/y) 151,413 156,417 122,237 128,694 141,657 140,116 144,929(12) HYDROLOGIC INFLOW (af/y) 133,987 133,987 42,836 107,566 42,836 118,156 118,156(13) STORED WATER FROM OUTSIDE OF DRT (af/y) 17,427 22,431 79,401 21,128 98,821 21,960 26,773(14) TOTAL OUTFLOW (af/y) 151,413 156,417 122,236 128,694 141,656 140,116 144,929(15) EVAPORATION LOSSES (af/y) 37,422 42,026 36,436 23,942 42,956 31,716 31,729(16) DIVERSIONS (af/y) 113,991 114,391 85,800 104,752 98,700 108,400 113,200(17) RELEASES (af/y) 0 0 0 0 0 0 0(18) INFLOWS - OUTFLOWS (af/y) 0 0 1 0 1 0 0
(a) For 1144 runs, conservation pool simulated as 1144 Jan-Mar; 1145.5 Apr-Oct; 1144 Nov-Dec. For 1148 runs, conservation pool simulated as 1148.2 Jan-Mar; 1148.5 Apr-Oct; 1148.2 Nov-Dec.
(b) All results for yield components reported as annualized average during drought period (total during drought period divided by number of years in drought).
W1 ISOLATION POOLS ASSUMED TO BE HYDRAULICALLY CONNECTED TO MAIN BODY OF LAKE KEMPW2 ISOLATION POOLS ASSUMED TO BE HYDRAULICALLY CONNECTED TO MAIN BODY OF LAKE KEMPW3 YIELD DETERMINATION BASED ON ENTIRE PERIOD OF RECORD AND STANDARD 2060 SEDIMENTATION PROJECTIONW4 YIELD DETERMINATION MADE WITHOUT CONSIDERATION OF 1950'S PERIOD AND STANDARD 2060 SEDIMENTATION PROJECTIONW5 YIELD DETERMINATION BASED ON ENTIRE PERIOD OF RECORD AND STANDARD 2060 SEDIMENTATION PROJECTIONW6 YIELD DETERMINATION MADE WITHOUT CONSIDERATION OF 1950'S PERIOD AND STANDARD 2060 SEDIMENTATION PROJECTIONW7 SEDIMENTATION PROJECTION BASED ON 2060 CONDITIONS WITH POOL RAISE IN 2020.
RUN NUMBER
TABLE 3
DESCRIPTION OF RUNS
SUMMARY OF WAM MODEL RESULTS FOR LAKE KEMP
20602006SEDIMENTATION CONDITIION1144 1148CONSERVATION ELEVATION (a)
Page 19 of 44

3.1.1 WAM Current Sedimentation Simulations The firm annual yield of Lake Kemp under current sedimentation conditions varied from 114,000 acre-feet per year at the current conservation pool elevation to 114,400 at the proposed higher conservation pool elevation, an increase of only 400 acre-feet per year, or about 0.3% (columns 1 and 2, Table 3). It should be noted that the critical drought period defining the firm annual yield (rows 7 & 8) are exactly the same in both cases and thus all firm yield components in rows 11-18 are reporting results for the same hydrologic conditions. Comparing the simulated evaporation losses in row 15 indicates that with Lake Kemp operated at the higher conservation pool elevation, an additional 4,604 acre-feet per year of evaporation losses occurred over the 14.08 years of the critical drought period (row 10). From these results, it is clear that even though operating Lake Kemp at the higher conservation pool elevation enables the reservoir to begin the drought with as much as 52,010 acre-feet more water in storage, this increase in the conservation pool elevation also causes the water surface area of Lake Kemp to be increased by 2,035 acres, or about 12% more than the exposed water surface area at the current conservation pool elevation of 1144 feet msl. Thus, by increasing the conservation pool elevation of Lake Kemp by four feet and enabling the reservoir to hold 52,010 acre-feet more water, the reservoir begins the drought period with more water in storage but also loses more of the stored water to evaporation because of the significant increase in surface area. As a result of this, the benefit of the increased capacity of Lake Kemp is offset, almost exactly, by the additional evaporation losses that occur due to the enlarged area. 3.1.2 WAM 2060 Sedimentation Simulations Under 2060 conditions, the firm annual yield of Lake Kemp varied from 85,800 acre-feet per year at the existing conservation pool elevation to 113,200 acre-feet per year for the case of the higher conservation pool elevation, which indicates an increase in firm annual yield of Lake Kemp of 27,400 acre-feet per year, or about 32%. However, unlike the current sedimentation condition results, the critical drought periods defining the firm annual yield (rows 7 & 8) are significantly different between the simulations without and with the increase in conservation pool level. Without the increase in the conservation pool level, the critical drought period is relatively short and occurs in the 1950s, whereas with the raised conservation pool level, the critical drought period is much longer extending from the early 1970s to the early 1980s. Because the critical drought periods are different, this means different hydrologic conditions constrain the firm yield results; therefore, meaningful comparisons of the yield components in rows 11-18 cannot be made directly. However, review of these results does indicate that the critical drought period for the case with the raised conservation pool is approximately the same as that determined for the current (2006) reservoir sedimentation condition (ending in the early 1980s), which suggests that Lake Kemp’s limited storage capacity under the 2060 sedimentation condition without raising the pool level is the reason the 1950s drought constrains the firm yield. Additional discussion of this issue is provided in Chapter 5. 3.2 RIVERWARE LAKE KEMP STANDALONE RESULTS
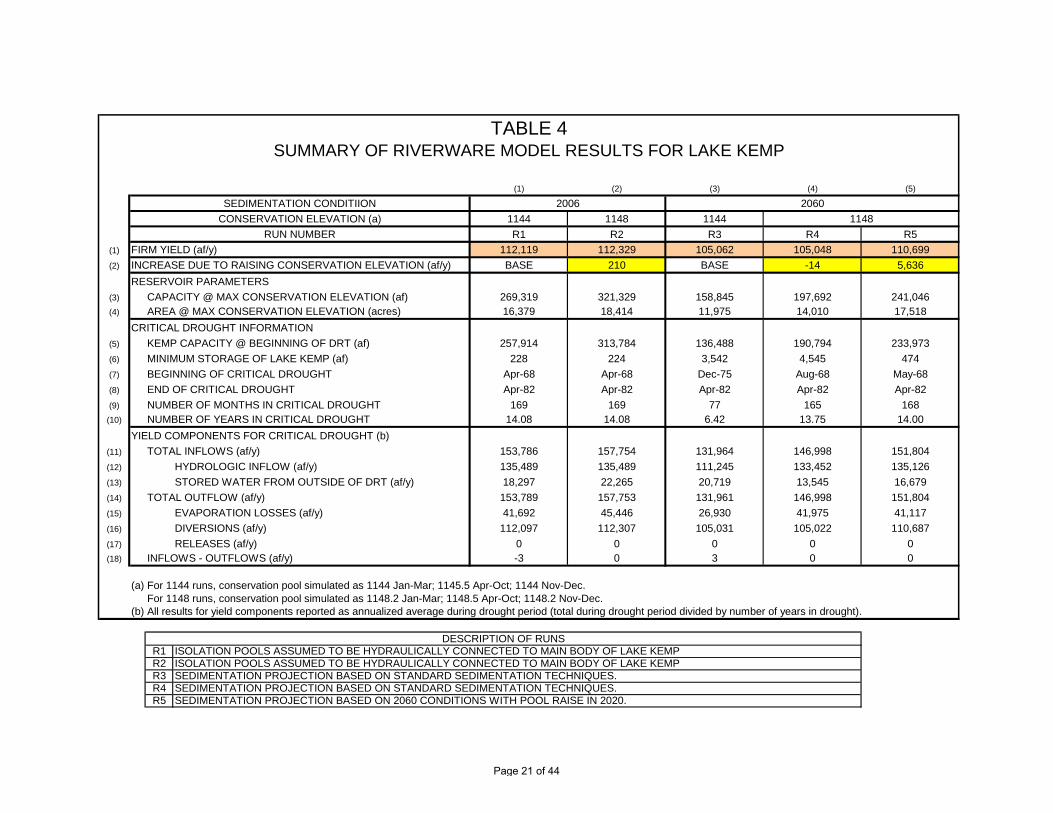
Table 4 contains results from the RiverWare model simulations for both the current and 2060 sedimentation conditions for Lake Kemp, as well as for conditions without and with the reservoir
Page 20 of 44
(1) (2) (3) (4) (5)
1144 1148 1144R1 R2 R3 R4 R5
(1) FIRM YIELD (af/y) 112,119 112,329 105,062 105,048 110,699(2) INCREASE DUE TO RAISING CONSERVATION ELEVATION (af/y) BASE 210 BASE -14 5,636
RESERVOIR PARAMETERS(3) CAPACITY @ MAX CONSERVATION ELEVATION (af) 269,319 321,329 158,845 197,692 241,046(4) AREA @ MAX CONSERVATION ELEVATION (acres) 16,379 18,414 11,975 14,010 17,518
CRITICAL DROUGHT INFORMATION(5) KEMP CAPACITY @ BEGINNING OF DRT (af) 257,914 313,784 136,488 190,794 233,973(6) MINIMUM STORAGE OF LAKE KEMP (af) 228 224 3,542 4,545 474(7) BEGINNING OF CRITICAL DROUGHT Apr-68 Apr-68 Dec-75 Aug-68 May-68(8) END OF CRITICAL DROUGHT Apr-82 Apr-82 Apr-82 Apr-82 Apr-82(9) NUMBER OF MONTHS IN CRITICAL DROUGHT 169 169 77 165 168
(10) NUMBER OF YEARS IN CRITICAL DROUGHT 14.08 14.08 6.42 13.75 14.00YIELD COMPONENTS FOR CRITICAL DROUGHT (b)
(11) TOTAL INFLOWS (af/y) 153,786 157,754 131,964 146,998 151,804(12) HYDROLOGIC INFLOW (af/y) 135,489 135,489 111,245 133,452 135,126(13) STORED WATER FROM OUTSIDE OF DRT (af/y) 18,297 22,265 20,719 13,545 16,679(14) TOTAL OUTFLOW (af/y) 153,789 157,753 131,961 146,998 151,804(15) EVAPORATION LOSSES (af/y) 41,692 45,446 26,930 41,975 41,117(16) DIVERSIONS (af/y) 112,097 112,307 105,031 105,022 110,687(17) RELEASES (af/y) 0 0 0 0 0(18) INFLOWS - OUTFLOWS (af/y) -3 0 3 0 0
(a) For 1144 runs, conservation pool simulated as 1144 Jan-Mar; 1145.5 Apr-Oct; 1144 Nov-Dec. For 1148 runs, conservation pool simulated as 1148.2 Jan-Mar; 1148.5 Apr-Oct; 1148.2 Nov-Dec.
(b) All results for yield components reported as annualized average during drought period (total during drought period divided by number of years in drought).
R1 ISOLATION POOLS ASSUMED TO BE HYDRAULICALLY CONNECTED TO MAIN BODY OF LAKE KEMPR2 ISOLATION POOLS ASSUMED TO BE HYDRAULICALLY CONNECTED TO MAIN BODY OF LAKE KEMPR3 SEDIMENTATION PROJECTION BASED ON STANDARD SEDIMENTATION TECHNIQUES.R4 SEDIMENTATION PROJECTION BASED ON STANDARD SEDIMENTATION TECHNIQUES.R5 SEDIMENTATION PROJECTION BASED ON 2060 CONDITIONS WITH POOL RAISE IN 2020.
TABLE 4
DESCRIPTION OF RUNS
SUMMARY OF RIVERWARE MODEL RESULTS FOR LAKE KEMP
206020061148
SEDIMENTATION CONDITIIONCONSERVATION ELEVATION (a)
RUN NUMBER
Page 21 of 44
operated at the higher conservation pool elevation. The firm annual yield results are presented in row 1, and the resulting increases due to the raised conservation pool elevation are in row 2. Rows 3 through 10 report information related to the critical drought periods, and rows 11 through 18 quantify all of the firm yield components for each critical drought period. 3.2.1 RiverWare Current Sedimentation Simulations The firm annual yield of Lake Kemp under current (2006) sedimentation conditions varied from 112,119 acre-feet per year with the current conservation pool elevation to 112,329 acre-feet per year with the conservation pool elevation raised four feet, which indicates an increase in the firm annual yield of Lake Kemp of only 210 acre-feet per year, or an increase of about 0.2%. Similar to the WAM model results for the same sedimentation condition, the critical drought periods defining the firm annual yield (rows 7 & 8) are exactly the same in both cases and thus all firm yield components in rows 11-18 are based on the same hydrologic conditions. Comparing the simulated evaporation losses in row 15 indicates that with Lake Kemp operated at the higher conservation pool elevation, an additional 3,754 acre-feet per year of evaporation losses occurred over the 14.08 years of the critical drought period (row 10). From these results, as was the case with the WAM, it is clear that even though operating Lake Kemp at the higher conservation pool elevation enables the reservoir to begin the drought with more water in storage, the increase in the conservation pool elevation also results in a larger water surface area for Lake Kemp, and the associated increased evaporation losses almost entirely offset the gain in firm annual yield. 3.2.2 RiverWare 2060 Sedimentation Simulations The firm annual yield of Lake Kemp under future sedimentation conditions projected out to the year 2060 varied from 105,062 acre-feet per year with the existing conservation pool elevation to 110,699 acre-feet per year at the proposed higher conservation elevation. This indicates a change in the firm annual yield of Lake Kemp of 5,637 acre-feet per year, or about 5.3%, due to raising the conservation pool level. Review of the critical drought period information in rows 7-8 indicates that without the conservation pool raised, the critical drought period was significantly shorter than the critical drought period for the case with the pool raised. Even though the critical drought periods do not reflect completely separate hydrologic conditions like the WAM 2060 results, comparisons of the yield components still cannot be effectively made between the without and with higher pool cases because of the different defining hydrologic conditions. However, unlike the WAM 2060 simulations, the critical drought periods for all of the RiverWare simulations end in the late 1980s; thus, the shorter critical drought period without the pool raised simply means that the critical drought period started later (in the mid 1970s) because the reservoir was unable to impound a small flood event due to its reduced water storage capacity. 3.3 LAKE KEMP STANDALONE YIELD INCREASE 3.3.1 Current Sedimentation Conditions Review of the results summarized in Tables 3 and 4 for the current (2006) sedimentation condition indicates that both the WAM and the RiverWare model predict a relatively
Page 22 of 44

insignificant increase in the firm annual yield of Lake Kemp due to increasing the conservation pool elevation. As discussed above, this occurs because of the expected increased yield attributable to the additional storage capacity in the reservoir is offset by the enlarged surface area of the reservoir and the associated higher evaporation losses. 3.3.2 2060 Sedimentation Conditions Under projected 2060 sedimentation conditions, the WAM results presented in Table 3 indicate a substantial increase in the firm annual yield of Lake Kemp (27,400 acre-feet per year) due to increasing the conservation pool elevation by four feet. However, based on the RiverWare model with 2060 sedimentation conditions, the increase in firm annual yield due to the higher conservation pool level is much smaller, only 5,636 acre-feet per year. The greater yield increase simulated with the WAM occurs because the lower firm yield without the pool raised is defined by a short, but severe critical drought period during the 1950s, whereas the higher firm yield with the pool raised is defined by a different and much longer critical drought period during the late 1970s and early 1980s. The reason that these critical drought periods from the WAM are different is because with the lower conservation storage capacity of Lake Kemp without the pool raised, the reservoir does not have enough water in storage before the 1950s drought occurs to sustain any more firm demand than the 85,800 acre-feet per year (Run W3) during the drought. However, with the conservation pool raised, Lake Kemp has an additional 82,201 acre-feet of storage capacity at the beginning of the 1950s drought period, which is enough to sustain the higher firm demand of 113,200 acre-feet per year (Run W5) throughout the 1950s drought. For the RiverWare model, none of the defining critical drought periods occurred during the 1950s, and thus, the determination of the firm yield increase due to the proposed increase in the conservation pool elevation was based on yield values that were all constrained by the same critical period hydrology, ending in the mid 1980s. The reason this occurs is because the inflows in the RiverWare model are higher than those in WAM for the 1950s drought period; therefore, even with the same conservation storage capacity as represented in the WAM, the RiverWare model’s firm yield results are not constrained by the 1950s drought hydrology. Instead, they are constrained by the hydrologic conditions associated with the longer critical drought period that ends in the early 1980s. 3.4 LAKE KEMP/LAKE DIVERSION SYSTEM YIELD All of the above analyses reflect determining the firm annual yield of Lake Kemp as a standalone reservoir with no association with Lake Diversion. This was done so that the impacts of raising the conservation pool elevation for the different sedimentation conditions could be isolated and thus more clearly understood. Furthermore, the present structure of the RiverWare model does not readily lend itself to analyzing anything other than Lake Kemp as a standalone reservoir. However, the overall stated objective of this study also included an assessment of the entire firm yield supply available from the Lake Kemp/Lake Diversion system. To this end, the different sedimentation conditions and conservation pool elevations that were considered in the previous Lake Kemp standalone WAM models have also been reexamined with Lake Kemp and Lake Diversion operated as a water supply system. It should be noted that based on meetings and
Page 23 of 44
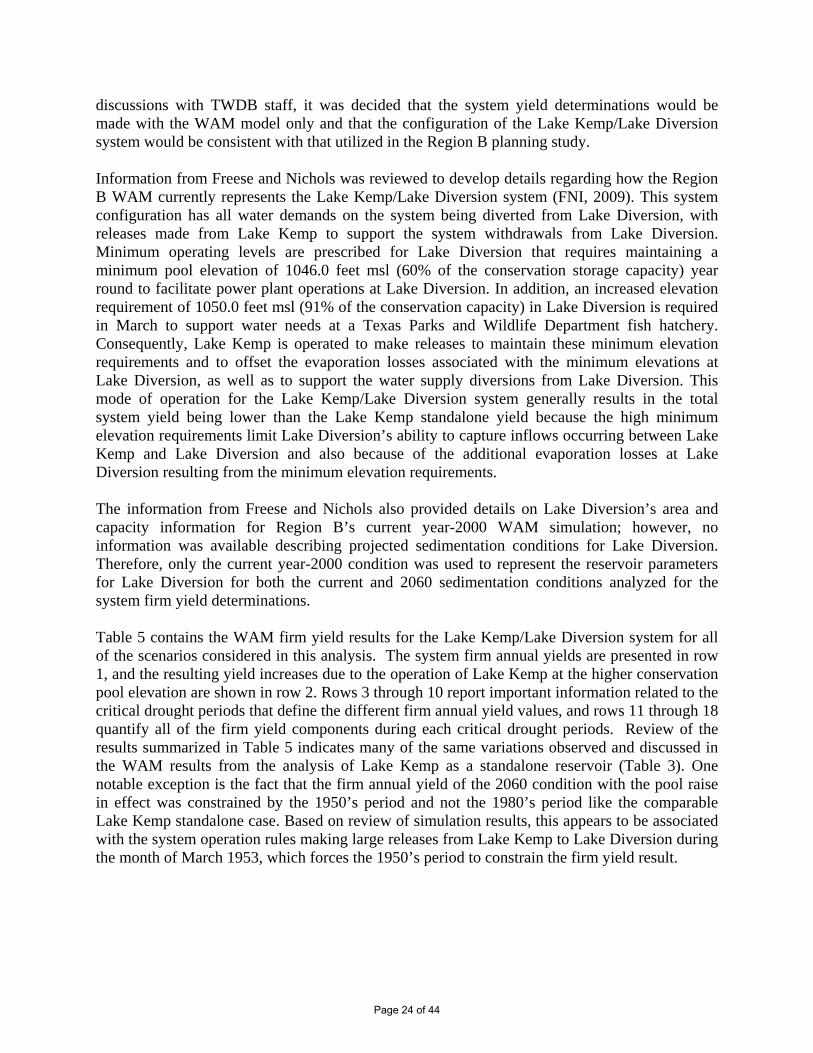
discussions with TWDB staff, it was decided that the system yield determinations would be made with the WAM model only and that the configuration of the Lake Kemp/Lake Diversion system would be consistent with that utilized in the Region B planning study. Information from Freese and Nichols was reviewed to develop details regarding how the Region B WAM currently represents the Lake Kemp/Lake Diversion system (FNI, 2009). This system configuration has all water demands on the system being diverted from Lake Diversion, with releases made from Lake Kemp to support the system withdrawals from Lake Diversion. Minimum operating levels are prescribed for Lake Diversion that requires maintaining a minimum pool elevation of 1046.0 feet msl (60% of the conservation storage capacity) year round to facilitate power plant operations at Lake Diversion. In addition, an increased elevation requirement of 1050.0 feet msl (91% of the conservation capacity) in Lake Diversion is required in March to support water needs at a Texas Parks and Wildlife Department fish hatchery. Consequently, Lake Kemp is operated to make releases to maintain these minimum elevation requirements and to offset the evaporation losses associated with the minimum elevations at Lake Diversion, as well as to support the water supply diversions from Lake Diversion. This mode of operation for the Lake Kemp/Lake Diversion system generally results in the total system yield being lower than the Lake Kemp standalone yield because the high minimum elevation requirements limit Lake Diversion’s ability to capture inflows occurring between Lake Kemp and Lake Diversion and also because of the additional evaporation losses at Lake Diversion resulting from the minimum elevation requirements. The information from Freese and Nichols also provided details on Lake Diversion’s area and capacity information for Region B’s current year-2000 WAM simulation; however, no information was available describing projected sedimentation conditions for Lake Diversion. Therefore, only the current year-2000 condition was used to represent the reservoir parameters for Lake Diversion for both the current and 2060 sedimentation conditions analyzed for the system firm yield determinations. Table 5 contains the WAM firm yield results for the Lake Kemp/Lake Diversion system for all of the scenarios considered in this analysis. The system firm annual yields are presented in row 1, and the resulting yield increases due to the operation of Lake Kemp at the higher conservation pool elevation are shown in row 2. Rows 3 through 10 report important information related to the critical drought periods that define the different firm annual yield values, and rows 11 through 18 quantify all of the firm yield components during each critical drought periods. Review of the results summarized in Table 5 indicates many of the same variations observed and discussed in the WAM results from the analysis of Lake Kemp as a standalone reservoir (Table 3). One notable exception is the fact that the firm annual yield of the 2060 condition with the pool raise in effect was constrained by the 1950’s period and not the 1980’s period like the comparable Lake Kemp standalone case. Based on review of simulation results, this appears to be associated with the system operation rules making large releases from Lake Kemp to Lake Diversion during the month of March 1953, which forces the 1950’s period to constrain the firm yield result.
Page 24 of 44
(1) (2) (3) (4) (5)
1144 1148 1148SYS1 SYS2 SYS3 SYS4 SYS5
(1) FIRM YIELD (af/y) 112,300 123,000 77,400 114,800 106,700(2) INCREASE DUE TO RAISING CONSERVATION ELEVATION (af/y) BASE 10,700 BASE 29,300
RESERVOIR PARAMETERS (KEMP + DIVERSION LAKE)(3) CAPACITY @ MAX CONSERVATION ELEVATION (af) 306,735 358,745 196,261 196,261 278,462(4) AREA @ MAX CONSERVATION ELEVATION (acres)
CRITICAL DROUGHT INFORMATION(5) SYSTEM CAPACITY @ BEGINNING OF DRT (af) 282,850 353,404 196,261 179,065 278,462(6) MINIMUM STORAGE OF SYSTEM (af) 22,399 22,649 22,457 22,579 22,430(7) BEGINNING OF CRITICAL DROUGHT Dec-50 Apr-68 Jul-51 Dec-75 Nov-50(8) END OF CRITICAL DROUGHT Jun-53 Apr-82 Jun-53 Apr-82 Jun-53(9) NUMBER OF MONTHS IN CRITICAL DROUGHT 31 169 24 77 32(10) NUMBER OF YEARS IN CRITICAL DROUGHT 2.58 14.08 2.00 6.42 2.67
YIELD COMPONENTS FOR CRITICAL DROUGHT (b)(11) TOTAL INFLOWS (af/y) 175,216 179,338 132,705 151,306 169,753(12) HYDROLOGIC INFLOW (af/y) 74,396 155,852 45,804 126,918 73,742(13) STORED WATER FROM OUTSIDE OF DRT (af/y) 100,820 23,486 86,902 24,387 96,012(14) TOTAL OUTFLOW (af/y) 173,953 180,020 131,675 151,374 168,639(15) SYSTEM EVAPORATION LOSSES (af/y) 61,762 57,030 54,275 36,627 62,085(16) SYSTEM FY DIVERSIONS (af/y) 112,191 122,990 77,400 114,747 106,554(17) RELEASES (SPILLS FROM LAKE DIVERSION) (af/y) 0 0 0 0 0(18) INFLOWS - OUTFLOWS (af/y) 1,263 -682 1,030 -68 1,115
(a) For 1144 runs, conservation pool simulated as 1144 Jan-Mar; 1145.5 Apr-Oct; 1144 Nov-Dec. For 1148 runs, conservation pool simulated as 1148.2 Jan-Mar; 1148.5 Apr-Oct; 1148.2 Nov-Dec.
(b) All results for yield components reported as annualized average during drought period (total during drought period divided by number of years in drought).
SYS1 ISOLATION POOLS ASSUMED TO BE HYDRAULICALLY CONNECTED TO MAIN BODY OF LAKE KEMPSYS2 ISOLATION POOLS ASSUMED TO BE HYDRAULICALLY CONNECTED TO MAIN BODY OF LAKE KEMPSYS3 YIELD DETERMINATION BASED ON ENTIRE PERIOD OF RECORD AND STANDARD 2060 SEDIMENTATION PROJECTIONSYS4 YIELD DETERMINATION MADE WITHOUT CONSIDERATION OF 1950'S PERIOD, STANDARD 2060 SEDIMENTATION PROJECTIONSYS5 SEDIMENTATION PROJECTION BASED ON 2060 CONDITIONS WITH POOL RAISE IN 2020.
TABLE 5
DESCRIPTION OF RUNS
SUMMARY OF WAM MODEL RESULTS FOR LAKE KEMP / LAKE DIVERSION SYSTEM
20602006SEDIMENTATION CONDITIION1144CONSERVATION ELEVATION (a)
RUN NUMBER
Page 25 of 44

4.0 DIFFERENCESBETWEENMODELINPUTS The Red River Basin WAM and the Wichita River RiverWare model were derived for different purposes, using different computer software, with most of the hydrologic input parameters derived using different techniques. Although both models use the same general approach to represent the operation of Lake Kemp, there are numerous detailed differences. Many of these differences were summarized by the TWDB before this study was initiated, and this summary is included as Appendix B. Among other items noted in this attachment, inflows and evaporation are the two fundamental hydrologic parameters that were identified, both of which are inputs to the WAM and the RiverWare model and both of which can significantly influence model results. As noted in Section 3.3.2, differences in the inflows to Lake Kemp are the primary reason for the discrepancy between two models’ firm yield results for 2060 sedimentation conditions. Reviewing the model results summarized in Tables 3 and 4 for the WAM and the RiverWare model, respectively, it is clear that there are two predominant critical drought periods in the hydrologic record that constrain the firm yield determinations. Both of these droughts occur during the WAM’s 1948-1998 simulation period. Drought No. 1 occurs in the early 1950s beginning in July of 1951 and continuing until June of 1953. Drought No. 2 generally started in April 1968 and ended in the early 1980s. In order to more effectively compare the various evaporation rates and inflow quantities associated with these droughts, various parameters have been tabulated for these two critical drought periods and summarized in Table 6.
(1)(2) MONTH IN WHICH CRITICAL PERIOD BEGINS(3)(4) NUMBER OF MONTHS IN DROUGHT(5) NUMBER OF YEARS IN DROUGHT(6) MODEL WAM RIVERWARE WAM RIVERWARE
HYDROLOGIC INFLOW FROM MODEL(7) TOTAL (af) 85,672 153,359 1,886,981 1,908,138(8) ANNUALIZED AVERAGE (af/y) 42,836 76,679 133,987 135,489
HYDROLOGIC INFLOW (ADJUSTED)(9) TOTAL (af) NA 136,317 NA 1,635,159
(10) ANNUALIZED AVERAGE (af/y) NA 68,159 NA 116,106GROSS EVAPORATION RATE (FEET)
(11) TOTAL (ft) NA 12.59 NA 78.98(12) ANNUALIZED AVERAGE (ft/y) NA 6.29 NA 5.61
NET EVAPORATION RATE (FEET)(13) TOTAL (ft) 11.76 NA 64.13 NA(14) ANNUALIZED AVERAGE (ft/y) 5.88 NA 4.55 NA
NET EVAPORATION RATE ESTIMATED (FEET)(15) TOTAL (ft) NA 10.20 NA 50.78(16) ANNUALIZED AVERAGE (ft/y) NA 5.10 NA 3.61
NOTE: Annualized Average Results calculated as total during drought period divided by number of years in drought.
Jul-51Apr-82
DROUGHT ID NUMBER
Apr-68
169
TABLE 6
DROUGHT#2
14.08
DROUGHT#1
Jun-5324
2.00
COMPARISON OF HYDROLOGIC PARAMETERS FOR DROUGHT #1 AND DROUGHT #2
MONTH IN WHICH CRITICAL PERIOD ENDS
Page 26 of 44

4.1. EVAPORATION RATES AND INFLOWS As discussed in Section 2.1, inflows into a reservoir and evaporation from the reservoir surface are important quantities to understand with regard to analyzing firm yield results since these quantities, along with the reservoir’s capacity to store water and the quantity of water diverted from the reservoir, constitute the entire basis for the firm yield determination. However, before conclusions are finalized regarding the WAM and the RiverWare model based on comparisons of these quantities, it should be noted that the evaporation rates used in the RiverWare model are fundamentally different than those used in the WAM, and this difference requires the inflows that are specified in each model to also be different. The RiverWare model uses gross evaporation rates (observed evaporation without any precipitation adjustment), while the WAM uses net evaporation rates (observed evaporation reduced by precipitation). The reasons for these different choices of evaporation rates between the models are founded in the methodologies used to develop the inflow datasets for each model and are discussed in Section 5.1. 4.2 REPRESENTATION OF FLOOD OPERATIONS As discussed in Section 2.3, the purposes and use of the COE’s RiverWare model of the Lake Kemp/Lake Diversion system are not limited to only determining available water supplies from the reservoirs, but they also include representing and simulating the operation of the reservoirs during flood events so that different operating rules can be evaluated to safely handle flood flows. Accordingly, the RiverWare model, with its daily time step, simulates the storage of water above the conservation pool and has rules that regulate the discharge of flood water based on the COE’s operational policies and physical constraints of the outlet works and downstream flooding impacts. Because the WAM utilizes a monthly time step for performing reservoir simulations and its primary purpose for analyzing water supply availability, there is no such ability or need to simulate the storage of water in excess of the conservation pool capacity; therefore, all water that the reservoir cannot store in the conservation pool is automatically spilled downstream during the month of the simulation in which it occurs. Because of these differences, it was initially thought that the different results in firm yield determinations could be related to the fact that the RiverWare model stored water in the reservoir above the conservation pool elevation. Based on reviewing simulation results from both models, it appears that this inconsistency in model operations makes little, if any, difference in the firm yield results. Another complicating issue in this regard pertains to the COE’s seasonal rule curve for defining the conservation storage capacity of Lake Kemp as a function of the month of the year. As noted in Section 2.5.1, for purposes of consistency in this study, this rule curve was implemented in both the WAM and the RiverWare model. With this rule, the definition of whether the reservoir is in the flood pool or the conservation pool at the beginning of a critical drought period can change depending on which month the critical drought period begins. In an effort to normalize firm yield results in light of this issue, the quantity of water in storage immediately before the critical drought period begins is reported in row 5 of Table 4 for the RiverWare model. If a substantial quantity of water was stored in the flood pool in RiverWare before the critical drought period, then systematically shorter drought periods would be expected with the RiverWare results; however, this is not generally the case.
Page 27 of 44

5.0 RESERVOIRINFLOWS As a result of the findings discussed in the previous sections, reservoir inflows to Lake Kemp from the WAM and from the RiverWare model were compared. Based on these comparisons, it is clear that the difference in the inflows to Lake Kemp, when it is operated as a standalone reservoir under 2060 sedimentation conditions, is the reason the WAM firm yield results indicate a large increase due to raising the conservation pool level while only a minimal increase is indicated based on the corresponding RiverWare model results. As a point to note, the time series of inflows specified in the WAM and in the RiverWare model do not change with the different sedimentation conditions being simulated. Instead, the computed yield values change in response to the assumed sedimentation conditions being analyzed, and it is these sedimentation conditions that force one model or the other to be constrained by inflows outside of the other model’s critical drought period. As described in the following sections, several alternative inflow datasets have been constructed and used to demonstrate the conclusion that inflows used in the two models are the likely cause of the yield disparity associated with raising the conservation pool elevation under 2060 sedimentation conditions. 5.1 EVAPORATION EFFECTS ON CALCULATED INFLOWS The basic approach used by the TCEQ and the COE for determining inflows to Lake Kemp is essentially the same and involves calculating monthly (WAM) or daily (RiverWare) flow values based on a water balance analysis using historical records of reservoir storage, evaporation, precipitation, diversions and releases. As discussed in Section 4.1, one substantial difference in the application of the water balance analysis by the TCEQ and the COE relates to the representation of historical evaporation losses and precipitation inflows for Lake Kemp. The TCEQ used net evaporation (observed evaporation reduced by observed precipitation) to calculate historical net evaporation losses from Lake Kemp, and these evaporation losses were used in the water balance calculations to determine the corresponding inflows. The COE used gross evaporation rates (observed evaporation without any precipitation adjustment) to calculate historical evaporation losses from Lake Kemp and did not account for (subtract away) precipitation inflows across the reservoir surface in its water balance calculations, which means that the COE’s calculated inflows have the precipitation inflows embedded in them (COE, 2004). As a result of using these different procedures for representing evaporation and precipitation effects in the inflow calculations, the WAM inflows require the use of net evaporation rates for calculating reservoir evaporation losses in the WAM simulations, and the RiverWare inflows require that gross evaporation rates be used for calculating reservoir evaporation losses in the RiverWare simulations. Precipitation is not an input to the RiverWare model since the precipitation inflows are already accounted for in the RiverWare inflows. Because of these differences, inflows from one model cannot be simply replaced in the other model to test the firm yield results; nor can evaporation rates be substituted in the same manner. As a test of the correspondence between the calculated inflows based on the different procedures used by the TCEQ and the COE for representing evaporation effects in the water balance analyses, adjustments in the COE inflows to Lake Kemp were made in an attempt to make them
Page 28 of 44

compatible with the TCEQ inflows. Historical daily water surface elevation records for Lake Kemp and monthly historical precipitation records for Lake Diversion (located approximately 20 miles east of Lake Kemp) were obtained from the COE. This information was used with the elevation-area-capacity data in the COE’s report titled “Summary of Studies Report on Pool Elevation Probability Determination” (January 29, 2004) to estimate the historical monthly precipitation inflows that are embedded in the COE’s calculated inflows as used in the RiverWare model. These monthly precipitation inflow values are listed in Table 7.
Page 29 of 44

YEAR JAN FEB MAR APR MAY JUN JUL AUG SEP OCT NOV DEC TOT1924 56 126 1,998 2,446 470 1,865 1,018 1,833 213 780 211 495 11,5101925 711 152 0 2,199 1,912 160 3,733 2,826 7,090 3,183 2,356 352 24,6711926 1,240 0 3,873 5,669 3,883 1,889 3,128 4,189 6,426 3,903 193 5,070 39,4621927 2,123 2,512 1,199 7,179 4,414 6,635 2,161 2,316 3,726 973 1,261 1,079 35,5801928 540 2,071 896 1,576 5,238 3,668 3,379 723 138 631 1,761 821 21,4421929 207 712 1,922 810 5,572 783 5,657 675 3,923 2,286 2,960 180 25,6871930 1,133 0 2,085 2,323 4,870 3,739 2,744 702 122 10,206 1,127 1,457 30,5081931 1,419 3,226 3,334 2,316 546 2,169 2,692 1,038 232 5,710 2,419 2,036 27,1351932 3,473 3,880 126 2,072 1,903 3,039 3,312 2,611 4,154 1,345 0 5,993 31,9081933 418 992 2,931 972 6,546 1,033 4,510 3,470 871 764 2,112 3,117 27,7361934 1,718 1,794 4,333 1,455 3,870 1,775 0 1,427 2,374 313 4,102 0 23,1601935 727 1,095 1,150 599 6,452 6,834 1,653 1,287 4,015 4,382 2,421 1,281 31,8971936 940 0 328 1,431 5,644 0 552 0 1,529 2,296 255 1,205 14,1821937 1,072 0 3,737 2,172 2,082 2,142 1,502 2,127 964 5,002 698 2,848 24,3461938 997 8,647 4,744 2,686 5,174 4,665 2,320 810 778 0 1,373 156 32,3491939 2,505 479 3,031 1,082 3,749 1,183 938 3,345 490 208 1,321 494 18,8241940 156 1,409 0 2,197 2,414 2,844 1,113 784 544 1,572 1,757 1,173 15,9631941 1,666 2,989 506 4,646 9,276 7,000 4,271 5,003 2,927 5,732 1,070 2,727 47,8131942 152 413 1,517 8,132 1,020 4,177 683 4,969 3,892 5,995 1,846 2,822 35,6171943 1,297 243 3,256 5,465 6,410 3,729 359 0 1,171 2,541 1,503 3,140 29,1151944 1,980 2,825 885 1,015 1,483 2,402 1,576 1,298 727 2,054 1,227 676 18,1481945 1,182 1,550 3,368 2,860 294 2,785 3,331 2,420 4,242 1,364 402 101 23,8991946 2,694 765 1,943 380 883 838 450 827 3,366 2,063 2,755 3,222 20,1871947 536 543 1,667 4,632 8,940 9,604 1,266 83 688 2,096 3,190 2,754 35,9991948 1,256 2,668 1,675 652 8,064 5,763 1,842 379 0 2,119 343 95 24,8561949 5,906 2,088 626 1,067 7,176 7,253 710 2,659 7,639 5,241 219 2,138 42,7211950 1,098 1,973 13 3,495 9,381 6,329 12,567 11,239 10,942 529 0 117 57,6841951 507 2,408 2,062 1,202 7,830 4,643 874 1,055 2,716 443 892 0 24,6321952 432 406 996 1,537 3,114 83 577 0 21 0 758 429 8,3541953 78 284 611 532 453 750 285 819 203 2,380 479 386 7,2601954 324 107 61 1,432 6,722 4,602 976 190 58 321 442 1,870 17,1061955 1,869 819 1,529 731 6,328 5,712 2,265 1,064 7,759 6,951 0 314 35,3411956 879 1,392 0 171 7,222 553 1,830 26 461 2,584 564 1,090 16,7731957 653 1,112 1,495 4,709 12,751 4,665 1,869 0 972 5,784 7,826 866 42,7031958 2,076 1,438 2,194 2,822 5,384 2,449 5,524 2,295 2,366 1,506 755 447 29,2551959 202 319 396 1,118 2,540 3,830 3,079 1,522 1,280 5,921 2,259 2,972 25,4391960 1,534 1,480 1,153 649 4,028 2,907 3,585 1,190 3,325 6,676 0 5,368 31,8941961 586 2,836 5,039 0 2,580 6,634 4,163 145 5,401 1,572 3,486 1,536 33,9771962 328 208 893 4,872 1,243 6,048 3,388 223 9,407 2,573 3,028 2,048 34,2571963 288 717 514 1,827 3,358 1,576 4,168 1,025 2,927 48 2,781 757 19,9861964 775 2,134 1,170 3,677 2,043 1,805 83 1,568 3,255 694 2,030 327 19,5611965 961 567 356 1,170 3,000 1,345 191 940 937 3,338 65 661 13,5311966 1,288 1,592 492 6,291 294 1,104 3,912 6,798 9,001 1,356 584 131 32,8431967 517 190 748 9,350 3,953 3,506 5,366 384 3,240 2,502 433 919 31,1081968 5,951 3,074 3,565 1,847 2,647 2,545 3,870 1,992 1,396 1,775 3,330 899 32,8891969 747 3,171 2,190 890 4,743 2,989 761 5,681 5,585 5,263 706 2,463 35,1891970 0 1,553 5,200 3,321 1,520 664 0 563 3,115 1,498 196 205 17,8351971 95 588 22 214 923 332 399 1,398 3,167 2,227 230 1,567 11,1611972 0 200 61 887 1,419 2,309 1,046 1,214 2,865 6,885 2,594 387 19,8681973 2,010 1,083 1,517 3,653 1,772 3,542 2,274 585 3,532 1,722 1,084 264 23,037
TABLE 7ESTIMATED MONTHLY FLOW GENERATED BY RAINFALL ON LAKE KEMP
BASED ON AVERAGE KEMP WATER SURFACE AREA * RAINFALL; IN UNITS OF ACRE-FEET
Page 30 of 44

These quantities of water were subtracted from the COE’s RiverWare inflows with the resulting quantities referred to as “RiverWare Adjusted” inflows. The graph in Figure 1 shows how these adjusted inflows compare with the original RiverWare inflows and the WAM inflows for the 1950s drought period (Drought #1). A similar graph is presented in Figure 2 for the 1980s critical drought period (Drought #2). As indicated, even with the RiverWare inflows adjusted to be more compatible with those in WAM, the WAM inflows are still noticeably lower in the 1950’s period. It should also be noted that these inflow comparisons for the Drought #2 period indicate that the RiverWare inflows are generally slightly lower than the WAM inflows for the later period.
YEAR JAN FEB MAR APR MAY JUN JUL AUG SEP OCT NOV DEC TOT1974 0 581 861 2,857 1,033 1,099 479 1,837 2,985 780 454 741 13,7071975 850 1,218 735 976 5,771 2,721 4,680 2,591 4,387 363 2,235 2,836 29,3631976 0 0 2,356 5,145 5,331 938 991 815 2,015 7,156 289 385 25,4221977 697 1,528 1,633 4,460 5,373 992 410 4,120 0 991 643 65 20,9131978 168 1,258 758 463 2,545 1,878 1,041 4,698 502 1,256 1,904 258 16,7271979 1,206 613 1,081 1,543 1,912 3,121 317 1,941 0 482 1,714 1,258 15,1891980 832 510 446 399 2,900 1,751 0 80 88 493 666 655 8,8201981 0 1,945 827 1,991 1,508 3,335 245 1,236 212 3,816 277 239 15,6311982 863 688 1,062 455 3,319 7,337 624 1,111 2,494 392 2,185 1,867 22,3971983 1,481 1,640 2,550 2,065 3,558 4,654 748 0 143 9,488 1,618 1,060 29,0061984 27 1,856 1,929 352 661 2,311 446 2,446 655 2,339 2,307 5,977 21,3071985 253 4,261 3,084 3,541 1,790 8,367 1,084 1,529 1,415 4,287 927 124 30,6611986 0 1,754 1,184 2,492 5,510 4,709 134 5,108 7,869 6,654 4,866 1,007 41,2871987 2,759 4,105 1,213 522 8,535 3,342 532 5,299 4,080 0 954 5,848 37,1881988 1,230 141 1,547 1,911 543 2,686 1,087 468 3,920 294 281 154 14,2621989 1,866 3,077 812 0 3,836 5,670 641 2,200 9,434 1,934 0 300 29,7701990 1,247 5,735 5,334 8,540 4,626 538 3,833 902 1,839 2,060 3,495 920 39,0691991 3,450 0 629 274 3,380 5,486 5,293 4,503 10,790 3,681 704 6,711 44,9001992 2,676 3,459 3,483 1,734 5,884 9,615 2,508 2,388 4,098 0 4,643 2,832 43,3221993 1,398 4,841 3,511 4,160 3,900 1,890 1,304 2,419 3,605 4,131 1,554 2,122 34,8341994 117 1,878 2,006 1,700 3,699 1,248 1,602 253 974 4,129 1,889 1,187 20,6801995 1,200 237 2,152 2,711 10,946 6,071 1,970 9,857 4,654 1,110 2,108 1,367 44,3821996 1,354 0 2,930 250 845 1,685 2,483 4,141 4,301 1,615 3,917 127 23,6481997 560 4,575 597 5,921 5,210 6,445 465 2,945 771 3,718 1,399 4,500 37,1081998 3,044 3,583 5,027 1,647 0 3,982 3,329 869 973 1,806 338 512 25,1121999 1,918 0 3,500 1,883 3,281 4,416 819 338 233 2,248 228 0 18,8652000 540 618 2,777 1,708 505 2,780 409 0 50 2,624 3,564 500 16,0762001 1,503 2,305 2,210 666 3,944 88 0 600 522 254 974 539 13,6052002 500 547 1,771 3,401 1,118 4,362 5,800 925 2,016 5,024 1,046 1,574 28,085
AVG 1,152 1,567 1,790 2,382 3,861 3,322 2,041 1,966 2,800 2,664 1,526 1,483 26,554MAX 5,951 8,647 5,334 9,350 12,751 9,615 12,567 11,239 10,942 10,206 7,826 6,711 57,684MIN 0 0 0 0 0 0 0 0 0 0 0 0 7,260SUM 91,039 123,787 141,408 188,199 304,999 262,416 161,223 155,336 221,196 210,434 120,579 117,121 2,097,736
TABLE 7 (cont)ESTIMATED MONTHLY FLOW GENERATED BY RAINFALL ON LAKE KEMP
BASED ON AVERAGE KEMP WATER SURFACE AREA * RAINFALL; IN UNITS OF ACRE-FEET
Page 31 of 44

0
2,000
4,000
6,000
8,000
10,000
12,000
14,000
16,000
18,000
20,000
22,000
24,000
26,000
28,000
30,000
6/1/1951 9/1/1951 12/1/1951 3/1/1952 6/1/1952 9/1/1952 12/1/1952 3/1/1953 6/1/1953
TOTA
L IN
FLO
WS
(AC
RE-
FEET
PER
MO
NTH
)FIGURE 1
MONTHLY COMPARISON OF RIVERWARE AND WAM LAKE KEMP INFLOWSFOR DROUGHT#1 (Jul 1951 through Jun 1953)
RIVERWARE
RIVERWARE (ADJUSTED)
WAM
Page 32 of 44

FIGURE 2MONTHLY COMPARISON OF RIVERWARE AND WAM LAKE KEMP INFLOWS
FOR DROUGHT #2 (APR 1968 through APR 1982)
0
10,000
20,000
30,000
40,000
50,000
60,000
70,000
3/1/1968 3/1/1970 3/1/1972 3/1/1974 3/1/1976 3/1/1978 3/1/1980 3/1/1982
TOTA
L IN
FLO
WS
(AC
RE-
FEET
PER
MO
NTH
)
RIVERWARE
RIVERWARE (ADJUSTED)
WAM
Page 33 of 44

5.2 WAM RESULTS USING RIVERWARE INFLOWS AND EVAPORATION The curve in Figure 3 shows the simulated storage variations for Lake Kemp from the WAM and the RiverWare model for the 2060 sedimentation condition without the raised conservation pool (Run W3 – Table 3 and Run R3 – Table 4). For these simulations, the demand on Lake Kemp in both models is set to their respective firm yield values (WAM demand = 85,800 acre-feet/year and RiverWare demand = 105,062 acre-feet/year). This storage plot illustrates that the WAM yield is constrained by the 1950s drought (DRT #1) while the RiverWare yield is constrained by the 1980s drought (DRT #2) as these respective storage curves approach zero during these periods. To clearly demonstrate that the difference between the models’ results for the 2060 sedimentation condition without the raised conservation pool is due to the inflow differences, the WAM model was altered to include the RiverWare inflows and evaporation rates, and the firm annual yield of Lake Kemp was re-computed. The resulting firm annual yield of Lake Kemp was 106,400 acre-feet per year, approximately 1,338 acre-feet per year (1.3%) more than the 105,062 acre-feet per year determined for the yield with the comparable RiverWare model. Furthermore, the defining critical drought period ended in the early 1980s, not the mid 1950s. Figure 4 presents a graph of the simulated storage results from this altered version of the WAM along with the corresponding RiverWare results. Table 8 summarizes the detailed results from this altered WAM simulation (S1) along with the RiverWare model (R3). As shown, these results are generally consistent. The slight differences in firm yield results between the WAM and the RiverWare model are probably related to the fact that the RiverWare model has more elevation-area-capacity data points representing the physical characteristics of the reservoir, and also because of the daily time step used in the RiverWare model, which affords more opportunity to reflect changes in surface area during a month as opposed to the WAM’s single area determination each month. In addition, the daily time step in the RiverWare model also can result in slightly different capacities from the WAM at the beginning of months in which the seasonal rule curve shifts the conservation pool elevation either up or down. Nonetheless, this exercise demonstrates that the differences in model results between the WAM and the RiverWare model when applied to Lake Kemp as a standalone reservoir are likely due to the differences in their specified respective inflows and evaporation rates.
Page 34 of 44
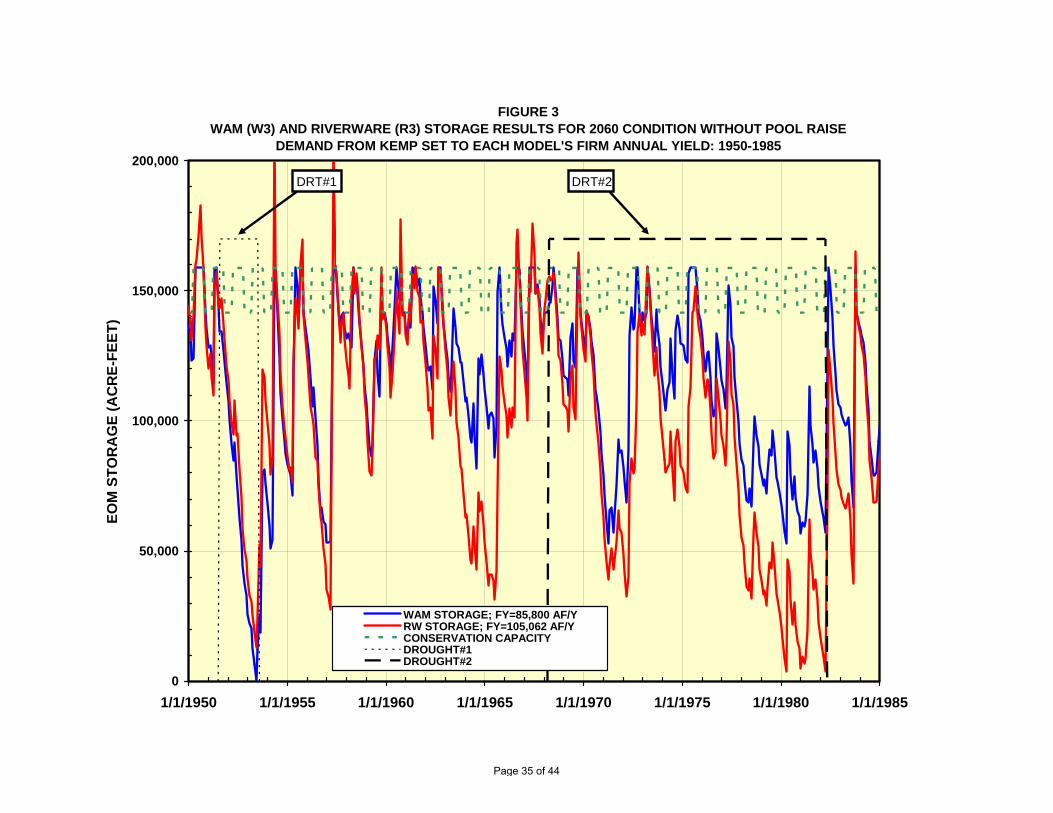
FIGURE 3WAM (W3) AND RIVERWARE (R3) STORAGE RESULTS FOR 2060 CONDITION WITHOUT POOL RAISE
DEMAND FROM KEMP SET TO EACH MODEL'S FIRM ANNUAL YIELD: 1950-1985
0
50,000
100,000
150,000
200,000
1/1/1950 1/1/1955 1/1/1960 1/1/1965 1/1/1970 1/1/1975 1/1/1980 1/1/1985
EOM
STO
RA
GE
(AC
RE-
FEET
)
WAM STORAGE; FY=85,800 AF/YRW STORAGE; FY=105,062 AF/YCONSERVATION CAPACITYDROUGHT#1DROUGHT#2
DRT#1 DRT#2
Page 35 of 44

FIGURE 4ALTERED WAM (S1) AND RIVERWARE (R3) STORAGE RESULTS FOR 2060 CONDITION WITHOUT POOL
RAISE. DEMAND FROM KEMP AT EACH MODEL'S FIRM ANNUAL YIELD: 1950-1985
0
50,000
100,000
150,000
200,000
1/1/1950 1/1/1955 1/1/1960 1/1/1965 1/1/1970 1/1/1975 1/1/1980 1/1/1985
EOM
STO
RA
GE
(AC
RE-
FEET
)
WAM STORAGE; FY=106,400 AF/YRW STORAGE; FY=105,062 AF/YCONSERVATION CAPACITYDROUGHT#1DROUGHT#2
DRT#1 DRT#2NOTE: ALTERED WAM USES RIVERWARE INFLOWS AND
EVAPORATION RATES
Page 36 of 44

(1) (3)
WAM RIVERWARES1 R3
(1) FIRM YIELD (af/y) 106,400 105,062(2) YIELD IF MODELS USED ALL STORED WATER (af/y) 106,451 105,614
RESERVOIR PARAMETERS(3) CAPACITY @ MAX CONSERVATION ELEVATION (af) 158,845 158,845(4) AREA @ MAX CONSERVATION ELEVATION (acres) 11,975 11,975
CRITICAL DROUGHT INFORMATION(5) KEMP CAPACITY @ BEGINNING OF DRT (af) 141,649 136,488(6) MINIMUM STORAGE OF LAKE KEMP (af) 461 3,542(7) BEGINNING OF CRITICAL DROUGHT Apr-73 Dec-75(8) END OF CRITICAL DROUGHT Apr-82 Apr-82(9) NUMBER OF MONTHS IN CRITICAL DROUGHT 109 77
(10) NUMBER OF YEARS IN CRITICAL DROUGHT 9.08 6.42YIELD COMPONENTS FOR CRITICAL DROUGHT (b)
(11) TOTAL INFLOWS (af/y) 138,214 131,964(12) HYDROLOGIC INFLOW (af/y) 122,670 111,245(13) STORED WATER FROM OUTSIDE OF DRT (af/y) 15,544 20,719(14) TOTAL OUTFLOW (af/y) 138,214 131,961(15) EVAPORATION LOSSES (af/y) 31,827 26,930(16) DIVERSIONS (af/y) 106,387 105,031(17) RELEASES (af/y) 0 0(18) INFLOWS - OUTFLOWS (af/y) 0 3
(a) For 1144 run, conservation pool simulated as 1144 Jan-Mar; 1145.5 Apr-Oct; 1144 Nov-Dec. (b) All results for yield components reported as annualized average during drought period (total during drought period divided by number of years in drought).
S1 WAM MODEL WITH RIVERWARE INFLOWS AND RIVERWARE GROSS EVAP RATES UTILIZED FOR LAKE KEMP.R3 STANDARD RIVERWARE RESULTS PRESENTED IN TABLE 4.
TABLE 8COMPARISON OF SPECIAL WAM MODEL USING RIVERWARE INFLOWS AND EVAPORATION RATES
2060SEDIMENTATION CONDITIION
WITH STANDARD RIVERWARE MODEL FOR 2060 WITHOUT POOL RAISE
MODEL1144
DESCRIPTION OF RUNS
CONSERVATION ELEVATION (a)
RUN NUMBER
Page 37 of 44
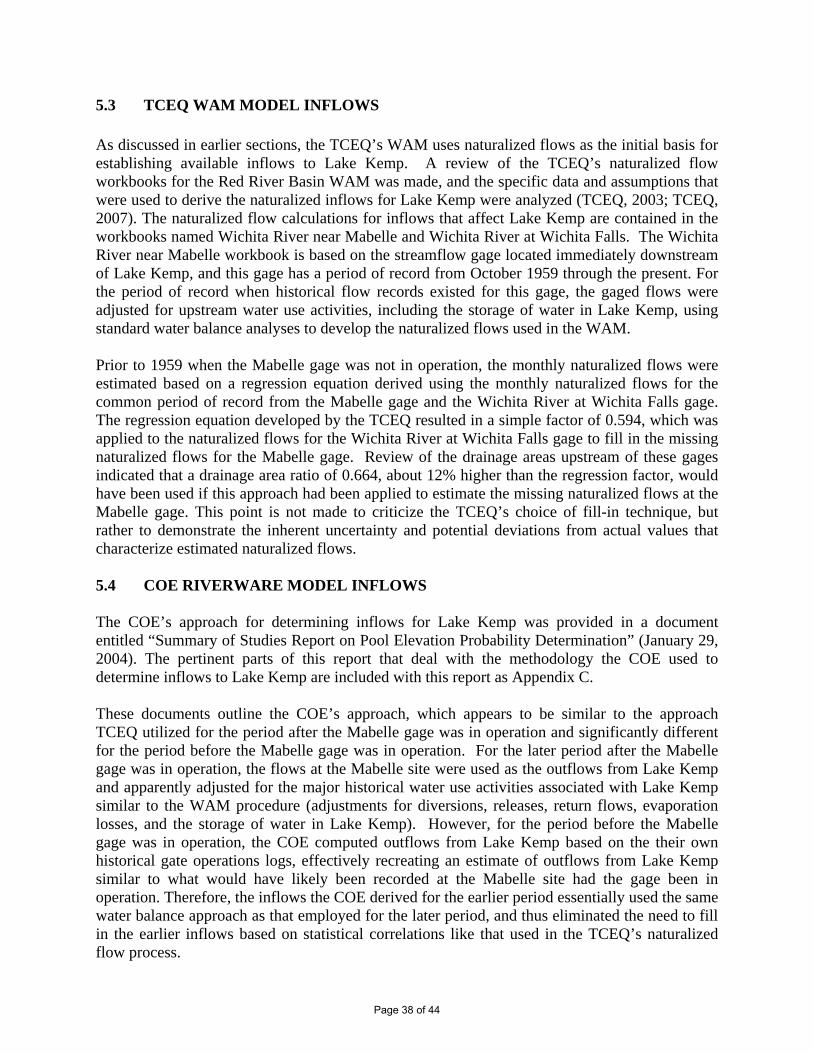
5.3 TCEQ WAM MODEL INFLOWS As discussed in earlier sections, the TCEQ’s WAM uses naturalized flows as the initial basis for establishing available inflows to Lake Kemp. A review of the TCEQ’s naturalized flow workbooks for the Red River Basin WAM was made, and the specific data and assumptions that were used to derive the naturalized inflows for Lake Kemp were analyzed (TCEQ, 2003; TCEQ, 2007). The naturalized flow calculations for inflows that affect Lake Kemp are contained in the workbooks named Wichita River near Mabelle and Wichita River at Wichita Falls. The Wichita River near Mabelle workbook is based on the streamflow gage located immediately downstream of Lake Kemp, and this gage has a period of record from October 1959 through the present. For the period of record when historical flow records existed for this gage, the gaged flows were adjusted for upstream water use activities, including the storage of water in Lake Kemp, using standard water balance analyses to develop the naturalized flows used in the WAM. Prior to 1959 when the Mabelle gage was not in operation, the monthly naturalized flows were estimated based on a regression equation derived using the monthly naturalized flows for the common period of record from the Mabelle gage and the Wichita River at Wichita Falls gage. The regression equation developed by the TCEQ resulted in a simple factor of 0.594, which was applied to the naturalized flows for the Wichita River at Wichita Falls gage to fill in the missing naturalized flows for the Mabelle gage. Review of the drainage areas upstream of these gages indicated that a drainage area ratio of 0.664, about 12% higher than the regression factor, would have been used if this approach had been applied to estimate the missing naturalized flows at the Mabelle gage. This point is not made to criticize the TCEQ’s choice of fill-in technique, but rather to demonstrate the inherent uncertainty and potential deviations from actual values that characterize estimated naturalized flows. 5.4 COE RIVERWARE MODEL INFLOWS The COE’s approach for determining inflows for Lake Kemp was provided in a document entitled “Summary of Studies Report on Pool Elevation Probability Determination” (January 29, 2004). The pertinent parts of this report that deal with the methodology the COE used to determine inflows to Lake Kemp are included with this report as Appendix C. These documents outline the COE’s approach, which appears to be similar to the approach TCEQ utilized for the period after the Mabelle gage was in operation and significantly different for the period before the Mabelle gage was in operation. For the later period after the Mabelle gage was in operation, the flows at the Mabelle site were used as the outflows from Lake Kemp and apparently adjusted for the major historical water use activities associated with Lake Kemp similar to the WAM procedure (adjustments for diversions, releases, return flows, evaporation losses, and the storage of water in Lake Kemp). However, for the period before the Mabelle gage was in operation, the COE computed outflows from Lake Kemp based on the their own historical gate operations logs, effectively recreating an estimate of outflows from Lake Kemp similar to what would have likely been recorded at the Mabelle site had the gage been in operation. Therefore, the inflows the COE derived for the earlier period essentially used the same water balance approach as that employed for the later period, and thus eliminated the need to fill in the earlier inflows based on statistical correlations like that used in the TCEQ’s naturalized flow process.
Page 38 of 44

6.0 OBSERVATIONSANDCONCLUSIONS 6.1 SUMMARY OF FINDINGS As explained in earlier sections of this report, the overall objective of this project was to better understand the basis for the increase in the firm annual yield of Lake Kemp that would be expected if the conservation pool of Lake Kemp was to be raised four feet. In order to answer this question, firm yield determinations have been made without and with the conservation pool elevation increase so that the yield increase attributable to raising the conservation pool could be determined. Analysis of the operation of Lake Kemp under the current (2006) sedimentation condition of the reservoir using both the WAM and the RiverWare model clearly indicates that there is little yield increase to be expected. Assuming a future sedimentation condition for Lake Kemp corresponding to the year 2060 has produced conflicting conclusions based on the yield results from the two models. In depth analysis of the differences between the firm yields produced by the two models for the future 2060 sedimentation condition have suggested that differences in the flows used in the models are the likely cause of the yield discrepancies. The methodology used to develop the Lake Kemp inflows in the WAM relied on a statistical relationship with another inflow dataset to estimate inflows during the early hydrologic period (before 1959), whereas the methodology used by COE for estimating inflows during this period was based on a water balance approach using more localized data for Lake Kemp, which was essentially the same approach used by both entities, for the later portion of the period of record (during and after 1959). Based on the reasons stated above, it is believed that the WAM probably understates the inflows that are likely to occur if the hydrology of the 1950s was to be repeated, and thus, the WAM also likely underestimates the firm annual yield of Lake Kemp under future 2060 sedimentation conditions without the conservation pool elevation increase. This tends to overestimate the effect of raising the conservation pool level on increasing the firm annual yield of the reservoir under future sedimentation conditions. 6.2 RECOMMENDATIONS Based on the above findings, the firm annual yield for Lake Kemp under 2060 sedimentation conditions as determined with the WAM without the conservation pool elevation increase (Run W3) should be disregarded and substituted with the WAM firm yield results that were computed without the inclusion of the 1950s WAM period (Run W4). With this substitution, the firm annual yields of Lake Kemp and the associated increases due to the conservation pool elevation increase are summarized as in Table 9.
Page 39 of 44

6.3 OTHER QUESTIONS POSED BY TWDB Besides determining the firm annual yield of Lake Kemp under the different sedimentation conditions and exploring the reasons for discrepancies in the yield values, another crucial question that was posed in the scope of work for this study was to: “Determine which model most realistically and accurately simulates the System and System’s operation under the Texas Water Right system”. To address this question, it should first be made clear what exactly the “Texas Water Right system” is. The term “Texas Water Right system” refers to the concept known as the prior appropriation doctrine, which establishes the legal priority for using water by water right owners during periods of shortage. With this system, demands for water by senior water rights are satisfied before water is allocated to junior water rights. This concept is often referred to as “first in time, first in right”. The significance of this concept is that when the firm annual yield or other similar water supply information is determined, the quantity of inflows available to a particular water right must be reduced to reflect the full authorized amounts that other water rights with more senior priorities are entitled to divert or impound. The water rights authorizing Lake Kemp, as well as all other water rights in the Red River Basin, are subject to this concept of prior appropriation. Since the WAM itself is specifically structured to implement the prior appropriation doctrine among all water rights within a river basin, it provides an accurate representation of the “Texas Water Right system”. However, Lake Kemp is nearly the most senior water right in the Red River Basin, with no senior water rights located either upstream or downstream. Therefore, the WAM’s representation of the prior appropriation doctrine with regard to Lake Kemp is effectively the same as that reflected in the RiverWare model, i.e., no inflows are passed through Lake Kemp to satisfy downstream water rights. With regard to which model more realistically and accurately represents the system and the system operation, the COE’s RiverWare model, due to its daily time step and the more reasonable approach for computing inflows to Lake Kemp, probably is superior with regard to more accurately representing the operation of the Lake Kemp/Lake Diversion system.
SEDIMENTATION CONDITION
CONSERVATION ELEVATION
FIRM YIELD CRITICAL PERIOD
YIELD INCREASE
FIRM YIELD CRITICAL PERIOD
YIELD INCREASE
1144 114,000 1968-1982 112,119 1975-19821148 114,400 1968-1982 112,329 1973-1982
1144 (a) 104,800 1968-1982 105,062 1975-19821148 113,200 1968-1982 110,699 1968-1982
(a) Reported Firm Yield Calculated Without Consideration of 1950's Period.
WAM RIVERWARE
TABLE 9FINAL FIRM ANNUAL YIELD OF LAKE KEMP
2006 400 210
2060 8,400 5,637
Page 40 of 44

6.4 COMPARISONS WITH REGION B RESULTS Information from the Initially Prepared Region B Regional Water Plan, dated March 2010, was provided by TWDB (TWDB, 2010). Firm yield information from Chapter 3 (Supplies) and future water strategy information contained in Chapter 4 for this document was reviewed and examined. Table 10 compares firm yield results from the referenced Region B plan with corresponding yield estimates derived in this study.
Page 41 of 44

(1) (2) (3) (4) (5) (6) (7) (8)
SEDIMEMENTATION CONDITION
CONSERVATION ELEVATION
CRITITCAL PERIOD FIRM YIELD CRITITCAL
PERIOD FIRM YIELD CRITITCAL PERIOD FIRM YIELD
(1) CURRENT 1144 1950'S 112,300 UNKNOWN 105,000 NA NA
(2) 2060 1144 1950'S 77,400 UNKNOWN 78,400 1950'S NA
(3) 2060 1148 1950'S 106,700 UNKNOWN 103,200 1950'S NA
(4) APPARENT INCREASE DUE TO POOL RAISE BASED ON 1950'S 29,300 24,800 NA
(5) 2060 1144 1980'S 114,800 UNKNOWN 78,400 1980'S 105,600
(6) 2060 1148 1980'S 121,500 UNKNOWN 103,200 1980'S 109,600
(7) APPARENT INCREASE DUE TO POOL RAISE BASED ON 1980'S 6,700 24,800 4,000
SPECIAL WAM RUN SOLELY FOR THE PURPOSES OF DETERMINING YIELD WITHOUT CONSIDERING 1950'S PERIOD.SPECIAL WAM RUN USING INFLOWS AND EVAPORATION RATES FROM COE'S RIVERWARE MODEL AS INPUTS TO WAM MODEL
WAM MODEL
CURRENT CONDITIONS (KRC = 2006; REGION B = 2000)
units are acre-feet per year
FUTURE CONDITIONS (KRC = 2060; REGION B = 2060)
TABLE 10COMPARISON OF FIRM ANNUAL YIELD RESULTS WITH REGION B RESULTS
KRC ANALYSIS REGION B PLAN KRC ANALYSIS
WAM MODEL USING INFLOWS AND EVAPORATION RATES FROM
RIVERWARE MODEL
LAKE KEMP / LAKE DIVERSION SYSTEM
Page 42 of 44

Note that several of the yield values from the current study (denoted as shaded areas) were generated in an effort to be able to make additional comparisons for results defined by common critical drought periods. In addition, similar to the approach discussed in Section 5.2, an alternative version of the WAM model was constructed using the Lake Kemp / Lake Diversion system configuration details discussed in section 3.4 but with the WAM’s inflows and evaporation rates changed to the evaporation rates and inflows associated with Lake Kemp and Lake Diversion from the RiverWare model. For the 2060 condition the firm annual yield of the Lake Kemp / Lake Diversion system was determined without and with the pool raise in effect using this alternative version of WAM. Columns 3 and 4 include yield results from this study, which are compared to corresponding results presented in the Region B plan (columns 5 and 6) for the Lake Kemp/Lake Diversion system. Rows 2 through 4 contain results directly comparable results with the Region B results for 2060. In addition, rows 5 through 7 contain alternate comparisons with columns 3 and 4 based on the assumption that the 1980s drought period, rather than the 1950s drought, is the critical period that defines yield, which is consistent with the yield results from the COE’s RiverWare model for Lake Kemp as a standalone reservoir. Columns 7 and 8 contain the firm yield results derived with the alternative WAM model described above which uses RiverWare inflows and evaporation rates in place of those contained in the regular WAM model. Although results from a pure RiverWare model simulating the Lake Kemp/Diversion Lake system was not available, the exercise described in Section 5.2 appears to suggest that the use of the WAM model with RiverWare inflows and evaporation rates can provide insights on what actual RiverWare results would likely be. As can be seen by comparing the yield increase estimates from rows 4 through 7 for the various models, the 1950s inflow issue discussed previously has a significant influence on the magnitude of the additional yield that would be expected by raising the conservation pool elevation of Lake Kemp four feet. Simply comparing the yield result for the same WAM model conditions in Table 10 demonstrates that the yield is 48% higher (114,800 verses 77,400 in the without pool raise condition case) and 13.9% higher (121,500 verses 106,700 in the with pool raise condition) depending on whether or not the existing 1950’s period WAM inflows are allowed to constrain the firm yield results. This demonstrates that if the WAM inflows were revised as discussed in Section 5.3 and the revisions resulted in the WAM inflows being consistent with the RiverWare inflows for the earlier period, the majority of the yield increase would be attributable to the inflow adjustment for the earlier period rather than the increase in the conservation pool elevation.
Page 43 of 44

7.0 REFERENCES Texas Water Development Board (TWDB). 2006 Volumetric Survey, Lake Kemp.
Freese and Nichols (FNI), spreadsheet named “JSA Kemp Pool Raise SVSA”. August 2010.
Center for Advanced Decision Support for Water and Environmental Systems (CADSWES). Single Reservoir Yield Study – Instructions to Convert and Existing Model – Draft. August 2007.
Freese and Nichols (FNI), Draft Document Entitled “Revised Yields of Lakes Kemp and Diversion”. December 10, 2009.
U.S Army Corps of Engineers (COE), Lake Kemp, Wichita River, Texas. Summary of Studies Report on Pool Elevation Probability Determination. January 29. 2004.
Texas Commission of Environmental Quality (TCEQ), memo entitled “Red River Updates”. June 23, 2003.
Texas Commission of Environmental Quality (TCEQ), memo entitled “Inflow to Red River Changes”. February 7, 2007.
Texas Water Development Board (TWDB). Initially Prepared Region B Regional Water Plan. 2010.
Page 44 of 44

APPENDIX A TWDB Summary of Yield Discrepancy
• TWDB and USCOE have computed the firm yields of the Lake Kemp/Diversion
Lake System (the System) using TCEQ’s Water Availability Model (WAM) and USCOE’s SUPER RiverWare models, respectively, by setting the top of the conservation pool (TOP) at 1144 feet and 1148 feet above mean sea level. Based on their analyses, TWDB has concluded that raising the TOP from 1144 feet to 1148 feet results in a noticeable increase of the firm yield of the System, while USCOE concluded that there is a negligible increase in firm yield.
• Staff of the two agencies have compared the two models and found differences
between the two models discussed in Appendix B.
• Staff of the two agencies are seeking to resolve the difference in estimating the effect of the TOP level to the firm yield.

APPENDIX B TWDB Summary of Potential Reasons for Yield Discrepancy
• The effect of raising TOP on the firm yield of the system from 1144 feet to 1148 feet was estimated to be greater when using the WAM model than when using RiverWare/Super. The difference is likely due to the following:
o WAM is a monthly model while RiverWare/Super is a daily model. o The WAM period of record is 1948-1998, while the Riverware/Super
period of record is 1924-2002. o Inflows in WAM are “naturalized” while RiverWare/Super develops
inflow from observed storage, outflow, and evaporation. o RiverWare inflow is greater than WAM naturalized flow. o WAM uses net evaporation, while RiverWare/Super uses gross
evaporation. o WAM does not model any use of the flood pool while RiverWare/SUPER
models both conservation and flood operations. o WAM models water withdrawals along the rivers based on all water rights
while RiverWare/Super models only larger withdrawals which can be quantified on a regular basis.

APPENDIX C
Excerpt from COE’s Documentation Pertaining to Methodology
used to Determine Inflows for Lake Kemp
TABLE 2 Daily Hydrologic Records Summary
Station Name USGS
Station ID USGS
Parameter ID Drainage
Area (sq-mi) Period of
Available Data Data Description
Lake Kemp nr Mabelle, TX 07312000 00054 2086 JAN 1924 -
SEP 2002 USGS contents record based on converting
observed stage to storage Wichita River nr Mabelle, TX 07312100 00060 2086 OCT 1959 –
DEC 2002 USGS gauged outflow
from Lake Kemp Wichita River nr Mabelle, TX 07312100 CORPQ 2086 JAN 1924 –
SEP 1959 USACE determined
outflow from Lake Kemp from gate operation logs
South Side Canal nr Dundee, TX 07312110 00060 - OCT 1971 – DEC 2002
USGS gauged diversions from Lake Diversion
Wichita River at Wichita Falls, TX 07312500 00060 3140 APR 1938 – DEC 2002
USGS gauged stream flow

APPENDIX D
TWDB Comments to the Final Draft Report (with KRC’s Responses)
Review of Lake Kemp Firm Yield Analysis
By: Kennedy Resource Company in Association with R.J. Brandes Consulting
Contract number #1000011065
TWDB comments to the final draft report
The overall goal of this study was to identify the causes led to the modeling differences on Lake Kemp firm yield computed by two models - TCEQ’s WAM and USCOE’s RiverWare models and resolve the modeling difference if possible. The report is well written and satisfies all the contract requirements. Specific comments from reviewers are listed below:
Appendix A. Comments from Reviewer 1 1. In Table 7, explain what S1 scenario is. The S1 firm yield numbers have not appeared
before. Table 7 was inadvertently introduced and described as Table 6 in Section 5.2 of the report. Based on other comments from TWDB, many of the tables and figures will be renumbered (see KRC resonse to comment # 28). The text in section 5.2 will be corrected to properly refer to the appropriate Table of results.
2. In Table 10, explain why yields in columns #4 and #6, raw #5 and #6 are so different with the same critical period. First, the information in column 6 came from the Region B report, which did not provide specific details as to the critical period in which the results were based upon, thus it cannot be concluded that columns #4 and #6, rows#5 and rows#6 all have the same critical period. Second, the assumptions in the Region B report were not reviewed as part of this study; instead, the results were simply compared with those determined with this study. In general, the purpose of the information in this table is to provide insights to the Firm Yield results without and with excluding the 1950’s
period so that the combined influence of the 1950’s WAM inflows and reservoir capacity could be better understood.
3. The firm yield increase by WAM due to the pool raise is still quite greater than by RiverWare
4. even when the same inflow data are used in both models. Response for Comments 3 and 4. If the same critical period is used to constrain the firm yield results in both WAM and RiverWare models, the yield increase determined with the WAM model for the Lake Kemp Standalone configuration is higher, but not significantly higher (per TABLE 9 for 2060, 8,400 af/y increase in WAM verses 5,637 af/y increase in RiverWare = 2,763 af/y more with WAM) . The yield increase for the Lake Kemp/Lake Diversion configuration, again is higher with WAM, but not significantly higher (per TABLE 10 for 2060, 6,700 af/y increase in WAM verses 4,000 af/y increase in RiverWare = 2,700 af/y more with WAM) . If the critical period constraining the firm yield results between the without pool raise and with pool raise cases are allowed to change in the WAM model results, the WAM results show a significantly larger increase. However, further analysis of this issue in the study indicate that the inflows during the 1950’s period are significantly different between the WAM and RiverWare models and thus the large increase in yield between the without pool raise case to the with pool raise case for the WAM results are have more to do with the different hydrologic inputs between the two models rather than impact of raising the conservation pool.
5. Per USCOE memo, USCOE’s RiverWare resulted minor firm yield increase due to the pool raise under both 2008 and 2072 conditions (see below). 1144 1148 FY Increase 2008 FY = 112,027 FY = 112,222 195 Capacity = 253,513
ac-ft Capacity = 310,019 ac-ft
2072 111,426 111,556 130 Capacity = 205,384
ac-ft Capacity = 257,225 ac-ft
Explain why your RiverWare runs resulted in greater firm yield increase. The reason for the different results is likely because the above results were computed with different sedimentation conditions, including sedimentation conditions for different points in the future (current study was for conditions from 2006 to 2060). Without more specific information regarding the details of what the

USCOE specified in these runs, it is not possible to positively answer the question. However, it is noted that the increase in capacity as a result of the pool raise in 2060 for this reports analysis was 82,201 acre-feet whereas the USCOE memo indicates their results were based on an increase in capacity of only 56,506 acre-feet, approximately 69% of the capacity increase agreed upon for this study.
Appendix B. Comments from Reviewer 2 1. It would be more user friendly if the tables and charts fell within the body of the report.
The tables and figures will be resized and placed in the report body. Appendix C. Comments from Reviewer 3
REQUIRED CHANGES
1. P. 9, par. 3 – The last sentence suggests that “only activities occurring within this period influence the firm annual yield”, referring to the critical period. Yet, large demands or low flows preceding this period can actually influence when this period occurs as pointed out later in the report, so this indirectly then affects firm yield. Please clarify this point.
This statement was intended to provide general insight to firm yield determination for a single model representation and was not intended to apply to making comparisons of firm yield results between different models with different inputs. This concept is clarified later in the report.
2. P. 10, Table 1 – The table refers to “water remaining in storage at end of drought”, yet in a firm yield analysis this by definition should be zero. Is this a model or modeling artifact? Please clarify this point.
Acknowledged; theoretically, the minimum water remaining in storage in a firm yield run should be exactly zero. However, due to the iterative nature of how firm annual yield is determined, this is nearly impossible to obtain as a practical matter. Therefore, yes, amount of water remaining in storage at the end of the critical period is an artifact of the model simulation technique and the thus the note in Table 1 specifies how this remaining water is to be excluded from the total amount of water that would otherwise be considered as depleted during the critical period.
3. P. 26, par. 3 – Please indicate whether were tests run to show whether increasing TCEQ’s flows by 12% prior to 1959 would have resulted in a better match to the COE hydrology, and in a better match to RiverWare firm yield.
Yes, initial efforts were made to determine how increasing the naturalized flows in WAM 12% during the period before 1959 would affect the firm annual yield results for Lake Kemp from the WAM model. These initial test resulted in the WAM model yield for the

2060 without pool raise condition increasing by about 5.2% (from 85,200 to 90,300 af/y), still far below the 1980’s based yield for the same scenario in Riverware.
4. P. 28, par. 4 – Please indicate whether disregarding WAM Run W3 and replacing with Run W4 is equivalent to modifying the TCEQ hydrology prior to 1959 as suggested in Section 5.3, and whether repeating Run W3 with the modified hydrology is an alternative recommenation.
Disregarding WAM Run W3 and replacing it with WAM Run W4 is equivalent to modifying the TCEQ hydrology prior to 1959 such that the critical drought period constraining the firm annual yield is no longer the 1950’s. This was accomplished in the WAM Run4 model (for illustration purposes) by simply not considering the 1950’s period in the determination of firm yield. Section 5.3 and other portions of the report point out that the difference in hydrology for the period before the 1959 period was the main reason for the difference in yield results between RiverWare and WAM. Accordingly, if TCEQ’s approach for developing the earlier hydrology was the same as that of the COE’s (based on the same observed information the COE used) it would appear that that a revised WAM Run3 would produce the same firm yield results as the current WAM Run4 results.
SUGGESTED CHANGES
1. P. 7, par. 2 – PR “Coe” with “COE”. 2. P. 8, par. 2 – PR “possible of reasons” with “of possible reasons”. 3. P 9, par. 3 – PR “annul” with “annual”. 4. P. 10, par. 2 – PR “,,” with “,”. 5. P. 12, par. 1 – PR “utilzes” with “utilizes”. 6. P. 22, heading – PR “DEFFERENCES” with “DIFFERENCES”. 7. P. 25, par. 1, last sentence – PR “are generally lower” with “are generally slightly lower”. 8. P. 26, par. 3 – PR “..” with “.”. 9. Tables 3, 4, 5, 6, 7, 10 – Please indicate the units (acre-feet/year ?) used in the table. 10. Figure 2 – Please note in the heading or a footnote that the “Altered WAM” uses
RiverWare inflows and evaporation. All of the above are agreed and will be corrected. Appendix D. Comments from Reviewer 4
1. The report seems only to demonstrate that the WAM can be modified to reflect operational results from a model such as Riverware. As the report notes, the two models are created for different purposes, using different assumptions. Riverware is intended as a daily operational model and WAM is intended to determine water availability for water rights permits. Therefore, the relative accuracy of one model or the other depends entirely

upon the intended use of the model, and the underlying assumptions embodied in the model’s data set, that support that particular model use.
Acknowledged.
2. The “Texas Water Rights System” is reflected by both the application of the prior
appropriation doctrine and consideration of all basin water rights at their fully authorized amounts under the terms and conditions of those water rights. A model that does not reflect the terms and conditions of a water rights permit cannot be said to be representative of the “Texas Water Rights System”.
Agreed. However, the comment in the section of the report the reader appears to be referring to is written in the context of Lake Kemp and Lake Diversion only, not other water rights in the basin. Since Lake Kemp and Lake Diversion are almost the oldest water rights in the Red River Basin and do not have any senior water rights upstream or downstream, all waters that reach their locations can be impounded and utilized in WAM with no requirement to pass inflows to other water rights, which is the way the RiverWare model is setup to operate. Accordingly, both WAM and RiverWare models for Lake Kemp impound and use all waters reaching their locations in the same fashion, which is the way the models were analyzed and was the intent of the description in this section of the report. In order to make the overall meaning of the last paragraph better reflect these issues, and not imply that RiverWare represents the Texas Water Rights System, it is suggested that the sentence stating that both models effectively represent the Texas Water Rights System be struck. Appendix E. Comments from Reviewer 5
1. In Executive Summary, 2nd paragraph, 2nd sentence – add “Previous analyses conducted by the TWDB and COE arrived at conflicting results, with the TWDB, through the regional planning process, concluding that a significant increase in yield would be realized …”
2. In Table of Contents, 2.5.2 – should be “Demand Pattern for Lake Kemp Diversions”.
3. In Table of Contents, 3.3 – should be “LAKE KEMP STANDALONE YIELD INCREASE”.
4. In Table of Contents, 3.3.2 – page number should be 20.
5. In Table of Contents, 3.4 – page number should be 20.
6. In Table of Contents, 5.2 – spacing/formatting is off. Looks like WORD may be trying to center line.

7. Table of Contents, REFERENCES – just noting that these were not in this document.
8. Table of Contents, List Of Tables, Table 1 - should be “Factors Affecting Firm Annual Yield Results”.
9. Table of Contents, List of Tables, Table 2 – Name should be consistent with actual table.
10. Table of Contents, List of Tables, Table 7 – should be Comparison of Special WAM Model.
11. Table of Contents, List of Tables, Table 8 – should be “Estimated Monthly Flow Generated by Historic Rainfall on Lake Kemp”.
12. Table of Contents, List of Tables, Table 10 – should be “Comparison of Firm Annual Yield Results with Region B Results”.
Items 1-12 Acknowledged and agreed.
13. Section 1.1 BACKGROUND, paragraph 2 – “Through its Tulsa District Office, the U. S. Army Corps of Engineers (COE) operates Lake Kemp and Lake Diversion as a system for flood control and water supply purposes.” Note that Lake Kemp is owned and operated by the City of Wichita Falls, Texas and the Wichita County Water Improvement District No. 2. Under the provisions of section 7 of the Flood Control Act of 1944, the Secretary of the army prescribes regulations for the use of storage allocated for flood control or navigation at all reservoirs constructed wholly or in part with Federal funds provided on the basis of such purposes. Therefore, the Corps manages only the flood control storage under Section 7 authorization. In sentence 2, change “The Coe uses Lake Kemp has a seasonally varying conservation pool…”. In sentence 3 change ”Since the COE operates the Lake Kemp flood control pool,and Lake Diversion as a system,…. ”
Agreed
14. Section 1.1 BACKGROUND, paragraph 3, 2nd sentence – reference should be 2007 Region B Plan.
Agreed
15. Section 1.2 STUDY OBJECTIVES, paragraph 2, 1st sentence –reference Appendix B after discussing the list of possible reasons for the discrepancies in the firm yield estimates. Then in last sentence, discrepancies are addressed in chapters 4 & 5.
Agreed

16. Section 2.1 FIRM ANNUAL YIELD, paragraph 3, sentence 4 – Change “Once this process has been completed, the resulting annual demand is deemed to be firm annual firm yield of the reservoir,…”. In last sentence of paragraph, change annul to annual.
Agreed
17. Section 2.1 FIRM ANNUAL YIELD, paragraph 5, last sentence – remove extra comma after “In effect,,”.
Agreed
18. Section 2.3 COE RIVERWARE MODEL, 1st paragraph, last sentence – delete sentence. Not really needed. (Riverware is used to simulate behavior of the conservation and flood pool operations,not just water supply and flood control. And also, different divisions and districts use various models for systems operations within the COE. While RiverWare has been approved and is and available across the COE for use, it has only been used by a limited number of offices at this point.)
Acknowleged and agreed
19. Section 2.4.1 Current Sedimentation Conditions, paragraph 2 – spelling error in 2nd sentence, annul should be annual.
Agreed
20. Section 2.4.2, 2nd sentence – add words as follows “One scenario was analyzed to represent the conditions without the conservation pool level of the reservoir raised four feet and the other analyzed to represent the condition with the conservation pool level raised four feet. “
Agreed
21. For the 2060 sediment condition with the pool raise, does some amount of sedimentation occur between 2006 and 2020? Or does sedimentation only occur after 2020? Just an observation, as expected, there is variation from the COE 2060 sediment projections.
All sedimentation relationships were provided by TWDB staff based on the reservoir sedimentation estimation work done by TWDB’s Region B consultant and not re-developed by the study. Based on review of information in the Region B consultant’s files, sedimentation occurred in Lake Kemp based on Lake Kemp being operated at the 1144 conservation elevation until the year 2020, at which time Lake Kemp was operated at the higher conservation elevation (1148) up to the year 2060. The variations between the sedimentation conditions used in this study and the COE’s estimates are to be expected because the COE’s future condition was for the year 2072 and also because it is not clear in what year they represented Lake Kemp as being operated at the higher elevation.
22. Section 2.5.1 - 1st sentence , use” utilize” instead of “engage”; change “month” to “time”. 2nd sentence, easier to visualize seasonal pool description from Jan-Dec. Descriptions at the end of section should also describe seasonal pools from Jan-Dec. Also, in final sentence of the first paragraph, shouldn’t “several” be “2” rule curves? In 2nd scenario description at end of section, operating level should be 5 instead of 9. In 2nd scenario description at end of section, why use 1148.2 and 1148.49 instead of 1148 and 1149.5?
First part of comments are acknowledged and accepted. As for comment regarding 2 rule curves, there are many operating rule curves offered as options in the RiverWare model and this reference was made to prepare the reader later in the document where it is explained that operating rules 5 and 9 were used in all of this studies’ analysis. In addition, the reason 1148.2 and 11.48.49 were defined on page 15 of the report was simply because these are the exact elevations of the operating rule levels in the Riverware model that are closest to 1148. It was rationalized that it would be easier to simply adopt the rules (with their exact elevations) already in RiverWare and use them in WAM.
23. Section 3.0, 3rd sentence – should be “each of the firm yield component have been quantified and averaged”
24. Section 3.1, 3rd sentence – change “These values represent the sum of the simulated results for of each quantity”
25. Section 3.2.2 – 5,636 acre-feet should be 5,637 ac-ft to be consistent with Table 9.
Agreed.
26. Section 4.1 – At end of discussion there is a reference to Section 5.2. This should be 5.1.
Agreed.

27. Section 5.1 – Change “The COE used gross evaporation rates (observed evaporation without any precipitation adjustment) to calculate historical evaporation losses from Lake Kemp, and did not account for any precipitation inflows across the reservoir surface in its water balance calculations, which means that the COE’s calculated inflows have the precipitation inflows embedded in them” to “The COE used gross evaporation rates (observed evaporation without any precipitation adjustment) to calculate historical evaporation losses from Lake Kemp, and precipitation on the lake is accounted for in the total inflows into the lake.” It is incorrect to say that the COE did not account for any precipitation inflows across the reservoir surface area in its water balance calculations. The remaining portion of paragraph on page 24 should be reworded with much of it being cut out. Rewording such as “A direct comparison of the reservoir element mass balance, in particular the inflows, evaporation, and precipitation, is not possible because of the different approaches of the WAM and RiverWare models” may be needed.
This following re-write of the sentence the reviewer objects to is suggested:
The COE used gross evaporation rates (observed evaporation without any precipitation adjustment) to calculate historical evaporation losses from Lake Kemp and did not account for (subtract away) precipitation inflows across the reservoir surface in its water balance calculations, which means that the COE’s calculated inflows have the precipitation inflows embedded in them.
28. Section 5.1, top of page 25 – In paragraph there is reference to Table 8, yet Table 7 is not referenced anywhere in text of the report. It is easier for the reader to follow the report if references to tables and figures and their numbering are in order and sequential throughout the report. Figures 3 and 4 are referenced before Figures 1 and 2 (Section 5.2). Noticed most but not all tables and figures are placed in the back of the report. They should all either be in the back or all spread out through report as referenced in text. Too confusing otherwise.
First, In Section 5.2, the reference made to Table 6 was in error and should have made reference to Table 7, which was never introduced in the text of the draft report. The numbering of tables out of order of report occurrence is acknowledged and appoligized for. The following renaming of Tables and Figures are suggested to address this issue:
Tables 1 thru 6; no change.
Current Table 7 (inadvertently not introduced in the text); rename as Table 8.
Current Table 8: rename as Table 7.
Tables 9 thur 10; no change.

Current Figures 1 and 2; renamed as Figures 3 and 4.
Current Figures 3 and 4; renamed as Figures 1 and 2.
29. Section 5.4 – It is stated that Appendix C contains documentation on the methodology used by the COE to develop inflows into Lake Kamp. However, Appendix C only contains a listing of source data and the associated period of record. It does not include any discussion of methodology, any EAC tables used, etc.
The information in Appendix C was the only written reference describing how the COE that developed their inflows for Lake Kemp. Although the information does appear to be minimal, it does clearly state that the pre-1959 flows were developed using “outflow from Lake Kemp from gate operation logs” and this information was verified by telephone discussion with COE staff.
30. Table 9 – need note for WAM condition, year 2060, elevation 1144, stating this is by-passing 1950’s drought. Need to include units for firm yield and yield increase.
Agreed.
31. Section 6.4, paragraph 2 – change “Columns 7 an 8” to “Columns 7 and 8”.
Agreed.
32. Section 6.4, paragraph 2, last sentence – capitalize Section 5.2 and change “the use of the WAM model with RiverWare inflows and evaporation rates can be provide insights”.
Agreed.
33. Section 6.4, paragraph 3 – states that the 1950’s inflow issue has a significant influence on the magnitude of the additional yield. May want to address change based on a percentage. For 1144 pool condition, yield difference was 77,400 vs 114,800 ac-ft/yr which is a 48.3% difference and for 1148 condition, yield difference was 106,700 vs 121,500 ac-ft/yr which is 13.9% difference. This may help reader quantify difference between using the 1950’s drought versus the 1980’s drought, as the critical drought. It does have a huge impact, especially for 1144 conditions.
Acknowledged. It is suggested the identified paragraph be re-worded as follows:

As can be seen by comparing the yield increase estimates from rows 4 through 7 for the various models, the 1950s inflow issue discussed previously has a significant influence on the magnitude of the additional yield that would be expected by raising the conservation pool elevation of Lake Kemp four feet. Simply comparing the yield result for the same WAM model conditions in Table 10 demonstrates that the yield is 48% higher (114,800 verses 77,400 in the without pool raise condition case) and 13.9% higher (121,500 verses 106,700 in the with pool raise condition) depending on whether or not the existing 1950’s period WAM inflows are allowed to constrain the firm yield results. This demonstrates that if the WAM inflows were revised as discussed in Section 5.3 and the revisions resulted in the WAM inflows being consistent with the RiverWare inflows for the earlier period, the majority of the yield increase would be attributable to the inflow adjustment for the earlier period rather than the increase in the conservation pool elevation.
34. Table 3 showing WAM results – need units for yield, elevation, volume etc. Under description of runs, for 2060 conditions, are isolation pools assumed to be hydraulically connected to main body of Lake Kemp? Recommend in note (a) to describe times of seasonal pool from Jan-Dec. May want to show yield components for critical drought as average annual values. Just an observation but, noticed that the inflows and outflows were for the same for all conditions. This seemed somewhat strange, matching exactly. See system summary in Table 5. Would expect some variation.
Units will be added and operating rule guide will be re-worded in terms of January to December. The isolation pools were not represented in any of the 2060 sedimentation conditions runs because it was determined that they did not make any measurable difference in yield based on the 2006 analysis without and with their representation. With regard to the inflows and outflows for the various runs in Table 3, these values expected to be exactly the same for each run. The inflows are defined by the critical period of each respective run and the outflows are an accounting of all of the water that is consumed by the various components affecting yield during the critical period, which are categorized in rows 15-17 of the table. Note that once the units are added to the Tables, this might have been more clear. The concept being demonstrated here is that there is a total amount of water available during each model’s critical period, this quantity being the total inflows during the critical period plus the capacity of the reservoir, since the reservoir is full at the beginning of the critical period (by definition of critical period). After the yield has been determined by iterating the demand until all water is utilized during the critical period, an accounting of all outflows from the reservoir should equal the quantity of inflows to the reservoir.
35. Table 4 showing RiverWare results – same as shown in comments for Table 3 units, run descriptions and note (a). For 2060 condition, 1148 pool, total outflow does not equal evaporation losses + releases. It was strange that inflows exactly match outflows.

Comment about inflows = outflows is addressed above (#34). With regard to comment about total outflows not equaling evaporation losses plus releases, total outflows should equal the sum of diversions, evap losses and releases for the critical period. Checking the information presented in column 4 of Table 4 verify this.
36. Table 5 showing WAM system results - same as shown in comments for Table 3 units, run descriptions and note (a).
Agreed
37. Table 6 – Specifiy units. Need to list Run numbers. Section 5.2 states that runs were S1 for WAM and R3 for RiverWare. Numbers for RiverWare do not match those seen in Table 4, run R3. May need more notes to make conditions more understandable. S1 includes RiverWare inflows and evaporation. This could be noted in table.
This should be clarified with the renaming described in response to comment #28.
38. Table 7 - same as shown in comments for Table 3 units, run descriptions and note (a). Should note S1 includes RiverWare inflows and evaporation.
Agreed
39. Table 10 – Specify units.
Agreed
40. Figure 1 – List runs W3, R3
Agreed
41. Figure 2 – List runs S1, R3
Agreed
42. Appendix A – Need title as shown in Table of Contents.
Agreed
43.
44. Appendix B - Need title as shown in Table of Contents.

Agreed
45. Appendix C – Title should be consistent with Table of Contents. See comment 30.
Agreed
46. Note – unless the same model and conditions (top of Conservation and seasonal pool, sediment conditions, inflow, evaporation, etc) are adopted for yield analysis, there will still be some variation in yield. It does appear that with similar inflows, evaporation, and critical drought, the models should produce similar results.
Acknowledged
47. Concurred with findings. Kennedy Resources did an excellent job of analyzing models and differences. Because of the number of model differences or variables, the analysis was complex. Kennedy Resources did a good job of determining and explaining which differences made the greatest impact to yield determinations.
Thanks. Sorry for the confusion brought about by misnamed tables and omission of units. The comments were very constructive and helpful and will result in a greatly improved final report.