lake texana...lake texana was surveyed in 1991 to compile field data needed to compute the reservoir...
TRANSCRIPT
LAKE TEXANA
1991 Sedimentation Survey
Operated byLavaca-Navidad River AuthorityEdna, Texas
United States Department of the InteriorBureau of Reclamation

7-2090 (4-81>Furp.tj of RectamRtion TECHNICAL REPORT STANDARD TITLE PAGE
1. REPORT ro. AC ESCtD, 3. RECIPIENTS CATALOG .
4. TITLE AJ\O SLUTITLE 5. REPORT DATE
December 1991Texana - 1991 Sedimentation SurveL k ya e PERFORMIIJ3 ORGANIZATlT'J COGE6 .
7. AUTF3R(S) 8. PERFORMIF'83 OPOANI2ATICIJREPORT M).
James 0. Blanton III and Ronald L. Ferrari
9. PERFORMINI3 ORGANIZATIctl NAME AND ACORESS 10. WOI< U'IIT O.
Bureau of ReclamationDenver Office
______________________________11. CCXJTRACT OR GRANT M).
Denver, Colorado ______________________________13. TYPE OF REPORT At'U PERICID COVERED
12. SPCI'JSORIN3 AGENCY NAME Ar'C ALORESS
Same
14. SPIISORIN3 AGENCY CGOE
15. SUPPLEMENTARY N.KJTES
Microfiche and/or hard copy available at the Denver Office, Denver, Colorado, Ed:RNW
16. ABSTRACT
Lake Texana was surveyed in 1991 to compile field data needed to compute the reservoircapacity. The data were also used to compute the volume of sediments that had accumulated inthe reservoir since storage began in May 1980. Sonic depth recording equipment and electronicdistance measuring equipment were used to run the bathymetric survey. Reservoir capacity wascomputed based on surface areas determined by a width adjustment method.
The capacity of the reservoir at elevation 44.0 is now 163,506 and the surface area is 10,134 acres.Since 1980, sediments accumulated to a volume of 3,787 acre-feet, which represents 2.3-percentloss of reservoir capacity.
17. KEY WOPOS At'1D (YJCUMENT ANALYSIS
a. DE$CR / PTORS-- /*reservoir silting/sedimentation/*reservoir surveys/reservoir capacity/*area capacity curves /*sediment distribution/sonar/sediment yield /
b. / DENT/Fl ERS-- /reservoir area/range lines/sedimentation surveys/Lake Texana, Texas
c. COSAT/ Fiald/Gi-oup OSH COWRR: 0808 SRIM:¶8. DISTPIBUTIc STATEMENt 19. SECURITY CLASS 21. MD. OF PAGES
ITHIS REPORT)Qailab/e from th Natio,,a/ Tec/,n,cal loformation gervic, Operf ions UNCLQSSIFIEDDivision, 5285 Port Royal Road, Springfield, Virginia 22151. 20. SECURITY CLASS 22. PRICE
(Microfiche and/or hard copy available from NTIS) ED
LAKE TEXANA1991 SEDIMENTATION SURVEY
by
James 0. Blanton III
and
Ronald L. Ferrari
United States Department of the InteriorBureau of Reclamation
Denver OfficeDivision of Earth Sciences
Surface Water BranchSedimentation Section
Denver, Colorado
December 1992

ACKNOWLEDGEMENTS
The Bureau of Reclamation prepared and published this report. The hydrographic surveywas supervised by Ronald Ferrari, Hydraulic Engineer of the Denver Office, assisted byDelbert Smith in the Denver Office. Personnel from the Lavaca-Navidad River Authority,Edna, Texas, completed the preliminary field work and assisted in the hydrographic survey.Robert I. Strand, Head, Sedimentation Section and James 0. Blanton III, Hydraulic Engineerin the Sedimentation Section consulted in the sediment computations and preparation of thereport.
MISSION STATEMENTS
As the Nation's principal conservation agency, the Department of the Interior hasresponsibility for most of our nationally-owned public lands and natural and culturalresources. This includes fostering wise use of our land and water resources, protectingour fish and wildlife, preserving the environmental and cultural values of our nationalparks and historical places, and providing for the enjoyment of life through outdoorrecreation. The Department assesses our energy and mineral resources and works toassure that their development is in the best interests of all our people. The Departmentalso promotes the goals of the Take Pride in America campaign by encouragingstewardship and citizen responsibility for the public lands and promoting citizenparticipation in their care. The Department also has a major responsibility forAmerican Indian Reservation Communities and for people who live in IslandTerritories under U.S. Administration.
The mission of the Bureau of Reclamation is to manage, develop, and protect water andrelated resources in an environmentally and economically sound manner in the interestof the American public.
The information contained in this report regarding commercial products or firms may not be used foradvertising or promotional purposes and is not to be construed as an endorsement of any product orfirm by the Bureau of Reclamation.
CONTENTS
..........................................................
...............................................
....................................................
..............................................................
...........................................................................................
...........................................
..............................................................................................................................................
.....................................................
..................................................................................
..............................................
..........................................................
.....................................................................
....................................
.................................................
......................
............................................
...........................................
....................................
Page
Introduction i
Summary and Conclusions 2
Description of Basin 2
Surveys 3Survey History 3Survey Methods and Equipment 3
Reservoir Sediment Distribution 4Longitudinal Distribution 4Lateral Distribution 4Depth Distribution 5
Sediment Analyses 5Sediment Accumulation 5Reservoir Sedimentation Summary 6
Reservoir Area and Capacity 6
Bibliography 8
Tables
Table
I Reservoir sediment summary 92 Lake Texana sediment distribution 113 Summary of 1991 survey results and sediment
distribution computations 12
Figures
Figure
I Vicinity map 132 General plan and sections of dam and spifiway 143 Drainage area map 154 Lake Texana inflows 165 Sediment range location map 17
111

CONTENTS - Continued
..............................
............................................................
................................
................................
................................
................................
................................
................................
................................
................................
................................
...............................
...............................
...............................
...............................
...............................
...............................
...............................
...............................
...............................
...............................
...............................
...............................
...............................
...............................
...............................
...............................
...............................
.................................................................................................
.................................
.................................
.................................
.................................
.................................
..............................
.....................
............................
Page
Figures - Continued
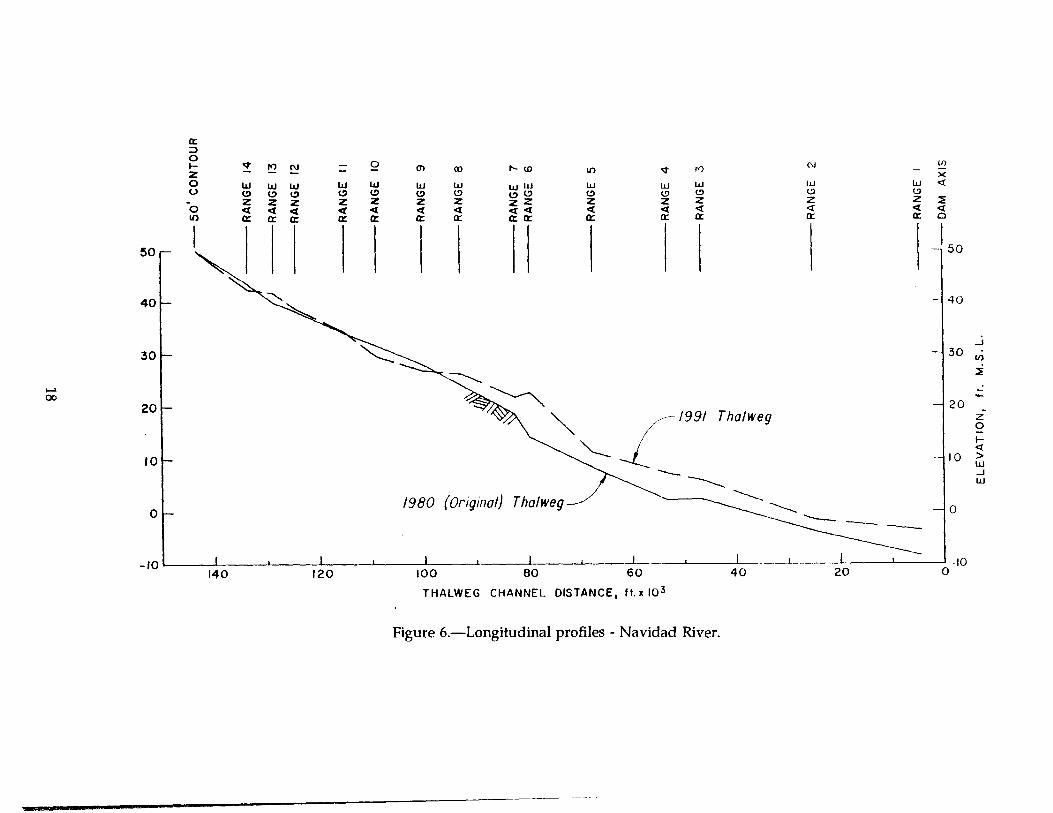
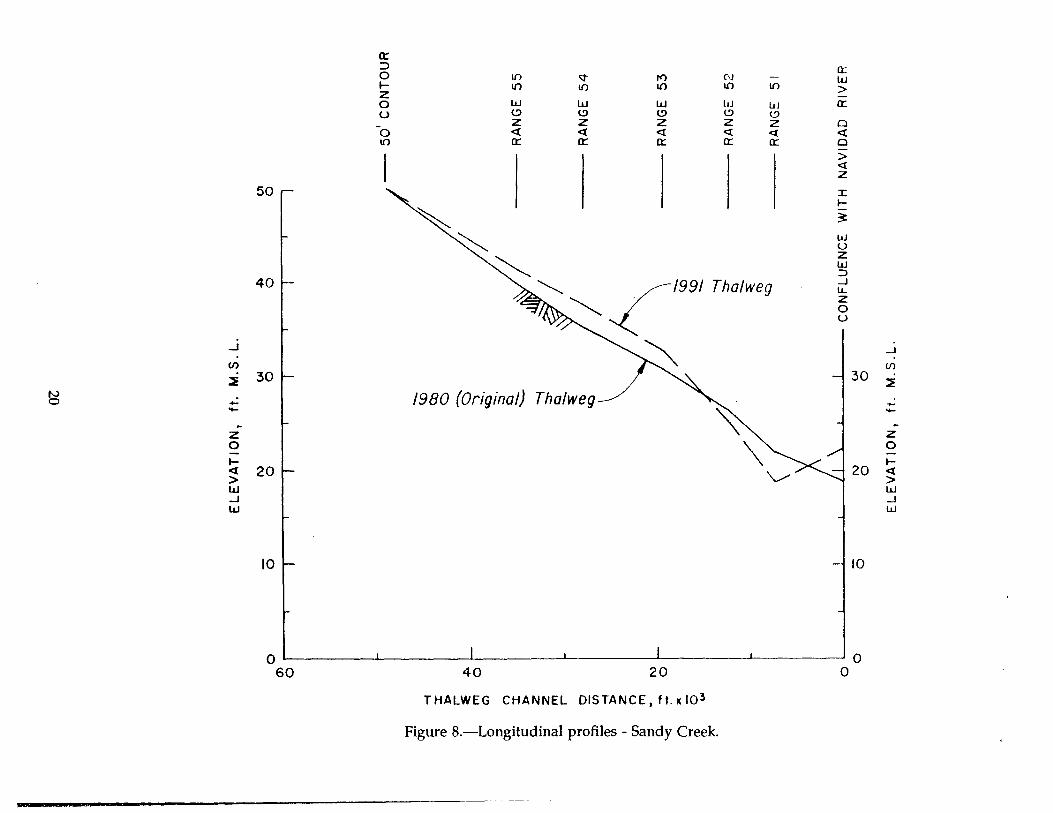
6 Longitudinal proffles - Navidad River 187 Longitudinal profiles - Mustang Creek 198 Longitudinal proffles - Sandy Creek 209 Sediment Range I - Navidad River 21
10 Sediment Range 2 - Navidad River 2111 Sediment Range 3 - Navidad River 2212 Sediment Range 4 - Navidad River 2213 Sediment Range 5 - Navidad River 2314 Sediment Range 6 - Navidad River 2315 Sediment Range 7 - Navidad River 2416 Sediment Range 8 - Navidad River 2417 Sediment Range 9 - Navidad River 2518 Sediment Range 10 - Navidad River 2519 Sediment Range 11 - Navidad River 2620 Sediment Range 12 - Navidad River 2621 Sediment Range 13 - Navidad River 2722 Sediment Range 14 - Navidad River 2723 Sediment Range 21 - Mustang Creek 2824 Sediment Range 22 - Mustang Creek 2825 Sediment Range 23 - Mustang Creek 2926 Sediment Range 24 - Mustang Creek 2927 Sediment Range 25 - Mustang Creek 3028 Sediment Range 26 - Mustang Creek 3029 Sediment Range 27 - Mustang Creek 3130 Sediment Range 28 - Mustang Creek 3131 Sediment Range 31 - Mustang Creek 3232 Sediment Range 32 - Mustang Creek 3233 Sediment Range 41 - Mustang Creek 3334 Sediment Range 42 - Mustang Creek 3335 Sediment Range 43 - Mustang Creek 3436 Sediment Range 51 - Sandy Creek 3437 Sediment Range 52 - Sandy Creek 3538 Sediment Range 53 - Sandy Creek 3539 Sediment Range 54 - Sandy Creek 3640 Sediment Range 55 - Sandy Creek 3641 Sediment Range 56 - Sandy Creek 3742 Sediment Range 61 - Sandy Creek 3743 Reservoir depth-capacity relationship 3844 Percent depth versus percent sediment deposited 3845 Area and capacity curves - Lake Texana 39
iv

INTRODUCTION
Palmetto Bend Dam was the first major feature constructed by the Bureau of Reclamation(Reclamation) as part of the Palmetto Bend Project. Construction of the dam began in1976 and was essentially completed in 1980. Water storage operations were begun inMay 1980. The Lavaca-Navidad River Authority (LNRA) of Edna, Texas manages andoperates the dam, reservoir, and all recreational facilities on the project. Located on theNavidad River in Jackson County about 7 miles southeast of Edna and 90 milessouthwest of Houston (figure 1), the dam is the first stage of the multipurpose projectdeveloped to supply water for municipal and industrial use, for conserving fish andwildlife resources, and for recreational use.
The dam extends across the Navidad River along an axis about 4 miles upstream of theconfluence of the Lavaca and Navidad Rivers. The dam is a zoned embankmentstructure with a structural height of 93 feet. The dam crest rises to a maximum height55 feet above sea level and 69 feet above original streambed which is 14 feet below sealevel. The dam has a crest length of 7.9 miles, a maximum base width of 820 feet, amaximum crest width of 42 feet in the typical flood plain sections, and contains a totalvolume of 5,991,000 cubic yards of soil and rock materials. The spiliway is a concreteoverflow weir controlled by twelve 22.6 x 35 foot radial gates with a discharge capacity of190,000 cubic feet per second at elevation 47.0. The general plan and sections of thedam, spillway, and outlet works are shown on figure 2.[111
Since the dam is in the tidewater area of the Gulf of Mexico it is subject to high tidalsurges caused by hurricanes. Special treatment on the face of the dam slopes and extrasteel anchors in the concrete spillway provide additional protection during hurricaneconditions.
In 1980 at the beginning of operations the reservoir at elevation 44.0 had a surface area of10,141 acres and a total capacity of 167,293 acre-feet. The reservoir space allocationsinclude 20,700 acre-feet allowance for 100 years of sediment deposition between thestreambed and elevation 44.0, of which 15,200 acre-feet is in active storage aboveelevation 15.0.
Lake Texana has a length of 41.9 miles and an average width of 0.46 miles. The length isthe sum of the lengths of all significant arms of the reservoir. The average width isdetermined by dividing the surface area by the reservoir length. The reservoir includesan 18 mile reach within the Navidad River Valley and the lower portions of the MustangCreek and Sandy Creek valleys.
The total Navidad River drainage area above the dam is 1,404 square miles, all of whichcontribute sediment inflow. The drainage basin is about 71 miles in length with anaverage width of 19.8 miles.
'Numbers in the brackets refer to the bibliography.
SUMMARY AND CONCLUSIONS
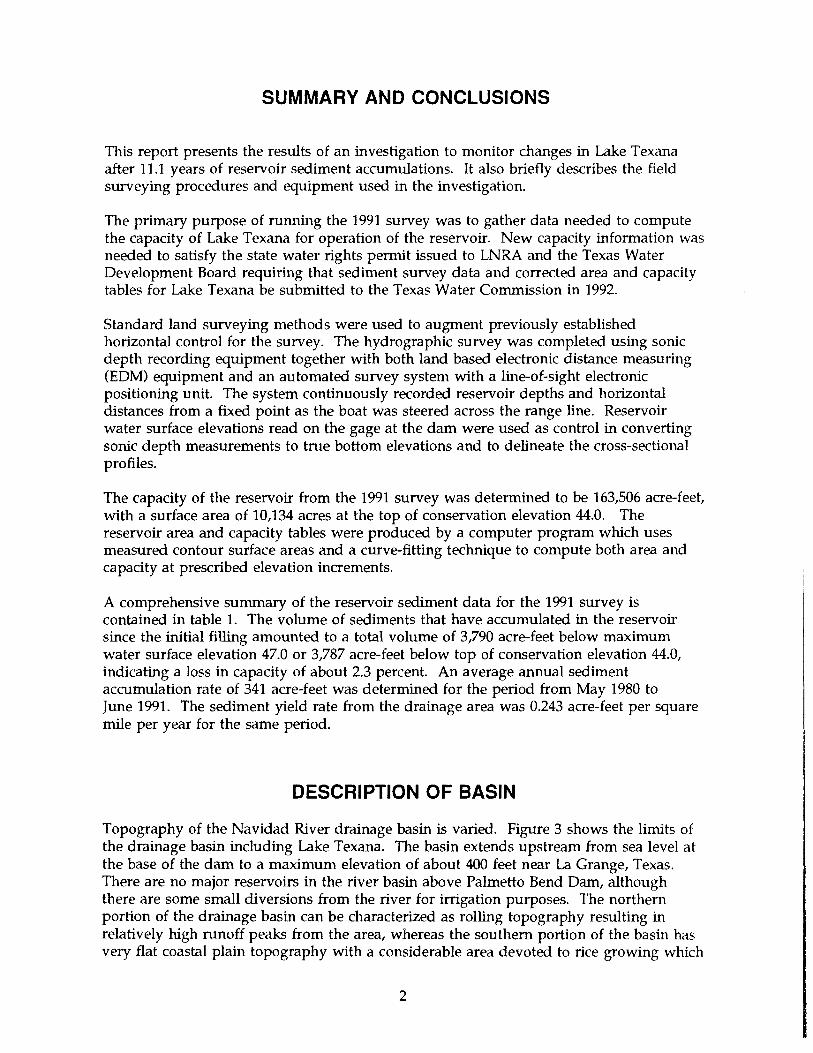
This report presents the results of an investigation to monitor changes in Lake Texanaafter 11.1 years of reservoir sediment accumulations. It also briefly describes the fieldsurveying procedures and equipment used in the investigation.
The primary purpose of running the 1991 survey was to gather data needed to computethe capacity of Lake Texana for operation of the reservoir. New capacity information wasneeded to satisfy the state water rights permit issued to LNRA and the Texas WaterDevelopment Board requiring that sediment survey data and corrected area and capacitytables for Lake Texana be submitted to the Texas Water Commission in 1992.
Standard land surveying methods were used to augment previously establishedhorizontal control for the survey. The hydrographic survey was completed using sonicdepth recording equipment together with both land based electronic distance measuring(EDM) equipment and an automated survey system with a line-of-sight electronicpositioning unit. The system continuously recorded reservoir depths and horizontaldistances from a fixed point as the boat was steered across the range line. Reservoirwater surface elevations read on the gage at the dam were used as control in convertingsonic depth measurements to true bottom elevations and to delineate the cross-sectionalprofiles.
The capacity of the reservoir from the 1991 survey was determined to be 163,506 acre-feet,with a surface area of 10,134 acres at the top of conservation elevation 44.0. Thereservoir area and capacity tables were produced by a computer program which usesmeasured contour surface areas and a curve-fitting technique to compute both area andcapacity at prescribed elevation increments.
A comprehensive summary of the reservoir sediment data for the 1991 survey iscontained in table 1. The volume of sediments that have accumulated in the reservoirsince the initial filling amounted to a total volume of 3,790 acre-feet below maximumwater surface elevation 47.0 or 3,787 acre-feet below top of conservation elevation 44.0,indicating a loss in capacity of about 2.3 percent. An average annual sedimentaccumulation rate of 341 acre-feet was determined for the period from May 1980 toJune 1991. The sediment yield rate from the drainage area was 0.243 acre-feet per squaremile per year for the same period.
DESCRIPTION OF BASIN
Topography of the Navidad River drainage basin is varied. Figure 3 shows the limits ofthe drainage basin including Lake Texana. The basin extends upstream from sea level atthe base of the dam to a maximum elevation of about 400 feet near La Grange, Texas.There are no major reservoirs in the river basin above Palmetto Bend Dam, althoughthere are some small diversions from the river for irrigation purposes. The northernportion of the drainage basin can be characterized as rolling topography resulting inrelatively high runoff peaks from the area, whereas the southern portion of the basin hasvery flat coastal plain topography with a considerable area devoted to rice growing which
2
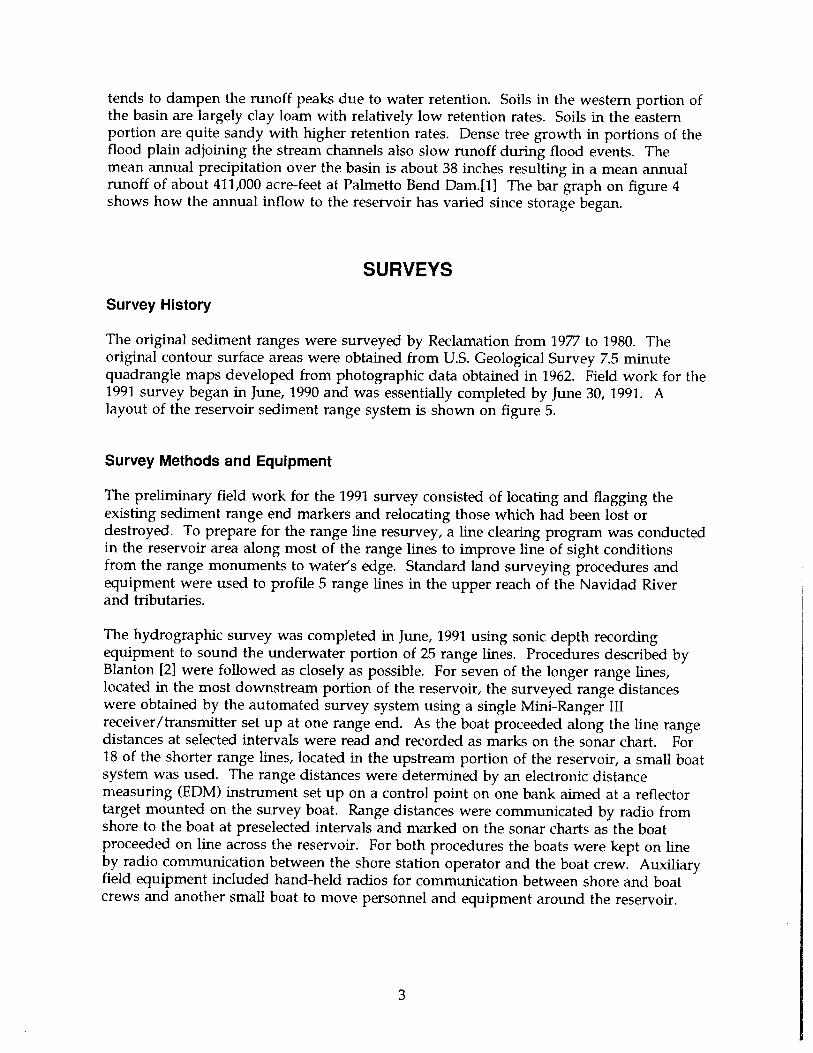
tends to dampen the runoff peaks due to water retention. Soils in the western portion ofthe basin are largely clay loam with relatively low retention rates. Soils in the easternportion are quite sandy with higher retention rates. Dense tree growth in portions of theflood plain adjoining the stream channels also slow runoff during flood events. Themean annual precipitation over the basin is about 38 inches resulting in a mean annualrunoff of about 411,000 acre-feet at Palmetto Bend Dam.[1] The bar graph on figure 4shows how the annual inflow to the reservoir has varied since storage began.
SURVEYS
Survey History
The original sediment ranges were surveyed by Reclamation from 1977 to 1980. Theoriginal contour surface areas were obtained from U.S. Geological Survey 7.5 minutequadrangle maps developed from photographic data obtained in 1962. Field work for the1991 survey began in June, 1990 and was essentially completed by June 30, 1991. Alayout of the reservoir sediment range system is shown on figure 5.
Survey Methods and Equipment
The preliminary field work for the 1991 survey consisted of locating and flagging theexisting sediment range end markers and relocating those which had been lost ordestroyed. To prepare for the range line resurvey, a line clearing program was conductedin the reservoir area along most of the range lines to improve line of sight conditionsfrom the range monuments to water's edge. Standard land surveying procedures andequipment were used to profile 5 range lines in the upper reach of the Navidad Riverarid tributaries.
The hydrographic survey was completed in June, 1991 using sonic depth recordingequipment to sound the underwater portion of 25 range lines. Procedures described byBlanton [2] were followed as closely as possible. For seven of the longer range lines,located in the most downstream portion of the reservoir, the surveyed range distanceswere obtained by the automated survey system using a single Mini-Ranger IIIreceiver/transmitter set up at one range end. As the boat proceeded along the line rangedistances at selected intervals were read and recorded as marks on the sonar chart. For18 of the shorter range lines, located in the upstream portion of the reservoir, a small boatsystem was used. The range distances were determined by an electronic distancemeasuring (EDM) instrument set up on a control point on one bank aimed at a reflectortarget mounted on the survey boat. Range distances were communicated by radio fromshore to the boat at preselected intervals and marked on the sonar charts as the boatproceeded on line across the reservoir. For both procedures the boats were kept on lineby radio communication between the shore station operator and the boat crew. Auxiliaryfield equipment included hand-held radios for communication between shore and boatcrews and another small boat to move personnel and equipment around the reservoir.
3

RESERVOIR SEDIMENT DISTRIBUTION
Longitudinal distribution
The distribution of sediment throughout the length of the reservoir is illustrated in partby plots of the thalweg profiles representing the original and 1991 resurveyed profilesshown on figures 6, 7, and 8. Thaiweg elevations representing original reservoirconditions are taken from the original range survey notes. Except for the possibility ofsome missed low point soundings during the original survey the plotted profiles shouldclosely resemble actual channel bottom conditions during the original range surveycompleted in 1977 and 1978. Thalweg elevations for the 1991 profiles were derived fromthe sonar charts and from field notes of the ground survey. Except for some minorinaccuracies in sounding, the bottom of these profiles should closely represent channelbottom conditions along the thaiweg at the time of the 1991 resurvey.
The profiles of the Navidad River (figure 6) show some lower thalweg elevations in 1991than those measured in the original survey at Ranges 9, 10, and 14, whereas theelevations would be expected to be higher due to sediment deposits. Several plausibleexplanations can be given for these differences, one being that some minor river scourmay have occurred in these upstream locations during high inflow events, or anotherbeing that some error in sounding or probing may have occurred in either the original or1991 resurvey. An examination of the original and 1991 data tend to support themeasured profiles indicating the possibility that some scour has occurred.
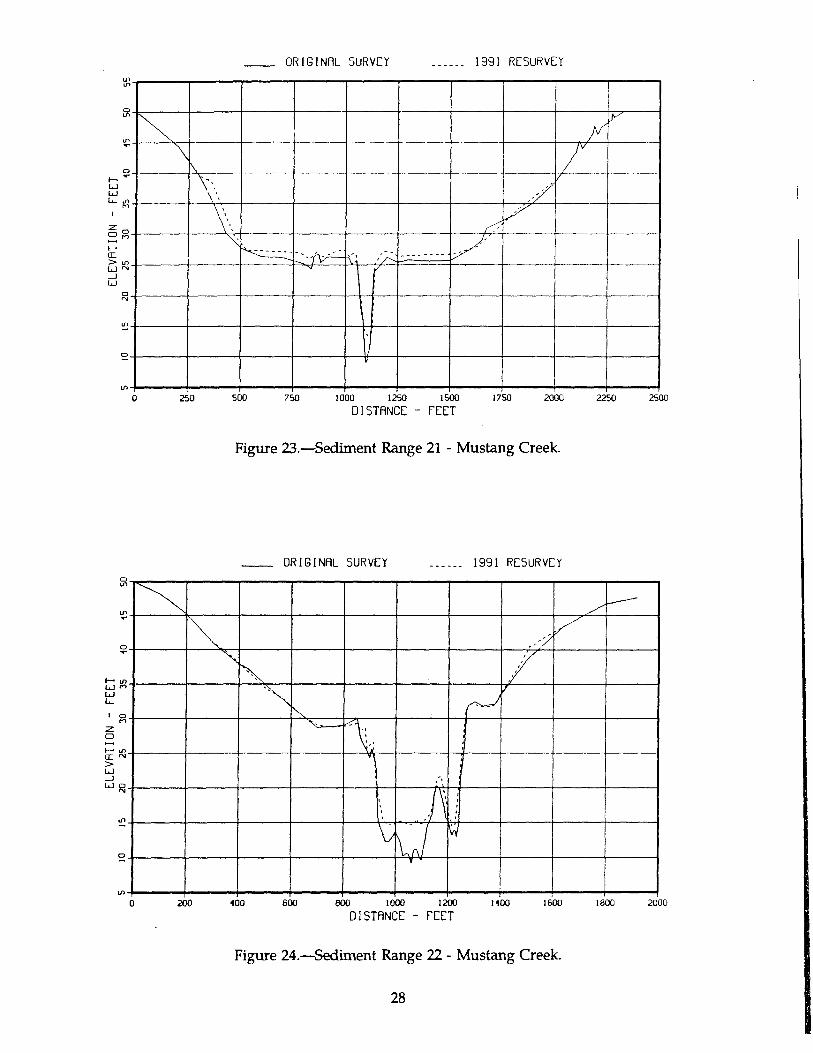
The profiles for Mustang Creek (figure 7) show the 1991 thaiweg proffle roughlyparalleling the original profile except at Range 26 where the 1991 thalweg is below theoriginal. This could be due to stream bed scour or an error in either the original or 1991soundings. Future resurveys may help to explain this difference.
The proffles for Sandy Creek (figure 8) from Range 53 upstream appear normal for areservoir with small sediment inflow operated at near full conditions most of the time.At Ranges 51 and 52, however, the 1991 thalweg elevations are lower than the originalthalweg elevations. An examination of the bottom portion of the original profile datarevealed range width intervals of 43 feet and 38 feet for Ranges 51 and 52 respectivelywhere no bottom soundings occurred. This would suggest the possibility that themaximum depths of these range lines were not sounded during the original survey.
These problems with the original and 1991 thalweg profiles are confined to the verynarrow river channel areas and had no significant effect on the sediment volumecomputations. In those locations where scour may have occurred it would be confined tothe narrow stream channel and may not extend very far upstream or downstream of thesediment range where it may have occurred, unlike what appears to be the case on thethaiweg proffle plots.
Lateral distribution
Ground proffles for the 34 original sediment ranges are shown on figures 9 through 42.The 1991 range profile data is superimposed on these plots to indicate the changes which
4

have occurred and to represent in general the lateral distribution of sediment within thereservoir. No resurveys were accomplished on Ranges 27, 28, and 43 on Mustang Creekor Range 56 on Sandy Creek. These omissions have no significant impact on storagecapacity computations since these ranges are all in the extreme upstream part of thereservoir where very little sediment deposition has occurred.
The comparative plots of Range 8 on figure 16 show significant differences in elevationsnear the right bank, the south side of the range line. The bathymetric survey of thisrange line in 1991 was run in two parts with the distance meter set at Station 22+33 forboth parts. The main channel portion in the direction of the left bank was surveyed withlittle difficulty. The overbank portion toward the right bank required much maneuveringof the survey boat to avoid vegetation growth, which may have led to some data beingcollected considerably off-line. Assuming that the original survey through this portionwas made with dry land conditions along a cleared ailnement, this is the most likelyexplanation. These measured differences along the right bank portion were not used inthe reservoir capacity computations.
Depth DistributiOn
Of special interest for future reservoir planning, a theoretical distribution of sediment inthe reservoir was computed (table 2) using the Alternate Area-increment Method [3]. Themethod was used in lieu of the preferred Empirical Area-increment Method since thereservoir condition with the small quantity of sediment deposition did not lend itself toan application of the preferred method. The total 1991 sediment volume of 3,790 acre-feetwas assumed in the distribution. The depth-capacity relationship plotted on figure 43,indicating the reservoir to be a Type II [3], did not apply since the Alternate Area-increment Method of distribution was used. Sediment distribution results are tabulatedon columns (8), (9), and (10) of table 3. These computations indicate the sediment wouldreach an elevation of 2.2 feet by 1991, whereas the measured elevation of sediment at thedam was -3.6 feet mean sea level. The sediment distribution curves on figure 44 showhow the measured distribution compares with the theoretical distribution by the AlternateArea-increment Method. The curves show percentage of depth plotted against percentageof sediment deposited.
SEDIMENT ANALYSES
Sediment Accumulation
Sediments have accumulated in Lake Texana to a total volume of 3,790 acre-feet atelevation 47.0, maximum water surface, and 3,787 acre-feet at elevation 44.0, top ofconservation, since storage began in May 1980. An average annual accumulation rate of341 acre-feet was computed for the 11.1 year period of operation. The net sedimentaccumulation rate from the contributing basin was 0.243 acre-feet per square mile peryear for the same period.
The results of the sediment volume computation are shown in table 3. Column 2 in thetable gives the original measured contour areas used in the original area and capacity
5

computation with the exception of the interpolated values at Elevation 44 and 47. Inorder to make a valid comparison with the 1991 computed values, these original capacityvalues were recomputed by current methods using the same original surface areas. Thusthe capacity values in column 3 differ somewhat from those found in the original (1982)area and capacity tables [41. The difference is due to differences between the cubic splinecurve fitting technique used for producing the 1982 tables and the least squares curvefitting technique used for producing the recomputed tables. While the cubic splinetechnique has been used occasionally in the past, Reclamation no longer recommends useof the method since it distorts the area curve, which is the basis for the capacitycomputation.
The annual sediment yield from the basin during the 11.1 year period of 341 acre-feet,based on the recomputed results, is greater than the yield estimated during the projectplanning stage. This higher annual yield should not be used for making long termprojections of storage loss. The increase is probably due to the fact that the annual inflowfor five of those 11.1 years was about 1.9 times the long term mean annual inflow, andthe average annual inflow for the period was 1.3 times the long term mean annual inflow(see No. 24 and No. 45 of table 1).
Reservoir sedimentation summary
A summary of the reservoir sediment data for the 1991 survey is contained in table 1.The data include a tabulation of incremental sediment inflow volume and sedimentaccumulation computed for the period between initial 1980 conditions and the 1991resurvey. Also included are information on the drainage basin, records of inflow,reservoir operations and reservoir storage. These data are considered of value forpractical and research studies.
RESERVOIR AREA AND CAPACITY
The 1991 reservoir surface areas were computed by the Width Adjustment Methoddescribed by Blanton [2]. Briefly the method entails computing the revised contour areasbetween any two ranges by applying an adjustment factor to each of the originalsegmental contour areas between adjacent ranges. The adjustment factor is determined asthe ratio of the new average width to the original average width for both the upstreamand downstream ranges at a specified contour. Computations were facilitated bysubdividing the reservoir into segments using the sedimentation range lines to delineatethe limit of each segmental boundary. Segmental contour areas for each elevation weredetermined by digitizing the segmental contours on the original topography. For anygiven contour elevation, the original segmental area was multiplied by the adjustmentfactor to obtain the 1991 surface area for that elevation. The total surface area at a givencontour elevation was computed as the summation of all segmental areas at thatelevation. These computations were obtained by means of the Reclamation programRESSED.
6

The 1991 surface areas were used as control parameters for computing the reservoircapacities by means of Reclamation's program ACAP85 [51. The resulting surface areaand storage capacity versus elevation relationships are shown graphically on figure 44.The computer program was written to include computation of 0.01 to 1.0-foot areaincrements by linear interpolation between measured contour areas. The respectivecapacities and capacity equations are then obtained by integration of the area equations.The initial capacity equation is tested over successive intervals to check whether it fitswithin an allowable error term. This one equation is used over the whole range that fitswithin this error term. At the next interval beyond, a new capacity equation (integratedfrom the basic area equation over that interval) begins testing the fit until it too exceedsthe error term. The capacity curve thus becomes a series of curves, each fitting a certainregion of data. The final area equations are obtained by differentiation of the capacityequations. Capacity equations are of the form:
y = a1 + a2x + a3x2
where: y = capacityx = elevation above an elevation basea1 = intercepta2 and a3 coefficients
Results of the 1991 area and capacity computations are listed in columns (4) and(5) of table 3. Listed in columns (2) and (3) of this table are the original area andcapacity values. Capacity values have been revised by using the same curve fittingtechnique as was used for the 1991 area and capacity computation. A special set ofarea and capacity tables has been published separately for the 0.01-, 0.10-, and 1-footelevation increments[6]. Both the original and 1991 area and capacity curves are plottedon figure 44. At the top of active conservation elevation 44.0 the 1991 capacity if163,506 acre-feet and the surface area is 10,134 acres.
7

BIBLIOGRAPHY
[1] "Project Data," Water and Power Resources Service, Denver, Colorado,pp. 751-754, 1981.
[2] Blanton, James 0. III, "Procedures for Monitoring Reservoir Sedimentation:Technical Guideline," Bureau of Reclamation, Denver, Colorado, 1982.
[3] "Design of Small Dams," 3rd ed., Bureau of Reclamation, Denver Office,Denver, Colorado, 1985.
[4] "Lake Texana - Area and Capacity Tables," Bureau of Reclamation, SouthwestRegion, Amarillo, Texas, 1982.
[5] "ACAP85 User's Manual," Bureau of Redamation, Denver Office, Denver,Colorado, 1985.
[61 "Lake Texana - Palmetto Bend Dam - Area and Capacity Tables," Bureau ofRedamation, Great Plains Region, Billings, Montana, 1992.

RESERVOIR SEDIMENTDATA SUMMARY Lake Texana
NAME OF RESERVOIR
DATA SHEET NO.
1. ONNER USD1 - USSR 2. STREAM Navidad River 3. STATE TexasA 4. SEC. TWP. RANGE 5. NEAREST P.O. E&a, Texas 6. COUNTY Jackson
N 7. LAT 28'53'30" LONG 9634'OO" 8. TOP OF DAM ELEVATION 55.0 9. SPILLWAY CREST 44.0'i 10. STORAGE 11. ELEVATION 12. ORIGINAL 13. ORIGINAL 14. GROSS STORAGE 15. DATEE ALLOCATION TOP OF POOL SURFACE AREA. Ac CAPACITY. AF ACRE-FEET STORAGE
S a. FLOOD CONTROL 47.O 12,364 33,11O 199,028 BEGAN
E b. MULTIPLE USE _________________ _________________ ________________ __________________NAY, 1980
R c. POIER _________________ _________________ ________________ __________________ 16. DATEd. WATER SUPPLY _________________ _________________ ________________ __________________
NORMAL
e. IRRIGATION ________________ ________________ _______________OPERATION
R f. CONSERVATION 44.0 9,934 157,884 165,918 BEGAN,
'g. INACTIVE 15.0 1,639 8,034' 8,0341
17. LENGTH OF RESER VOIR 41.9 MILES AVG. WIDTH OF RES ERVOIR O.4o MILESB 18. TOTAL DRAINAGE AREA 1,404 SQUARE MILES 22. MEAN ANNUAL PRECIPITATION 38.4 INCHESA 19. NET SEDIMENT CONTRIBUTING AREA 1,404 SQUARE MILES 23. MEAN ANNUAL RUNOFF 5.5' INCHESS 20. LENGTH 71 MILES AV. WIDTH 19.8 MILES 24. MEAN ANNUAL RUNOFF 411,000' ACRE-FEET
21. MAX. ELEVATION 400 NI H. ELEVATION 0 25. ANNUAL. TEMP. MEAN 70F RANGE 4OF to 97F26. DATE OF 27. 28. 29. TYPE OF 30. NO. OF 31. SURFACE 32. CAPACITY 33. C/I
U SURVEY PER. ACCL. SURVEY RANGES OR AREA, AC. ACRE-FEET RATIO AF/AFRV
____________________________________________5/30/1980 Contour(D) 5-ft 10,141' 167,293'
Ey 6/30/1991 11.1 11.1 Range(D) 31 10,134 163,506 .398
DATA
26. DATE OF 34. PERIOD 35. PERIOD WATER INFLOW, ACRE FEET WATER INFLOW TO DATE, AFSURVEY ANNUAL ________________________________________________________________________
PRECIP. a. MEAN ANN. b. MAX. ANN. c. TOTAL a. MEAN ANN. b. TOTAL
6/30/1991 *20.56 525,475' 791,571' 5,648,860' 525,475' 5,648,860'
26. DATE OF 37. PERIOD CAPACITY LOSS, ACRE-FEET 38. TOTAL SEDIMENT DEPOSITS TO DATE, AFSURVEY
a. TOTAL f b. AV. ANN. c. /NI.'-YR. a. TOTAL b. AV. ANNUAL ( c. /MI.2-YR.
6/30/1991 3,787 341 0.243 3,787 341 0.243(3,790) (341) (0.243) (3,790) (341) (0.243)
26. DATE OF 39. AV. DRY 40. SEt). DEP. TONS/MI.2-YR. 41. STORAGE LOSS, PCI. 42. SEDIMENTSURVEY WT. (1/Fl') L INFLOW PPM
a. PERIOD b. TOTAL TODATE
a. AV.ANNUAL
b. TOTAL TODATE
a.PER.
b.TOT.
6/30/1991 no data no data 0.20 2.26 no data(0.20) (2.26)
* Estimated
Table I .-Reservoir sediment summary

26. DATE 43. DEPTH DESIGNATION RANGE IN FEET BELOW AI ABOVE CREST ELEVATION
" 3934 34-29 29-24 24-19 J 19-14 14-9 4-0 0-(-6.O)
PERCENT OF TOTAL SEDIMENT LOCATED WITHIN DEPTH DESIGNATION
6/30/91 0.1 J 5.6 8.4 13.2 20.2 20.8 18.2 11.3 2.1 0.126. DATE 44. REACH DESIGNATION PERCENT OF TOTAL ORIGINAL LENGTH OF RESERVOIROF
E'0-10
10-20
20-3u
30-40
40-50
50-60
60-70
70-80
80-90
90-100
100-105
105-110
110-115
115-120
120-125
PERCENT OF TOTAL SEDIMENT LOCATED WITHIN REACH DESIGNATION6/30/91 N/A45. RANGE IN RESERVOIR OPERATION
____________ ____________
WATER YEAR MAX. ELEV.' NIH. ELEV.' INFLOW, AFb WATER YEAR____________
MAX. ELEV. NIN. ELEV. INFLOW, AF1980 33.93 tsavai tabLe travel tabLe 1981 41.75 31.85 778,7401982 43.32 41.36 735,728 1983 44.00 42.16 791,5711984 43.32 42.47 371,969 1985 43.44 42.40 716,2811986 43.33 42.67 450,086 1987 44.21 42.59 779,9031988 43.13 41.56 188,928 1989 43.13 41.90 241,6881989 43.13 41.90 241,688 1990 43.13 42.04 164,6001991 43.02 41.36 429,366 ___________ ___________ ____________ ___________
46. ELEVATION - AREA - CAPACITY DATA FOR ORIGINAL CAPACITYELEV. AREA CAP. ELEV. AREA CAP. ELEV. AREA CAP.
O 0 0 20 3,004 19,613 40 8,348 129,7195 178 354 25 4,151 37,565 45 10,589 176,167
10 702 2,396 30 5,396 61,343 50 15,722 241,04015 1,639 8,034 35 6,819 91,818
46. ELEVATION AREA - CAPACITY DATA FOR 1991 TOTAL CAPACITY__________ __________
ELEV. AREA CAP. ELEV. AREA CAP. ELEV. AREA CAP.O 0 0 20 2,872 19,070 40 8,314 126,6105 165 413 25 3,976 36,190 45 10,589 173,868
10 642 2,430 30 5,256 59,270 50 15,722 239,64515 1,571 7,963 35 6,683 89,118
47. REMARKS AND REFERENCES
1 Top of active conservation2 Top of surcharge - maxir water surface3 OriginaL storage .L Locations4 Date reservoir pooL reached eLevation 44.05 Arwiuat normaL precipitation for Hattettvitte, Texas - CLimetography of the U.S. No. 816 Estimat.d fLow with future içstr.ma conservation measures - Project Data, USD01, WPRS, 19817 OriginaL area and capacity vaLues reccaçuted by current methods for coeperision with 199 1 vaLues to cospute
sediment deposition8 mt Low from 1980 coivuted by form4a: InfLow Outf Low - Storage9 From GP RegionaL records representing end of month storage
48. AGENCY MAXING SURVEY Bureau of Rectma.tion49. AGENCY SUPPLYING DATA Bureau of Rectanetion DATE JuLy 1992
Table 1.-Reservoir sediment summary - continued
10
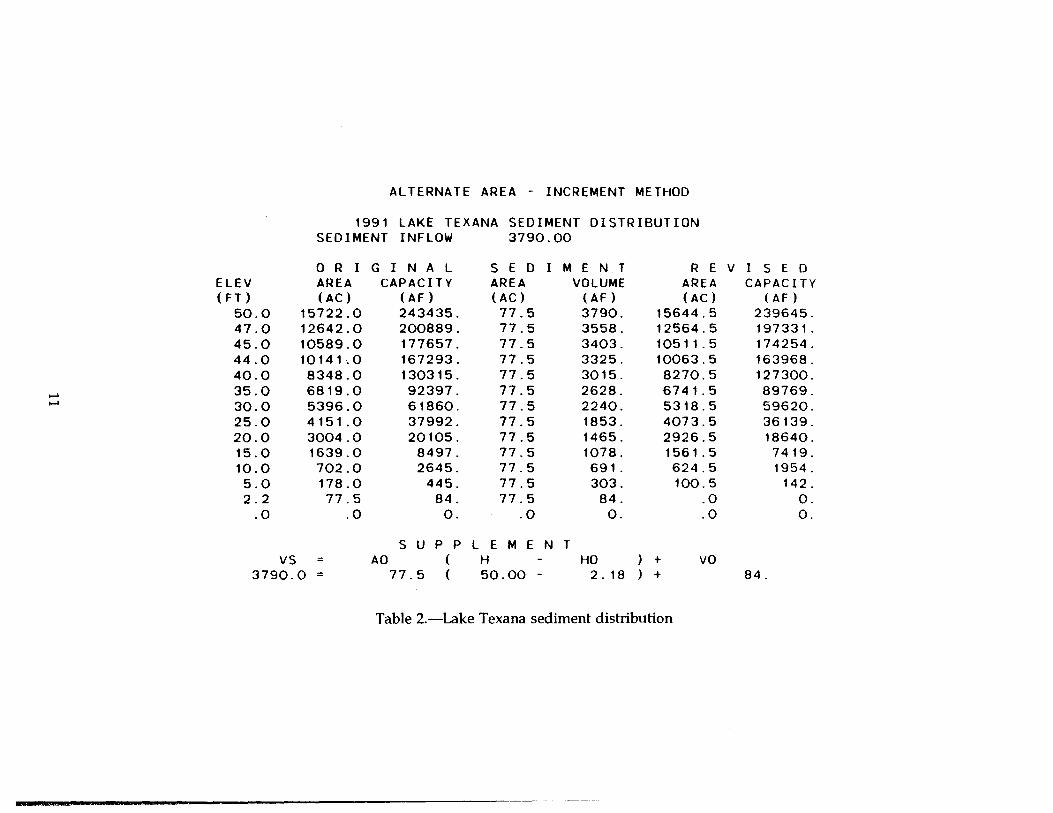
ALTERNATE AREA - INCREMENT METHOD
ELEV(FT)50.047.045.044.040.035.030.025.020.015.010.05.02.2.0
1991 LAKE TEXANA SEDIMENT DISTRIBUTIONSEDIMENT INFLOW 3790.00
ORIGINALAREA CAPACITY(AC) (AF)
15722.0 243435.12642.0 200889.10589.0 177657.10141.0 167293.8348.0 130315.6819.0 92397.5396.0 61860.4151.0 37992.3004.0 20105.1639.0 8497.702.0 2645.178.0 445.77.5 84.
.0 0.
SEDI MENTAREA VOLUME(AC) (AF)77.5 3790.77.5 3558.77.5 3403.77.5 3325.77.5 3015.77.5 2628.77.5 2240.77.5 1853.77.5 1465.77.5 1078.77.5 691.77.5 303.77.5 84.
.0 0.
RE V I SEDAREA CAPACITY(AC) (AF)
15644.5 239645.12564.5 197331.10511.5 174254.10063.5 163968.8270.5 127300.6741.5 89769.5318.5 59620.4073.5 36139.2926.5 18640.1561.5 7419.624.5 1954.100.5 142.
.0 0.
.0 0.
SUPP L EMENTVS AD ( H - HO )+
3790.0 = 77.5 ( 50.00 - 2.18 ) +
VO84.
Table 2.-Lake Texana sediment distribution

(1) (2) (3) (4) (5) (6) (7) (8) (9) (10)Elevation 1980 1980 1991 1991 Measured Percent of 1991 Computed Percent of
(it) Original area Original Revised Revised sediment measured Computed sediment computed(acres) capacity area capacity volume sediment capacity volume sediment
(acre-feet) (acres) (acre-feet) (acre-feet) (acre-feet) (acre-feet)
50 15.722 243.435 15.722 239,645 3.790 100 239,645 3.790 100
47 12.642 200.889 12.642 197,099 3,790 100 197.331 3.558 93.9
45 10,589 177,657 10,589 173,868 3,789 100 174,254 3,403 89.844 10.141 167,293 10,134 163,506 3,787 99.9 163,968 3,325 87.7
40 8.348 130.315 8,314 126,610 3.705 97.8 127,300 3,015 79.6
35 6,819 92,397 6.683 89.118 3,279 86.5 89,769 2,628 69.3
30 5.396 61,860 5.256 59.270 2,590 68.3 59,620 2,240 59.1
25 4,151 37,992 3.976 36.190 1,802 47.5 36.139 1,853 48.9
20 3,004 20,105 2,872 19.070 1.035 27.3 18,640 1,465 38.6
15 1,639 8,497 1,571 7,963 534 14.1 7,419 1.078 28.4
10 702 2.645 642 2.430 215 53 1,964 691 18.2
05 178 445 165 413 32 0.1 142 303 8.0
2.2 0 84 2.2
0 1) 0 0 0 0 0 0 0 0
Explanation of columns:(1) ElevatIon of reservoir water surface(2) OrIginal reservoir water surface area surveyed In 1980, recomputed by current methods for comparison with 1991 results(3) OrigInal reservoir capacity from 1980 survey recomputed by current mehtods for compa rison with 1991 results(4) ReservoIr surface area Surveyed In 1991(5) Reservoir capacity from the 1991 survey(6) Measured sediment volume - column (3) minus column (5)(7) Measured sediment expressed In percentage of total sediment (3.790 acre-feet)(8) Computed 1991 reservoIr capacity using area-Increment method(9) Computed sediment volume for period from 1980-1991 - column (3) - column (8)(10) Computer sediment expressed In percentage of total sediment (3,790 acre-feet)
Table 3.-.-Summary of 1991 survey results and sediment distribution computations

4• ANADOr
\y
#--
x
i--__ -
AREA r
,I / ;- c) '
)
( .)
k.. t
I pj\___ ___•___
( ' /
Si?
.
.
/ .:-:•
5??
A'.v
/ -'-
.'c•- : :., 1.i•: ' •'.
2 PALMETTO BEND/ DAM
rn .
.
(
. : ___
-I___ _____ ____
¶1
I'/ t,
)I ________ft5
is.. .*tsoso
LOLITA
1., J
VANDERBILT
0 I 2 5
SCALL 0 MILES
Figure 1.-Vicinity map.
13

Space intentionally left blank due to security concerns

5 0 5 JO 15 20I- -
SCALE OF MILES
Figure 3.-Drainage area map.
DAM
15

800
700
Iii 600wth
500
100
0
Figure 4.-Lake Texana inflows.
1981 1982 1983 1984 1985 1986 1987 1988 1989 1990 1991WATER YEAR

0
0 N 0 III: 0
0
81
00
0U
,0 1 ,-
50' C
ON
TO
UR
-RA
NG
E 1
4
-RA
NG
E 1
3
-RA
NG
E 1
2
-RA
NG
E I
I
-RA
NG
E t
O
-RA
NG
E 9
-RA
NG
E 8
RA
NG
E 7
RA
NG
E 6
-RA
NG
E 5
RA
NG
E 4
RA
NG
E 3
RA
NG
E 2
N 0 00
N)
(J
00
00
ELE
VA
TIO
N,
ft.
M.S
.L.
-RA
NG
E
a-D
AM
AX
IS

0
0
61
-5O
CO
NT
OU
R
RA
NG
E 2
8
0
-m
oo
(D-l
rJ)
c.) s11cj q (•)
0
(tI
0
- R
AN
GE
27
RA
NG
E 2
6
-R
AN
GE
25
-R
AN
GE
24
-R
AN
GE
23
-R
AN
GE
22
-R
AN
GE
2
06
00
ELE
VA
TIO
N, ft. M
.S.L
.
CO
NF
LUE
NC
E W
ITH
NA
VID
AD
RIV
ER
ELE
VA
TIO
N, ft. M
.S.L
.
-A
00
00
0
a:o Ui cj- C\J - LuI- U, If) tO If) If)z -
o Lu Lu Lu Lu w cro 0 0 0 0
z z z z z 0
U, a: a: a: a: a: o
0
50
40
-J
(I)30
z0I.-
20Lu-JLu
I0
0-60
>
z
-J(I)
30
.4-
z0I.-
20 <>Lu-JLu
I0
00
Figure 8.-Longitudinal profiles - Sandy Creek.
40 20
THALWEG CHANNEL DISTANCE, ft. io

Ui
ORIGINAL SURVEY - 1991 RESURVEY
Li t)Li
F-CE>Li-JLi c
500 1000 1500 20(X) 2500 3000 3500 4000 4500 5000 5500 6000 6500 7000 7500
DISTANCE - FEET
Figure 9.-Sediment Range I - Navidad River.
U)
F-LiLi
z
F-CE>Li-JLi 0
0
ORIGINAL SURVEY 1991 RESURVEY
0 1000 2000 3000 4000 5000 6000 7000 8000 9000 10000
DISTANCE - FEET
Figure 1O.-Sediment Range 2 - Navidad River.
21

C
C
tj
ULi
C
zD
> CLi-JLi
C
U,
C
ORIGINAL SURVEY 1991 RESURVEY
0 500 1000 1500 2000 2500 3000 3500 4000 4500 5000 5500
DISTANCE - FEET
Figure 11.-Sediment Range 3 - Navidad River.
C
LI)
CLi 'Li
I-
>Li-JLi C
C
ORIGINAL SURVEY 1991 RESURVEY
0 500 lOGO 1500 2000 2500 3000 3500
DISTANCE - FEET
Figurel2.-Sediment Range 4- Navidad River.
22
1000 4500

tr
-
Ui
I-LiLi
U)
z
CE> U,Li '-JLi
U)
U)
ORIGINAL SURVEY - 1991 RESURVEY
I0 500 1000 1500 2000 2500 3000 3500 1000 4500 5000 5500 6000
DISTANCE - FEET
Figure 13.-Sediment Range 5 - Navidad River.
U)U)
U)
U)
I-LiLiL.
I U)r.)
0CE>Li-JLi U)
0
U)
0
ORIGINAL SURVEY 1991 PESURVEY
0 500 1000 1500 2000 2500 3000 3500 4000 4500
DISTANCE - FEET
Figure 14.-Sediment Range 6 - Navidad River.
23

____ ORIGINAL SURVEY 1991 RESURVEY
-
LiLi
z
F-
>Lit-JLi
I 500 1000 150(3 2000 2500 3000 3500 4000 4500 5000 5500 6000 6500
DISTANCE - FEET
Figure 15.-Sediment Range 7- Navidad River.
ORIGINAL SURVEY 1991 RESURVEYU-,U,
0U-,
U,
F-Li1-i
z
F-a:> I.,
Li-JLi
U,
-
0 250 500 750 100(3 1250 1500 1750 2000 2250 2500 2750 3000 3250 3500 3750 4000
DISTANCE - FEET
Figure 16.-Sediment Range 8 - Navidad River.
24

____ ORIGINAL SURVEY - 1991 RESURVEYU) - - - - - - -U)
CU)
U)
LiLiL.
z
>Li-JLi
C
U)
C
250 5u0 750 1000 1250 1500 1750 2000 2250 2500 2750 3000 3250 3500 3750
DISTANCE - FEET
Figure 17.-Sediment Range 9 - Navidad River.
U)U)
CU)
U)
ULi
z
a:
Li-JLi
r)
ORIGINAL SURVEY 1991 RESURVEY
U)
C. ____
0 50 100 150 200 250 300 350 400 450 500 550 600 650
DISTANCE - FEET
Figure 18.-Sediment Range 10 - Navidad River.
25

ORIGINAL SURVEY - 1991 RESURVEY
Ui
QU)
LiLi
f-.
>Li-JLi
U-,1)
0 ______ ______ ______ ______ ______ ______ ______ ______ ______ ______ ______
0 25 50 75 100 125 150 175 200 225 250 275
DISTANCE - FEET
Figure 19.-Sediment Range 11 - Navidad River.
L.
L
4C
I-a
LL
ORIGINAL SURVEY 1991 RESURVEY
0 SO IOU ISO 200 250
DISTANCE - FEET
Figure 20.-Sediment Range 12 - Navidad River.
26
0

U)U)
ORIGINAL SURVEY - 1991 RESURVEY
U)
U)U)
I-LiLi
IU)
C
>Li-JLi .------- 'I
U)
U)U)
U)
LiLi
U)U)
zC
F-
>Li-JLi
U)
0 10 20 30 40 50 60 70 80 90 lOU 110 120 130 140 150 160
DISTANCE - FEET
Figure 22.-Sediment Range 14 - Navidad River.
27
20 40 60 80 100 120 110 160 ISO 200 220
DISTANCE - FEET
Figure 21.-Sediment Range 13 - Navidad River.
ORIGINAL SURVEY 1991 RESURVEY
U,U-
CU,
U,
CF-.LILIL. ,,
1
z
F-
> U.'LI r'J
-JLI
C
U-,
C
U)
ORIGINAL SURVEY - 1991 RESURVEY
0 250 SuO 750 1000 1250 1500 1750 2000 2250 2500
DISTANCE - FEET
Figure 23.-Sediment Range 21 - Mustang Creek
CU,
U,
C
1- ULI 'Li
F-
>LI-JLU Q
U,
0
4)
ORIGINAL SURVEY 1991 RESURVEY
0 200 luO 600 800 1000 1200 1100 1600 1800 2000
DISTANCE - FEET
Figure 24.-Sediment Range 22- Mustang Creek.
28

_____ ORIGINAL SURVEY - 1991 RESURVEY
_
U,
CU,
---
- --- - ,LU.-
_______7____>LU-JLJn --
(J
CD --
UD - - - - - - - - -
0 250 500 750 1000 1250 1500 1750 2000 2250 2500 2750 3000 3250 3500
DISTANCE - FEET
Figure 25.-Sediment Range 23- Mustang Creek
hiU')
CDU')
U•)
I-LiLU
z
CD
hi')
CD
ORIGINAL SURVEY 1991 RESURVEY
0 100 2(10 300 100 500 600 700 800 900 1000 1100 1200 1300
DISTANCE - FEET
Figure 26.-Sediment Range 24 - Mustang Creek.
29

LI)U)
U,
LI)
LiLi
0
ci:>U-JLi
r)
ORIGINAL SURVEY - 1991 RESURVEY
LI)
___ ___ -
0 100 200 3u0 400 500 600 700 BuO 900 1000 1100 1200 1300
DISTANCE - FEET
Figure 27.-Sediment Range 25 - Mustang Creek
_____ ORIGINAL SURVEY 1991 RESURVEY
I-LiLiL
z0
F-.
>Li-JLi
-
D _______ _______ _______ _______ _______ _______ _______ _______ _______ _______I)
0 100 200 30(1 400 500 600 700 600 900 lOGO 1100
DISTANCE - FEET
Figure 28.-Sediment Range 26 - Mustang Creek
30

____ ORIGINAL SURVEY 1991 RESURVEYU)
U-)
U•)
(N
LiLi
C)
0
a:r)
Li-JLi
U)
U)
(Nr)
C)r)0 20 40 60 80 100 120 140 160
DISTANCE - F'EET
Figure 29.-Sediment Range 27 - Mustang Creek.
ORIGINAL SURVEY 1991 RESURVEY
U)
U)
(NU)
C)U)
U)
N.
LiLi
U)
0 CU
a:> C)Li-J
N.I.)
U)r)
U)
NJ
C)
180
DISTANCE - FEET
Figure 30.-Sediment Range 28 - Mustang Creek
31

U)U)
C)U)
U)
f-.LiLi
0
Li-iLi
C)
U•)
C)
ORIGINAL SURVEY 1991 RESURVEY
0 100 200 300 400 500 600 700 800 900 1000
DISTANCE - FEET
Figure 31.-Sediment Range 31 - Mustang Creek
ORIGINAL SURVEY 1991 RESURVEY
LiLiL.
z0
F-.a:>Li-JLi
U-) ______ ______ ______ ______ ______ ______U) -
C) ___ ___ ___ ___ ___ ___ ___ ___ ___ ___ ___
25 SO 75 lOU 125 - ISO 175 200 225 250 275
DISTANCE - FEET
Figure 32.-Sediment Range 32 - Mustang Creek
32

____ ORIGINAL SURVEY 1991 RESURVEYU,
N
U-
N
F-LiU1
D
ci N.Ni
Li
Li
to
U-)
04Ni
DN,
i i I i i I I I i I i i
0 t O 20 30 40 50 60 70 80 90 100 It O 120 130 140 150 16(
DISTANCE - FEET
Figure 33.-Sediment Range 41 - Mustang Creek
U,
I-LiLi1
zD
F--'I>Li-iLi
ORiGINAL SURVEY 1991 FESURVEY
04'I,
U,- ____ ___ ___ ____ ____ ___ ____ ____ ___ ____ ___
0 20 40 60 60 100 120 140 160 ISO 200 220DISTANCE - FEET
Figure 34.-Sediment Range 42 - Mustang Creek
33

U)
U)
U)U)
I-Li U)LiL U)
> U)LJ
Li
U,
U)
ORIGINAL SURVEY - 1991 RESURVEY
0
DISTANCE - FEET
Figure 35.-Sedithent Range 43 - Mustang Creek.
U,U,
0I')
U•)
I- oLi 'Li
U)
D
0CE>Li-JLi U'
0
U)
0
ORIGINAL SURVEY 1991 RESURVEY
0 200 400 600 800 1000 1200 1400 1600 1800 2000
DISTANCE - FEET
Figure 36.-Sediment Range 51 - Sandy Creek.
34

_____ ORIGINAL SURVEY 1991 RESURVEY
C)
U-,U-,
I-Li ULiL.
I LI)
zci
C)Ct>Li-JLi
cI
IN
C)(N
0 IOU 200 300 100 500 600 70& 60C) 900 1000DISTANCE - FEET
Figure 37.-Sediment Range 52 - Sandy Creek.
C)
U-,LI)
C)Li ULi
Ct>LI-JLi C)
ORIGINAL SURVEY 1991 RESURVEY
U-,I--,
- --------- - - - - -
0 100 200 300 400 500 600 700 800 900 1000 HOG 1200 1300 1400 1500DISTANCE - FEET
Figure 38.-Sediment Range 53 - Sandy Creek.
j.
35

_____ ORIGINAL SURVEY 1991 RESURVEY
- - - - - - - - - -
U)U)
- cLi JLi
I-
>Li-iLi
U)r)
D
25 50 75 IuO 125 150 IfS 200 225 250 275 300 35 350 375
DISTANCE -
Figure 39.-Sediment Range 54 - Sandy Creek.
_____ ORIGINAL SURVEY 1991 RESURVEYU)
I)
I). -I)
I)
I-LILi
C
I-.
>Li-JLi
-I)
-
-I)
I,
0 25 50 75 100 125 ISO 175 200 225 250 275 300 325
DISTANCE - FEET
Figure 40.-Sediment Range 55 - Sandy Creek.
36

_____ ORIGINAL SURVEY 1991 RESURVEYU,
LiLi
z
I-.
>Li-JLi
Q -(0
U-,
U)
U) -U)
U)
-U)
-U)
Li)
N -
_n. -
1)-
25 50 75 100 125 150 175 200 225 250 275 300 325DISTANCE - FEET
Figure 41.-Sediment Range 56 - Sandy Creek
ORIGINAL SURVEY 1991 RESURVEY
I-L
L
C
F-
L
LI)r)
1
0 200 400 600 800 1000 1200 1400
DISTANCE - FEET
Figure 42.-Sediment Range 61 - Sandy Creek
37
1600 1800

100
--
M = 2.77, TYPE H
10
Ii;wLi.
a-wa
10 100 1000 10000 100000CAPACITY - ACRE-FEET
Figure 43.-Reservoir depth-capacity relationship.
1000000
100
80
60
w
Uia- 40
20
I I I I
ALThRNATh AREA-INCA
T-1 _______-
-' -91 MEASURED AM
0 20 40 60 80 100
PERCENT SEDIMENT DEPOSITED -
Figure 44.-Percent depth versus percent sediment deposited.
38
0
/

16 14 1250 -.--.._i
40
jC,;
30
z0
4> 20LU-Jw
l0
0
SURFACE AREA, ACRES x io
10 8 6 4 2
v El. 47.0 Maximum Wo' /440 Top ofsurface conservation-
-/99/ Area/99/ Capacity-
/980 (Or -
El 23.0 Spit/way/// /980 (Original) Capacily
N
050
40
-J
30 C')
z0
I-20
LU-Jw
I0
00 40 80 120 160 200 240 28
STORAGE CAPACITY, ACRE-FEET x
Figure 45.-Area arid capacity curves - Lake Texana.