lake winnebago
TRANSCRIPT
LAKE WINNEBAGO WATERSHED (WI) HUC:04030103
1
The United States Department of Agriculture (USDA) prohibits discrimination in all its programs and activities on the basis of race, color, national origin, sex, religion, age, disability, political beliefs, sexual orientation, and marital or family status. (Not all prohibited bases apply to all programs.) Persons with disabilities who require alternative means forcommunication of program information (Braille, large print, audiotape, etc.) should contact USDA’s TARGET Center at 202-720-2600 (voice and TDD).To fi le a complaint of discrimination, write USDA, Director, Offi ce of Civil Rights, Room 326W, Whitten Building, 14th and Independence Avenue, SW, Washington DC 20250-9410, or call (202) 720-5964 (voice and TDD). USDA is an equal opportunity provider and employer.
Wisconsin
Rapid Watershed AssessmentLake Winnebago Watershed
Rapid watershed assessments provide initial estimates of where conservation investments would best address the concerns of landowners, conservation districts, and other community organizations and stakeholders. These assessments help landowners and local leaders set priorities and determine the best actions to achieve their goals.
Wisconsin
Wisconsin October 2007

LAKE WINNEBAGO WATERSHED (WI) HUC:04030103
2
CONTENTS
INTRODUCTION 3
COMMON RESOURCE AREA DESCRIPTION 4
ELEVATION MAP 5
LAND USE AND ANNUAL PRECIPITATION MAPS 6
ASSESSMENT OF WATERS 7
SOILS 9
DRAINAGE CLASSIFICATION 10
FARMLAND CLASSIFICATION 11
HYDRIC SOILS 12
LAND CAPABILITY CLASSIFICATION 13
PRS AND OTHER DATA 14
CENSUS AND SOCIAL DATA (RELEVANT) 15
ECOLOGICAL LANDSCAPE 16
RESOURCE CONCERNS 17
WATERSHED PROJECTS, 17STUDIES, MONITORING, ETC
WATERSHED ASSESSMENT 17
PARTNER GROUPS 18
FOOTNOTES/BIBLIOGRAPHY 19
Lake
Win
neba
go
LAKE WINNEBAGO WATERSHED (WI) HUC:04030103
3
INTRODUCTION
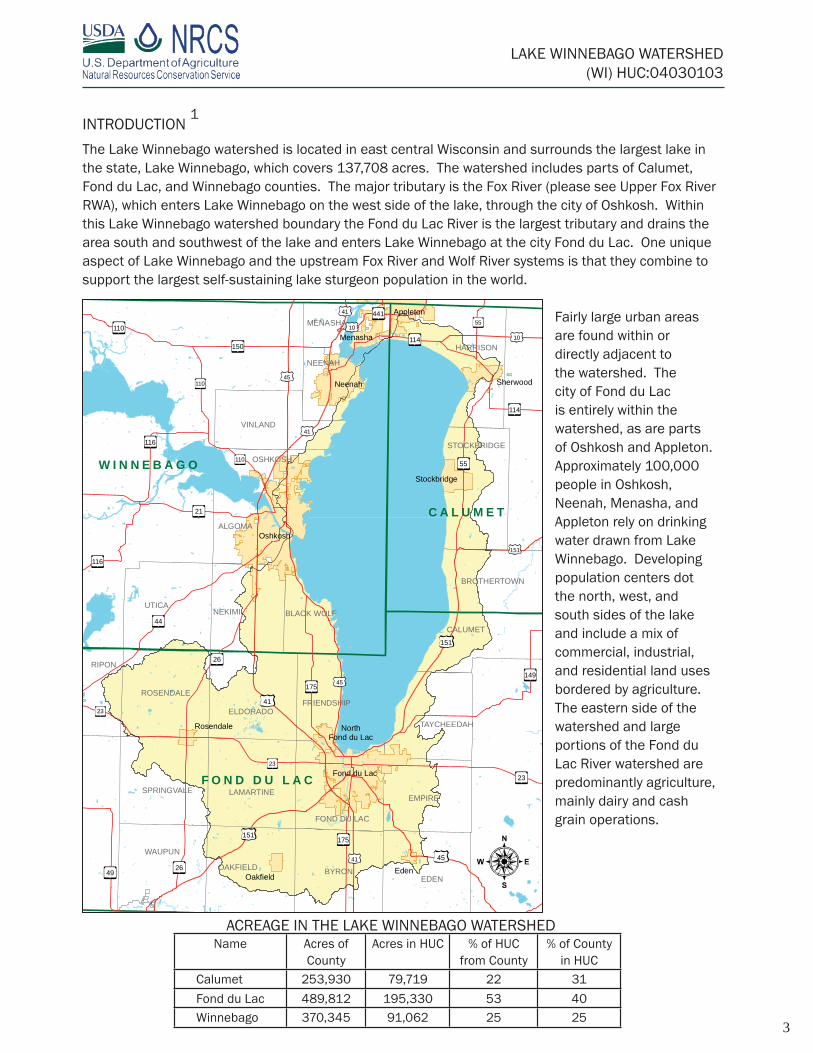
The Lake Winnebago watershed is located in east central Wisconsin and surrounds the largest lake in the state, Lake Winnebago, which covers 137,708 acres. The watershed includes parts of Calumet, Fond du Lac, and Winnebago counties. The major tributary is the Fox River (please see Upper Fox River RWA), which enters Lake Winnebago on the west side of the lake, through the city of Oshkosh. Within this Lake Winnebago watershed boundary the Fond du Lac River is the largest tributary and drains the area south and southwest of the lake and enters Lake Winnebago at the city Fond du Lac. One unique aspect of Lake Winnebago and the upstream Fox River and Wolf River systems is that they combine to support the largest self-sustaining lake sturgeon population in the world.
Fairly large urban areas are found within or directly adjacent to the watershed. The city of Fond du Lac is entirely within the watershed, as are parts of Oshkosh and Appleton. Approximately 100,000 people in Oshkosh, Neenah, Menasha, and Appleton rely on drinking water drawn from Lake Winnebago. Developing population centers dot the north, west, and south sides of the lake and include a mix of commercial, industrial, and residential land uses bordered by agriculture. The eastern side of the watershed and large portions of the Fond du Lac River watershed are predominantly agriculture, mainly dairy and cash grain operations.
1
45
41
23
110
110
45
41
1055
23
10
151
41
F O N D D U L A C
W I N N E B A G O
C A L U M E T
Oshkosh
Fond du Lac
Neenah
Menasha
Appleton
Sherwood
Stockbridge
Oakfield
Rosendale NorthFond du Lac
Eden
45
151
41
151
149
23
44
116
175
21
55
26
110
114150
114
116
175
441
4926
OSHKOSH
EDEN
UTICA
HARRISON
RIPON
BYRON
STOCKBRIDGE
CALUMET
NEKIMI
VINLAND
WAUPUN
EMPIRE
OAKFIELD
BROTHERTOWN
BLACK WOLF
ELDORADO
LAMARTINE
ROSENDALE
SPRINGVALE
FRIENDSHIP
TAYCHEEDAH
NEENAH
ALGOMA
FOND DU LAC
MENASHA
Name Acres of County
Acres in HUC % of HUC from County
% of County in HUC
Calumet 253,930 79,719 22 31
Fond du Lac 489,812 195,330 53 40Winnebago 370,345 91,062 25 25
ACREAGE IN THE LAKE WINNEBAGO WATERSHED

LAKE WINNEBAGO WATERSHED (WI) HUC:04030103
4
COMMON RESOURCE AREAS
Common Resource Area delineations are defi ned as a geographical areas where resource concerns, problems and treatment needs are similar. Common Resource areas are a subdivision of an existing Major Land Resource Area (MLRA). Landscape conditions, soil, climate and human considerations are used to determine the boundary of Common Resource Areas.
95A.WI1, DOOR/ESCANABA PENINSULAS AND LAKE PLAINS
Gently sloping well drained silty and loamy soils over bedrock with common wetlands and swamps. Mostly dairy and beef farm infl uenced cropland with some cash grain, grazing land, and fruit farms. Mixed deciduous and coniferous forest along the Lake Michigan shoreline. Signifi cant development pressure on the Green Bay shoreline. Primary resource concerns are groundwater and surface water quality, nutrient management, cropland and construction site erosion, and recreational use.
94B.WI2. SOUTHERN GREEN BAY LOBE MORAINE
Gently sloping to moderately steep hummocky moraine with scattered swamps. Mostly well drained loamy, clayey, and sandy soils with organic soils in the depressional areas. Major land uses are cash grain cropland and livestock agricultural enterprises, with signifi cant grazing land and deciduous forest. Includes the Wisconsin River valley and eastern Baraboo Hills. Primary resource concerns are cropland soil erosion, surface water quality and wetland habitat protection and restoration.
105.WI1
90A.WI1
95B.WI1
90B.WI1
95A.WI1
89.WI1
95B.
WI2
89.WI2
90A.
WI3
110.WI1
91B.WI1
94D.WI1
92.WI1
94B.
WI1
90A.WI2
104.WI1
90A.WI1
93B.WI2
90A.W
I1
95A.WI2
93B.WI1
94B.WI2
90A.WI1
90B.WI1
Lake
Win
neba
go
MAJOR LAND RESOURCE AREAS 2.

LAKE WINNEBAGO WATERSHED (WI) HUC:04030103
5
1200-12991100-11991000-1099
900-999799-899
< 799
Feet> 366336-366306-335275-305244-274 < 244
MetersElevation Map 3.
Fond du Lac
Winnebago
Calumet

LAKE WINNEBAGO WATERSHED (WI) HUC:04030103
6
Average Annual Precipitation Map (inches)
28-30”
30-32””
4
5LAND USE/ LAND COVER MAP
Type Acres %Row Crops 126,441 35Pasture/Hay 61,597 17Deciduous Forest 14,408 4Woody Wetlands 2,764 1Emergent Herbaceous Wetlands 3,261 1Open Water 132,591 36Evergreen Forest 1,496 0Grasslands/Herbaceous 4,131 1Mixed Forest 1,953 1Low Intensity Residential 7,559 2
Commercial/Industrial/Transportation 3,229 1Urban/Recreational Grasses 4,183 1High Intensity Residential 2,188 1Small Grains 64 0Quarries/Strip Mines, Gravel Pits 258 0Bare Rock/Sand/Clay 4 0
CALUMET
WINNEBAGO
FOND DU LAC
CALUMETWINNEBAGO
FOND DU LAC

LAKE WINNEBAGO WATERSHED (WI) HUC:04030103
7
For information on specifi c subwatersheds, 303(d) or Exceptional/Outstanding Resource Waters (ERW/ORW): http://dnr.wi.gov/org/water/wm/wqs/303d/faqs.html and http://dnr.wi.gov/org/gmu/gpsp/gpbasin/
6
Listed Waters303(d) Listed
Exceptional ResourceWaters
Sub Watersheds
Streams / Rivers
303-d Listed Waters Map
ASSESSMENT OF WATERS
Section 303(d) of the Clean Water Act states that water bodies that are not meeting their designated uses (fi shing, swimming), due to pollutants, must be placed on this list. The 303(d) impaired Waters List is updated every two years. Wisconsin is required to develop TMDLs, Total Maximum Daily Loads, for water bodies on this list. Exceptional Resource Waters
(ERW) provide valuable fi sheries, hydrologically or geologically unique features, outstanding recreational opportunities, unique environmental settings, and which are not signifi cantly impacted by human activities may be classifi ed as exceptional resource waters. Outstanding Resource waters (ORW) and ERW differ in that ORW do not have an associated point source discharge, where ERWs do.
Lake
Win
neba
go
CALUMET
WINNEBAGO
FOND DU LAC
6

LAKE WINNEBAGO WATERSHED (WI) HUC:04030103
8
303(
D) W
ATER
SSE
DIME
NTDE
GRAD
ED
HABI
TAT
DISS
OLVE
D OX
YGEN
AQUA
TIC
TOXI
CITY
MERC
URY
META
LS
OTHE
R TH
AN
MERC
URY
PHOS
PHO-
ROUS
PCBS
EUTR
O-PH
ICA-
TION
NUTR
I-EN
TSTU
RBID
ITY
ANDE
RSON
CRE
EKX
XX
DE N
EVEU
CRE
EKX
XFO
ND D
U LA
C RI
VER
XX
XFO
X R.
, LOW
ER S
EG 1
(1)
XX
XFO
X RI
VER,
OSH
KOSH
XLA
KE W
INNE
BAGO
XX
XX
XX
XMO
SHER
CRE
EKX
XPA
RSON
S CR
EEK
XX
SEVE
N MI
LE C
REEK
XX
VAN
DYNE
CRE
EKX
X
EXCE
PTIO
NAL R
ESOU
RCE
WAT
ERS
PARS
ON'S
CRE
EK (F
OND
DU LA
C,
BOTH
FEE
DER
STRE
AMS)
[TO
CTH
B]
OUTS
TAND
ING
RESO
URCE
WAT
ERS
NONE
LAKE WINNEBAGO WATERSHED (WI) HUC:04030103
9
Visit the online Web Soil Survey at:http://websoilsurvey.nrcs.usda.gov for offi cial and current USDA soil information as viewable maps and tables. Visit the Soil Data Mart at:http://soildatamart.usda.gov to download SSURGO certifi ed soil tabular and spatial data.
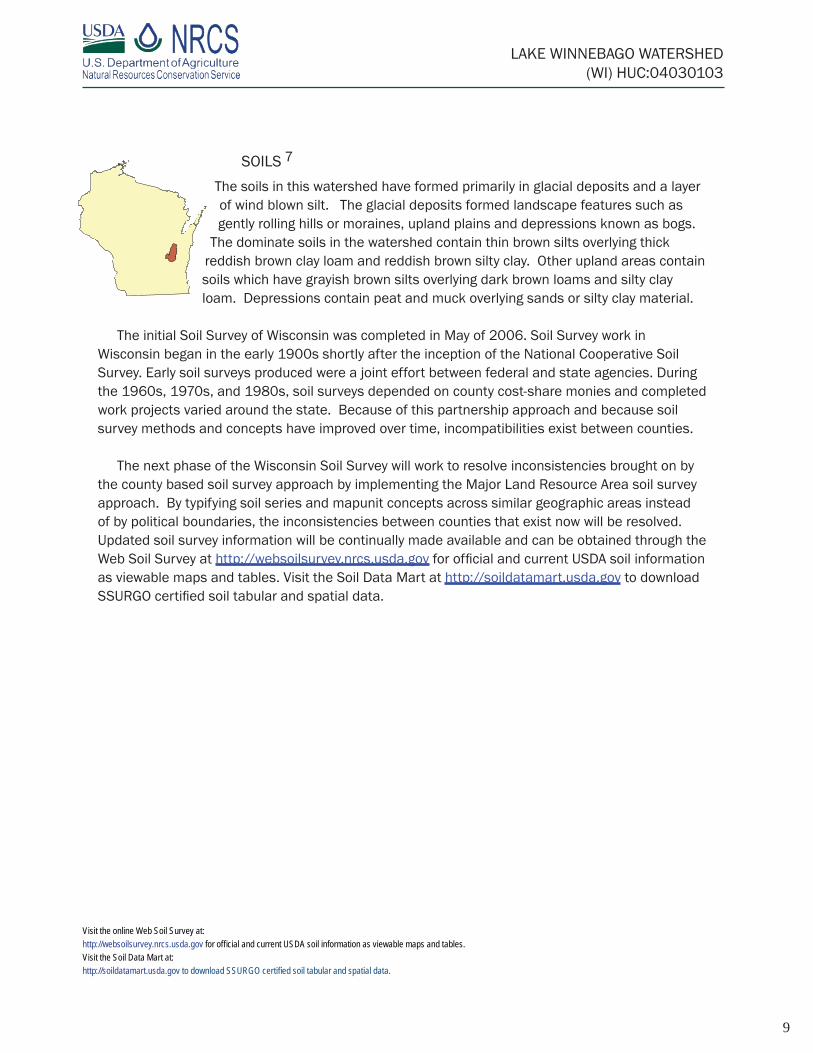
SOILS
The soils in this watershed have formed primarily in glacial deposits and a layer of wind blown silt. The glacial deposits formed landscape features such as gently rolling hills or moraines, upland plains and depressions known as bogs.
The dominate soils in the watershed contain thin brown silts overlying thick reddish brown clay loam and reddish brown silty clay. Other upland areas contain soils which have grayish brown silts overlying dark brown loams and silty clay loam. Depressions contain peat and muck overlying sands or silty clay material.
The initial Soil Survey of Wisconsin was completed in May of 2006. Soil Survey work in Wisconsin began in the early 1900s shortly after the inception of the National Cooperative Soil Survey. Early soil surveys produced were a joint effort between federal and state agencies. During the 1960s, 1970s, and 1980s, soil surveys depended on county cost-share monies and completed work projects varied around the state. Because of this partnership approach and because soil survey methods and concepts have improved over time, incompatibilities exist between counties.
The next phase of the Wisconsin Soil Survey will work to resolve inconsistencies brought on by the county based soil survey approach by implementing the Major Land Resource Area soil survey approach. By typifying soil series and mapunit concepts across similar geographic areas instead of by political boundaries, the inconsistencies between counties that exist now will be resolved. Updated soil survey information will be continually made available and can be obtained through the Web Soil Survey at http://websoilsurvey.nrcs.usda.gov for offi cial and current USDA soil information as viewable maps and tables. Visit the Soil Data Mart at http://soildatamart.usda.gov to download SSURGO certifi ed soil tabular and spatial data.
7
LAKE WINNEBAGO WATERSHED (WI) HUC:04030103
10
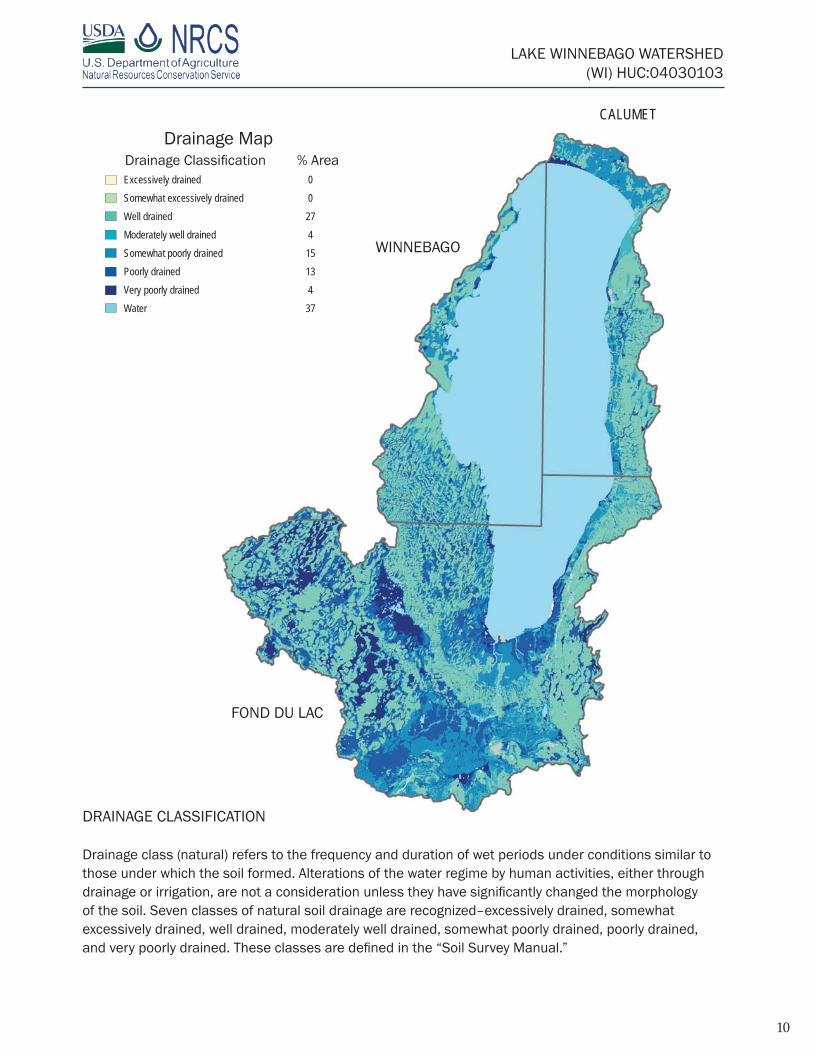
Drainage MapDrainage Classifi cation % AreaExcessively drained 0Somewhat excessively drained 0Well drained 27Moderately well drained 4Somewhat poorly drained 15Poorly drained 13Very poorly drained 4Water 37
CALUMET
WINNEBAGO
FOND DU LAC
DRAINAGE CLASSIFICATION
Drainage class (natural) refers to the frequency and duration of wet periods under conditions similar to those under which the soil formed. Alterations of the water regime by human activities, either through drainage or irrigation, are not a consideration unless they have signifi cantly changed the morphology of the soil. Seven classes of natural soil drainage are recognized–excessively drained, somewhat excessively drained, well drained, moderately well drained, somewhat poorly drained, poorly drained, and very poorly drained. These classes are defi ned in the “Soil Survey Manual.”
LAKE WINNEBAGO WATERSHED (WI) HUC:04030103
11
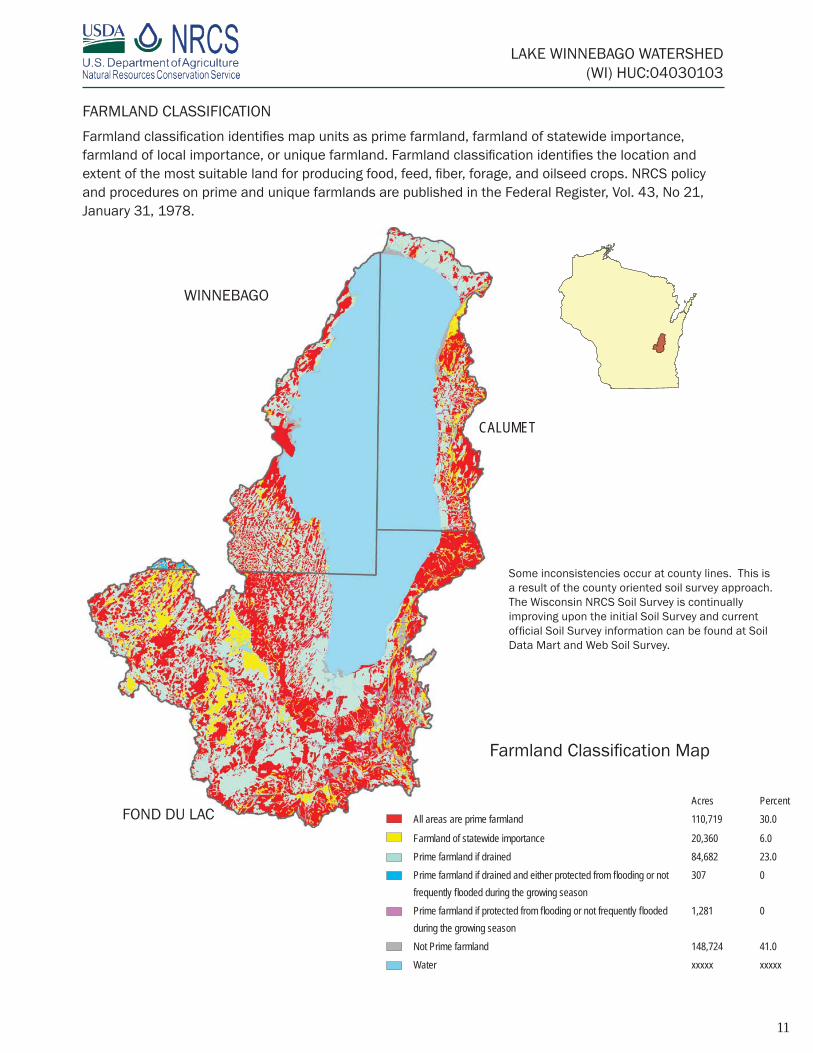
Farmland Classifi cation Map
Acres PercentAll areas are prime farmland 110,719 30.0
Farmland of statewide importance 20,360 6.0Prime farmland if drained 84,682 23.0Prime farmland if drained and either protected from fl ooding or not frequently fl ooded during the growing season
307 0
Prime farmland if protected from fl ooding or not frequently fl ooded during the growing season
1,281 0
Not Prime farmland 148,724 41.0Water xxxxx xxxxx
CALUMET
WINNEBAGO
FOND DU LAC
Some inconsistencies occur at county lines. This is a result of the county oriented soil survey approach. The Wisconsin NRCS Soil Survey is continually improving upon the initial Soil Survey and current offi cial Soil Survey information can be found at Soil Data Mart and Web Soil Survey.
FARMLAND CLASSIFICATION
Farmland classifi cation identifi es map units as prime farmland, farmland of statewide importance, farmland of local importance, or unique farmland. Farmland classifi cation identifi es the location and extent of the most suitable land for producing food, feed, fi ber, forage, and oilseed crops. NRCS policy and procedures on prime and unique farmlands are published in the Federal Register, Vol. 43, No 21, January 31, 1978.

LAKE WINNEBAGO WATERSHED (WI) HUC:04030103
12
Hydric Soils Map
Hydric Classifi cation
% Area
Not hydric 46
Partially hydric 0All hydric 17Water 36
CALUMET
WINNEBAGO
FOND DU LAC
HYDRIC SOILS
This rating provides an indication of the proportion of the map unit that meets criteria for hydric soils. Map units that are dominantly made up of hydric soils may have small areas, or inclusions of non-hydric soils in the higher positions on the landform, and map units dominantly made up of non–hydric soils may have inclusions of hydric soils in the lower positions on the landform.
Hydric soils are defi ned by the National Technical Committee for Hydric Soils (NTCHS) as soils that formed under conditions of saturation, fl ooding, or ponding long enough during the growing season to develop anaerobic conditions in the upper part (Federal Register 1994). These soils, under natural conditions, are either saturated or inundated long enough during the growing season to support the growth and reproduction of hydrophytic vegetation. If soils are wet enough for a long enough period of time to be considered hydric, they should exhibit certain properties that can be easily observed in the fi eld. These visible properties are indicators of hydric soils. The indicators used to make on site determinations of hydric soils are specifi ed in “Field Indicators of Hydric Soils in the United States” (Hurt and others, 2002).
LAKE WINNEBAGO WATERSHED (WI) HUC:04030103
13
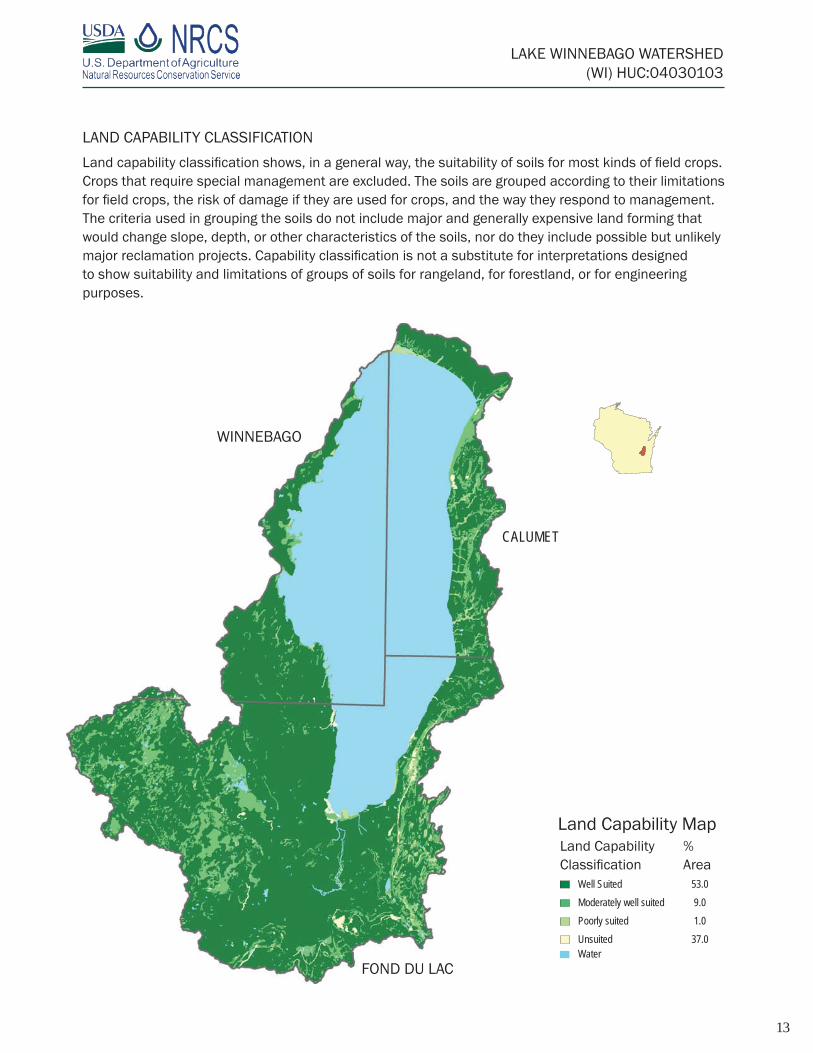
Land Capability MapLand Capability Classifi cation
% Area
Well Suited 53.0Moderately well suited 9.0Poorly suited 1.0UnsuitedWater
37.0
CALUMET
WINNEBAGO
FOND DU LAC
LAND CAPABILITY CLASSIFICATION
Land capability classifi cation shows, in a general way, the suitability of soils for most kinds of fi eld crops. Crops that require special management are excluded. The soils are grouped according to their limitations for fi eld crops, the risk of damage if they are used for crops, and the way they respond to management. The criteria used in grouping the soils do not include major and generally expensive land forming that would change slope, depth, or other characteristics of the soils, nor do they include possible but unlikely major reclamation projects. Capability classifi cation is not a substitute for interpretations designed to show suitability and limitations of groups of soils for rangeland, for forestland, or for engineering purposes.

LAKE WINNEBAGO WATERSHED (WI) HUC:04030103
14
POPULATION ETHNICITY
Total Population = 112,294Urban population = 90,685Rural Population = 21,614White alone = 106,698Hispanic or Latino = 2,372Two or more races = 1,090Black or African American alone = 1,324Some other race alone = 1,169American Indian and Alaska Native alone = 595Asian Alone = 1,410Native Hawaiian and Other Pacifi cIslander alone =19
URBAN POPULATION11 10
PRS AND OTHER DATA
The following table is a product of the NRCS Performance Results System (PRS) and refl ects progress made over the past several years on several key areas of conservation. The PRS provides support for reporting the development and delivery of conservation programs, analyzing and reporting progress, and management applications by NRCS and conservation partners. The public can generate additional reports by visiting the following link: http://ias.sc.egov.usda.gov/prsreport2006/
PRS PERFORMANCE MEASURES
PRS PERFORMANCE MEASURES FY99 FY00 FY01 FY02 FY03 FY04 FY05 TOTAL
TOTAL CONSERVATION SYSTEMS PLANNED (ACRES) 1,374 15,839 27,036 11,245 8,580 N/A 4,945 69,019
TOTAL CONSERVATION SYSTEMS APPLIED (ACRES) 52 11,853 24,123 11,245 6,549 N/A 5,597 59,419
CONSERVATION PRACTICESTOTAL WASTE MANAGEMENT (313) (NUMBERS) 0 4 0 1 0 0 1 6
RIPARIAN FOREST BUFFERS (391) (ACRES) 0 0 0 8 29 0 0 37
EROSION CONTROL TOTAL SOIL SAVED (TONS/YEAR) 1,491 13,948 9,742 15,098 11,540 N/A N/A 51,819
TOTAL NUTRIENT MANAGEMENT (590) (ACRES) 0 2,227 11,030 1,733 3,458 3,834 4,364 26,646
PEST MANAGEMENT SYSTEMS APPLIED (595A) (ACRES) 0 0 2,660 189 0 0 0 2,849
PRESCRIBED GRAZING 528A (ACRES) 0 0 0 224 13 0 72 309
TREE & SHRUB ESTABLISHMENT (612) (ACRES) 0 262 259 339 49 1 0 910
RESIDUE MANAGEMENT (329A-C) (ACRES) 0 11,051 17,270 5,931 3,408 2,458 1,841 41,959
TOTAL WILDLIFE HABITAT (644 - 645) (ACRES) 1,415 5,749 6,056 4,292 1,415 2,073 345 21,345
TOTAL WETLANDS CREATED, RESTORED, OR ENHANCED (ACRES)
112 321 274 130 118 3 90 1,048
ACRES ENROLLED IN FARMBILL PROGRAMSCONSERVATION RESERVE PROGRAM 52 2,103 738 1,665 949 N/A 59 5,566
WETLANDS RESERVE PROGRAM 0 7 0 0 0 N/A 142 149
ENVIRONMENTAL QUALITY INCENTIVES PROGRAM 0 0 0 0 913 N/A 1,902 2,815
WILDLIFE HABITAT INCENTIVE PROGRAM 0 0 0 0 0 N/A 0 0
FARMLAND PROTECTION PROGRAM 0 0 0 0 0 N/A 0 0
NAME 1990 2000 2004MEDIAN INCOME*
APPLETON 65,695 70,087 70,217 47,285
EDEN 610 687 725 41,579
FOND DU LAC 37,757 42,203 42,435 41,113
MENASHA 14,711 16,331 16,306 39,936
NEENAH 23,219 24,507 24,596 45,773
NORTH FOND DU LAC 4,292 4,557 5,024 44,327
OAKFIELD 1,003 1,012 1,021 51,053
OSHKOSH 55,006 62,916 63,485 37,636
ROSENDALE 777 923 1,035 52,448
SHERWOOD 837 1,550 2,290 63,913
STOCKBRIDGE 579 649 676 48,021
8

LAKE WINNEBAGO WATERSHED (WI) HUC:04030103
15
9
2002 AG CENSUS DATA CALUMET FOND DU LAC WINNEBAGO TOTALFARMS (NUMBER) 230 652 237 1,119LAND IN FARMS (ACRES) 47,199 137,370 41,919 226,489TOTAL CROPLAND (ACRES) 40,707 116,610 33,887 191,204IRRIGATED LAND (ACRES) 14 312 50 376PRINCIPAL OPERATOR BY PRIMARY OCCUPATION - FARMING (NUMBER)
161 437 143 741
FAR
MS
BY
SIZE
FARMS BY SIZE - 1 TO 10 ACRES 17 43 15 75FARMS BY SIZE - 11 TO 49 ACRES 61 135 62 258FARMS BY SIZE - 50 TO 179 ACRES 72 238 97 407FARMS BY SIZE - 180 TO 499 ACRES 60 179 43 283FARMS BY SIZE - 500 TO 999 ACRES 13 38 13 65FARMS BY SIZE - 1,000 ACRES OR MORE 7 19 6 32
LIVE
STO
CK A
ND
PO
ULT
RY
LIVESTOCK AND POULTRY - CATTLE AND CALVES INVENTORY (FARMS)
131 300 79 510
LIVESTOCK AND POULTRY - CATTLE AND CALVES INVENTORY - BEEF COWS (FARMS)
27 43 18 88
LIVESTOCK AND POULTRY - CATTLE AND CALVES INVENTORY - MILK COWS (FARMS)
71 178 36 285
LIVESTOCK AND POULTRY - HOGS AND PIGS INVEN-TORY (FARMS)
13 22 6 40
LIVESTOCK AND POULTRY - SHEEP AND LAMBS INVEN-TORY (FARMS)
6 16 4 26
LIVESTOCK AND POULTRY - LAYERS 20 WEEKS OLD AND OLDER INVENTORY (FARMS)
10 21 8 39
LIVESTOCK AND POULTRY - BROILERS AND OTHER MEAT-TYPE CHICKENS SOLD (FARMS)
4 4 3 12
SELE
CTED
CR
OPS
HAR
VEST
ED
SELECTED CROPS HARVESTED - CORN FOR GRAIN (ACRES)
9,266 34,642 9,376 53,283
SELECTED CROPS HARVESTED - CORN FOR SILAGE OR GREENCHOP (ACRES)
4,543 8,680 2,083 15,307
SELECTED CROPS HARVESTED - WHEAT FOR GRAIN, ALL (ACRES)
2,711 4,954 1,872 9,537
SELECTED CROPS HARVESTED - WHEAT FOR GRAIN, ALL - WINTER WHEAT FOR GRAIN (ACRES)
0 0 0 0
SELECTED CROPS HARVESTED - WHEAT FOR GRAIN, ALL - SPRING WHEAT FOR GRAIN (ACRES)
0 0 0 0
SELECTED CROPS HARVESTED - OATS FOR GRAIN (ACRES)
858 2,475 477 3,810
SELECTED CROPS HARVESTED - BARLEY FOR GRAIN (ACRES)
99 324 4 427
SELECTED CROPS HARVESTED - SOYBEANS FOR BEANS (ACRES)
7,772 19,082 7,918 34,772
SELECTED CROPS HARVESTED - FORAGE - LAND USED FOR ALL HAY AND ALL HAYLAGE, GRASS SILAGE, AND GREENCHOP (SEE TEXT) (ACRES)
11,937 28,242 6,677 46,856
SELECTED CROPS HARVESTED - VEGETABLES HAR-VESTED FOR SALE (SEE TEXT) (ACRES)
1,435 6,817 236 8,489
SELECTED CROPS HARVESTED - LAND IN ORCHARDS (ACRES)
21 41 14 76
CENSUS AND SOCIAL DATA (RELEVANT)
There are 1,119 farms in the watershed, covering a total of 226,489 acres. Average farm size in the watershed is 202 acres compared to a statewide average of 201 acres in Wisconsin. Please refer to the tables below for more detailed information or visit the web site of the Wisconsin Offi ce of the National Agricultural Statistics Service at: http:// www.nass.usda.gov/Statistics_by_State/Wisconsin/index.asp
LAKE WINNEBAGO WATERSHED (WI) HUC:04030103
16
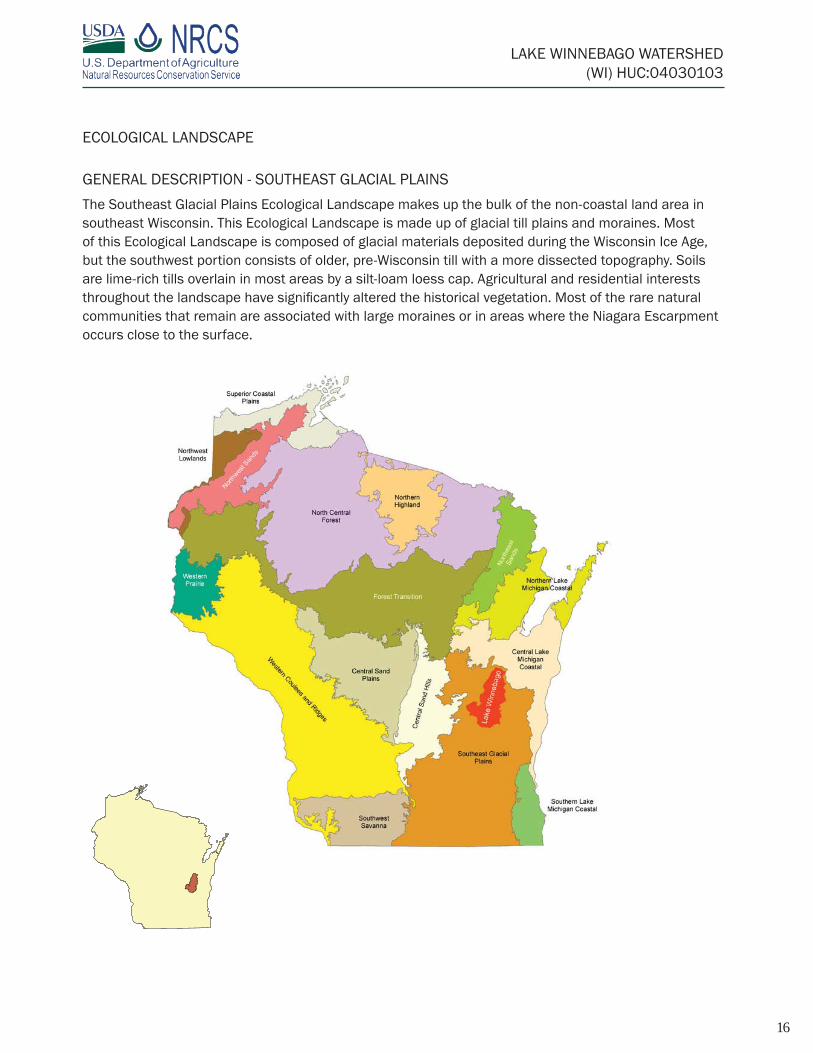
ECOLOGICAL LANDSCAPE
GENERAL DESCRIPTION - SOUTHEAST GLACIAL PLAINS
The Southeast Glacial Plains Ecological Landscape makes up the bulk of the non-coastal land area in southeast Wisconsin. This Ecological Landscape is made up of glacial till plains and moraines. Most of this Ecological Landscape is composed of glacial materials deposited during the Wisconsin Ice Age, but the southwest portion consists of older, pre-Wisconsin till with a more dissected topography. Soils are lime-rich tills overlain in most areas by a silt-loam loess cap. Agricultural and residential interests throughout the landscape have signifi cantly altered the historical vegetation. Most of the rare natural communities that remain are associated with large moraines or in areas where the Niagara Escarpment occurs close to the surface.

LAKE WINNEBAGO WATERSHED (WI) HUC:04030103
17
RESOURCE CONCERNS
Primary resource concerns from agriculture include cropland erosion and nutrient losses, barnyard runoff, and overgrazed streambanks. These issues lead to excess sediment and nutrients in surface waters and create algal blooms, turbid water, and degraded fi sh and wildlife habitat.
Urban development, urban stormwater runoff, construction site erosion, and shoreline erosion are the major non-agricultural resource concerns. Invasive species in uplands, remaining wetlands, and water bodies also present a challenge to resource managers.
This region of the state also has health concerns related to the high levels of arsenic in some wells. The element naturally occurs in the St. Peter sandstone formation but increased groundwater use and the drawing down the water table exacerbates the problem by exposing more of the sandstone to oxygen, further increasing levels of arsenic in the groundwater.
WATERSHED PROJECTS, STUDIES, MONITORING, ETC.
One Wisconsin Priority Watershed Project has been completed, the Lake Winnebago East watershed, while the Fond du Lac River project will continue through 2009. These projects provided technical assistance and cost-sharing for the installation of best management conservation practices.
The Wisconsin Department of Natural Resources conducts water quality monitoring in many streams and lakes within the watershed each year.
WATERSHED ASSESSMENT
To assess a watershed’s agricultural nonpoint pollution potential, a model was used to generate a watershed assessment score relative to other 8-digit watersheds in Wisconsin. Factors used in the model include acres of cropland, acres of highly erodible land (HEL), and the number of animal units in the watershed. Scores ranged from 0.0 (lowest conservation need) to 24.2 (highest conservation need). The scores may be useful in determining funding allocations on a watershed basis for agricultural nonpoint pollution control initiatives. The model does not attempt to measure pollution levels and does not refl ect pollution potential from point sources of pollution or other nonpoint pollution sources beyond the above criteria.
The watershed assessment score for the Lake Winnebago is 3.8.

LAKE WINNEBAGO WATERSHED (WI) HUC:04030103
18
PARTNER GROUPS
• County Land Conservation Departments (Directory Link) http://www.datcp.state.wi.us/arm/agriculture/land-water/conservation/pdf/ar-pub-119web_dec2005.pdf )
• River Alliance http://www.wisconsinrivers.org/
• Sturgeon for Tomorrow
• Trout Unlimited o Central WI Chapter http://www.cwtu.org/ o Aldo Leopold Chapter http://www.alctu.com/
• USDA Farm Service Agency http://www.fsa.usda.gov/wi/news/default.asp
• US Fish and Wildlife Service http://www.fws.gov/midwest/maps/wisconsin.htm
• UW Cooperative Extension http://www.uwex.edu/ces/ and http://basineducation.uwex.edu/
• Wisconsin Department of Agriculture, Trade, and Consumer Protection http://www.datcp.state.wi.us
• Wisconsin Department of Natural Resources http://dnr.wi.gov/

LAKE WINNEBAGO WATERSHED (WI) HUC:04030103
19
FOOTNOTES/BIBLIOGRAPHY
All data is provided “as is.” There are no warranties, express or implied, including the warranty of fi tness for a particular purpose, accompanying this document. Use for general planning purposes only.
1. Introduction and the description of resource concerns were derived from a report issued by the Wisconsin Department of Natural Resources titled “The State of the Basin Reports”, 4/12, WDNR.
2. Common Resource Area (CRA) Map delineations are defi ned as geographical areas where resource concerns, problems, or treatment needs are similar. It is considered a subdivision of an existing Major Land Resource Area (MLRA) map delineation or polygon. Landscape conditions, soil, climate, human considerations, and other natural resource information are used to determine the geographic boundaries of a Common Resource Area. Online linkage: http://soils.usda.gov/survey/geography/cra.html.
3. The relief map was created using the National Elevation Dataset (NED) 1 arc second, approximately 30 meters, digital elevation model (DEM) raster product assembled by the U.S. Geological Survey (USGS). A hillshade grid was derived from the 30m DEM and draped over the DEM to symbolize the map and create a 3-D effect. The data was downloaded from the NRCS Geospatial Data Gateway http://datagateway.nrcs.usda.gov/. For more information about NED visit http://ned.usgs.gov/.
4. Average Annual Precipitation data was originated by Chris Daly of Oregon State University and George Taylor of the Oregon Climate Service at Oregon State University and published by the Water and Climate Center of the Natural Resources Conservation Service in 1998. Annual precipitation data was derived from the climatological period of 1961-1990. Parameter-elevation Regressions on Independent Slopes Model (PRISM) derived raster data is the underlying data set from which the polygons and vectors were created. For more information about PRISM visit http://www.ocs.orst.edu/prism/prism_new.html. Precipitation data was downloaded from the NRCS Geospatial Data Gateway http://datagateway.nrcs.usda.gov/.
5 The Land Use/Land Cover data was generated from the National Land Cover Dataset (NLCD) compiled from Landsat satellite TM imagery (circa 1992) with a spatial resolution of 30 meters and supplemented by various ancillary data (where available). The data was assembled by the USGS and published in June of 1999. The analysis and interpretation of the satellite imagery was conducted using very large, sometimes multi-state image mosaics. For more information about NLCD visit http://edcwww.cr.usgs.gov/programs/lccp/nationallandcover.html. The data was downloaded from the NRCS Geospatial Data Gateway http://datagateway.nrcs.usda.gov/.
6. 303(d) listed streams were derived from the Water Quality Standards Section of the Wisconsin Department of Natural Resources (WIDNR) website: http://dnr.wi.gov/org/water/wm/wqs/303d/Lists303d/Approved_2004_303(d)_list.pdf. For more information about the individual sub-watersheds visit http://dnr.wi.gov/org/gmu/gpsp/gpbasin/index.htm. For a list and explanation of Outstanding and Exceptional Resource Waters visit: http://dnr.wi.gov/org/water/wm/wqs/orwerw/.
LAKE WINNEBAGO WATERSHED (WI) HUC:04030103
20
7. Soil Survey Geographic Database (SSURGO) tabular and spatial data were downloaded for the following surveys: Calumet Co., WI (WI015) Published 2006 03 03
Fond du Lac Co., WI (WI039) Published 2006 01 20 Winnebago Co, WI (WI139) Published 2006 01 20 Metadata and SSURGO data for the aforementioned surveys were downloaded from the
NRCS Soil Data Mart at http://soildatamart.nrcs.usda.gov. Component and layer tables from the tabular data were linked to the spatial data to derive the soil classifi cations found in this section. Visit the online Web Soil Survey at http://websoilsurvey.nrcs.usda.gov for offi cial and current USDA soil information as viewable maps and tables.
8. Performance Results System (PRS) data was extracted from the PRS homepage by year, conservation systems and practices and Hydrologic Unit Code (HUC) level. HUC level reporting was not available where N/A is listed. For more information on these and other performance reports visit http://ias.sc.egov.usda.gov/prshome/.
9. Ag Census data were downloaded from the National Agricultural Statistics Service (NASS) Website and the data were adjusted by percent of HUC in the county. For more information on individual census queries visit the NASS website at http://www.nass.usda.gov/.
10. Population ethnicity data were extracted from the Census 2000 Summary File 3 compiled by the U.S. Census Bureau. The data were adjusted by Block Group percentage in the HUC. Population items were selected from the SF30001 table. For more information on census data and defi nitions visit http://www.census.gov/Press-Release/www/2002/sumfi le3.html.
11. Urban population and median household income data were derived from the American FactFinder assembled by the U.S. Census Bureau. American FactFinder is a quick source for population, housing, income and geographic data. For other census items and trends visit http://factfi nder.census.gov/home/saff/main.html?_lan