lakshmi n. mittal -...
TRANSCRIPT

Australia: Crown resort in Sydney Courtesy of WilkinsonEyre, Architect
European CEO ConferenceParis, 12 June 2018
Lakshmi N. MittalChairman and Chief Executive Officer

Disclaimer
Forward-Looking Statements
This document may contain forward-looking information and statements about ArcelorMittal and its subsidiaries.
These statements include financial projections and estimates and their underlying assumptions, statements
regarding plans, objectives and expectations with respect to future operations, products and services, and
statements regarding future performance. Forward-looking statements may be identified by the words “believe”,
“expect”, “anticipate”, “target” or similar expressions. Although ArcelorMittal’s management believes that the
expectations reflected in such forward-looking statements are reasonable, investors and holders of ArcelorMittal’s
securities are cautioned that forward-looking information and statements are subject to numerous risks and
uncertainties, many of which are difficult to predict and generally beyond the control of ArcelorMittal, that could cause
actual results and developments to differ materially and adversely from those expressed in, or implied or projected by,
the forward-looking information and statements. These risks and uncertainties include those discussed or identified
in the filings with the Luxembourg Stock Market Authority for the Financial Markets (Commission de Surveillance du
Secteur Financier) and the United States Securities and Exchange Commission (the “SEC”) made or to be made by
ArcelorMittal, including ArcelorMittal’s latest Annual Report on Form 20-F on file with the SEC. ArcelorMittal
undertakes no obligation to publicly update its forward-looking statements, whether as a result of new information,
future events, or otherwise.
1
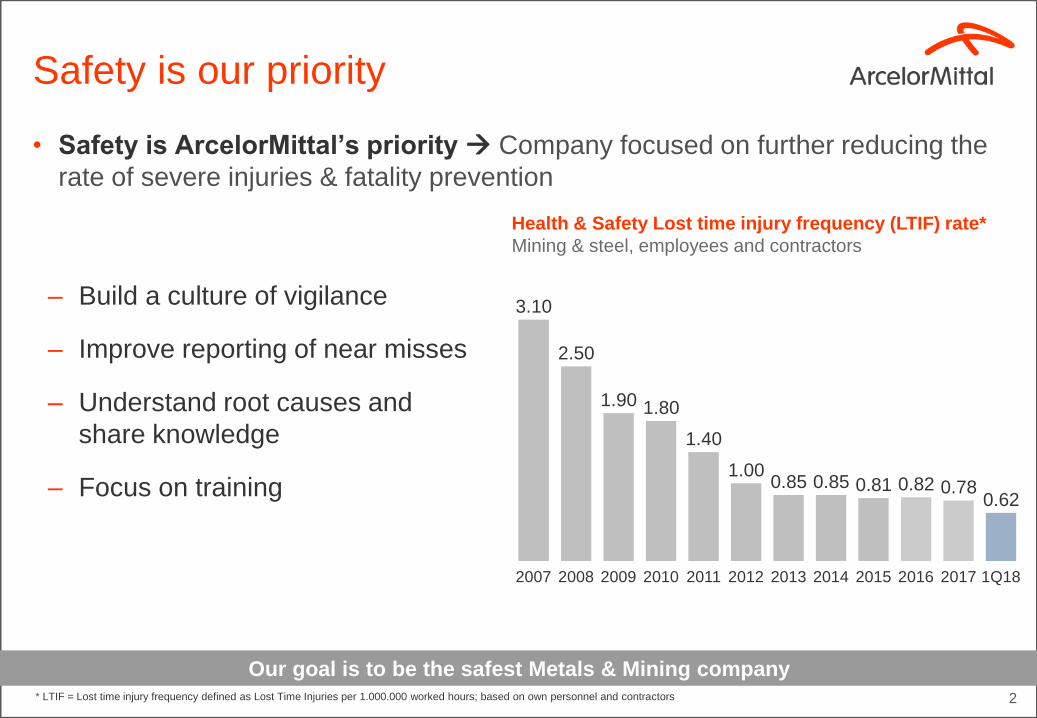
3.10
2.50
1.90 1.80
1.40
1.000.85 0.85 0.81 0.82 0.78
0.62
20102007 2008 2009 2011 20132012 2014 2015 2016 2017 1Q18
2
Health & Safety Lost time injury frequency (LTIF) rate*
Mining & steel, employees and contractors
* LTIF = Lost time injury frequency defined as Lost Time Injuries per 1.000.000 worked hours; based on own personnel and contractors
Safety is our priority
Our goal is to be the safest Metals & Mining company
• Safety is ArcelorMittal’s priority Company focused on further reducing the
rate of severe injuries & fatality prevention
– Build a culture of vigilance
– Improve reporting of near misses
– Understand root causes and
share knowledge
– Focus on training
3
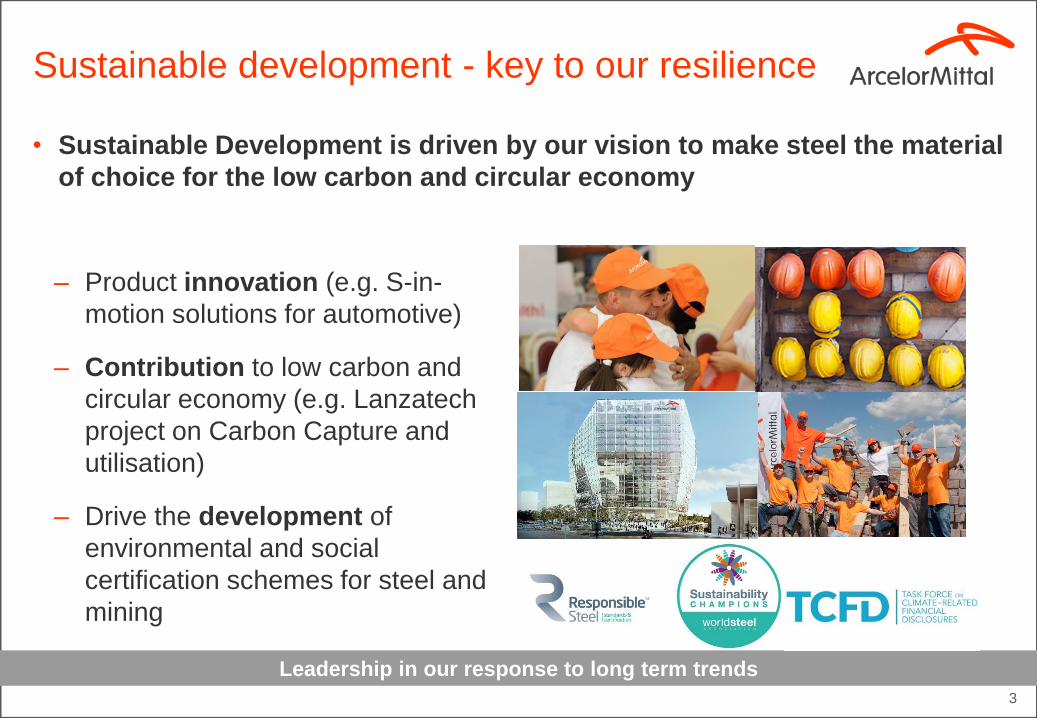
Leadership in our response to long term trends
Sustainable development - key to our resilience
– Product innovation (e.g. S-in-
motion solutions for automotive)
– Contribution to low carbon and
circular economy (e.g. Lanzatech
project on Carbon Capture and
utilisation)
– Drive the development of
environmental and social
certification schemes for steel and
mining
• Sustainable Development is driven by our vision to make steel the material
of choice for the low carbon and circular economy

4
Capital allocation policy to maximise value for shareholders
Disciplined capital allocation
Targeting $6bn net financial debt (NFD) to ensure lowest cost balance
sheet Maximise FCF potentialRobust balance sheet
Invest in strengths
Returns to
shareholders
Investing in opportunities with focus and discipline Grow FCF
potential of the business
Base dividend reinstated Capital returns to shareholders will
increase to a portion of FCF once NFD target achieved
• Deleveraging remains our priority building the strongest platform for
consistent capital returns to shareholders
5
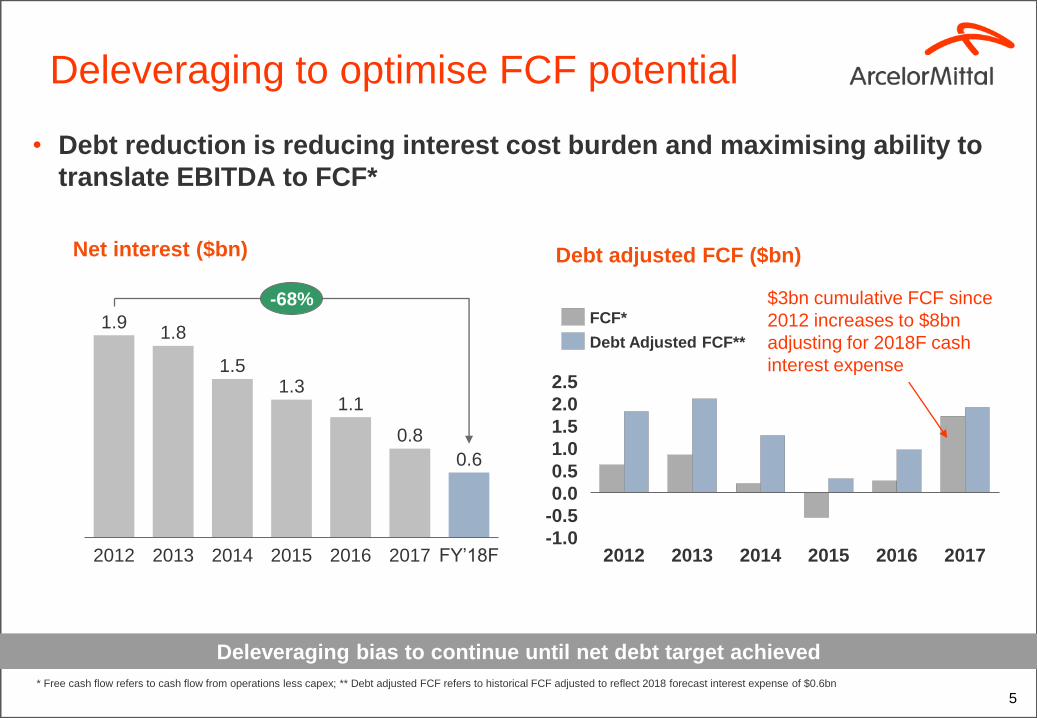
Deleveraging bias to continue until net debt target achieved
Deleveraging to optimise FCF potential
1.91.8
1.51.3
1.1
0.8
0.6
201720152012 20142013 2016 FY’18F
-68%
Net interest ($bn) Debt adjusted FCF ($bn)
2.0
-1.0
0.0
1.0
-0.5
0.5
1.5
2.5
201420132012 2015 2016 2017
FCF*
Debt Adjusted FCF**
$3bn cumulative FCF since
2012 increases to $8bn
adjusting for 2018F cash
interest expense
* Free cash flow refers to cash flow from operations less capex; ** Debt adjusted FCF refers to historical FCF adjusted to reflect 2018 forecast interest expense of $0.6bn
• Debt reduction is reducing interest cost burden and maximising ability to
translate EBITDA to FCF*
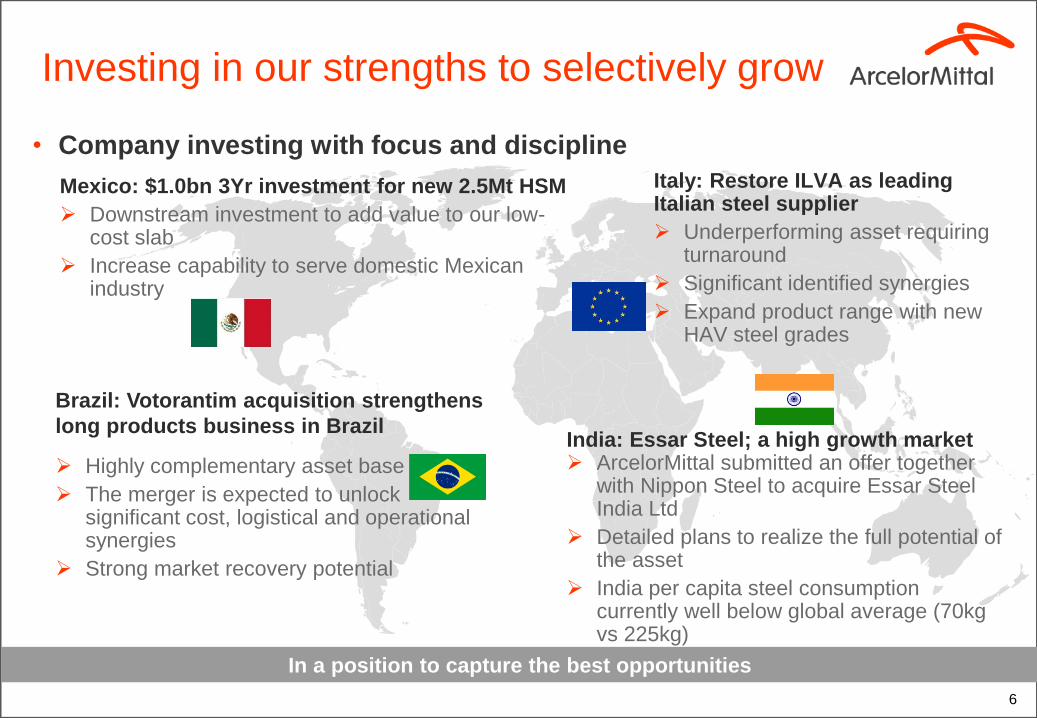
In a position to capture the best opportunities
6
Mexico: $1.0bn 3Yr investment for new 2.5Mt HSM
➢ Downstream investment to add value to our low-cost slab
➢ Increase capability to serve domestic Mexican industry
Brazil: Votorantim acquisition strengthens
long products business in Brazil
➢ Highly complementary asset base
➢ The merger is expected to unlock significant cost, logistical and operational synergies
➢ Strong market recovery potential
Italy: Restore ILVA as leading Italian steel supplier
➢ Underperforming asset requiring turnaround
➢ Significant identified synergies
➢ Expand product range with new HAV steel grades
India: Essar Steel; a high growth market ➢ ArcelorMittal submitted an offer together
with Nippon Steel to acquire Essar Steel India Ltd
➢ Detailed plans to realize the full potential of the asset
➢ India per capita steel consumption currently well below global average (70kg vs 225kg)
Investing in our strengths to selectively grow
• Company investing with focus and discipline

7
Global steel capacity utilisation structurally higher
Structural improvement: Steel industry
– Global steel industry operating at high rates of capacity utilisation
higher steel spreads
– More effort required in the ongoing government support to protect
against global unfair trade
• Structurally higher global capacity utilisation several government
initiatives to protect against global unfair trade
8
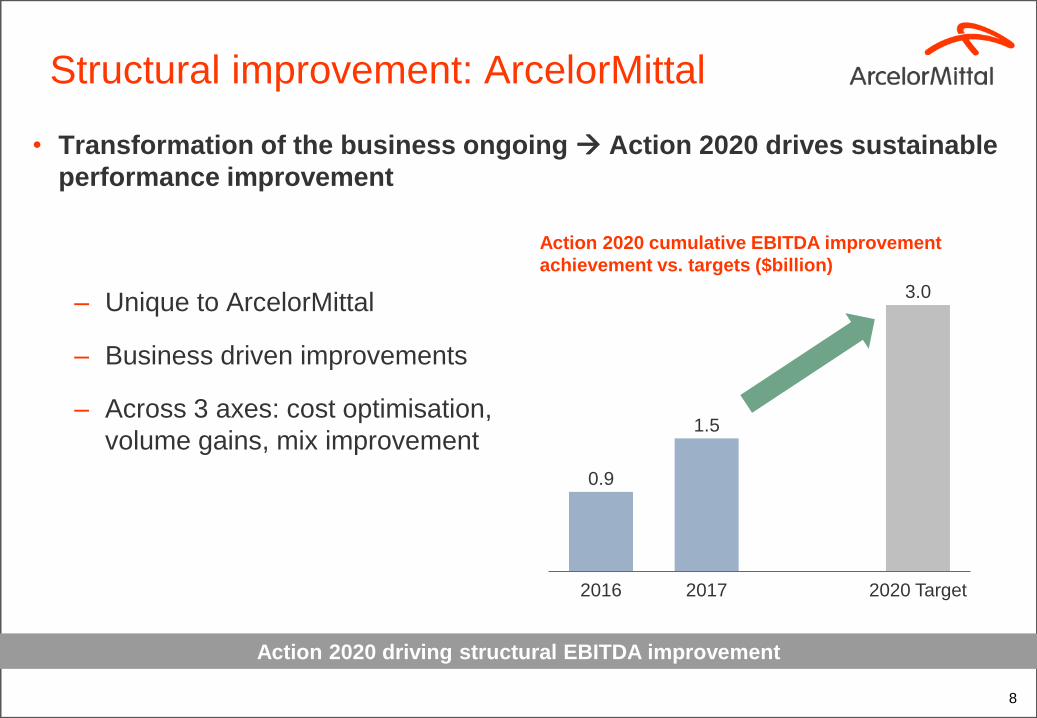
Action 2020 driving structural EBITDA improvement
Structural improvement: ArcelorMittal
0.9
1.5
3.0
2016 2017 2020 Target
Action 2020 cumulative EBITDA improvement
achievement vs. targets ($billion)
– Unique to ArcelorMittal
– Business driven improvements
– Across 3 axes: cost optimisation,
volume gains, mix improvement
• Transformation of the business ongoing Action 2020 drives sustainable
performance improvement

USArcelorMittal
+1.5% to +2.5%WSA
+2.7%
EU28ArcelorMittal
+1.0% to +2.0%WSA
+2.0%
ChinaArcelorMittal
-0.5% to +0.5%WSA 0%
BrazilArcelorMittal
+6.5% to +7.5%WSA - Central & South America
+6.2%
CISArcelorMittal
+2.0% to +3.0%WSA
+2.3%
World ex-ChinaArcelorMittal
+3.0% to +4.0%WSA
+3.4%
WorldArcelorMittal
+1.5% to +2.5%WSA
+1.8%
9
Strong global economic fundamentals support further expected steel demand expansion in 2018
Demand outlook remains favourable
• Global steel outlook remains positive Growing demand in ArcelorMittal's
core markets
ArcelorMittal & WSA demand forecasts 2018
ArcelorMittal estimates; Worldsteel Association (WSA) Short range outlook, April 17, 2018

• Operating results are beginning to reflect the structural improvements to the
business and the industry
10
Performance significantly improved
EBITDA (US$ billion)
Significant EBITDA improvement
– ROE* of 12% in 2017
– ROCE** of 10% in 2017
– 1H’18* consensus EBITDA
annualising at $11bn
– All segments supporting the
improved group performance
2.7
4.3
5.4
1H’16 1H’17 1H’18 cons***
+100%
* Return on equity (ROE) is defined as net income divided by total shareholder equity; **Return on capital employed (ROCE) is defined as operating income plus impairments, income from equity method investments and other income minus tax (20% rate) divided by capital employed (defined as total equity plus net debt); Both ROE and ROCE calculated FY’17 basis ***Includes 1Q18 reported EBITDA and 2Q18 consensus based on ArcelorMittal analysts update from May 1, 2018

APPENDIXSection 1

Trade cases: Ongoing focus
12
EUROPE
• All key flat rolled steel products AD/CVD cases have been implemented.
• Monitoring for unfairly traded imports ongoing
• In response of the threat of imports into the EU, on March 26, 2018 the EU commission initiated an investigation on
safeguard duties on 26 products (19 Long, flat and Stainless steel products, and 7 tubes and other steel products)
US
• All key flat rolled steel products AD/CVD cases have been implemented.
• Anti-circumvention investigations initiated by DOC for CRC and CORE imports from China (through Vietnam).
DOC affirmative preliminary determination announced Dec 6, 2017. Final affirmative determination received on May
17, 2018
SECTION 232
• 25% tariffs imposed on all steel product categories on March 23, 2018.
• South Korea: Agreed quota of 70% of 2015-2017 average export volumes into US
• Brazil: Agreed quota of 70% of 2015-2017 average export volumes into US for finished products and 100% of
2015-2017 average export volumes into US for semi-finished products)
• 25% tariffs imposed on steel products in Europe, Canada and Mexico effective June 1, 2018
• Australia completely exempt from tariffs and quotas
Comprehensive solution for unfairly traded imports across geographies still required
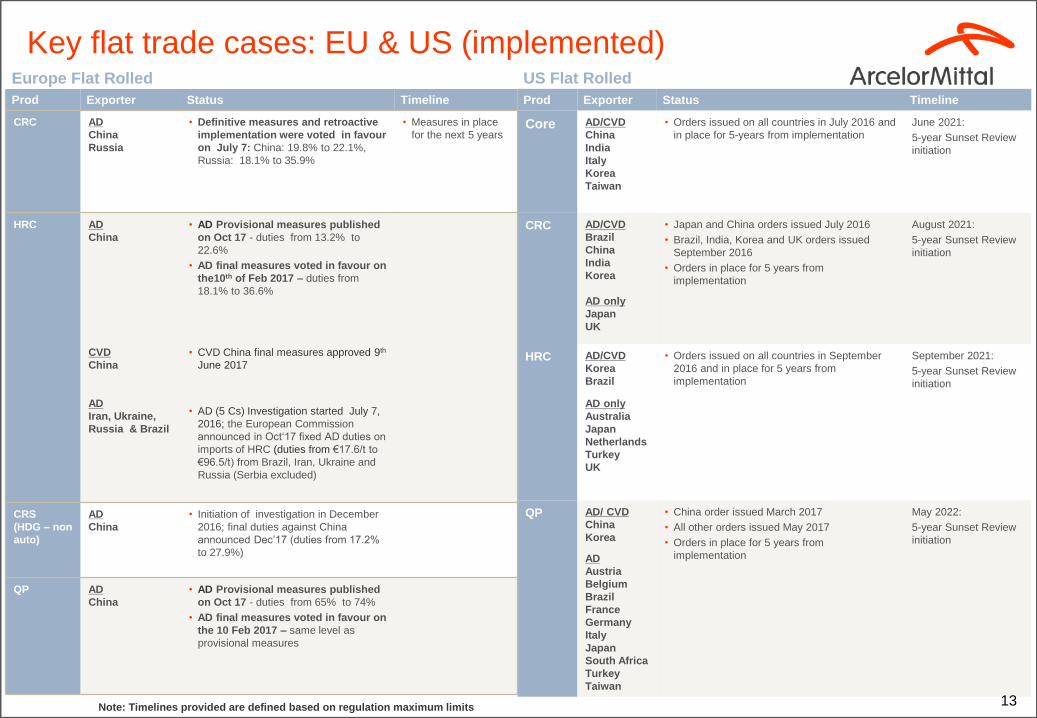
Key flat trade cases: EU & US (implemented)US Flat Rolled
Prod Exporter Status Timeline
Core AD/CVD
China
India
Italy
Korea
Taiwan
• Orders issued on all countries in July 2016 and
in place for 5-years from implementation
June 2021:
5-year Sunset Review
initiation
CRC AD/CVD
Brazil
China
India
Korea
AD only
Japan
UK
• Japan and China orders issued July 2016
• Brazil, India, Korea and UK orders issued
September 2016
• Orders in place for 5 years from
implementation
August 2021:
5-year Sunset Review
initiation
HRC AD/CVD
Korea
Brazil
AD only
Australia
Japan
Netherlands
Turkey
UK
• Orders issued on all countries in September
2016 and in place for 5 years from
implementation
September 2021:
5-year Sunset Review
initiation
QP AD/ CVD
China
Korea
AD
Austria
Belgium
Brazil
France
Germany
Italy
Japan
South Africa
Turkey
Taiwan
• China order issued March 2017
• All other orders issued May 2017
• Orders in place for 5 years from
implementation
May 2022:
5-year Sunset Review
initiation
Europe Flat Rolled
Prod Exporter Status Timeline
CRC AD
China
Russia
• Definitive measures and retroactive
implementation were voted in favour
on July 7: China: 19.8% to 22.1%,
Russia: 18.1% to 35.9%
• Measures in place
for the next 5 years
HRC AD
China
CVD
China
AD
Iran, Ukraine,
Russia & Brazil
• AD Provisional measures published
on Oct 17 - duties from 13.2% to
22.6%
• AD final measures voted in favour on
the10th of Feb 2017 – duties from
18.1% to 36.6%
• CVD China final measures approved 9th
June 2017
• AD (5 Cs) Investigation started July 7,
2016; the European Commission
announced in Oct‘17 fixed AD duties on
imports of HRC (duties from €17.6/t to
€96.5/t) from Brazil, Iran, Ukraine and
Russia (Serbia excluded)
CRS
(HDG – non
auto)
AD
China
• Initiation of investigation in December
2016; final duties against China
announced Dec’17 (duties from 17.2%
to 27.9%)
QP AD
China
• AD Provisional measures published
on Oct 17 - duties from 65% to 74%
• AD final measures voted in favour on
the 10 Feb 2017 – same level as
provisional measures
13Note: Timelines provided are defined based on regulation maximum limits
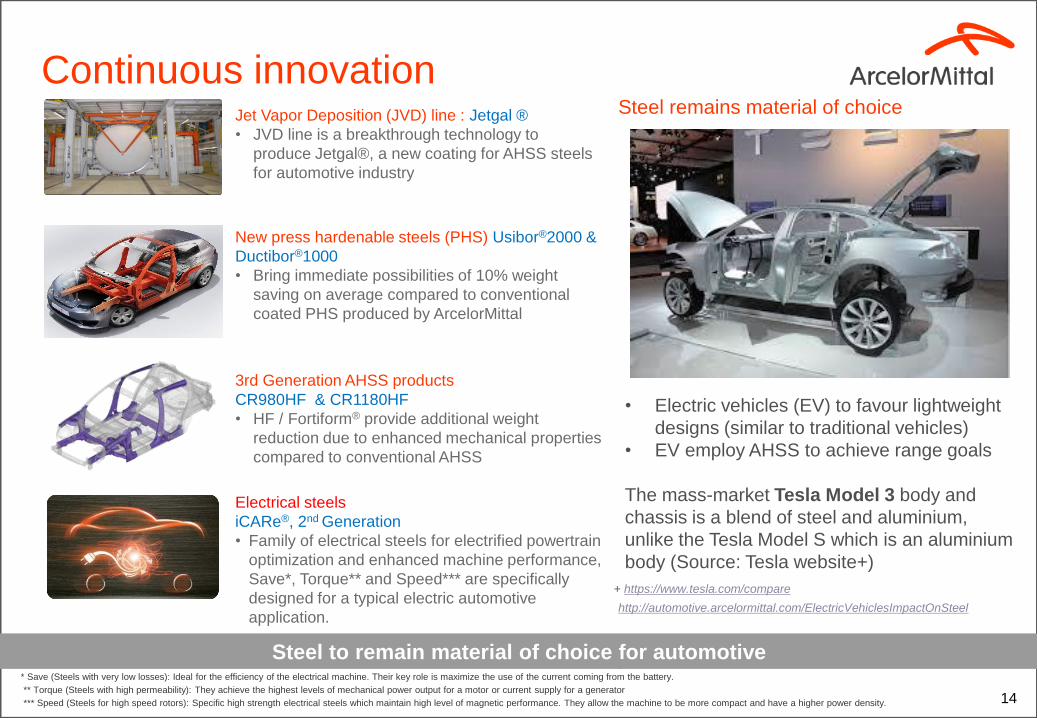
Continuous innovation
3rd Generation AHSS products
CR980HF & CR1180HF
• HF / Fortiform® provide additional weight
reduction due to enhanced mechanical properties
compared to conventional AHSS
New press hardenable steels (PHS) Usibor®2000 &
Ductibor®1000
• Bring immediate possibilities of 10% weight
saving on average compared to conventional
coated PHS produced by ArcelorMittal
Jet Vapor Deposition (JVD) line : Jetgal ®
• JVD line is a breakthrough technology to
produce Jetgal®, a new coating for AHSS steels
for automotive industry
Electrical steels
iCARe®, 2nd Generation
• Family of electrical steels for electrified powertrain
optimization and enhanced machine performance,
Save*, Torque** and Speed*** are specifically
designed for a typical electric automotive
application.
-
Steel remains material of choice
• Electric vehicles (EV) to favour lightweight
designs (similar to traditional vehicles)
• EV employ AHSS to achieve range goals
The mass-market Tesla Model 3 body and
chassis is a blend of steel and aluminium,
unlike the Tesla Model S which is an aluminium
body (Source: Tesla website+)
Steel to remain material of choice for automotive
14
* Save (Steels with very low losses): Ideal for the efficiency of the electrical machine. Their key role is maximize the use of the current coming from the battery.
** Torque (Steels with high permeability): They achieve the highest levels of mechanical power output for a motor or current supply for a generator
*** Speed (Steels for high speed rotors): Specific high strength electrical steels which maintain high level of magnetic performance. They allow the machine to be more compact and have a higher power density.
+ https://www.tesla.com/compare
http://automotive.arcelormittal.com/ElectricVehiclesImpactOnSteel

15
Votorantim acquisition approved
- creates new Brazil Longs market leader• Consolidating the long products market in Brazil by combining Votorantim into
our business with combined annual crude steel capacity of 5.1Mt.
• ArcelorMittal becomes long product market leader in Brazil absorbing 12%
market share
• Combined businesses production facilities are geographically complementary,
enabling higher service level to customers, economies of scale, higher utilization
and efficiencies.
• ~$110m of identified synergies to drive value creation
Unique opportunity to strengthen AM’s presence in one of the premier emerging markets
ArcelorMittal & Votorantim long businesses Combined operating footprint crude steel capacity (Mt)
~$110m synergies
Resende
Barra Mansa
✓ Commercial
✓ Manufacturing
✓ Procurement
✓ Logistics
✓ SG&A
ArcelorMittal
Votorantim
5.1MT
Barra Mansa plant
Monelevade
Resende plant
Juiz de Fora
PiracicabaSao Paulo
Rio de Janeiro
Minas Gerais

16
Capitalising on high-return opportunities; Capex increasing to $3.8bn in 2018
Focused investment
• Italy: Restore ILVA as leading Italian steel supplier
• Underperforming asset requiring turnaround
• Expanded product range with new HAV steel grades
• Synergies €310m of which €50m to benefit
ArcelorMittal’s existing operations
• 2018 investment of ~$300m for environmental capex
(full year basis)
• EC approval granted May 7, 2018; closing expected
end of 2Q 2018
• Mexico: $1.0bn three-year investment for
construction of a new 2.5Mt HSM
• High value return project improved HAV mix
• Capex investment of ~$350m in 2018 commenced
• Increase capability to serve domestic Mexican
industry
Capex in 2018 ($ billion)
0.1
0.3
0.5
0.1
Various
strategic
projects
ILVA &
Mexico
2017
carry
over
FY17
2.8
Forex FY18F
3.8
Primarily steel projects focusing on
downstream optimisation in Europe and
HAV in Canada & Europe
17
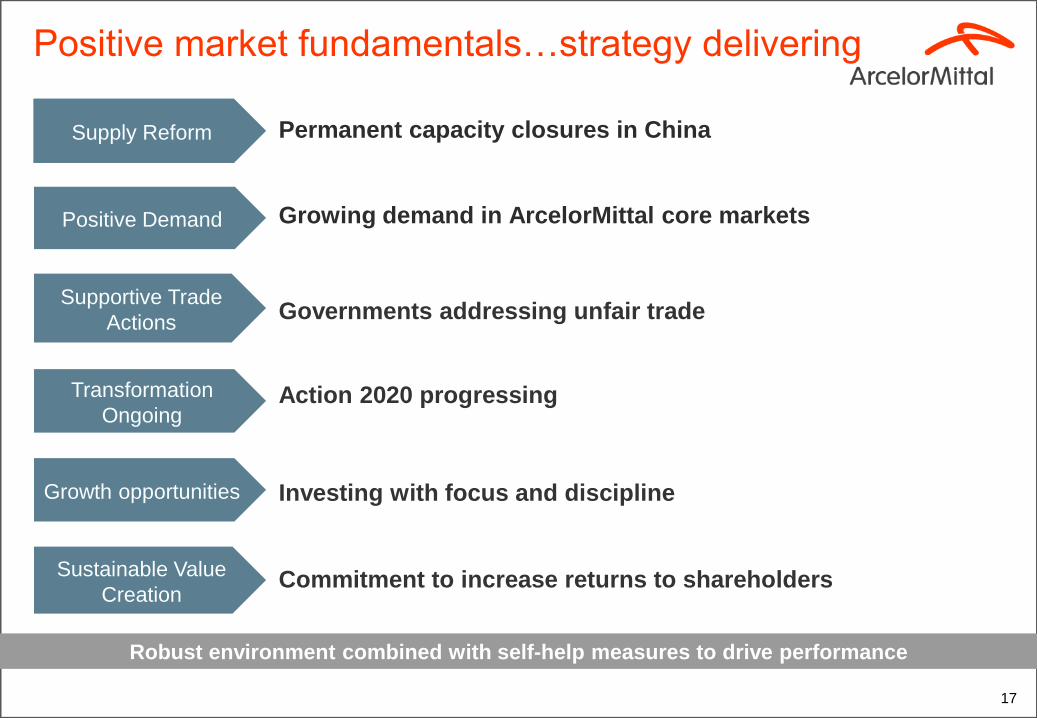
Robust environment combined with self-help measures to drive performance
Transformation
Ongoing
Supportive Trade
Actions
Effective China
Supply Reform
Growth opportunities
Growing demand in ArcelorMittal core markets
Governments addressing unfair trade
Action 2020 progressing
Commitment to increase returns to shareholders
Positive market fundamentals…strategy delivering
Permanent capacity closures in China
Sustainable Value
Creation
Supply Reform
Positive Demand
Investing with focus and discipline

FINANCIALSSection 2
19
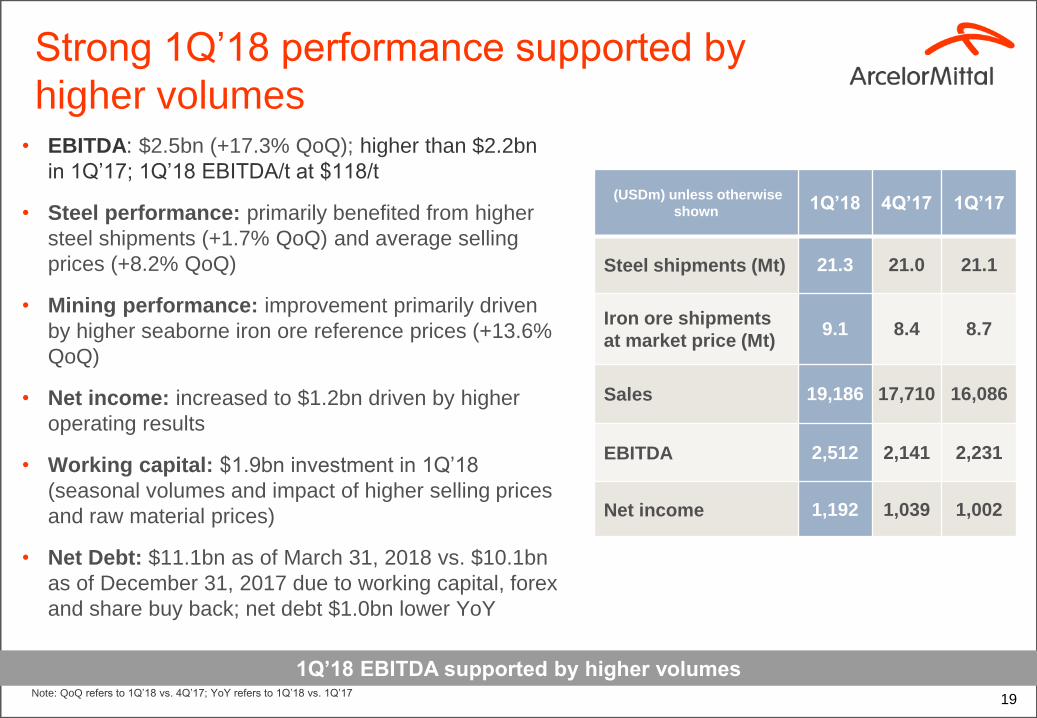
• EBITDA: $2.5bn (+17.3% QoQ); higher than $2.2bn
in 1Q’17; 1Q’18 EBITDA/t at $118/t
• Steel performance: primarily benefited from higher
steel shipments (+1.7% QoQ) and average selling
prices (+8.2% QoQ)
• Mining performance: improvement primarily driven
by higher seaborne iron ore reference prices (+13.6%
QoQ)
• Net income: increased to $1.2bn driven by higher
operating results
• Working capital: $1.9bn investment in 1Q’18
(seasonal volumes and impact of higher selling prices
and raw material prices)
• Net Debt: $11.1bn as of March 31, 2018 vs. $10.1bn
as of December 31, 2017 due to working capital, forex
and share buy back; net debt $1.0bn lower YoY
Strong 1Q’18 performance supported by
higher volumes
(USDm) unless otherwise
shown1Q’18 4Q’17 1Q’17
Steel shipments (Mt) 21.3 21.0 21.1
Iron ore shipments
at market price (Mt)9.1 8.4 8.7
Sales 19,186 17,710 16,086
EBITDA 2,512 2,141 2,231
Net income 1,192 1,039 1,002
Note: QoQ refers to 1Q’18 vs. 4Q’17; YoY refers to 1Q’18 vs. 1Q’17
1Q’18 EBITDA supported by higher volumes
20
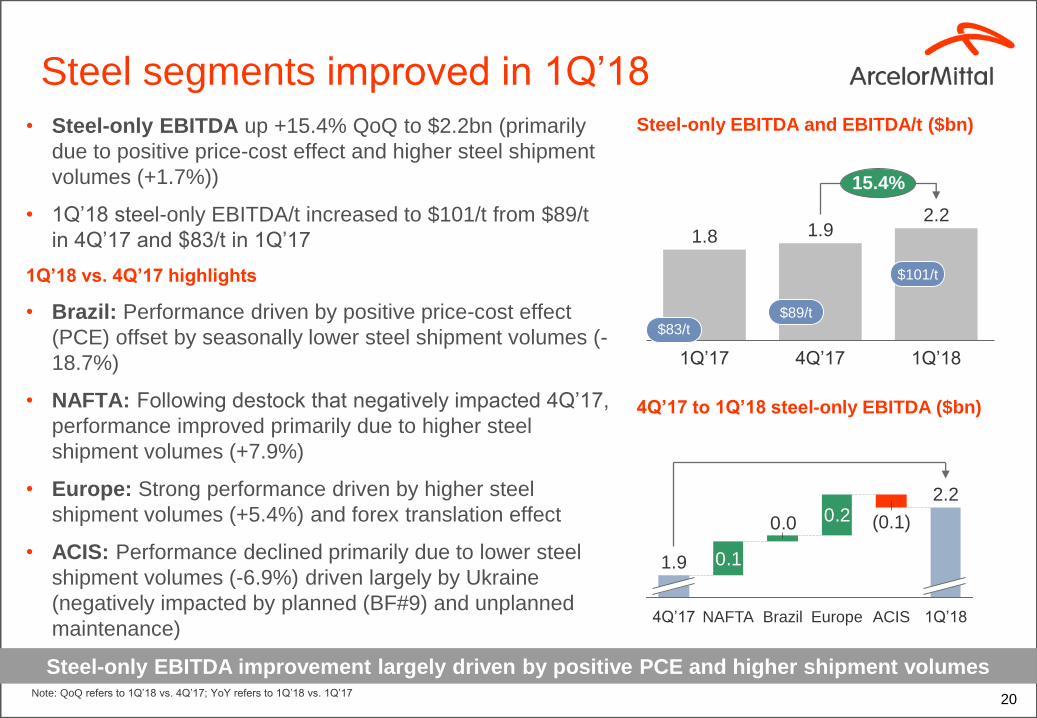
• Steel-only EBITDA up +15.4% QoQ to $2.2bn (primarily
due to positive price-cost effect and higher steel shipment
volumes (+1.7%))
• 1Q’18 steel-only EBITDA/t increased to $101/t from $89/t
in 4Q’17 and $83/t in 1Q’17
1Q’18 vs. 4Q’17 highlights
• Brazil: Performance driven by positive price-cost effect
(PCE) offset by seasonally lower steel shipment volumes (-
18.7%)
• NAFTA: Following destock that negatively impacted 4Q’17,
performance improved primarily due to higher steel
shipment volumes (+7.9%)
• Europe: Strong performance driven by higher steel
shipment volumes (+5.4%) and forex translation effect
• ACIS: Performance declined primarily due to lower steel
shipment volumes (-6.9%) driven largely by Ukraine
(negatively impacted by planned (BF#9) and unplanned
maintenance)
Steel segments improved in 1Q’18
Steel-only EBITDA improvement largely driven by positive PCE and higher shipment volumes
1.8 1.92.2
1Q’17
15.4%
4Q’17 1Q’18
Steel-only EBITDA and EBITDA/t ($bn)
4Q’17 to 1Q’18 steel-only EBITDA ($bn)
0.1
0.20.0
1Q’18NAFTA
(0.1)
Europe
1.9
2.2
4Q’17 ACISBrazil
$83/t$89/t
$101/t
Note: QoQ refers to 1Q’18 vs. 4Q’17; YoY refers to 1Q’18 vs. 1Q’17

21
Mining: Improved performance
Mining profitability positively impacted by higher iron ore prices
Iron ore marketable shipments Million metric tonnes (Mt)
* CFR China 62% Fe
480
267
349
1Q’17 1Q’184Q’17
+30.7%
EBITDA $m• Solid performance: 1Q’18 EBITDA improved 30.7% vs.
4Q’17 primarily due to higher seaborne iron ore market
prices (+13.6%) and higher market priced iron ore
shipments (+8.1%).
• Growth: Market priced iron ore shipments volume increased
+5.5% YoY and is expected to grow ~10% in 2018.
• Liberia: The Gangra mine, haul road and related plant and
equipment upgrades have now been completed
– Moved ore extraction from depleting DSO deposit at
Tokadeh to nearby low impurity DSO Gangra deposit
with planned production of 5Mtpa in 2018
– Feasibility study launched to identify the optimal
concentration solution in a phased approach for utilising
Tokadeh ores. Result expected end of 2018
• Focus on quality: ongoing commitment on product quality,
service and delivery.
• Cost: FCF breakeven point maintained at $40/t*.1Q’17 4Q’17 1Q’18
9.1
8.78.4
+8.1%

22
EBITDA to net results
2,512
1,569 1,4431,192
212
EBITDA D&A
(711)
Operating
income
(86)(146)
Impairment Exceptional
charge
(174)
Income
from
investments
(164)
Net interest
expense
Forex
and other
fin. result
Taxes and
non-
controlling
interests
Pre-tax
income
(251)
Net income
Positive net income primarily driven by positive operating income
BASIC EPS 1Q’18
Weighted Av. No. of shares (in millions) 1,019
Earnings per share $1.17
1Q’18 EBITDA to net income analysis ($ million)
Related to a provision
taken in respect of an
ongoing case in which a
settlement is pendingIncludes forex gain of $72m
(due to 2.7% depreciation
of the USD against the
Euro) and MTM loss on
MCB call options.
Related to impairment of
Cariacica and Itauna plants
in Brazil
Includes
Erdemir dividend ($87m)
and contribution from
Calvert
23
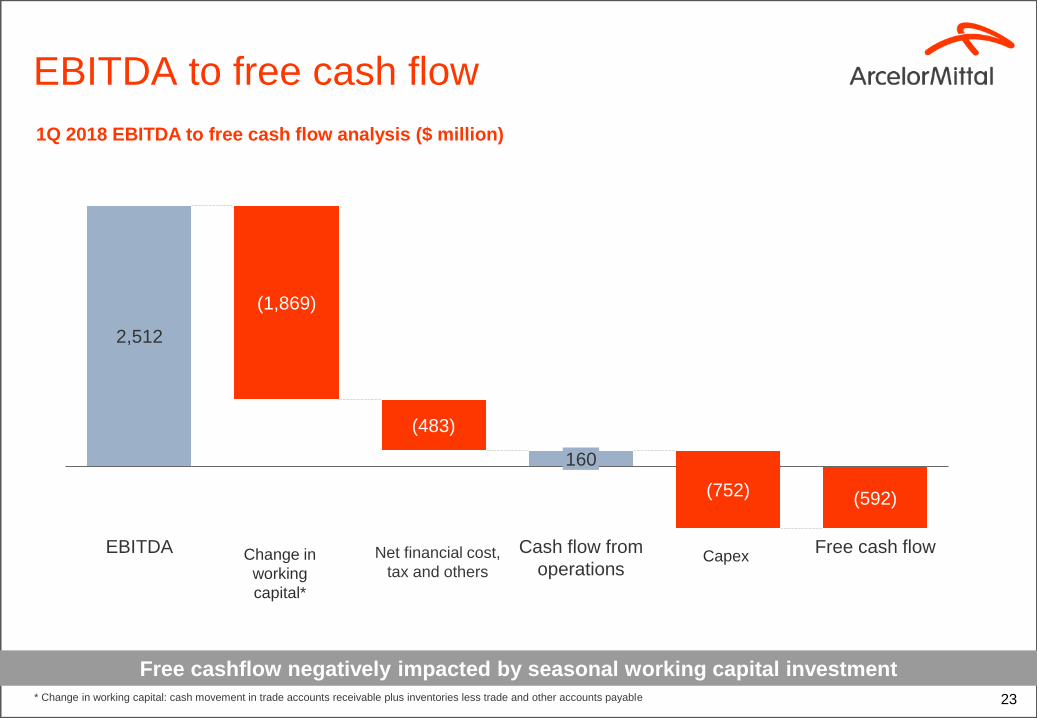
EBITDA to free cash flow
* Change in working capital: cash movement in trade accounts receivable plus inventories less trade and other accounts payable
Free cashflow negatively impacted by seasonal working capital investment
2,512
Cash flow from
operations
160
EBITDA
(1,869)
(483)
(592)(752)
Free cash flowChange in
working
capital*
Net financial cost,
tax and othersCapex
1Q 2018 EBITDA to free cash flow analysis ($ million)

24
Net debt analysis
Net debt increase driven by negative free cash flow, share buy back and forex
592
226
199
(76)
10,142
Net debt at
Mar 31, 2018
Net debt at
Dec 31, 2017
Free cash flow M&A*
50
Dividend
11,133
Share buy
back**
Forex
and other
Dec 31, 2017 to Mar 31, 2018 ($ million)
Includes forex of $0.2bn: Mainly
driven by USD depreciation
against the Eur 2.7%
Dividends paid to
Posco (AMMC)
* Primarily proceeds from disposal of Frydek Mistek, Czech Republic; ** On March 28, 2018, ArcelorMittal announced the completion of its share buyback program. ArcelorMittal has repurchased 7 million shares for a total value of approximately €184 million (equivalent $226 million) at an approximate average price per share of €26.34 (equivalent $32.36)
25
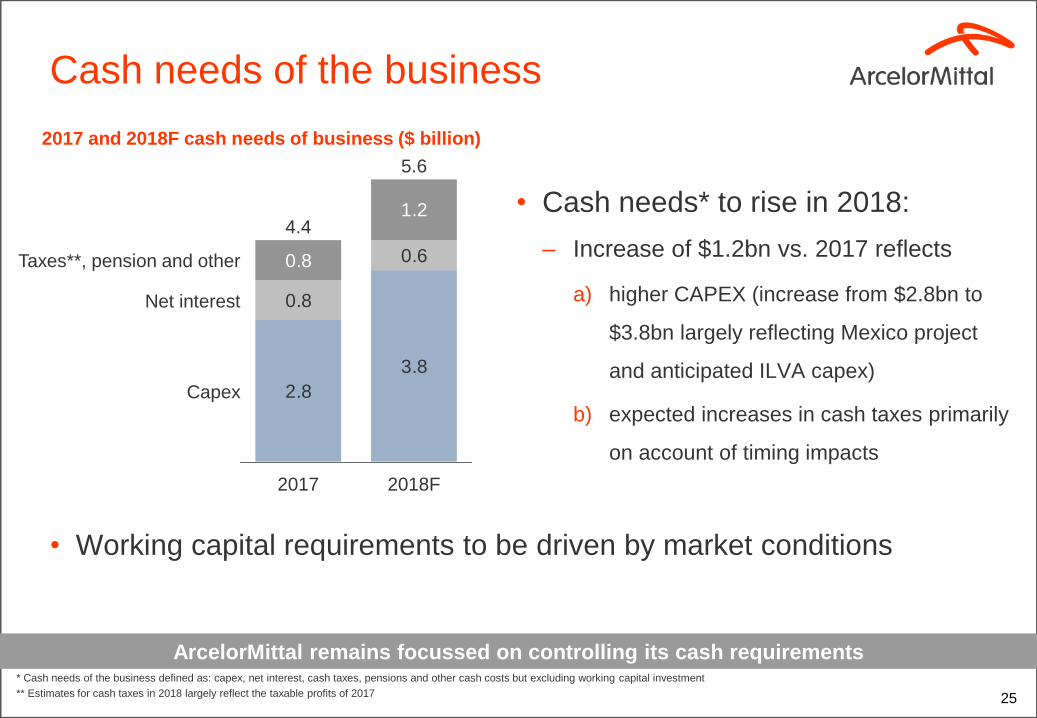
ArcelorMittal remains focussed on controlling its cash requirements
Cash needs of the business
• Cash needs* to rise in 2018:
– Increase of $1.2bn vs. 2017 reflects
a) higher CAPEX (increase from $2.8bn to
$3.8bn largely reflecting Mexico project
and anticipated ILVA capex)
b) expected increases in cash taxes primarily
on account of timing impacts
* Cash needs of the business defined as: capex, net interest, cash taxes, pensions and other cash costs but excluding working capital investment
** Estimates for cash taxes in 2018 largely reflect the taxable profits of 2017
• Working capital requirements to be driven by market conditions
2.8
3.8
0.8
0.60.8
1.24.4
2018F
Net interest
Capex
5.6
Taxes**, pension and other
2017
2017 and 2018F cash needs of business ($ billion)

26
Maintain investment grade rating (through the cycle)
Transformed balance sheet
• Net debt lowest since merger
• Investment grade rated (S&P)
• Interest costs declined by
~56% since 2012
• Maximising ability to translate
EBITDA to FCF
Net Debt ($bn)
Debt adjusted FCF ($bn)
$3bn cumulative FCF since 2012 increases to $8bn
adjusting for 2018F cash interest expense
10.111.115.715.816.1
21.8
20142012 20172013 2015 2016
-53%
-1.0
0.0
2.0
1.0
3.0
2013 20142012 20172015 2016
Debt Adjusted FCF**
FCF*
* Free cash flow refers to cash flow from operations less capex; ** Debt adjusted FCF refers to historical FCF adjusted to reflect 2018 forecast interest expense of $0.6bn

27
Liquidity and debt maturity profile
Investment grade rated by S&P
Liquidity at Mar 31, 2018 ($ billion)
Liquidity lines:
• $5.5bn lines of credit refinanced and extended in Dec 2016; two tranches:
• $2.3bn matures Dec 2019
• $3.2bn matures Dec 2021
• Continued strong liquidity
• Average debt maturity 5.2 Yrs
Debt maturity: Ratings:
• S&P* – BBB-, stable outlook
• Moody’s – Ba1, positive outlook
• Fitch – BB+, positive outlook
5.5
2.3
Unused credit lines
Cash
Liquidity at
Mar 31, 2018
7.8
Debt maturities at Mar 31, 2018 ($ billion)
0.5
1.9
1.4 1.6
2.8
1.2
0.4
0.6
0.9
1.3 0.4
2020 2021 >20232018 2022
0.2
0.2
2019
Other loans Commercial paper Bonds
* S&P upgrade on 1 Feb’18

28* Net debt refers to long-term debt, plus short term debt, less cash and cash equivalents, restricted cash and short-term investments (including those held as part of asset/liabilities held for sale); ** Liquidity is defined cash and cash equivalents plus available credit lines excluding back-up lines for commercial paper program
Balance sheet structurally improved
Balance sheet fundamentals improved
Net debt* ($ billion) Average debt maturity (Years)
Liquidity** ($ billion) Bank debt as component of total debt (%)
11.1
32.5
3Q 2008 1Q 2018
-21.45.2
2.6
3Q 2008 1Q 2018
12.0
7.8
3Q 2008 1Q 2018
75%
3Q 2008 1Q 2018
13%

ILVASection 3

30
New ILVA – a tier 1 steel asset
ILVA is a strong fit within ArcelorMittal’s existing business & strategy
• ILVA is an excellent opportunity for ArcelorMittal
– Italy is the 2nd largest steel consuming country in
Europe (Mt)
– Large scale, underperforming asset requiring
turnaround
– Significant cost improvement potential and
synergies identified
– Opportunity to leverage AM strengths in R&D
and product leadership and service
– Ilva will be re-established as a tier one supplier to
European & Italian customers
• Minimal Balance sheet impact, EBITDA accretive
Year 1
• Next step: merger clearance granted by EC on May
7, 2018 (Company has committed to dispose of
assets in the divestment package in Italy, Romania,
Macedonia, Czech Republic, Luxembourg and
Belgium).
Source: World Steel, Steel Statistical Yearbook 2015; Notes: *Iberia defined as Spain + Portugal
Taranto
Genova: Cold rolling, hot dip
galvanising and tin plate capacities
Taranto: Integrated plant for production
and sale of HRC, plates, pipes and
tubes
97Mt Total European
Flat Steel demand
in 2015
Novi Ligure: Cold rolling mill to serve
end-users customers (e.g. packaging,
white goods)

31
Our vision for ILVA
A clear vision of long-term, sustainable success for ILVA
• Significant environmental issues –
need to bring ILVA up to and beyond EU
environmental standards
• Industrial challenge: investment and
expertise to improve operational
performance of ILVA’s assets
• Poor financial performance: material
decline in revenue since 2011, loss-
making for the past 4 years
• Low share of high-value added steels
in the portfolio of ILVA
• Need to rebuild client confidence:
product quality, innovation, supply chain
• Become a world-class player in terms
of competitiveness, sustainability,
environmental performance, value-add
• Leading presence in Italy, adding
value to the Italian industrial fabric
• A company recognised for
environmental performance
excellence: emissions to be reduced to
best practice levels, in line with and
beyond European environmental
standards and legislation
• A sustainably profitable company:
one that creates value for all
stakeholders, and the Italian economy
ILVA Today ILVA’s Future

Industrial
2018 - 2024
Environmental
2018 - 2023
Total CAPEX
2018 - 2024
32
Investment plan to revitalise ILVA
Commitment to invest €2.4 billion over the next 7 years
1.25
1.15
2.4
• €1.15bn environmental investment
plan to materially improve
performance, including:
– €0.3bn stock pile coverage
– €0.2bn investment at coke ovens
– €0.2bn in waste water treatment
– €0.3bn environmental remediation
(clean-up) which will be financed with
funds seized from the Riva Group
• €1.25bn industrial investment plan to
rapidly restore and improve:
– ‘catch-up’ capex for delayed
maintenance
– capex program for blast furnaces
and steel plants
– includes full €0.2bn re-vamping of
BF#5
CAPEX commitments through 2024 (€bn)
Riva Funds
utilised
0.3
2.1
Net CAPEX

33
Industrial plan to restore ILVA’s market
position
Crude steel production is limited to 6Mt until environmental capex plan completed
Operating BF#1, BF#2, BF#4 supplemented by imported slabs/coils
Restart
BF#5
alongside,
BF#1, BF#4
6.0 6.0 6.0 6.0 6.0 6.0
8.08.5
9.5
2018 2019 2020 2021 2022 2023 2024
Production (Mt crude steel) Shipments (Mt finished steel)
2018 2019 2020 2021 2022 2023 2024

34
ILVA impact on ArcelorMittal financials
On completion ILVA will be fully consolidated by ArcelorMittal
• Following completion of transaction, expected end of 2Q 2018, ArcelorMittal will
fully consolidate ILVA
• Purchase price of €1.8bn, will be recognized on the BS as a payable, reduced by
the quarterly instalments of €45mn that will flow through investing activities in CF
• New ILVA will be transferred with circa €1bn of net working capital and free of long
term liabilities and financial debt
• New ILVA will be transferred to ArcelorMittal with a re-calibrated labor force
• ArcelorMittal will immediately commence the environmental capex plan and other
investments
• ILVA is expected to be accretive to ArcelorMittal EBITDA in Year 1 and
accretive to ArcelorMittal cash flow in Year 3 (based on 2016 steel spreads)

STEEL INVESTMENTSSection 4
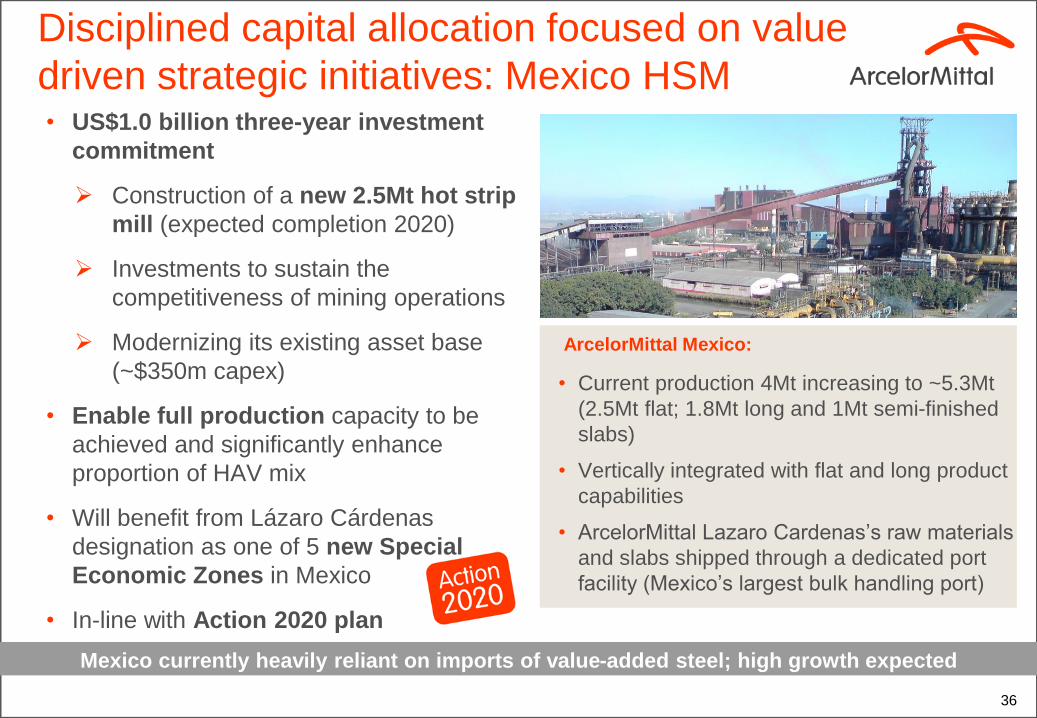
Mexico currently heavily reliant on imports of value-added steel; high growth expected
Indiana Harbor
Plant
No. 3SP: New #2
Caster
36
Disciplined capital allocation focused on value
driven strategic initiatives: Mexico HSM• US$1.0 billion three-year investment
commitment
➢ Construction of a new 2.5Mt hot strip
mill (expected completion 2020)
➢ Investments to sustain the
competitiveness of mining operations
➢ Modernizing its existing asset base
(~$350m capex)
• Enable full production capacity to be
achieved and significantly enhance
proportion of HAV mix
• Will benefit from Lázaro Cárdenas
designation as one of 5 new Special
Economic Zones in Mexico
• In-line with Action 2020 plan
ArcelorMittal Mexico:
• Current production 4Mt increasing to ~5.3Mt
(2.5Mt flat; 1.8Mt long and 1Mt semi-finished
slabs)
• Vertically integrated with flat and long product
capabilities
• ArcelorMittal Lazaro Cardenas’s raw materials
and slabs shipped through a dedicated port
facility (Mexico’s largest bulk handling port)

MACRO HIGHLIGHTSSection 5
38
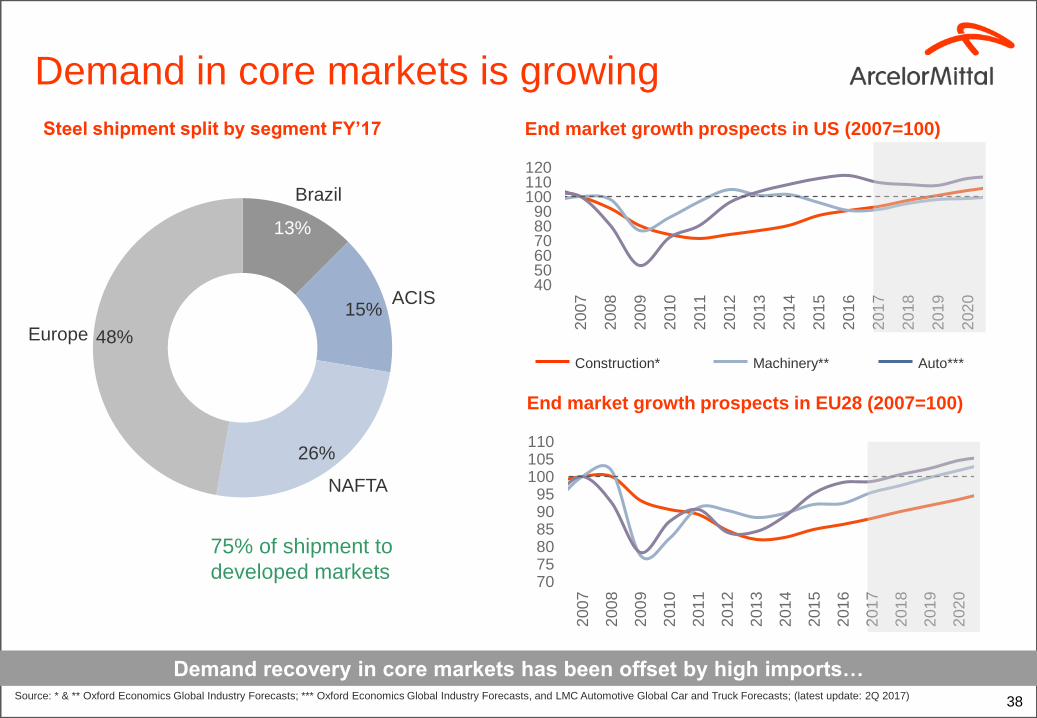
Demand in core markets is growing
End market growth prospects in US (2007=100)
Demand recovery in core markets has been offset by high imports…
Steel shipment split by segment FY’17
75% of shipment to
developed markets
End market growth prospects in EU28 (2007=100)
707580859095
100105110
200
7
200
8
200
9
201
0
201
1
201
2
201
3
201
4
201
5
201
6
201
7
201
8
201
9
202
0
405060708090
100110120
200
7
200
8
200
9
201
0
201
1
201
2
201
3
201
4
201
5
201
6
201
7
201
8
201
9
202
0
Construction* Auto***Machinery**
Source: * & ** Oxford Economics Global Industry Forecasts; *** Oxford Economics Global Industry Forecasts, and LMC Automotive Global Car and Truck Forecasts; (latest update: 2Q 2017)
13%
15%
26%
48%
Brazil
ACIS
NAFTA
Europe

39* Source: AISI, Eurofer and ArcelorMittal estimates; ** includes pipes and tubes
Global ASC rates
Global ASC improvement of +1.5% to 2.5% in 2018 vs 2017
Global apparent steel consumption (ASC)* (million
tonnes per month)
US and European apparent steel consumption
(ASC)* (million tonnes per month)
• EU ASC +10.9% in 1Q’18 vs. 4Q’17
• EU ASC +2.0% in 1Q’18 vs. 1Q’17
• US** ASC +4.3% in 1Q’18 vs. 4Q’17
• US** ASC -0.5% in 1Q’18 vs. 1Q’17
• China ASC +3.3% in 1Q’18 vs. 4Q’17
• China ASC +7.1% in 1Q’18 vs. 1Q’17
• Global ASC +3.7% in 1Q’18 vs. 4Q’17
• Global ASC +4.8% in 1Q’18 vs. 1Q’17
20
25
30
35
40
45
50
55
60
65
70
China Developing ex-China Developed
(latest data point: Feb-2018)

40* Source: US Census Bureau; ** Source: Markit and The American Institute of Architects
Construction markets in developed market
Construction growth continues into 2018
• Residential construction growth eased back slightly to
8% y-o-y in Q1’18 after growing 10% y-o-y in 2017
• Building permits rose in March to a SAAR of 1.354 M
units, just below the 10-year high reached in January
• Non-residential construction spending has levelled off
at around the level it reached before the 2009 crisis
• Architecture Billings Index (ABI) eased to 51 in March,
marking the sixth consecutive month above 50
US residential and non-residential construction indicators (SAAR) $bn*
Eurozone and US construction indicators**
United States
Europe
• European construction accelerated to almost 4%
growth last year up from 1.8% in 2016.
• Initially growth in construction was led by German
residential output. But during 2017 it spread to other
countries and increasingly non-residential construction
• Civil engineering projects funded by EU funds have
driven double digit growth in Eastern European
countries, particularly Poland
• Eurozone construction PMI now >50 for 16 months
200
300
400
500
600
700Residential Non residential
(latest data point: Apr-2018)
30
35
40
45
50
55
60
65 Architecture Billings Index (USA) Eurozone construction PMI
(latest data point: Apr-2018)

41* Source: German steel association BDS data with 3 month moving avg MoS
** Source: WSA, Mysteel, ArcelorMittal Strategy estimates
Regional inventories
Inventory trends
German inventories (000 Mt)*
China service centre inventories** (Mt/mth) with ASC%
Brazil service centre inventories (000 Mt)
US service centre total steel inventories (000 Mt)
0%
5%
10%
15%
20%
25%
30%
35%
40%
45%
0
5
10
15
20
25
Flat and long
% of ASC (RHS)
(latest data point: Apr-2018)
1.0
2.0
3.0
4.0
5.0
6.0
7.0
200
400
600
800
1,000
1,200
1,400
Flat stocks at service centres
Months Supply (RHS)
(latest data point: Apr-2018)
2.0
2.2
2.4
2.6
2.8
3.0
3.2
3.4
3.6
5,000
6,000
7,000
8,000
9,000
10,000
11,000
12,000
13,000
USA (MSCI)
Months Supply (RHS)
(latest data point: Apr-2018)(latest data point: Apr-2018)
42* Source: China National Bureau of Statistics, China Real Estate Index System (via Haver) and ArcelorMittal estimates; Source: NBS, CISA, WSA, Mysteel, ArcelorMittal Strategy estimates
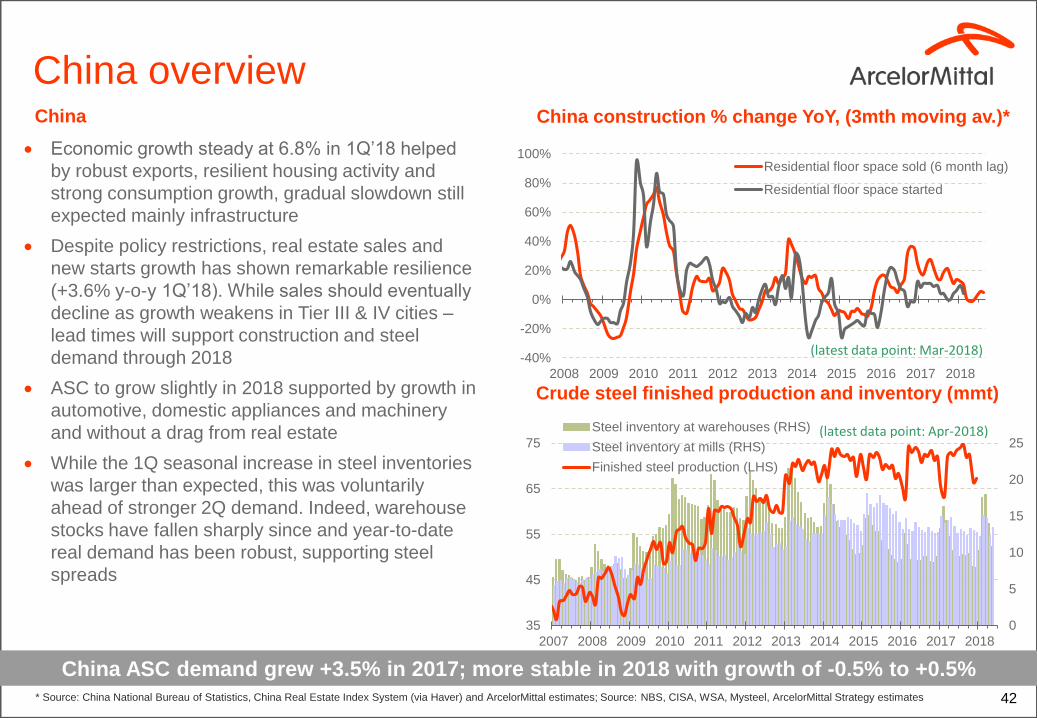
China overview
China ASC demand grew +3.5% in 2017; more stable in 2018 with growth of -0.5% to +0.5%
• Economic growth steady at 6.8% in 1Q’18 helped
by robust exports, resilient housing activity and
strong consumption growth, gradual slowdown still
expected mainly infrastructure
• Despite policy restrictions, real estate sales and
new starts growth has shown remarkable resilience
(+3.6% y-o-y 1Q’18). While sales should eventually
decline as growth weakens in Tier III & IV cities –
lead times will support construction and steel
demand through 2018
• ASC to grow slightly in 2018 supported by growth in
automotive, domestic appliances and machinery
and without a drag from real estate
• While the 1Q seasonal increase in steel inventories
was larger than expected, this was voluntarily
ahead of stronger 2Q demand. Indeed, warehouse
stocks have fallen sharply since and year-to-date
real demand has been robust, supporting steel
spreads
Crude steel finished production and inventory (mmt)
China construction % change YoY, (3mth moving av.)*China
-40%
-20%
0%
20%
40%
60%
80%
100%
2008 2009 2010 2011 2012 2013 2014 2015 2016 2017 2018
Residential floor space sold (6 month lag)
Residential floor space started
(latest data point: Mar-2018)
0
5
10
15
20
25
35
45
55
65
75
2007 2008 2009 2010 2011 2012 2013 2014 2015 2016 2017 2018
Steel inventory at warehouses (RHS)
Steel inventory at mills (RHS)
Finished steel production (LHS)
(latest data point: Apr-2018)

43
• Chinese government committed to tackle overcapacity
and environmental issues
• Capacity reduction ahead of expectations: net capacity
reduction achieved vs. 140Mt target
• Steel replacement policy in favour of EAF v BF; no
new capacity to be built ratio 1:1 for EAF and 1:1.25
for BF-BOF
• Industry operating at high rates of capacity utilisation
higher domestic steel spreads
• Stronger domestic fundamentals plus global trade
restrictions reduced incentive to export
• “Winter shutdowns” supporting fundamentals through
seasonally weaker demand period
• Domestic capacity must reflect demand outlook
China supply reform ahead of schedule
Supply side reform progressing well; China ahead of initial plans to close steel capacity
115Mt permanent capacity
closed further 25Mt
targeted in 2018
Additional ~120Mt illegal
induction furnace capacity
closed
Steel exports reduced
Industry capacity
utilization
~85-90% today

44
China addressing its excess capacity
China steel capacity rationalisation will take time… trade action to protect during this transition
2017 2018 May
Previous capacity closures more than offset by rapid capacity additions
2016
• Reduce 100-150Mt capacity over 5
years. Timeline accelerated to 3
years ie end of 2018
• 65Mt net capacity cut
• No projects of new capacity
• There will be a “mandatory” part
and a “voluntary” part
• The “mandatory” part uses same
criteria as earlier policy but adds
criteria for product quality and for
safety
• The “voluntary” part will rely upon
financial incentives to cut capacity.
Special funds will be used for
redeployment incentives and
debt restructuring
• 115Mt net capacity reduction of
the 140Mt target to date ~25Mt
left to be cut
• Winter shut downs from Nov’17 to
Mar’18; capacity constraints in 2 +
26 cities
• Extension of winter shutdowns
in 2 cities Tangshan and
Handan (Mid March’18 to Mid
Oct’18)
• Steel replacement policy ongoing
– favours less polluting EAF
capacity
*The ratio 1:1.25 BF-BOF is for so-called “the environmentally-sensitive areas”, which means population-intensive and pollution-intensive as well, including Beijing-Tianjin-Hebei area, Yangtze-River-Delta area (Shanghai, Jiangsu Province and Zhejiang Province) and Zhujiang-River-Delta area (9 key cities including Guangzhou in Guangdong province).
• 50Mt net capacity cut
• Further ~120Mt induction
furnaces (IF) capacity cut
(Jun’17)
• Winter shut downs from Nov’17
to Mar’18; capacity constraints in
2 + 26 cities
• Steel replacement policy in
favour of EAF v BF; no new
capacity to be built ratio 1:1
for EAF and 1:1.25 for BF-BOF
for key areas*
Highly Restricted 45
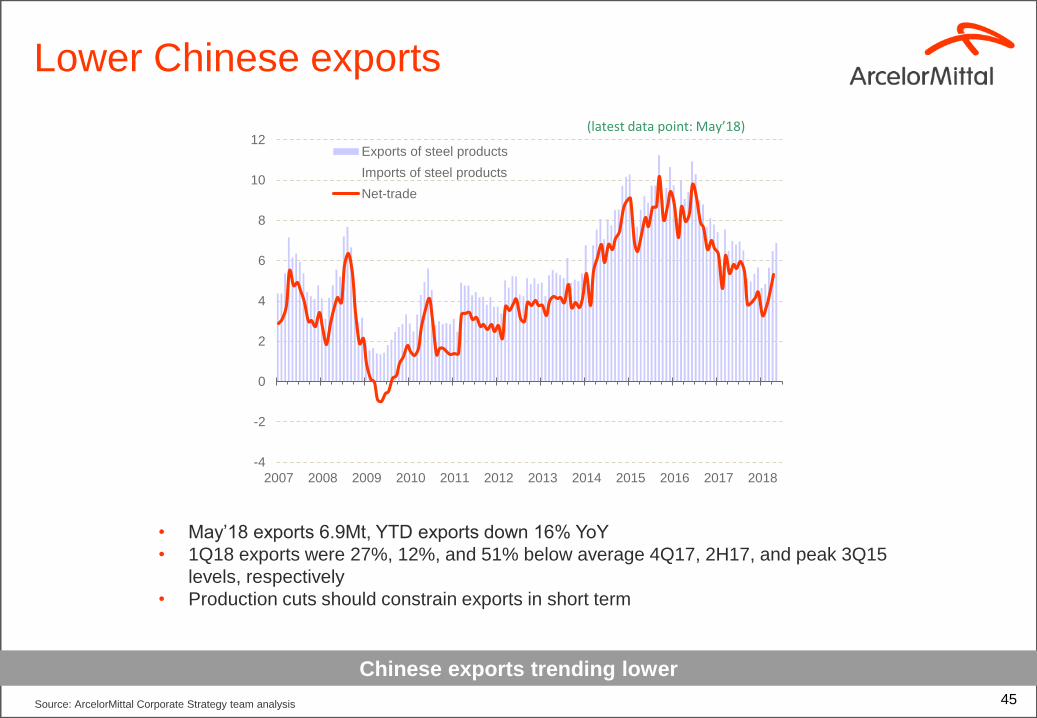
Lower Chinese exports
Source: ArcelorMittal Corporate Strategy team analysis 45
Chinese exports trending lower
• May’18 exports 6.9Mt, YTD exports down 16% YoY
• 1Q18 exports were 27%, 12%, and 51% below average 4Q17, 2H17, and peak 3Q15
levels, respectively
• Production cuts should constrain exports in short term
-4
-2
0
2
4
6
8
10
12
2007 2008 2009 2010 2011 2012 2013 2014 2015 2016 2017 2018
Exports of steel products
Imports of steel products
Net-trade
(latest data point: May’18)

AUTOMOTIVESection 6
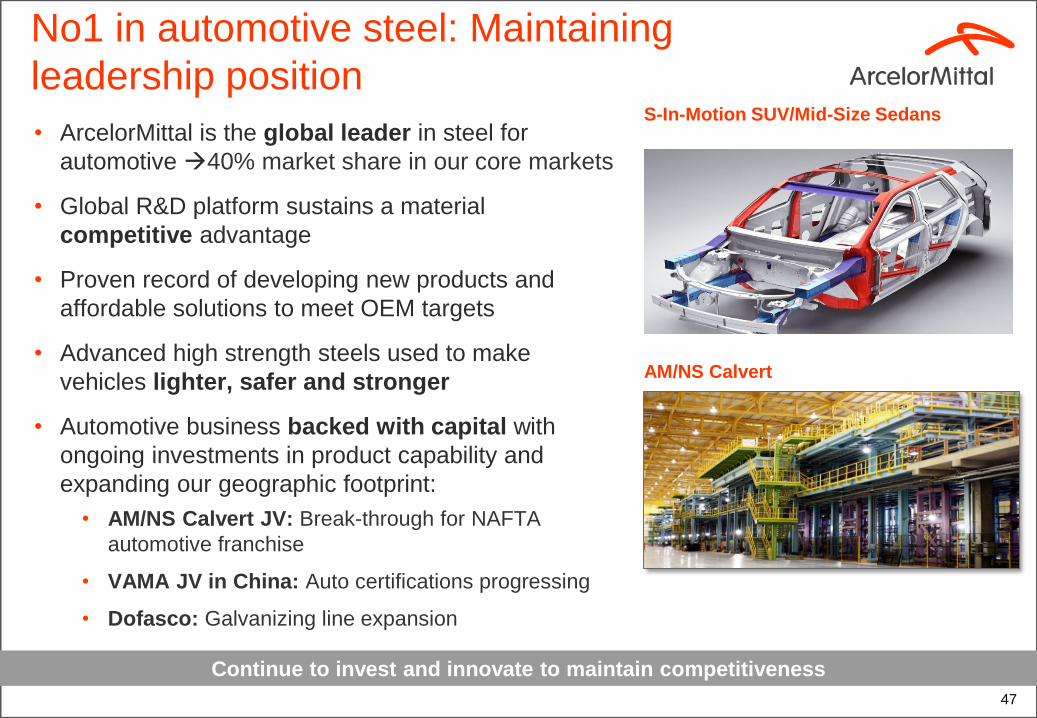
No1 in automotive steel: Maintaining
leadership position
• ArcelorMittal is the global leader in steel for
automotive 40% market share in our core markets
• Global R&D platform sustains a material
competitive advantage
• Proven record of developing new products and
affordable solutions to meet OEM targets
• Advanced high strength steels used to make
vehicles lighter, safer and stronger
• Automotive business backed with capital with
ongoing investments in product capability and
expanding our geographic footprint:
• AM/NS Calvert JV: Break-through for NAFTA
automotive franchise
• VAMA JV in China: Auto certifications progressing
• Dofasco: Galvanizing line expansion
47
S-In-Motion SUV/Mid-Size Sedans
AM/NS Calvert
Continue to invest and innovate to maintain competitiveness

Global presence and reach
Source: LMC figures for Western and Eastern Europe and Russia; IHS figures for all other regions; personal cars and light commercial vehicles < 6t
Global supplier with increasing emerging market exposure
48
> 20 M veh
> 15 M veh & < 20 M veh
> 10 M veh & < 15 M veh
> 5 M veh & < 10 M veh
> 2.5 M veh & < 5 M veh
> 1 M veh & < 2.5 M veh
< 1 M veh
Vehicle production 2017
Automotive production facilities
Alliances & JVs
Commercial teams
R&D centres
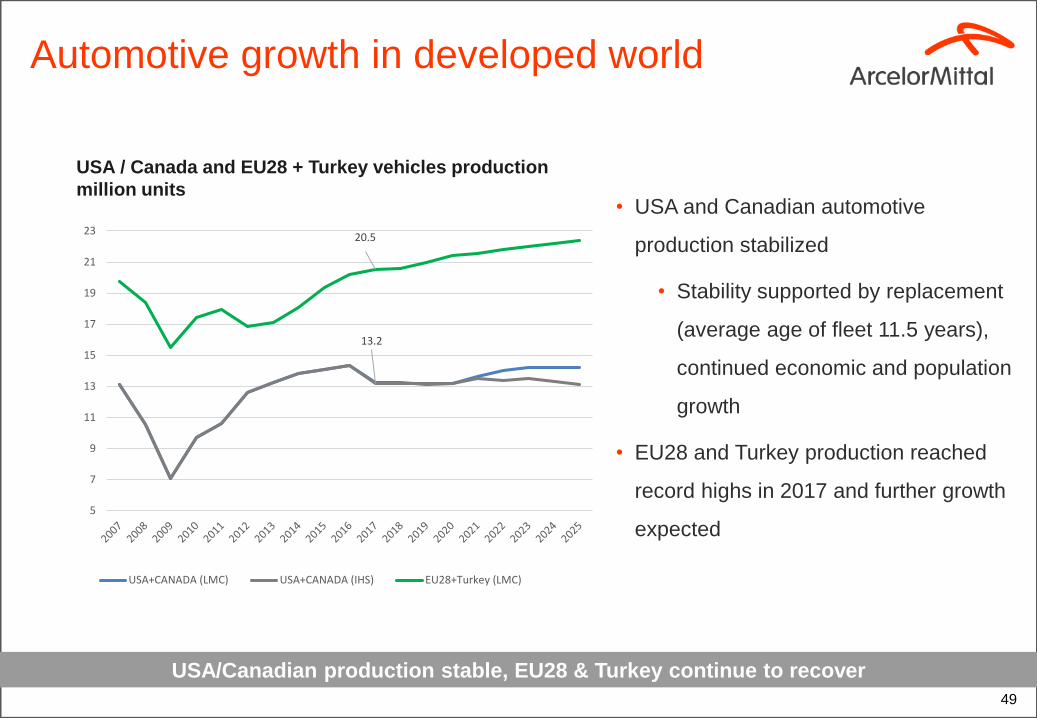
Automotive growth in developed world
USA / Canada and EU28 + Turkey vehicles production
million units• USA and Canadian automotive
production stabilized
• Stability supported by replacement
(average age of fleet 11.5 years),
continued economic and population
growth
• EU28 and Turkey production reached
record highs in 2017 and further growth
expected
USA/Canadian production stable, EU28 & Turkey continue to recover
49
13.2
20.5
5
7
9
11
13
15
17
19
21
23
USA+CANADA (LMC) USA+CANADA (IHS) EU28+Turkey (LMC)

Automotive emerging market growth
China vehicle production (‘000s)
• China production to grow steadily by +6mvh
in 2017 to ~33mvh by 2025
• India production to increase ~80% by 2025
(from 4.5mvh in 2017 to 8mvh in 2025)
• Mexico production is expected to increase
by 6.3% (2017 vs 2025)
• Brazil production growth expected to
continue and reach 3.9mvh in 2025
• Russia production is expected to recover
and reach 2013 level in 2022
Brazil, India, Russia & Mexico vehicle production (‘000’s)
Source: IHS
27,636
33,506
0
5,000
10,000
15,000
20,000
25,000
30,000
35,000
40,000China
1,4462,327
4,456
8,027
2,637
3,9283,946
4,193
0
1,000
2,000
3,000
4,000
5,000
6,000
7,000
8,000
9,000Russia India Brazil Mexico
Strong growth expected in India, China and Brazi
50

ArcelorMittal’s S-in motion®
Demonstrating the weight saving potential of new products
ArcelorMittal generic steel solutions includes body-in-white, closures, and chassis parts
From steel provider to global automotive solutions provider
51

52
Continued investment in R&D supports
Portfolio of Next Generation Auto Steels
Third-generation UHSS for cold
stamping. Fortiform® and HF steel
grades allow OEMs to realize
lightweight high-strength structural
elements using cold forming
methods such as stamping.
Commercially launched in Europe
in 2014 and available in North
America at Calvert undergoing
customer qualifications
Press hardenable steels (PHS) / hot
stamping steels offer strengths up to
2000 MPa. Usibor® 2000 and
Ductibor® 1000 can also be
combined thanks to laser welded
blanks (LWB) to reduce weight while
achieving optimal crash behavior.
Both currently available in Europe;
Usibor ® 2000 is commercially
available in Europe and available for
qualification testing in North America
; Ductibor® 1000 is commercially
available in Europe and Nafta
A family of cold rolled fully
martensitic steels with current
tensile strengths from 900 to 1700
MPa. ArcelorMittal’s martINsite®
cold roll family of fully martensitic
steels is perfect for anti-intrusion
parts such as bumper and door
beams. Some are also available
in with an electrogalvanized
coating (ArcelorMittal’s
Electrosite® family of martensitic
steels) or with Jetgal®.
Fortiform®
HF Grades
Usibor® 2000
Ductibor®1000
MartINsite®
JVD is a breakthrough process, In
production and product
development.
Jetgal®: JVD zinc coating applied
to steel grades for the automotive
industry. Developed for steels
including UHSS Fortiform®;
Jetskin™: JVD zinc coating
applied to steel grades for
industrial applications such as
household appliances, doors,
drums and interior building
applications.
JVD® -Jetgal®
Jetskin™
Widest offering of AHSS steel grades which can be implemented into production vehicles

Automotive Industry Leadership
The head of Audi’s ‘Lightweight Construction Centre’ is quoted as saying that “There will be no cars made of
aluminium alone in the future. Press hardened steel will play a special role in this development. If you compare the
stiffness to weight ratio, PHS is currently ahead of aluminium”.
53
Audi coming
back to steel
Leveraging R&D for new products, solutions and processes
Over 40% of the
materials in the
2018 Audi A8
body structure
will be steel, of
which 17% will
be press
hardenable steel

54
ArcelorMittal preferred AHSS supplier
0%
5%
10%
15%
20%
25%
30%
35%
40%
2005 2010 2015 2020 2025
AH
SS
sh
are
of
tota
l s
tee
l d
em
an
d
AHSS evolution*
NAFTA
ArcelorMittal market share**
Europe
• ArcelorMittal is maintaining overall market share
in Europe, and increasing in NAFTA
• Our AHSS share is higher than overall market
share
• As the technology requirements to develop and
produce new AHSS like Fortiform® are higher,
our share in these products has further growth
potential
* Source: Ducker **Source: Regional ArcelorMittal Marketing Intelligence
Market share in AHSS exceeds overall share

Shanghai
VAMA
FAW-VW & BMW
Daimler & Nissan
BYD, Changan, Suzuki, CFMA & FAW-VW
Changfeng, Fiat, DPCA, Dongfeng, Honda, JMC & Suzuki
Geely, VW, GM, KIA, SAIC & Chery
SAIC, Toyota, GM, Honda, Nissan & BYD
Beijing
Guangzhou
Loudi
VAMA greenfield JV facility in China
VAMA: Valin ArcelorMittal Automotive target
areas and markets
• 1.5 MT state-of-the-art production facility
• Well-positioned to serve growing automotive market
• China 2017 output 27.6mvh (IHS) +3.2% YoY
• VAMA has successfully completed homologation on
UHSS/AHSS with key tier 1 auto OEMs (~60% complete)
Latest development:
• Strong sales & order book for licensed USIBOR 1500
• VAMA started the first commercial supply of exposed
products in 4Q 2017
• Start of production ceremony for downstream ATSs
project in 4Q 2017
BYD: Build Your Dreams; CFMA: Changan Ford Mazda Automobile; SAIC: Shanghai Automotive Industry Corporation; JMC: Jiangling Motors Corporation
VAMA well positioned to supply growing Chinese auto market
55
Furnace of CGL and CAL on both sides VAMA HQ in Loudi city, Hunan Province • Central office in Changsha with satellite offices in proximity
to decision making centers of VAMA’s customers

INDIA auto JV with SAIL
*(BNVSAP) & emission standards (BS VI): Bharat New Vehicle Safety Assessment Program is a proposed new car assessment program for India; BS-VI is the last norm on emission standard (Bharat Stage Emission Standards BSES)
Robust automotive growth / new regulation will drive demand for high grade automotive steel
56
INDIA AUTO OUTLOOK
▪ 2017-2025: India passenger vehicle segment is
expected to grow at 8-8.5% CAGR
▪ New safety regulation would accelerate
penetration of AHSS+ UHSS steel in passenger
vehicles and LCV to meet safety norms*
INDIA AUTO JV with SAIL
▪ ArcelorMittal & SAIL entered into a MoU on May
22, 2015 for setting up an automotive steel
facility under a joint venture agreement.
▪ Venture to offer technologically advanced steel
products to rapidly growing automotive industry
in India.
▪ Feasibility study currently underway for 1.5Mtpa
in phase 1 incl. PLTCM, CAL & CGL (Pickling
Line & Tandem Cold Mill, Continuous Annealing
Line, Continuous Galv. Line)
2.7 5.8
0.9
2.2 2.7
4.0
5.10.6
1.0
2.2
0.70.50.6
30
5
0
8
20
15
10
6
2
0
25
104
8.223%
2015
3.8
14%
2010
3.2
0.5
10%
28%
AHSS++ penetration(%)
Passenger vehicles productionMillion
20252020
5.8
PV
exports
PV
domestic
LCV
4.22.4
Medium to high grade steel demand from auto sector, MT

GROUP HIGHLIGHTSSection 7
GROUP (highlights)
Rodanthe Bridge

Brazil*
Revenues ($bn) 18.0 7.8 36.2 4.0 7.6
% Group** 24% 11% 49% 6% 10%
EBITDA ($bn) 1.7 1.0 3.6 1.4 1.0
% Group** 20% 11% 41% 16% 12%
Shipments (M mt) 21.8 10.8 40.9 57.4*** 13.1
% Group 25% 12% 48% 15%
~197,100 employees serving customers in over 160 countries
Europe Mining ACIS
* Brazil includes neighboring countries ** Percentage calculation for Revenue and EBITDA exclude others and eliminations; *** Iron ore shipments only (market price plus cost plus tonnage)
NAFTA
Global scale, regional leadership
Key performance data 12M 2017
Global scale delivering synergies
59
60
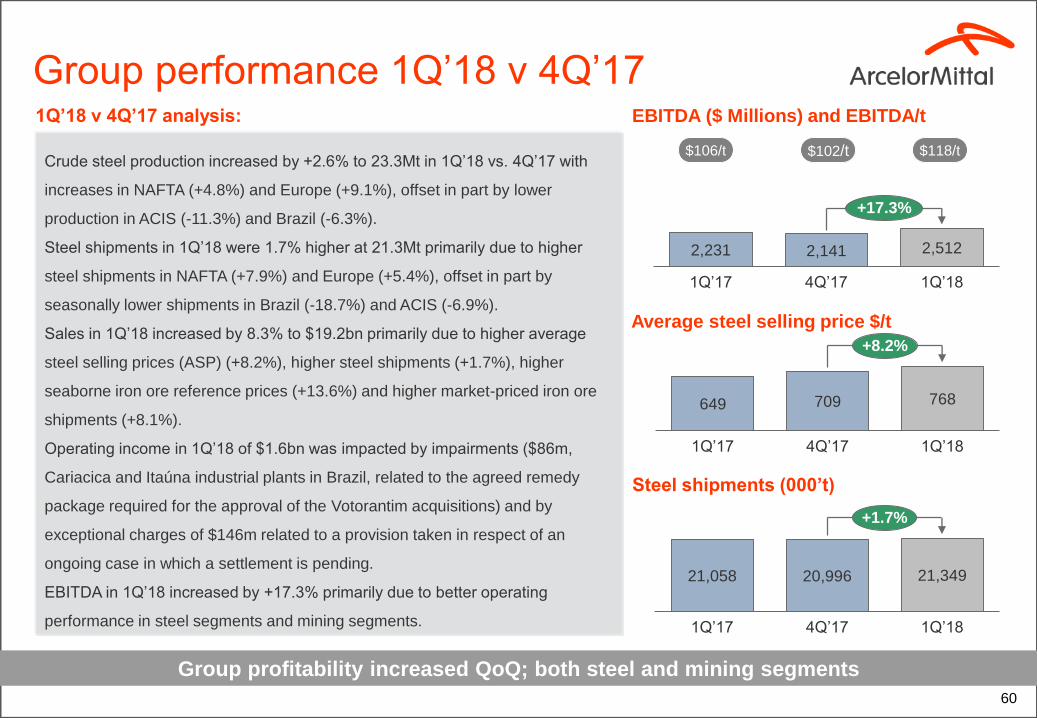
Group performance 1Q’18 v 4Q’17
Group profitability increased QoQ; both steel and mining segments
Average steel selling price $/t
Steel shipments (000’t)
EBITDA ($ Millions) and EBITDA/t
649 709 768
1Q’17 4Q’17 1Q’18
+8.2%
21,058 20,996 21,349
4Q’171Q’17 1Q’18
+1.7%
2,231 2,141 2,512
1Q’181Q’17 4Q’17
+17.3%
$106/t $102/t $118/tCrude steel production increased by +2.6% to 23.3Mt in 1Q’18 vs. 4Q’17 with
increases in NAFTA (+4.8%) and Europe (+9.1%), offset in part by lower
production in ACIS (-11.3%) and Brazil (-6.3%).
Steel shipments in 1Q’18 were 1.7% higher at 21.3Mt primarily due to higher
steel shipments in NAFTA (+7.9%) and Europe (+5.4%), offset in part by
seasonally lower shipments in Brazil (-18.7%) and ACIS (-6.9%).
Sales in 1Q’18 increased by 8.3% to $19.2bn primarily due to higher average
steel selling prices (ASP) (+8.2%), higher steel shipments (+1.7%), higher
seaborne iron ore reference prices (+13.6%) and higher market-priced iron ore
shipments (+8.1%).
Operating income in 1Q’18 of $1.6bn was impacted by impairments ($86m,
Cariacica and Itaúna industrial plants in Brazil, related to the agreed remedy
package required for the approval of the Votorantim acquisitions) and by
exceptional charges of $146m related to a provision taken in respect of an
ongoing case in which a settlement is pending.
EBITDA in 1Q’18 increased by +17.3% primarily due to better operating
performance in steel segments and mining segments.
1Q’18 v 4Q’17 analysis:

61
NAFTA performance 1Q’18 v 4Q’17
NAFTA profitability increased primarily due to higher steel volumes
Average steel selling price $/t
Steel shipments (000’t)
EBITDA ($ Millions) and EBITDA/t
719 748 779
1Q’17 4Q’17 1Q’18
+4.3%
5,610 5,150 5,559
4Q’171Q’17 1Q’18
+7.9%
524 292 440
1Q’17 4Q’17 1Q’18
+50.7%
$93/t $57/t $79/t
Crude steel production increased by 4.8% to 5.9Mt in 1Q’18 as compared to
5.6Mt for 4Q’17, primarily reflecting market improvement in the US and
recovery following operational issues in Mexico in the prior quarter.
Steel shipments increased by 7.9% to 5.6Mt driven primarily by an increase
in volumes in flat products on account of improved market fundamentals,
following the destock that negatively impacted 4Q’17.
Sales in 1Q’18 increased by 10.6% to $4.8bn primarily due to higher steel
shipment volumes as discussed above, and higher average steel selling
prices +4.3% (for both flat products +3.5% and long products +9.1%).
EBITDA in 1Q’18 increased by 50.7% to $440m primarily due to higher steel
shipment volumes (+7.9%).
1Q’18 v 4Q’17 analysis:

Improvement
Crude steel achievable capacity (million Mt)
NAFTA
16.3
USA Canada Mexico
Long
Flat6.2
5.6
Flat
Long
82.0%
NAFTA
18.0%
100.0%
Number of facilities (BF and EAF)
NAFTA No. of BF No. of EAF
USA 7 2
Canada 3 4
Mexico 1 4
Total 11 10
Note: IH Bar facility closed in June 2015; Georgetown wire rod facility closed in August 2015, Vinton and LaPlace sold in 2Q 2016
NAFTA leading producer with 28.1Mt /pa installed capacity
62
63
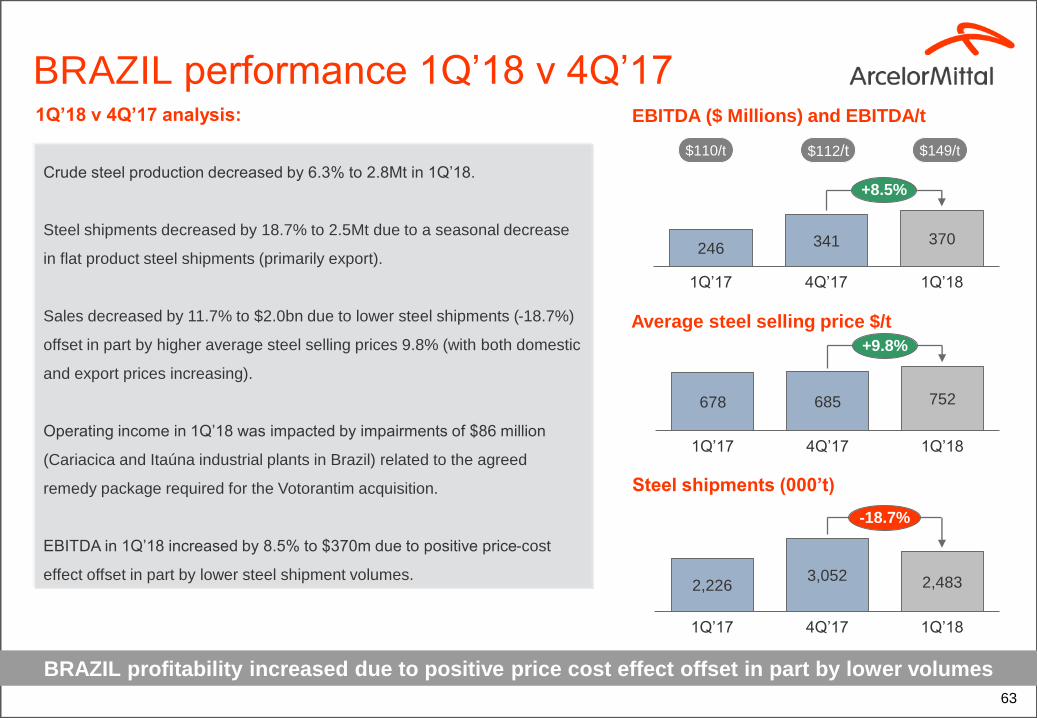
BRAZIL performance 1Q’18 v 4Q’17
BRAZIL profitability increased due to positive price cost effect offset in part by lower volumes
Average steel selling price $/t
Steel shipments (000’t)
EBITDA ($ Millions) and EBITDA/t
678 685 752
1Q’17 4Q’17 1Q’18
+9.8%
2,2263,052 2,483
1Q’17 1Q’184Q’17
-18.7%
246 341 370
1Q’17 4Q’17 1Q’18
+8.5%
$110/t $112/t $149/t
Crude steel production decreased by 6.3% to 2.8Mt in 1Q’18.
Steel shipments decreased by 18.7% to 2.5Mt due to a seasonal decrease
in flat product steel shipments (primarily export).
Sales decreased by 11.7% to $2.0bn due to lower steel shipments (-18.7%)
offset in part by higher average steel selling prices 9.8% (with both domestic
and export prices increasing).
Operating income in 1Q’18 was impacted by impairments of $86 million
(Cariacica and Itaúna industrial plants in Brazil) related to the agreed
remedy package required for the Votorantim acquisition.
EBITDA in 1Q’18 increased by 8.5% to $370m due to positive price-cost
effect offset in part by lower steel shipment volumes.
1Q’18 v 4Q’17 analysis:

Long
Flat
BRAZIL facilities
Tubarao
Monlevade
Piracicaba
The map is showing primary facilities excl. Pipes and Tubes.
Acindar
Improvement
Crude steel achievable capacity (million Mt)
Brazil
1.4
Flat
Argentina
Long
Brazil
10.5
Flat
Long
Brazil
100.0%
41.0%
59.0%
Number of facilities (BF and EAF)
No. of BF No. of EAF
Flat 3 -
Long 3 6
Total 6 6
Geographical footprint and logistics
Brazil leading producer with 11.9t /pa installed capacity
Juiz de Flora
Vega
64On April 20, 2018, following the approval by the Brazilian antitrust authority – CADE of the combination of ArcelorMittal Brasil’s and Votorantim’s long steel businesses in Brazil subject to the fulfilment of divestment commitments, ArcelorMittal Brasil agreed to
dispose of its two production sites of Cariacica and Itaúna, as well as some drawing equipment of ArcelorMittal Brasil and ArcelorMittal Sul-Fluminense. The sale was completed early May 2018 to the Mexican Group Simec S.A.B. de CV. A second package
of some drawing equipment of ArcelorMittal Brasil and ArcelorMittal Sul-Fluminense were sold to the company Aço Verde do Brasil as part of CADE's conditional approval. The figures on the slide do not reflect this change and will be updated at 2018 YE.
65
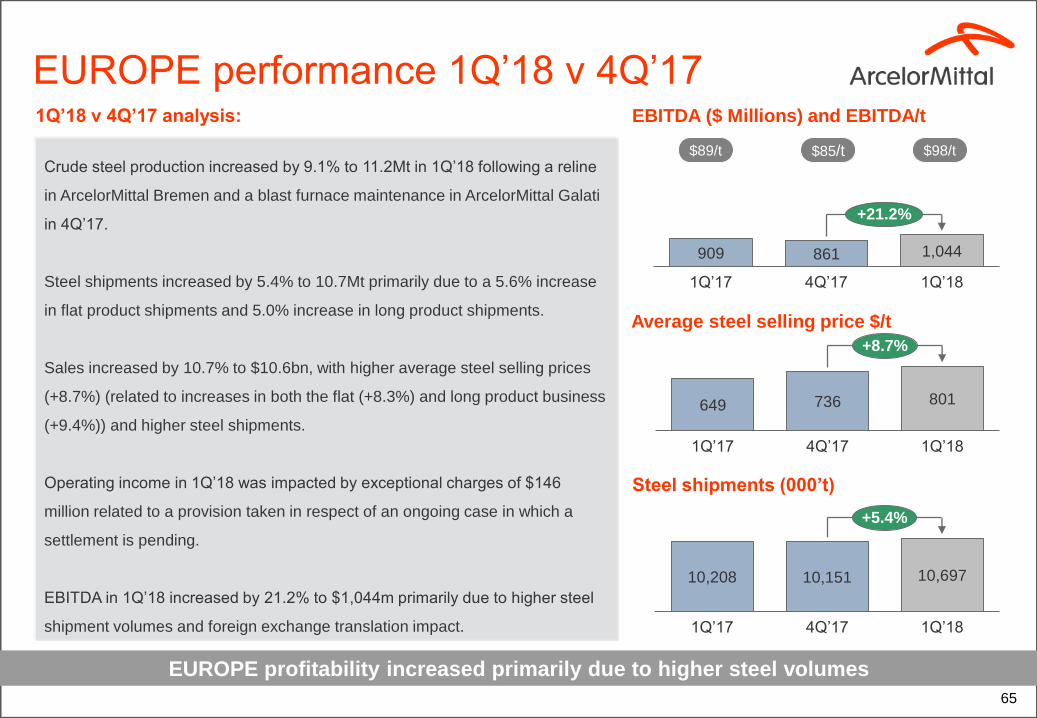
EUROPE performance 1Q’18 v 4Q’17
EUROPE profitability increased primarily due to higher steel volumes
Average steel selling price $/t
Steel shipments (000’t)
EBITDA ($ Millions) and EBITDA/t
649 736 801
1Q’17 4Q’17 1Q’18
+8.7%
10,208 10,151 10,697
1Q’17 4Q’17 1Q’18
+5.4%
909 861 1,044
1Q’17 4Q’17 1Q’18
+21.2%
$89/t $85/t $98/tCrude steel production increased by 9.1% to 11.2Mt in 1Q’18 following a reline
in ArcelorMittal Bremen and a blast furnace maintenance in ArcelorMittal Galati
in 4Q’17.
Steel shipments increased by 5.4% to 10.7Mt primarily due to a 5.6% increase
in flat product shipments and 5.0% increase in long product shipments.
Sales increased by 10.7% to $10.6bn, with higher average steel selling prices
(+8.7%) (related to increases in both the flat (+8.3%) and long product business
(+9.4%)) and higher steel shipments.
Operating income in 1Q’18 was impacted by exceptional charges of $146
million related to a provision taken in respect of an ongoing case in which a
settlement is pending.
EBITDA in 1Q’18 increased by 21.2% to $1,044m primarily due to higher steel
shipment volumes and foreign exchange translation impact.
1Q’18 v 4Q’17 analysis:
Improvement
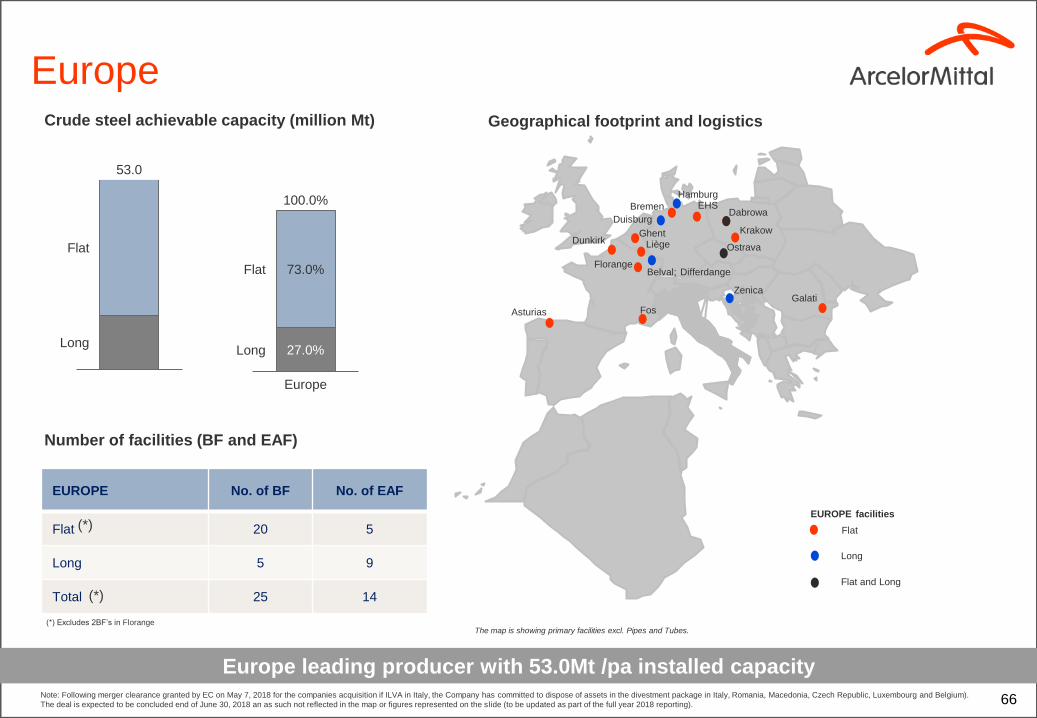
Crude steel achievable capacity (million Mt)
Europe
Flat
Long
53.0
27.0%
73.0%
Europe
Flat
Long
100.0%
Number of facilities (BF and EAF)
EUROPE No. of BF No. of EAF
Flat 20 5
Long 5 9
Total 25 14
Geographical footprint and logistics
(*) Excludes 2BF’s in Florange
(*)
(*)
Europe leading producer with 53.0Mt /pa installed capacity
The map is showing primary facilities excl. Pipes and Tubes.
Long
Flat
EUROPE facilities
Asturias
Dunkirk
Bremen
Florange
LiègeGhent
EHSDabrowa
Krakow
Fos
GalatiZenica
Ostrava
Flat and Long
Hamburg
Belval; Differdange
66
Duisburg
Note: Following merger clearance granted by EC on May 7, 2018 for the companies acquisition if ILVA in Italy, the Company has committed to dispose of assets in the divestment package in Italy, Romania, Macedonia, Czech Republic, Luxembourg and Belgium).
The deal is expected to be concluded end of June 30, 2018 an as such not reflected in the map or figures represented on the slide (to be updated as part of the full year 2018 reporting).

67
ACIS performance 1Q’18 v 4Q’17
ACIS profitability decreased due to lower steel volumes
Average steel selling price $/t
Steel shipments (000’t)
EBITDA ($ Millions) and EBITDA/t
502 546 610
1Q’17 4Q’17 1Q’18
+11.8%
3,221 3,254 3,029
4Q’17 1Q’181Q’17
-6.9%
191423 363
1Q’17 4Q’17 1Q’18
-14.1%
$59/t $130/t $120/tCrude steel production in 1Q’18 decreased by 11.3% to 3.4Mt in 1Q’18
primarily due to blast furnace #9 reline and unplanned maintenance in
Ukraine.
Steel shipments decreased by 6.9% to 3.0Mt primarily due to lower steel
shipments in Ukraine offset in part by seasonally higher steel shipment in
South Africa.
Sales in 1Q’18 increased by 2.0% to $2.1bn primarily due to higher average
steel selling prices (+11.8%) across all businesses, offset in part by lower
steel shipments (-6.9%).
EBITDA in 1Q’18 decreased by 14.1% to $363m primarily due to lower
volumes in Ukraine (negatively impacted by planned and unplanned
maintenance).
1Q’18 v 4Q’17 analysis:
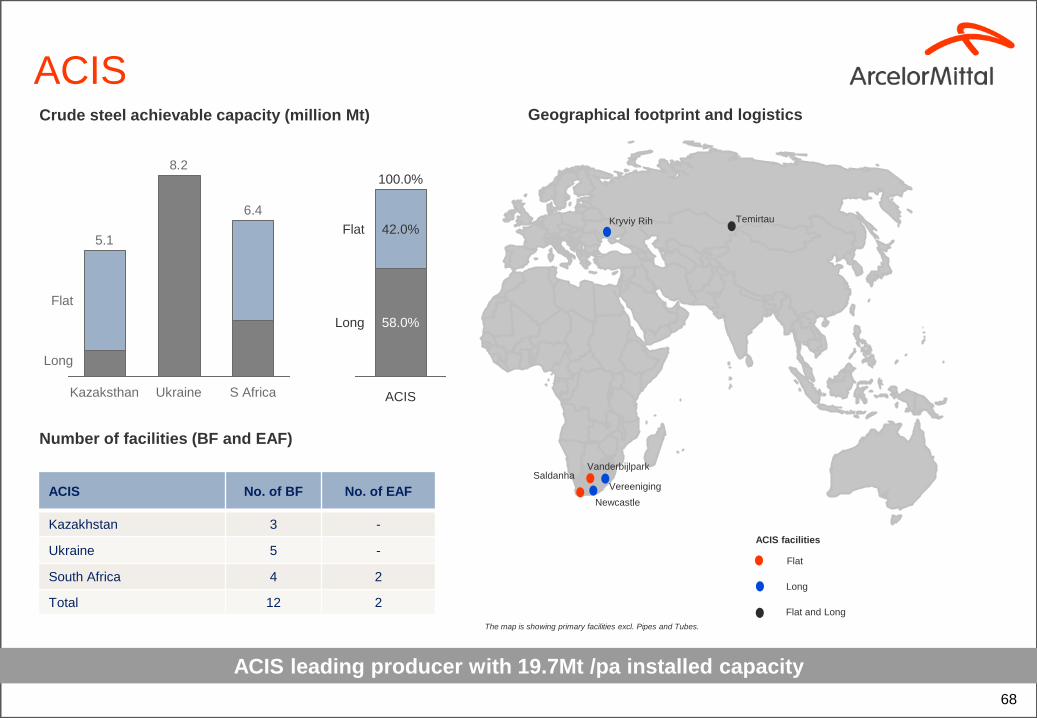
Crude steel achievable capacity (million Mt)
ACIS
8.2
Long
6.4
UkraineKazaksthan
5.1
Flat
S Africa
Long
Flat
58.0%
42.0%
100.0%
ACIS
Number of facilities (BF and EAF)
ACIS No. of BF No. of EAF
Kazakhstan 3 -
Ukraine 5 -
South Africa 4 2
Total 12 2
Geographical footprint and logistics
ACIS leading producer with 19.7Mt /pa installed capacity
The map is showing primary facilities excl. Pipes and Tubes.
Long
Flat
ACIS facilities
Kryviy Rih Temirtau
Vanderbijlpark
VereenigingSaldanha
Newcastle
4
68
Flat and Long
69
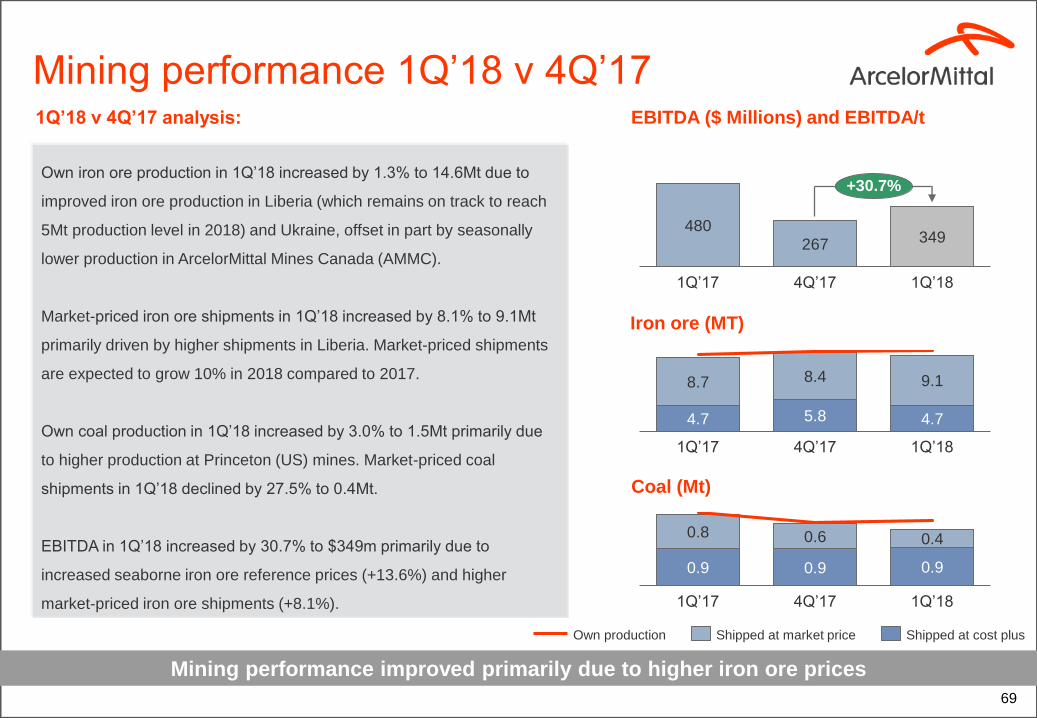
Mining performance 1Q’18 v 4Q’17
Mining performance improved primarily due to higher iron ore prices
Iron ore (MT)
Coal (Mt)
EBITDA ($ Millions) and EBITDA/t
480267 349
4Q’171Q’17 1Q’18
+30.7%Own iron ore production in 1Q’18 increased by 1.3% to 14.6Mt due to
improved iron ore production in Liberia (which remains on track to reach
5Mt production level in 2018) and Ukraine, offset in part by seasonally
lower production in ArcelorMittal Mines Canada (AMMC).
Market-priced iron ore shipments in 1Q’18 increased by 8.1% to 9.1Mt
primarily driven by higher shipments in Liberia. Market-priced shipments
are expected to grow 10% in 2018 compared to 2017.
Own coal production in 1Q’18 increased by 3.0% to 1.5Mt primarily due
to higher production at Princeton (US) mines. Market-priced coal
shipments in 1Q’18 declined by 27.5% to 0.4Mt.
EBITDA in 1Q’18 increased by 30.7% to $349m primarily due to
increased seaborne iron ore reference prices (+13.6%) and higher
market-priced iron ore shipments (+8.1%).
1Q’18 v 4Q’17 analysis:
4.7 5.8 4.7
8.7 8.4 9.1
1Q’181Q’17 4Q’17
0.9 0.9 0.9
0.8 0.6 0.4
1Q’184Q’171Q’17
Own production Shipped at market price Shipped at cost plus

* Includes share of production
1) ArcelorMittal entered into an agreement to sell 15% of its stake in AM Mines Canada to a consortium lead POSCO and China Steel Corporation (CSC).
2) New exploration projects, Indian Iron Ore & Coal exploration, Coal of Africa (9.71%) is excluded in the above .
3) On Jan 19, 2015, ArcelorMittal announced the sale of its interest in the Kuzbass Coal mines in the Kemerovo region of Siberia, Russia, to Russia’s National Fuel Company (NTK). This transaction closed on December 31, 2014.
A global mining portfolio addressing Group
steel needs and external market
Key assets and projects
USA Iron Ore
Minorca 100%
Hibbing 62.31%*
Mexico Iron Ore
Las Truchas &
Volcan 100%;
Pena 50%*Liberia
Iron Ore 85%
Brazil
Iron Ore
100%
Canada
AMMC 85% (1)
Bosnia
Iron Ore
51%
USA Coal
100%
Ukraine
Iron Ore
95.13%
Kazakhstan
Coal
8 mines 100%
Kazakhstan Iron
Ore
4 mines 100%
Iron ore mine
Coal mine
Canada
Baffinland 31.07%
Geographically diversified mining assets
70
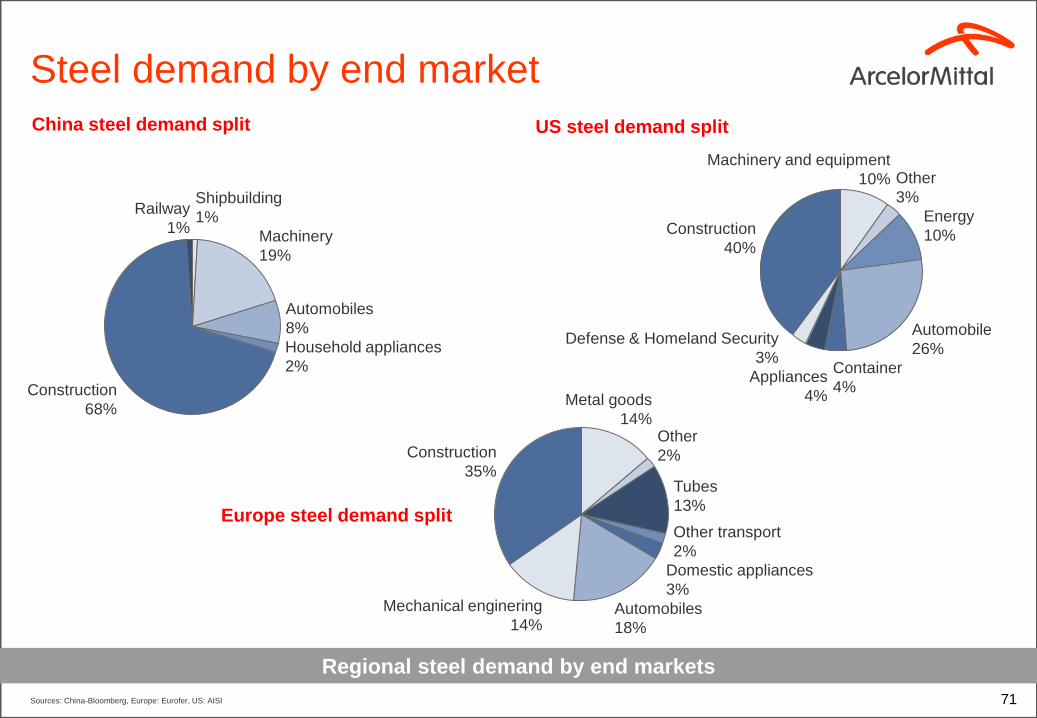
Steel demand by end market
Europe & NAFTA
China steel demand split
Railway
1%
Construction
68%
Household appliances
2%
Automobiles
8%
Machinery
19%
Shipbuilding
1%
Other transport
2%
Tubes
13%
Other
2%
Metal goods
14%
Mechanical enginering
14%
Domestic appliances
3%
Automobiles
18%
Construction
35%
Construction
40%
Defense & Homeland Security
3%
Appliances
4%
Machinery and equipment
10%
Automobile
26%
Container
4%
Energy
10%
Other
3%
US steel demand split
Europe steel demand split
Regional steel demand by end markets
Sources: China-Bloomberg, Europe: Eurofer, US: AISI 71

Daniel Fairclough – Global Head Investor Relations
+44 207 543 1105
Hetal Patel – UK/European Investor Relations
+44 207 543 1128
Valérie Mella – European/Retail Investor Relations
+44 207 543 1156
Maureen Baker – Fixed Income/Debt Investor Relations
+33 1 71 92 10 26
Lisa Fortuna – US Investor Relations
+312 899 3985
The ArcelorMittal investor relations app is available for download on IOS or android devices
ArcelorMittal IR app and contacts