lamar university non-returning students: spring 2006 to spring 2007 notes: though graduate data are...
TRANSCRIPT

LAMAR UNIVERSITYNon-Returning Students: Spring 2006 to Spring 2007
Notes:
• Though graduate data are available, these data are for undergraduates.
• Excluded are spring 2006 students who graduated (unless they re-enrolled), masters, doctoral, post-bacs, TALH & dual credit HS students.
• These numbers reflect student retention, not admission as few FTICs enroll for spring semesters.
• Goal is to identify segments of the spring 2006 population that appear “at-risk” so retention programs & resources can be focused efficiently.
First the bad news, 2,154 spring 2006 students did not return & 1,675 of them were in (reasonably) “good academic standing”; i.e., were not suspended. These students chose to leave. If LU had retained even a quarter of those non-suspended, the university would have seen an increase in headcount enrollment.
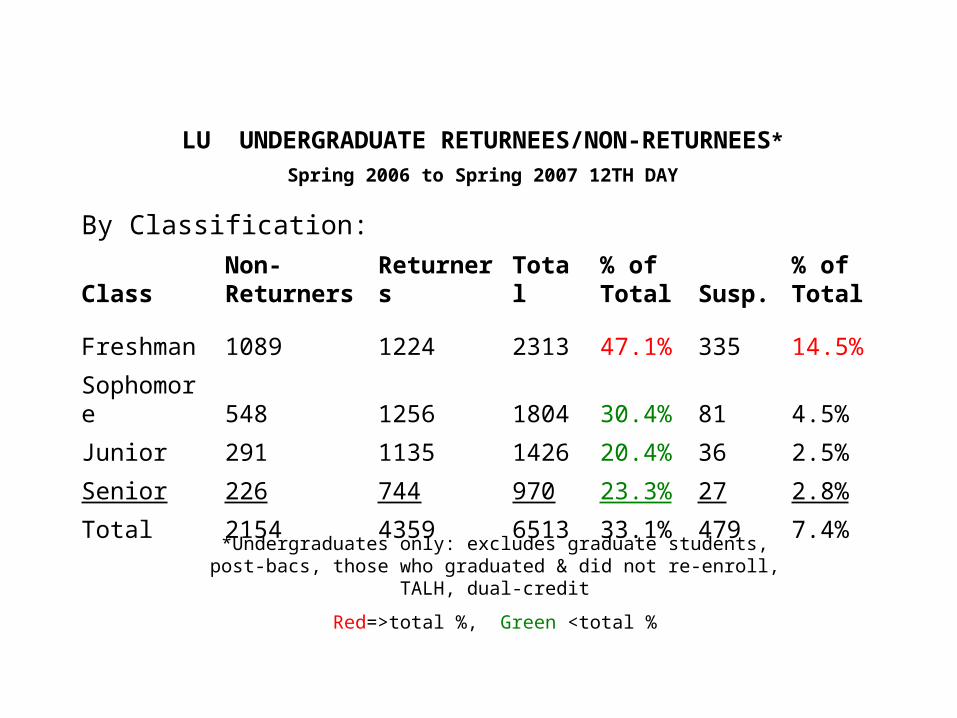
LU UNDERGRADUATE RETURNEES/NON-RETURNEES*
Spring 2006 to Spring 2007 12TH DAY
By Classification:
ClassNon-Returners Returners Total
% of Total Susp.
% of Total
Freshman 1089 1224 2313 47.1% 335 14.5%
Sophomore 548 1256 1804 30.4% 81 4.5%
Junior 291 1135 1426 20.4% 36 2.5%
Senior 226 744 970 23.3% 27 2.8%
Total 2154 4359 6513 33.1% 479 7.4%
*Undergraduates only: excludes graduate students, post-bacs, those who graduated & did not re-enroll, TALH, dual-credit
Red=>total %, Green <total %

Why are freshmen so vulnerable?
SAT
QUARTILE
GRADES
SCH ATTEMPTED
FAMILY INCOME

FRESHMAN (FTIC) GRADES, SAT & RETENTION
•Previous LU research has revealed a sharp and predictable relationship between SAT, GPA & retention.
•The retention % for 1100+ SAT was 75.7%; for 900-1090, 65.6%; for700-890, 54.2% & for <700, 53.9%
•The retention rate for top H.S. 25% was 71.7%, 2nd quarter was 58.1%, 3rd quarter was 47.9% & 4th quarter was 42.4%
•The mean GPA at the end of the first semester for retained students was 2.74
•The mean GPA for non-retained students was 1.97
•The correlation between SAT & GPA for retained students was .82, while that for non-retained was .27
•Retained FTIC’s averaged 12.1 hours vs. 10.7 for non-retained
(F01-03 combined file)

FY 2002 FY 2003 FY 2004 FY 2005 FY 2006
Cohort Retained Rate Cohort Retained Rate Cohort Retained Rate Cohort Retained RateCoho
rt Retained Rate
Fall 2001 Fall 2002 Fall 2002 Fall 2003 Fall
2003 Fall 2004 Fall
2004Fall
2005 Fall
2005 Fall 2006
Low-$ 3-Cnty 198 13568.18
% 277 19168.95
% 316 20163.61% 352 201
57.10% 240 140
58.33%
Low-$ Other-TX 96 58
60.42% 189 130
68.78% 252 162
64.29% 391 213
54.48% 429 226
52.68%
Low-$ Out-State 6 0 0.00% 8 5
62.50% 5 0
0.00% 11 7
63.64% 7 4
57.14%
Total 300 19364.33
% 474 32668.78
% 573 36363.35% 754 421
55.84% 676 370
54.73%
Non Low-$ 3-Cnty 589 428
72.67% 578 417
72.15% 574 397
69.16% 544 376
69.12% 623 417
66.93%
Non Low-$ Other-TX 134 87
64.93% 202 127
62.87% 219 137
62.56% 282 165
58.51% 328 195
59.45%
Non Low-$ Out-TX 9 5
55.56% 5 3
60.00% 8 6
75.00% 15 10
66.67% 7 2
28.57%
Non Low-$ Other Ctry 8 7
87.50% 3 2
66.67% 9 3
33.33% 10 8
80.00% 7 3
42.86%
Total 740 52771.22
% 788 54969.67
% 810 54367.04% 851 559
65.69% 965 617
63.94%
Total 1040 72069.23
% 1262 87569.33
% 1383 90665.51% 1605 980
61.06% 1641 987
60.15%
TUITION/FEES 12 SCH $1,234 $1,234$1,354
(SP) $1,354$1,626
(SP)$1,62
6$1,917
(SP)$1,9
17$1,992
(SP)
PERCENTAGE INCREASE > 9.7% > 20.1% > 17.9% > 3.9%

RETENTION % BY INCOME & RESIDENCE
40
50
60
70
80
$1,234 $1234/$1354 $1354/$1626 $1626/$1017 $1917/$1992
AY02 AY03 AY04 AY05 AY06
YEAR
RA
TE
Low $ 3-cnty Low $ Other
Non low $ 3-cnty Non low $ Other
FTICS

FT/PTNon-Returners Returners Total
% of Total Susp.
% of Total
Full-Time 1452 3436 4888 29.7% 363 7.4%
Part-Time 702 923 1625 43.2% 116 7.1%
Total 2154 4359 6513 33.1% 479 7.4%
By Enrollment Status:

EthnicityNon-Returners Returners Total
% of Total Susp.
% of Total
White 1118 2626 3744 29.9% 164 4.4%
Black 757 1087 1844 41.1% 261 14.2%
Hispanic 122 282 404 30.2% 25 6.2%
Asian 51 136 187 27.3% 5 2.7%
Am. Ind. 14 32 46 30.4% 4 8.7%
Foreign 10 40 50 20.0% 0 0.0%
Unknown 82 156 238 34.5% 20 8.4%
Total 2154 4359 6513 33.1% 479 7.4%
By Ethnicity:

SexNon-Returners Returners Total
% of Total Susp.
% of Total
Male 859 1833 2692 31.9% 194 7.2%
Female 1295 2526 3821 33.9% 285 7.5%
Total 2154 4359 6513 33.1% 479 7.4%
By Gender:
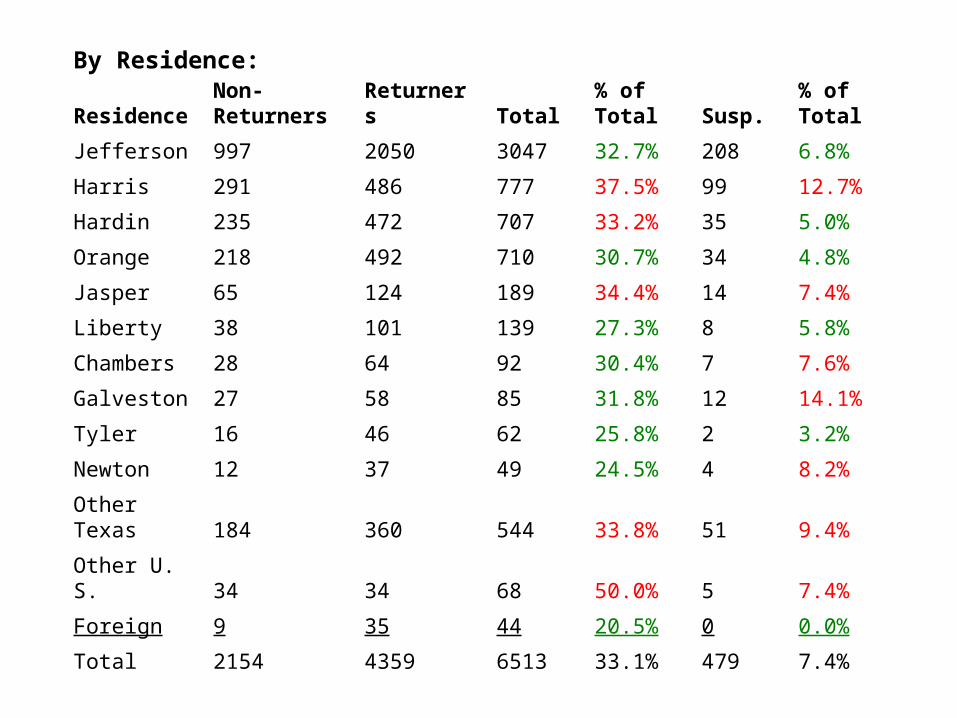
ResidenceNon-Returners Returners Total
% of Total Susp.
% of Total
Jefferson 997 2050 3047 32.7% 208 6.8%
Harris 291 486 777 37.5% 99 12.7%
Hardin 235 472 707 33.2% 35 5.0%
Orange 218 492 710 30.7% 34 4.8%
Jasper 65 124 189 34.4% 14 7.4%
Liberty 38 101 139 27.3% 8 5.8%
Chambers 28 64 92 30.4% 7 7.6%
Galveston 27 58 85 31.8% 12 14.1%
Tyler 16 46 62 25.8% 2 3.2%
Newton 12 37 49 24.5% 4 8.2%
Other Texas 184 360 544 33.8% 51 9.4%
Other U. S. 34 34 68 50.0% 5 7.4%
Foreign 9 35 44 20.5% 0 0.0%
Total 2154 4359 6513 33.1% 479 7.4%
By Residence:

Age GroupNon-Returners Returners Total
% of Total Susp.
% of Total
17 & Under 11 21 32 34.4% 2 6.3%
18 396 550 946 41.9% 130 13.7%
19-21 920 2115 3035 30.3% 210 6.9%
22-24 333 731 1064 31.3% 59 5.5%
25-30 245 464 709 34.6% 44 6.2%
31-35 84 172 256 32.8% 11 4.3%
36-50 147 275 422 34.8% 20 4.7%
51+ 18 31 49 36.7% 3 6.1%
Total 2154 4359 6513 33.1% 479 7.4%
By Age:

CollegeNon-Returners Returners Total
% of Total Susp.
% of Total
A&S 841 1564 2405 35.0% 193 8.0%
BUS 295 747 1042 28.3% 54 5.2%
EDU 226 595 821 27.5% 51 6.2%
EGR 120 466 586 20.5% 25 4.3%
FAC 166 418 584 28.4% 36 6.2%
GU 506 569 1075 47.1% 120 11.2%
Total 2154 4359 6513 33.1% 479 7.4%
By College/General Studies:
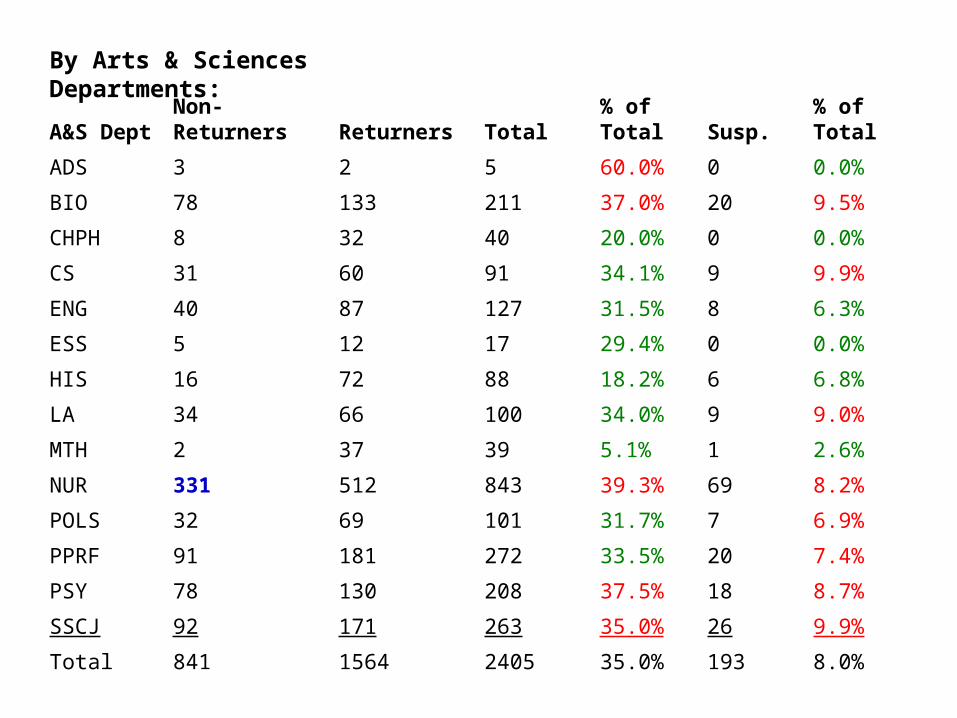
A&S DeptNon-Returners Returners Total
% of Total Susp.
% of Total
ADS 3 2 5 60.0% 0 0.0%
BIO 78 133 211 37.0% 20 9.5%
CHPH 8 32 40 20.0% 0 0.0%
CS 31 60 91 34.1% 9 9.9%
ENG 40 87 127 31.5% 8 6.3%
ESS 5 12 17 29.4% 0 0.0%
HIS 16 72 88 18.2% 6 6.8%
LA 34 66 100 34.0% 9 9.0%
MTH 2 37 39 5.1% 1 2.6%
NUR 331 512 843 39.3% 69 8.2%
POLS 32 69 101 31.7% 7 6.9%
PPRF 91 181 272 33.5% 20 7.4%
PSY 78 130 208 37.5% 18 8.7%
SSCJ 92 171 263 35.0% 26 9.9%
Total 841 1564 2405 35.0% 193 8.0%
By Arts & Sciences Departments:

BUS DeptNon-Returners Returners Total
% of Total Susp.
% of Total
ABL 59 150 209 28.2% 7 3.3%
E&F 22 80 102 21.6% 1 1.0%
ISA 139 315 454 30.6% 36 7.9%
M&M 75 202 277 27.1% 10 3.6%
Total 295 747 1042 28.3% 54 5.2%
By Business Departments:

EDU Dept
Non-Returners Returners Total
% of Total Susp.
% of Total
FCS 36 122 158 22.8% 12 7.6%
HKN 65 129 194 33.5% 15 7.7%
PED 125 344 469 26.7% 24 5.1%
Total 226 595 821 27.5% 51 6.2%
By Education & Human Development Departments:
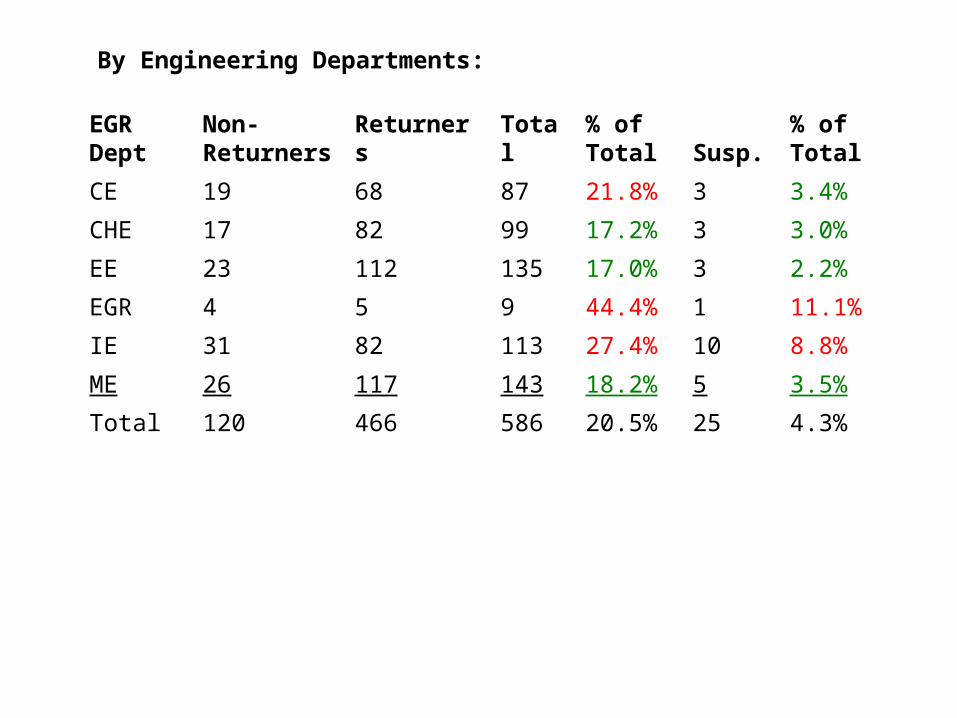
EGR Dept
Non-Returners Returners Total
% of Total Susp.
% of Total
CE 19 68 87 21.8% 3 3.4%
CHE 17 82 99 17.2% 3 3.0%
EE 23 112 135 17.0% 3 2.2%
EGR 4 5 9 44.4% 1 11.1%
IE 31 82 113 27.4% 10 8.8%
ME 26 117 143 18.2% 5 3.5%
Total 120 466 586 20.5% 25 4.3%
By Engineering Departments:
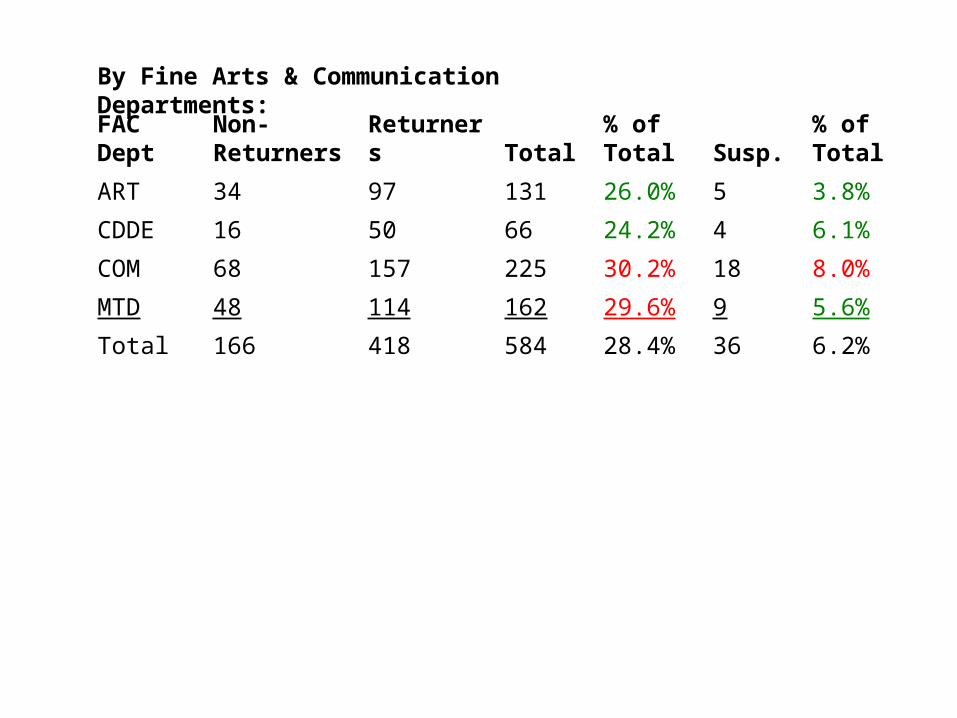
FAC Dept
Non-Returners Returners Total
% of Total Susp.
% of Total
ART 34 97 131 26.0% 5 3.8%
CDDE 16 50 66 24.2% 4 6.1%
COM 68 157 225 30.2% 18 8.0%
MTD 48 114 162 29.6% 9 5.6%
Total 166 418 584 28.4% 36 6.2%
By Fine Arts & Communication Departments:

GU Dept
Non-Returners Returners Total
% of Total Susp.
% of Total
CGSA 489 561 1050 46.6% 123 11.7%
GUNV 17 8 25 68.0% 3 12.0%
Total 506 569 1075 47.1% 126 11.7%
By General Studies:

Using the modal categories of these demographic and academic characteristics, those undergraduates with the greatest risk for non-retention are 18 year old, African-American females from Harris County who are part-time students in General Studies, while the least risk is for 20 year old, international males who are full time engineering students.
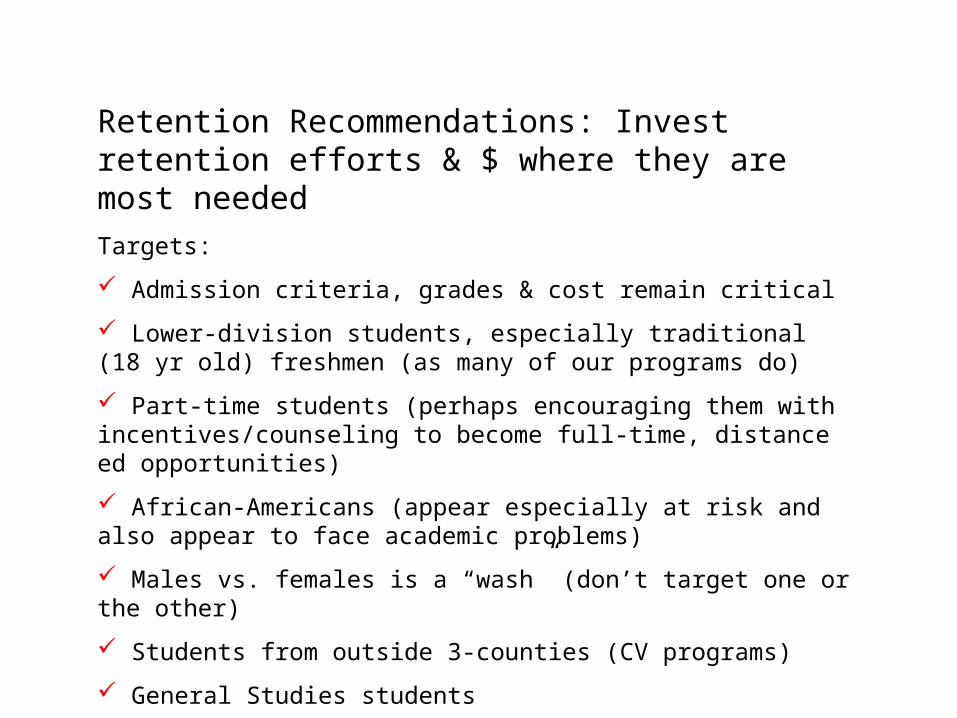
Retention Recommendations: Invest retention efforts & $ where they are most needed
Targets:
Admission criteria, grades & cost remain critical
Lower-division students, especially traditional (18 yr old) freshmen (as many of our programs do)
Part-time students (perhaps encouraging them with incentives/counseling to become full-time, distance ed opportunities)
African-Americans (appear especially at risk and also appear to face academic problems)
Males vs. females is a “wash” (don’t target one or the other)
Students from outside 3-counties (CV programs)
General Studies students
I have names/addresses/telephone numbers so we can survey the non-returnees.
Upside:
Additional and more specific information (financial, transfer ?, Rita problems, future plans, even a p.r. + for LU)
Downside:
Costly, time consuming, low response rate, results of questionable validity, will we really use the results & if we do will retention be improved?
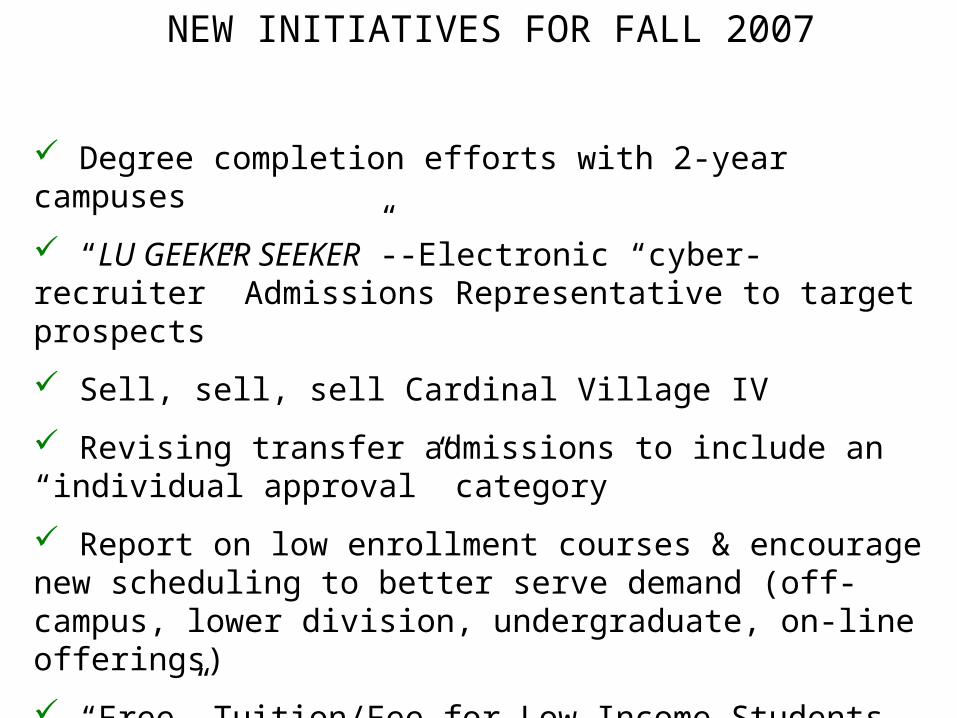
NEW INITIATIVES FOR FALL 2007
Degree completion efforts with 2-year campuses
“LU GEEKER SEEKER”--Electronic “cyber-recruiter” Admissions Representative to target prospects
Sell, sell, sell Cardinal Village IV
Revising transfer admissions to include an “individual approval” category
Report on low enrollment courses & encourage new scheduling to better serve demand (off-campus, lower division, undergraduate, on-line offerings)
“Free” Tuition/Fee for Low Income Students