laminar burning velocity and explosion index of lpg–air ... benha/mechanical engineering... ·...
TRANSCRIPT

Available online at www.sciencedirect.com
www.fuelfirst.com
Fuel 87 (2008) 39–57
Laminar burning velocity and explosion index of LPG–airand propane–air mixtures
A.S. Huzayyin a, H.A. Moneib b, M.S. Shehatta a, A.M.A. Attia a,*
a High Institute of Technology, Benha University, Benha, Egyptb Faculty of Engineering-El-Matteria, Helwan University, Cairo, Egypt
Received 12 October 2006; received in revised form 27 March 2007; accepted 3 April 2007Available online 4 May 2007
Abstract
The determination of burning velocity is very important for the calculations used in hazardous waste explosion protection and fueltank venting, which has a direct impact on environmental protection. The scope of the present study encompass an extensive study tomap the variations of the laminar burning velocity and the explosion index of LPG–air and propane–air mixtures over wide ranges ofequivalence ratio (U = 0.7–2.2) and initial temperature (Ti = 295–400 K) and pressure (Pi = 50–400 kPa). For this purpose a cylindricalcombustion bomb was developed. The reliability and accuracy of the built up facility together with the calculation algorithm are con-firmed by comparing the values of the laminar burning velocity obtained for a standard fuel (propane at normal pressure normal tem-perature conditions, NPT) with those available in the literature. The burning velocity was determined using different models dependingon the pressure history (P–t) of the central ignition combustion process at the minimum ignition energy.
The data obtained for the laminar burning velocity is correlated to SL = SL0(T/T0)a(P/P0)b where SL0 is the burning velocity at NPT,a and b are the temperature and pressure exponents respectively. The value of b is observed to slightly vary with the equivalence ratio forboth fuels. However, propane exhibits higher pressure dependency than that of LPG. The maximum laminar burning velocity found forpropane is nearly 455 mm/s at U = 1.1, while that for LPG is nearly 432 mm/s at 4.5% fuel percent (U � 1.5). The maximum explosionindex, commonly called the ‘‘explosion severity parameter’’, is calculated from the determined laminar burning velocity and is found tobe 93 bar m/s for propane, and nearly 88 bar m/s for LPG.� 2007 Elsevier Ltd. All rights reserved.
Keywords: Burning velocity; Explosion index; Constant volume combustion; LPG
1. Introduction
The determination of the characteristics of combustiblemixtures has and still attracts the interests of combustionspecialists. Special focus is given to particular fundamentalproperties; namely, the laminar burning velocity, minimumignition energy, ignition delay period, flammability limitsand quenching distance [1]. Their values depend mainlyon the fuel type, the mixture strength, the temperatureand the pressure.
0016-2361/$ - see front matter � 2007 Elsevier Ltd. All rights reserved.
doi:10.1016/j.fuel.2007.04.001
* Corresponding author. Tel./fax: +20 13 323 0297.E-mail address: [email protected] (A.M.A. Attia).
Three combustion velocities are being defined duringflame propagation; the burning velocity, flame speed, andthe expansion velocity [2]. The former represents the rateat which the flame front propagates into the unburnedgas. The flame speed is the velocity of the flame front rela-tive to a fixed position, while the expansion velocity is thedifference between the flame speed and the burning velocity.
The accurate determination of laminar burning velocityof combustible mixtures have received particular attentionas being: (i) a basic physiochemical property of the pre-mixed combustible gasses [3], (ii) important in studyingflame stabilization, (iii) directly determines the rate ofenergy released during combustion, (iv) a fundamentalparameter that influences the performance and emissions
40 A.S. Huzayyin et al. / Fuel 87 (2008) 39–57
of the combustion process in many combustion devices [4],(v) needed to understand the laminar flamelet concepts[5,6], (vi) a property that affects the quench layer thickness,ignition delay time and ignition energy of the combustiblemixture and (vii) needed to calibrate and validate the chem-ical reaction mechanisms for combustion simulations ofdifferent applications [5].
The methods used for the determination of the laminarburning velocity are classified-in accordance of the flamemovement into: (a) stationary methods; where the reac-tants are introduced into the reaction zone and (b) propa-gating methods; where the reaction zone is introduced intothe reactants. From these methods, the bomb method isselected as (a) it needs small amount of fuel, (b) it simulatesthe combustion process in SIE, (c) it allows best controlover the initial conditions and mixture composition, (d) itis self-consistence and especially suitable for the conditionsof high pressure [7,8] and (e) it can provide local values ofthe burning velocity at each instantaneous value of pres-sure. The bomb method is however subject to some draw-backs that include lengthy and tedious calculations, theinitiation of a spherical flame at minimum ignition energyand the non-adiabatic conditions that exist near the endof burning due to heat transfer to the walls of the bomb.The former could be resolved by adopting fast data pro-cessing system, while the second may be insured by propermatching between the spark gap and the spark energy.
In the bomb method, the quiescent combustible mixtureis ignited at the center of a rigid volume. Simultaneousrecords of the rising pressure and photography of thegrowing spheres of flame are obtained. As the flame in pro-gress, the expansion of the burned gases in a rigid volumecauses both pressure and temperature of the unburned gasto increase due to adiabatic compression. This progres-sively change in the initial conditions of the mixture makesit very difficult to propose a single equation for the calcu-lation of burning velocity. Therefore, it is necessary toestablish accurate relations between burning velocity andthe pressure rise inside the bomb. The bomb method hasbeen used by many investigators [3,9–19].
The scope of the present work covers three distinctivestages namely:
(i) Stage I: To validate the accuracy of the newly devel-oped test facility by comparing the measured valuesof the laminar burning velocity at different equiva-lence ratios for propane–air mixtures at NTP withthose available in the literature.
(ii) Stage II: To extend the data obtained for propane–airmixtures to cover higher range of initial pressure.
(iii) Stage III: To investigate the effect of equivalenceratio, initial pressure and initial temperature on thevalues of laminar burning velocity, maximum explo-sion pressure, and maximum explosion index forLPG–air mixture. Correlations between variablesare derived for both propane–air and LPG–airmixtures.
2. Experimental setup and procedure
A schematic layout of the combustion bomb used in thestudy is shown in Fig. 1. The combustion bomb is a closedcylindrical chamber that can withstand an internal pressureup to 90 MPa and have an internal diameter of 144.5 mmand length of 150 mm. Its end flanges posses housing forPerspex or quartz glass windows having a view diameterof 30 mm. The bomb is equipped with several ports forgas entry, gas discharge, mounting of bourdon and piezo-electric pressure gauges and ignition spark plug.
To fulfill greater filling accuracy and repeatability, thecombustible mixture preparation is performed in a separatecylindrical vessel having an internal diameter of 300 mmand length of 350 mm. Before each test, the bomb is scav-enged by compressed air at 10 bar and is then evacuateddown to 2.5 kPa. The percentages of the constituents ofthe specified mixture are based on their individual partialpressures. To ensure accurate doses of the constituents,three capacitive pressure transducers of different rangesare used. The vessel is equipped with a 1/3 hp stirrer fanto ensure adequate mixing prior to the charging process.A waiting period of around 3 min – after the completionof the filling process – is found sufficient to ensure quies-cent conditions prior to ignition. The mixture is ignitedat the centre of the bomb by twin stainless steel electrodesof 2 mm diameter having a fixed gap nearly of 0.8 mm. Theignition energy is supplied from a specially designed capac-itive circuit; giving an output voltage of nearly 85 times thesupply value with precise adjustment of the minimum igni-tion energy.
An external electrical heating circuit is incorporated atthe outside surface of the bomb to facilitate uniform heat-ing of the mixture within the bomb to the desired initialtemperature of the test.
The electric pulse generated at the moment of spark fir-ing is used to trigger the digital storage oscilloscope thatmonitors and stores both the pressure versus time signaland the triggering signal. The analog data is converted todigital form via a data acquisition card being plugged intoPC. The pressure history is collected at a sampling rate of31,250 samples/s and saved in EXCEL sheet for later anal-ysis. The mean history for at least three identical runs isused for the calculation of the burning velocity. The com-bustion products are analyzed for CO2, CO, O2 and NOx
using ANAPOL AG-model EU200 exhaust gas analyzer.
3. Thermodynamic equations
In the bomb method, the laminar burning velocity canbe determined either by the constant volume (integralapproach) or constant pressure (differential approach)technique. Both ways has been proved to yield essentiallythe same results [2,3]. In the former, the equations are inte-grated over a finite time, while in the later they are solvedat instant time. The constant volume technique utilizes thefull advantages of the combustion bomb method, but more

Discharge to gas analyzer
Needle valve (14 in)
13 hp Stirrer
motor
Cylindrical BombID=144.5 mm,
L=150 mm
0 to
17
bar
gaug
e
0 to
1.7
bar
Abs
.
Fresh air from compressed tank
Ball valve (14 in)
Separate mixing and preparation tank
Vacuum pump 0 to
3.4
bar
gau
ge
Cap
aciti
ve p
ress
ure
tran
sduc
ers
Fuel Bottle
Ignitioncircuit
AC Variabletransformer
220 AC VSupply
Ignition sensing coil
Personal computer (P. II 233MHz) With DAC (CIO-DAS1602/12)
Low noisecoaxial cable
OscilloscopeTektronix 2220
Charge amplifierNEXUS 26290AOS1
Piezoelectric pressuretransducer PCB112B11
Two extendedelectrodes
4 Electric heaters(each 2 kW)
Prerssure gauge-1 to 9 bar
Fig. 1. Layout of the experimental setup.
A.S. Huzayyin et al. / Fuel 87 (2008) 39–57 41
comprehensive and complicated equations are needed thanfor the constant pressure technique. The equations neededfor both techniques can be derived according to the follow-ing assumptions:
(a) An isentropic spherical flame front propagates due tocentral ignition.
(b) Thin flame thickness or reaction zone; negligibleflame thickness this means there is only burned andunburned gases (two zone model).
(c) Adiabatic equilibrium of the burned and unburnedgas zone.
(d) The values of burnt gas characteristics (as density andspecific heat ratio) behind the flame front can beapproximated as average values corresponding tothe adiabatic temperature.
(e) Pressure at any instant is uniform throughout theentire volume of the bomb.
(f) Mixture inside the vessel obeys the ideal gas law.
These assumptions are generally considered valid (seedetail description by Rallis and Garforth [20]) due to thespeed at which the combustion process proceeds.
The constant pressure technique is limited to the pre-pressure period; where the pressure rise does not exceedabout 10% of the initial value. Burning velocity can bedetermined using flame radius record and/or pressurerecord during the flame propagation inside the bombthroughout the pre-pressure period. This technique wasfirst introduced by Lewis and Von Elbe [9]. Manton et al.
[10] developed corroborative equations for the Von Elbemodel [9], SL can be calculated using:
(a) the slope of the flame radius record in conjunctionwith pressure record [identical to that used by Fiocket al. [21], and
(b) only the flame radius record with the thermodynam-ically computed value of the equilibrium pressure dueto adiabatic constant volume combustion.
Manton et al. [10] concluded that the pressure record issatisfactory to calculate the burning velocity. Another formfrom model of Lewis and Von Elbe [9] is derived by Bard-ley and Mitcheson [22] and Dahoe et al. [17]. Bradley andMitcheson [22] stated their model as universal expressionrelates pressure rise to the burning velocity as
dPdt¼ 3SLqu
Rsqi
ðP e � P iÞ½1� ðP i=P Þ1=cufðP e � P Þ=P e � P ig�2=3
ð1Þ
where qu is the density of unburned mixture at the instan-taneous combustion process, cu is the corresponding spe-cific heat ratio of unburned mixture, P is thecorresponding pressure value at instantaneous period dur-ing combustion, Pe is the equilibrium end pressure due toconstant volume combustion and Pi is the initial pressure.
The whole advantages of the bomb method can beachieved by developing a model from which the burningvelocity can be calculated over the whole combustion
42 A.S. Huzayyin et al. / Fuel 87 (2008) 39–57
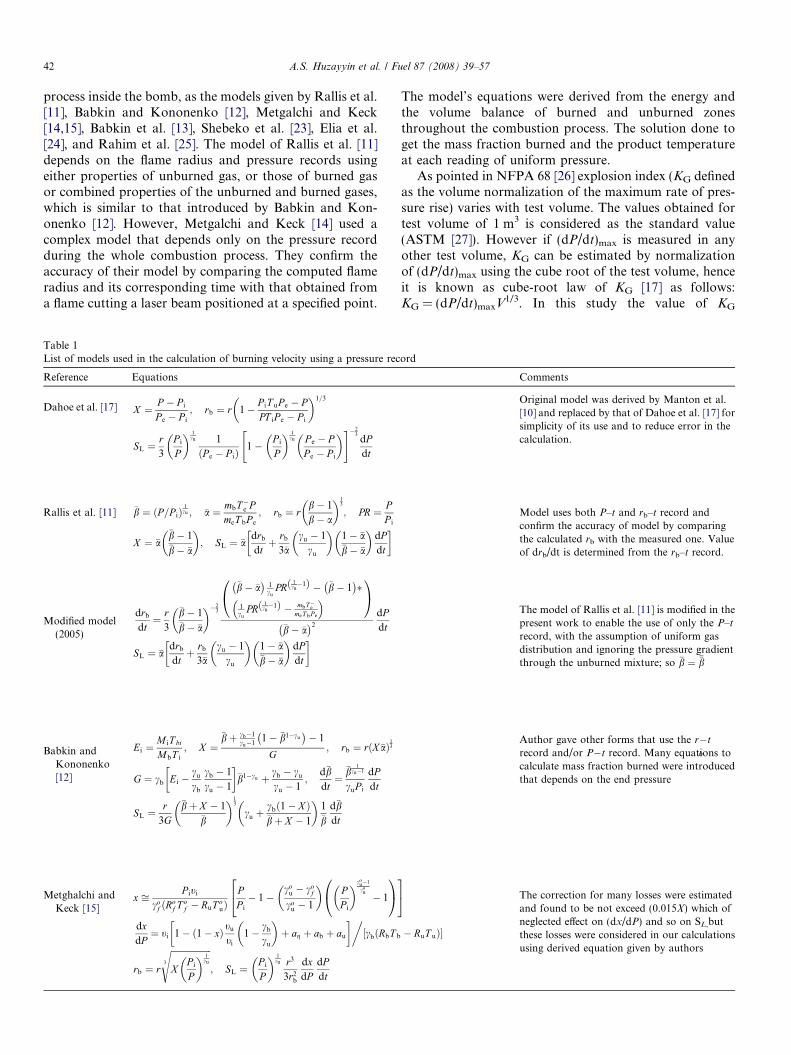
process inside the bomb, as the models given by Rallis et al.[11], Babkin and Kononenko [12], Metgalchi and Keck[14,15], Babkin et al. [13], Shebeko et al. [23], Elia et al.[24], and Rahim et al. [25]. The model of Rallis et al. [11]depends on the flame radius and pressure records usingeither properties of unburned gas, or those of burned gasor combined properties of the unburned and burned gases,which is similar to that introduced by Babkin and Kon-onenko [12]. However, Metgalchi and Keck [14] used acomplex model that depends only on the pressure recordduring the whole combustion process. They confirm theaccuracy of their model by comparing the computed flameradius and its corresponding time with that obtained froma flame cutting a laser beam positioned at a specified point.
Table 1List of models used in the calculation of burning velocity using a pressure rec
Reference Equations
Dahoe et al. [17] X ¼ P � P i
P e � P i
; rb ¼ r 1� P iT uP e � PPT iP e � P i
� �1=3
SL ¼r3
P i
P
� � 1cu 1
ðP e � P iÞ1� P i
P
� � 1cu P e � P
P e � P i
� �" #�23dPdt
Rallis et al. [11] �b ¼ ðP=P iÞ1cu ; �a ¼ mbT�e P
meT bP e
; rb ¼ rb� 1
b� a
� �13
; PR ¼ PP i
X ¼ �a�b� 1�b� �a
� �; SL ¼ �a
drb
dtþ rb
3�acu � 1
cu
� �1� �a�b� �a
� �dPdt
� �
Modified model(2005)
drb
dt¼ r
3
�b� 1�b� �a
� ��23
�b� �a� �
1cu
PR1cu�1ð Þ � �b� 1
� ��
1cu
PR1cu�1ð Þ � mbT�e
meT bP e
� 0@
1A
�b� �a� �2
dPdt
SL ¼ �adrb
dtþ rb
3�acu � 1
cu
� �1� �a�b� �a
� �dPdt
� �
Babkin andKononenko[12]
Ei ¼M iT bi
MbT i
; X ¼�bþ cb�1
cu�11� �b1�cu� �
� 1
G; rb ¼ r X �að Þ
13
G ¼ cb Ei �cu
cb
cb � 1
cu � 1
� ��b1�cu þ cb � cu
cu � 1;
d�bdt¼
�b1
cu�1
cuP i
dPdt
SL ¼r
3G
�bþ X � 1�b
� �13
cu þcb 1� Xð Þ�bþ X � 1
� �1�b
d�bdt
Metghalchi andKeck [15]
x ffi P iti
cof ðRo
f T of � RuT o
uÞPP i
� 1�co
u � cof
cou � 1
� �PP i
� �cou�1
cou � 1
0@
1A
24
35
dxdP¼ ti 1� 1� xð Þ tu
ti
1� cb
cu
� �þ ag þ ab þ au
� �cb RbT bð½
rb ¼ r
ffiffiffiffiffiffiffiffiffiffiffiffiffiffiffiffiffiffiX
P i
P
� � 1cu3
s; SL ¼
P i
P
� � 1cu r3
3r2b
dxdP
dPdt
The model’s equations were derived from the energy andthe volume balance of burned and unburned zonesthroughout the combustion process. The solution done toget the mass fraction burned and the product temperatureat each reading of uniform pressure.
As pointed in NFPA 68 [26] explosion index (KG definedas the volume normalization of the maximum rate of pres-sure rise) varies with test volume. The values obtained fortest volume of 1 m3 is considered as the standard value(ASTM [27]). However if (dP/dt)max is measured in anyother test volume, KG can be estimated by normalizationof (dP/dt)max using the cube root of the test volume, henceit is known as cube-root law of KG [17] as follows:KG = (dP/dt)maxV1/3. In this study the value of KG
ord
Comments
Original model was derived by Manton et al.[10] and replaced by that of Dahoe et al. [17] forsimplicity of its use and to reduce error in thecalculation.
Model uses both P–t and rb–t record andconfirm the accuracy of model by comparingthe calculated rb with the measured one. Valueof drb/dt is determined from the rb–t record.
The model of Rallis et al. [11] is modified in thepresent work to enable the use of only the P–t
record, with the assumption of uniform gasdistribution and ignoring the pressure gradientthrough the unburned mixture; so �b ¼ ��b
Author gave other forms that use the r
b
�t
record and/or P�t record. Many equations tocalculate mass fraction burned were introducedthat depends on the end pressure
� RuT u�
The correction for many losses were estimatedand found to be not exceed (0.015X) which ofneglected effect on (dx/dP) and so on SL,butthese losses were considered in our calculationsusing derived equation given by authors

A.S. Huzayyin et al. / Fuel 87 (2008) 39–57 43
obtained directly from the pressure data using the simpleequation given by Dahoe et al. [17]:
KG ¼dPdt
� �max
V 1=3 ¼ ð36pÞ1=3ðP end � P iÞP end
P i
� � 1cu
SL ð2Þ
In the present work, different models are used in the calcu-lation process; they are listed in Table 1. The original formof the model of Rallis et al. [11] used the flame radius andthe pressure record. The data of flame radius obtainedfrom the pressure record is compared with that measuredby the flame radius record, to validate the accuracy ofthe model. In the present study model of Rallis et al. [11]is modified to enable the calculation of burning velocityusing only the pressure record. The modification is doneby differentiating the corroborative equation, and so theburning velocity can be obtained from the P–t record.
4. Calculation method
The Engineering Equation Solver software ‘‘EES’’ [28] isused to perform all the calculations needed due to its supe-rior features over existing numerical equation-solving pro-grams. The pressure–time data and its correspondingderivative are properly smoothed and entered as a para-metric table in EES to be solved at each data point (startingfrom a pressure rise nearly 1.01Pi until that correspondingto the inflection point). The program data entry alsoincludes the mixture initial conditions (Ti, Pi and the par-tial pressure of the mixture’s constituents) and the fueltype. The calculation of chemical equilibrium is performedfollowing the CHEM_EQUIL external subroutine as thatfound in [29]. The results which are obtained at equilibriumconditions include the reactant and product properties;temperature, specific heat ratio, molecular weight, andthe mole fraction for each constituent, in addition to therelative and absolute error of pressure reading, pressurerise rate, flame radius, burning velocity, and explosionindex. More details in addition to copy of the calculationprogram are presented by Attia [30].
The reactants properties at any point are determinedfrom the JANAF data table knowing the pressure and
Table 2Experimental program
Variables equivalence ratio, U Propane–air from 0.6 to 1
Pressure, Pi 50, 100, 200, 300, and 400Temperature, Ti 305 ± 3 K
Table 3Composition of LPG
Constituents C2H6 C3H8 i-C4H10
Present study (2005) 0.04 26.41 26.32Chakraborty et al. [45] 1.4 30.1 25.6
the corresponding temperature due to isentropic compres-sion as calculated from the following equation:
T R ¼ T i
PP i
� �ðcu�1Þ=cu
ð3Þ
The product characteristics at any point are determinedfrom the chemical equilibrium due to adiabatic constantpressure combustion process at the pressure reading, thatsatisfy:
HRðT RÞ ¼ HPðT PÞ ð4Þ
The thermodynamic properties due to adiabatic constantvolume combustion process are determined due to equilib-rium to satisfy:
U i ¼ U e; or H i � nRRUT i ¼ H e � neRUT e ð5Þ
P e ¼ P i
T e
T i
ne
ni
ð6Þ
As the burned and unburned properties become available,the calculation continue to determine the mass fractionburned, the flame radius, the burning velocity and theexplosion index according to the different thermodynamicmodels listed in Table 1.
5. Experimental program
The entire experimental program is performed accord-ing to data listed in Table 2. Propane of purity of 99.91%(with minors of other hydrocarbons) is supplied by theEgyptian National Gas ‘‘GASCO’’ Co. and is used to val-idate the reliability of the test facility. The domestic usageLPG of has the composition given in Table 3. All runs areperformed at the minimum ignition energy. From the pres-sure–time records, several parameters are derived includingthe maximum pressure, the maximum rate and duration ofpressure rise, the minimum ignition voltage and the igni-tion delay period. The later is defined as time from the startof ignition until the pressure is just increased to 1% of itsinitial value.
.5 with step of 0.1 LPG–air from 0.745 to 2.187
kPa 50, 100, 200, 300, and 400 kPa294 ± 3, 350 ± 3, and 400 ± 3 K
n-C4H10 CnHm Xtheoretical
n m
47.22 3.734 9.468 0.033342.1 3.639 9.262 0.0341
44 A.S. Huzayyin et al. / Fuel 87 (2008) 39–57
6. Experimental results and discussion
6.1. Effect of equivalence ratio
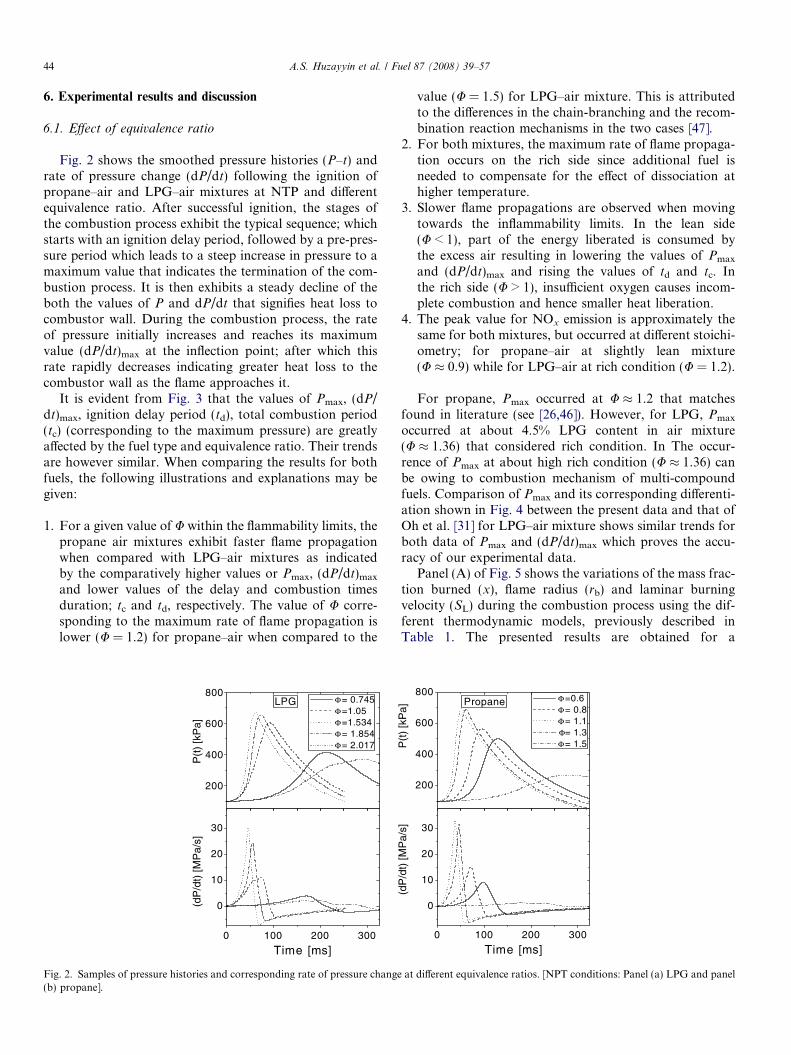
Fig. 2 shows the smoothed pressure histories (P–t) andrate of pressure change (dP/dt) following the ignition ofpropane–air and LPG–air mixtures at NTP and differentequivalence ratio. After successful ignition, the stages ofthe combustion process exhibit the typical sequence; whichstarts with an ignition delay period, followed by a pre-pres-sure period which leads to a steep increase in pressure to amaximum value that indicates the termination of the com-bustion process. It is then exhibits a steady decline of theboth the values of P and dP/dt that signifies heat loss tocombustor wall. During the combustion process, the rateof pressure initially increases and reaches its maximumvalue (dP/dt)max at the inflection point; after which thisrate rapidly decreases indicating greater heat loss to thecombustor wall as the flame approaches it.
It is evident from Fig. 3 that the values of Pmax, (dP/dt)max, ignition delay period (td), total combustion period(tc) (corresponding to the maximum pressure) are greatlyaffected by the fuel type and equivalence ratio. Their trendsare however similar. When comparing the results for bothfuels, the following illustrations and explanations may begiven:
1. For a given value of U within the flammability limits, thepropane air mixtures exhibit faster flame propagationwhen compared with LPG–air mixtures as indicatedby the comparatively higher values or Pmax, (dP/dt)max
and lower values of the delay and combustion timesduration; tc and td, respectively. The value of U corre-sponding to the maximum rate of flame propagation islower (U = 1.2) for propane–air when compared to the
200
400
600
800Φ= 0.745Φ=1.05Φ=1.534Φ= 1.854Φ= 2.017
P(t
) [k
Pa]
LPG
0
10
20
30
(dP
/dt)
[MP
a/s]
Time [ms]0 100 200 300
Fig. 2. Samples of pressure histories and corresponding rate of pressure change(b) propane].
value (U = 1.5) for LPG–air mixture. This is attributedto the differences in the chain-branching and the recom-bination reaction mechanisms in the two cases [47].
2. For both mixtures, the maximum rate of flame propaga-tion occurs on the rich side since additional fuel isneeded to compensate for the effect of dissociation athigher temperature.
3. Slower flame propagations are observed when movingtowards the inflammability limits. In the lean side(U < 1), part of the energy liberated is consumed bythe excess air resulting in lowering the values of Pmax
and (dP/dt)max and rising the values of td and tc. Inthe rich side (U > 1), insufficient oxygen causes incom-plete combustion and hence smaller heat liberation.
4. The peak value for NOx emission is approximately thesame for both mixtures, but occurred at different stoichi-ometry; for propane–air at slightly lean mixture(U � 0.9) while for LPG–air at rich condition (U = 1.2).
For propane, Pmax occurred at U � 1.2 that matchesfound in literature (see [26,46]). However, for LPG, Pmax
occurred at about 4.5% LPG content in air mixture(U � 1.36) that considered rich condition. In The occur-rence of Pmax at about high rich condition (U � 1.36) canbe owing to combustion mechanism of multi-compoundfuels. Comparison of Pmax and its corresponding differenti-ation shown in Fig. 4 between the present data and that ofOh et al. [31] for LPG–air mixture shows similar trends forboth data of Pmax and (dP/dt)max which proves the accu-racy of our experimental data.
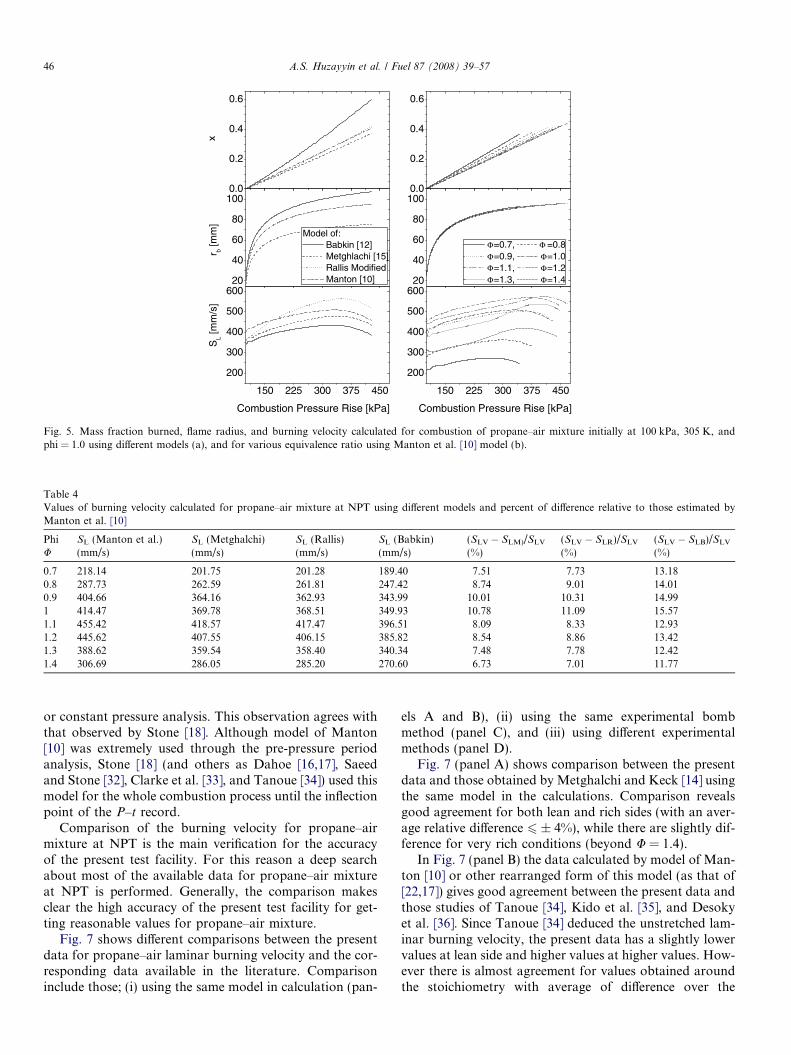
Panel (A) of Fig. 5 shows the variations of the mass frac-tion burned (x), flame radius (rb) and laminar burningvelocity (SL) during the combustion process using the dif-ferent thermodynamic models, previously described inTable 1. The presented results are obtained for a
200
400
600
800Propane Φ=0.6
Φ= 0.8Φ= 1.1Φ= 1.3Φ= 1.5P
(t)
[kP
a]
Time [ms]0 100 200 300
0
10
20
30
(dP
/dt)
[MP
a/s]
at different equivalence ratios. [NPT conditions: Panel (a) LPG and panel

300
400
500
600
700Panel A
LPG-air Propane-air
P max
[kP
a]0
10
20
30
40 Panel B
(dP
/dt)
max
[MP
a/s]
0.8 1.2 1.6 2.00
50
100
150
200
250
Equivalence ratio, ΦEquivalence ratio, Φ
Panel C
Tim
e of
Pm
ax (
t c)[m
s]
Equivalence ratio, Φ0.8 1.2 1.6 2.0
50
100
150
200 Panel D
Tim
e of
(dP
/dt)
max
[ms]
0
5
10
15
20
25
30 Panel E
t d [m
s]
0.8 1.2 1.6 2.00
500
1000
1500
2000
2500Panel F
NO
x [p
pm]
Fig. 3. Different data obtained for both LPG and propane initially at NPT conditions versus equivalence ratios.
A.S. Huzayyin et al. / Fuel 87 (2008) 39–57 45
propane–air mixture initially at Pi = 100 kPa, Ti = 305 Kand U = 1.0, similar behavior but with different valuesare obtained for LPG–air mixtures. The following conclu-sion may be withdrawn:
(i) Approximately all models give a linear relationbetween the mass fraction burned, x and the recordedpressure, P. This verify the simplification of linearrelation between x and P used by Manton et al. [10].
(ii) The value of SL approximately varies linearly withthe recorded pressure. This behavior is not only dueto pressure effect but mainly due to the isentropicincrease in the unburned temperature until a positionbefore the inflection point; where the pressure riserate begins to fall but is still positive indicatingcontinuing pressure rise.
2
5
10
15
20
25
30
(dP
/dt)
max
[MP
a/s]
Panel B
200
400
600
800
Present study (2.56L) Oh et. al. [31] (270L)
LPG concentration [%]
Panel A
P max
[kP
a]
3 4 5 6 7
Fig. 4. The maximum explosion pressure compared with that of Oh et al.[31] and the corresponding maximum rate of pressure rise for LPG at NP.
(iii) There existed greater differences between models;with the model of Babkin [12] giving comparativelyhigher values of x and rb and lower value of SL.
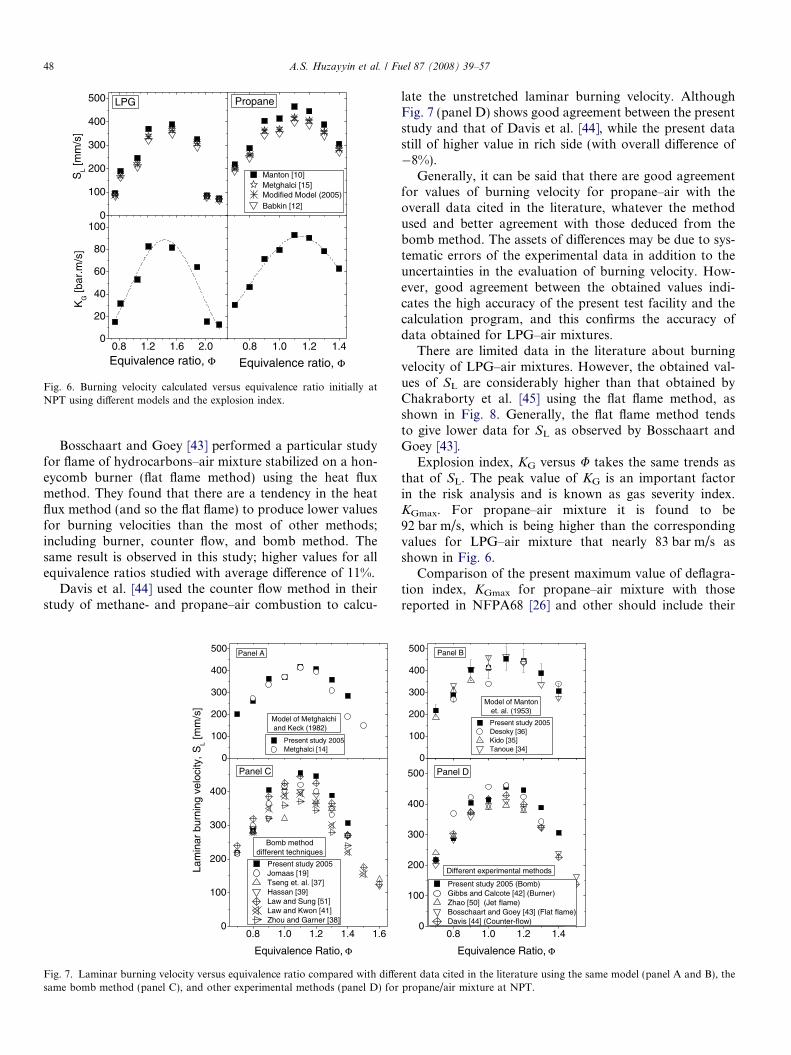
The average values of the burning velocities obtained atthe pre-pressure period using different models are plotted inFig. 6. From which it can be observed that, values of SL
calculated based on the model of Manton et al. [10] givesthe highest values, while those based on Babkin [12] givethe lowest values. While those determined by the presentmodified model and that of Metghalchi and Keck [15] giveclose values. The maximum variation of SL values calcu-lated from different models doe not exceed 15% as deducedfrom Table 4. The comparison reveals the success of thepresent modification done for the model of Rallis et al.[11] and the ability to use this modified model for the deter-mination of burning velocity using only the P–t record.
The variations of SL versus the equivalence ratio forboth LPG–air and propane–air mixture at NPT are shownin Fig. 6. It can be noticed that, the maximum value for SL
occurs at U prior to that at which the maximum value ofpressure occurred. Correspondingly the maximum valueof SL for propane–air mixture take place at U = 1.1 forall models tested. The same is observed for LPG–air; SL
occurred at U � 1.4. The peak of the laminar burningvelocity for propane–air mixture (455 mm/s) is slightlyhigher than that of LPG–air mixture (432 mm/s).
The value of SL for propane–air mixture at stoichiome-tric and NPT conditions are calculated by different authors(as shown in Table 5) and its maximum value occurredwith the corresponding equivalence ratio are tabulated inTable 5. From Table 5, it can conclude that the presentvalue of SL at U = 1 nearly 415 mm/s is comparable withthat deduced by other investigators. In addition there isgood agreement for the maximum value of SL and its stoi-chiometry; 455 mm/s at U = 1.1.
This study make firm the accuracy of the assumption oflinear relation between pressure and mass fraction burnedwhether the model considered is based on constant volume
0.0
0.2
0.4
0.6
x
Model of: Babkin [12] Metghlachi [15] Rallis Modified Manton [10]
0.0
0.2
0.4
0.6
Φ=0.7, Φ =0.8Φ=0.9, Φ=1.0
=1.1, Φ=1.2Φ=1.3, Φ=1.420
40
60
80
100r b [m
m]
20
40
60
80
100
150 225 300 375 450
200
300
400
500
600
SL [m
m/s
]
150 225 300 375 450
200
300
400
500
600
Combustion Pressure Rise [kPa]Combustion Pressure Rise [kPa]
Φ
Fig. 5. Mass fraction burned, flame radius, and burning velocity calculated for combustion of propane–air mixture initially at 100 kPa, 305 K, andphi = 1.0 using different models (a), and for various equivalence ratio using Manton et al. [10] model (b).
Table 4Values of burning velocity calculated for propane–air mixture at NPT using different models and percent of difference relative to those estimated byManton et al. [10]
PhiU
SL (Manton et al.)(mm/s)
SL (Metghalchi)(mm/s)
SL (Rallis)(mm/s)
SL (Babkin)(mm/s)
(SLV � SLM)/SLV
(%)(SLV � SLR)/SLV
(%)(SLV � SLB)/SLV
(%)
0.7 218.14 201.75 201.28 189.40 7.51 7.73 13.180.8 287.73 262.59 261.81 247.42 8.74 9.01 14.010.9 404.66 364.16 362.93 343.99 10.01 10.31 14.991 414.47 369.78 368.51 349.93 10.78 11.09 15.571.1 455.42 418.57 417.47 396.51 8.09 8.33 12.931.2 445.62 407.55 406.15 385.82 8.54 8.86 13.421.3 388.62 359.54 358.40 340.34 7.48 7.78 12.421.4 306.69 286.05 285.20 270.60 6.73 7.01 11.77
46 A.S. Huzayyin et al. / Fuel 87 (2008) 39–57
or constant pressure analysis. This observation agrees withthat observed by Stone [18]. Although model of Manton[10] was extremely used through the pre-pressure periodanalysis, Stone [18] (and others as Dahoe [16,17], Saeedand Stone [32], Clarke et al. [33], and Tanoue [34]) used thismodel for the whole combustion process until the inflectionpoint of the P–t record.
Comparison of the burning velocity for propane–airmixture at NPT is the main verification for the accuracyof the present test facility. For this reason a deep searchabout most of the available data for propane–air mixtureat NPT is performed. Generally, the comparison makesclear the high accuracy of the present test facility for get-ting reasonable values for propane–air mixture.
Fig. 7 shows different comparisons between the presentdata for propane–air laminar burning velocity and the cor-responding data available in the literature. Comparisoninclude those; (i) using the same model in calculation (pan-
els A and B), (ii) using the same experimental bombmethod (panel C), and (iii) using different experimentalmethods (panel D).
Fig. 7 (panel A) shows comparison between the presentdata and those obtained by Metghalchi and Keck [14] usingthe same model in the calculations. Comparison revealsgood agreement for both lean and rich sides (with an aver-age relative difference 6 ± 4%), while there are slightly dif-ference for very rich conditions (beyond U = 1.4).
In Fig. 7 (panel B) the data calculated by model of Man-ton [10] or other rearranged form of this model (as that of[22,17]) gives good agreement between the present data andthose studies of Tanoue [34], Kido et al. [35], and Desokyet al. [36]. Since Tanoue [34] deduced the unstretched lam-inar burning velocity, the present data has a slightly lowervalues at lean side and higher values at higher values. How-ever there is almost agreement for values obtained aroundthe stoichiometry with average of difference over the

Table 5Overview of burning velocity measured for propane–air mixtures at U = 1 and NPT and the maximum value with its corresponding equivalence ratio
Author (year) [Ref.] Method and technique SL (mm/s) SLMax (at U)
Bosschaart and Goey (2004) [43] Flat burner with heat flux 395 410 (1.1)
Gibbs and Calcote (1959) [42] Burner tube with apex-cone frustumarea using Shadowgraph technique
456 464(1.1)
Dugger and Heimel (1952) [48] Burner with total area of outer edgeof the cone shadow
– 402 (1.05)
Joedicke et al. (2005) [49] Nozzle burner with Rayligh scatteringand laser induced fluorescence facilities
– 492 (1.1)
Zhao et al. (2004) [50] Single jet-wall stagnation flame 390 395(1.1)
Davis et al. (2002) [44] Counter flow 418 429 (1.1)Hassan et al. (1998) [39] Spherical bomb using r–t record 400 400 (1.1)
Tanoue (2002) [34] Spherical bomb using r–t record 459.5 467.1 (1.1)
Metghalchi and Keck (1980) [14] Spherical bomb with P–t record 375 415 (1.1)Law and Sung (2000) [51] Counter-Flow, outwardly and inwardly
propagation through spherical bomb425 445 (1.1)
Law and Kwon (2004) [41] Spherical bomb 387 400 (1.06)
Desoky et al. (1990) [36] Spherical bomb with P–t record 340 440 (1.2)
Jomaas et al. (2005) [19] Outwardly spherical bomb with r–t record 415 420 (1.1)
Tanoue (2002) [34] Modeling 425 434.7 (1.1)
Leung and Lindstedt (1995) [52] Modeling 470 –
El Bakali et al. (2004) [53] Modeling 445 470 (1.1)
Zhou and Garner (1996) [38] Cylindrical bomb with particle image velocimetry 380 405 (1.1)
Senecal and Beaulieu (1998) [46] Cylindrical bomb with P–t record – 520 (1.1)
Present study (2005) Cylindrical bomb with P–t record Manton et al.: 415 455 (1.1)Modified model: 369 418 (1.1)Metghalchi-Keck.: 370 419 (1.1)Babkin-Kononenko: 350 397 (1.1)
A.S. Huzayyin et al. / Fuel 87 (2008) 39–57 47
studied range less than ±0.4%, while at the extreme pointsof U = 0.8 and U = 1.3 it reaches to ±15%. Kido et al. [35]determined SL only for lean mixture where U 6 1. How-ever, there is a good agreement over the studied range (withdifference 15% at U = 0.7 and average difference limited to±4.9%). Data obtained by Desoky et al. [36] shows maxi-mum discrepancy at U = 1.0 (nearly �17%), while the over-all comparison reveals limited error reaches ±3.6%).
The stretch effect on laminar burning velocity of pro-pane–air mixtures is studied by many authors using flameradius record like Tseng et al. [37], Zhou and Garner [38],Hassan et al. [39], Liao et al. [40], Law and Kwon [41],and Jomass et al. [19]. It is found that, propane–air flamesare relatively quick to respond to stretch; stretch decreasesthe stretched laminar burning velocity for lean mixtures incontrast to increases it for stoichiometric and rich mixtures.Comparison of the present data with those used the bombmethod to deduce the unstretched laminar burning velocityis shown in Fig. 7 (panel c). Comparison of the presentstretched data with the unstretched data shows good agree-ment in the lean side until U = 1.0. However, present datastill has higher values in lean and rich sides.
Comparison of burning velocity calculated from thebomb method in the present study with those obtainedfrom other experimental methods shown in Fig. 7 (panelD), shows accepted agreement especially when the uncer-tainty of measurements and systematic error associatedwith each method is considered.
Gibbs and Calcote [42] used the burner method to deter-mine burning velocity for propane–air mixtures and theapex-cone in the calculation with shadowgraph techniquefor flame photograph. Data obtained by Gibbs and Calcote[42] is relatively high due to the errors associated with theapex and cone angle method.
Zhao et al. [50] used the single jet-wall stagnation flamewith PIV to obtain unstretched laminar burning velocity ofpropane–air mixture, using linear extrapolation to zerostretch rates. Their data found to oscillate about the pres-ent data starting from slightly higher value (+10%) at verylean then deceased at stoichiometric and rich mixtures(�15%) with average difference reach to �5%. This oscilla-tion in that manner may be opposed the expected behaviorof the unstretched burning velocity but the present discrep-ancy can be accepted.
0
100
200
300
400
500
Manton [10]Metghalci [15]Modified Model (2005)Babkin [12]
SL [m
m/s
]
LPG Propane
0.8 1.2 1.6 2.00
20
40
60
80
100
KG [b
ar.m
/s]
0.8 1.0 1.2 1.4Equivalence ratio, Φ Equivalence ratio, Φ
Fig. 6. Burning velocity calculated versus equivalence ratio initially atNPT using different models and the explosion index.
48 A.S. Huzayyin et al. / Fuel 87 (2008) 39–57
Bosschaart and Goey [43] performed a particular studyfor flame of hydrocarbons–air mixture stabilized on a hon-eycomb burner (flat flame method) using the heat fluxmethod. They found that there are a tendency in the heatflux method (and so the flat flame) to produce lower valuesfor burning velocities than the most of other methods;including burner, counter flow, and bomb method. Thesame result is observed in this study; higher values for allequivalence ratios studied with average difference of 11%.
Davis et al. [44] used the counter flow method in theirstudy of methane- and propane–air combustion to calcu-
0
100
200
300
400
500
Model of Metghalchi and Keck (1982)
Lam
inar
bur
ning
vel
ocity
, S
L [mm
/s]
Present study 2005 Metghalci [14]
Panel A
Equivalence ratio,
0.8 1.0 1.2 1.4 1.60
100
200
300
400
Equivalence Ratio, Φ
Bomb methoddifferent techniques
Panel C
Present study 2005 Jomaas [19] Tseng et. al. [37] Hassan [39] Law and Sung [51] Law and Kwon [41] Zhou and Garner [38]
Fig. 7. Laminar burning velocity versus equivalence ratio compared with diffesame bomb method (panel C), and other experimental methods (panel D) for
late the unstretched laminar burning velocity. AlthoughFig. 7 (panel D) shows good agreement between the presentstudy and that of Davis et al. [44], while the present datastill of higher value in rich side (with overall difference of�8%).
Generally, it can be said that there are good agreementfor values of burning velocity for propane–air with theoverall data cited in the literature, whatever the methodused and better agreement with those deduced from thebomb method. The assets of differences may be due to sys-tematic errors of the experimental data in addition to theuncertainties in the evaluation of burning velocity. How-ever, good agreement between the obtained values indi-cates the high accuracy of the present test facility and thecalculation program, and this confirms the accuracy ofdata obtained for LPG–air mixtures.
There are limited data in the literature about burningvelocity of LPG–air mixtures. However, the obtained val-ues of SL are considerably higher than that obtained byChakraborty et al. [45] using the flat flame method, asshown in Fig. 8. Generally, the flat flame method tendsto give lower data for SL as observed by Bosschaart andGoey [43].
Explosion index, KG versus U takes the same trends asthat of SL. The peak value of KG is an important factorin the risk analysis and is known as gas severity index.KGmax. For propane–air mixture it is found to be92 bar m/s, which is being higher than the correspondingvalues for LPG–air mixture that nearly 83 bar m/s asshown in Fig. 6.
Comparison of the present maximum value of deflagra-tion index, KGmax for propane–air mixture with thosereported in NFPA68 [26] and other should include their
Equivalence ratio,
0
100
200
300
400
500
Model of Mantonet. al. (1953)
Panel B
Present study 2005 Desoky [36] Kido [35] Tanoue [34]
0.8 1.0 1.2 1.40
100
200
300
400
500
Equivalence Ratio, Φ
Different experimental methods
Panel D
Present study 2005 (Bomb) Gibbs and Calcote [42] (Burner) Zhao [50] (Jet flame) Bosschaart and Goey [43] (Flat flame) Davis [44] (Counter-flow)
rent data cited in the literature using the same model (panel A and B), thepropane/air mixture at NPT.
A.S. Huzayyin et al. / Fuel 87 (2008) 39–57 49
measurement volume and the corresponding value of max-imum pressure, Pmax. Taken into account the confess, thatthere is no identical KG values in the literature, because KG
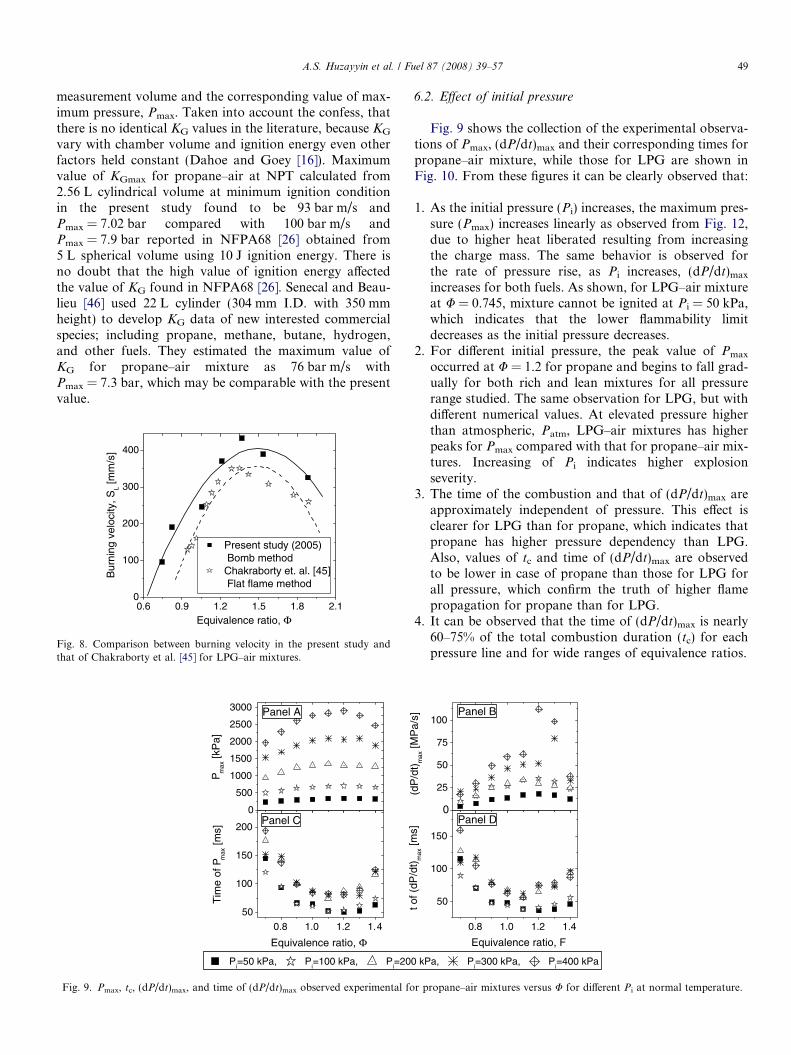
vary with chamber volume and ignition energy even otherfactors held constant (Dahoe and Goey [16]). Maximumvalue of KGmax for propane–air at NPT calculated from2.56 L cylindrical volume at minimum ignition conditionin the present study found to be 93 bar m/s andPmax = 7.02 bar compared with 100 bar m/s andPmax = 7.9 bar reported in NFPA68 [26] obtained from5 L spherical volume using 10 J ignition energy. There isno doubt that the high value of ignition energy affectedthe value of KG found in NFPA68 [26]. Senecal and Beau-lieu [46] used 22 L cylinder (304 mm I.D. with 350 mmheight) to develop KG data of new interested commercialspecies; including propane, methane, butane, hydrogen,and other fuels. They estimated the maximum value ofKG for propane–air mixture as 76 bar m/s withPmax = 7.3 bar, which may be comparable with the presentvalue.
0.6 0.9 1.2 1.5 1.8 2.10
100
200
300
400
Equivalence ratio, Φ
Bur
ning
vel
ocity
, SL [m
m/s
]
Present study (2005) Bomb method
Chakraborty et. al. [45] Flat flame method
Fig. 8. Comparison between burning velocity in the present study andthat of Chakraborty et al. [45] for LPG–air mixtures.
0
500
1000
1500
2000
2500
3000 Panel A
Pm
ax [k
Pa]
0.8 1.0 1.2 1.4
50
100
150
200
Pi=50 kPa, P
i=100 kPa, P
i=200
Panel C
Tim
e of
Pm
ax [m
s]
Equivalence ratio, Φ
Fig. 9. Pmax, tc, (dP/dt)max, and time of (dP/dt)max observed experimental fo
6.2. Effect of initial pressure
Fig. 9 shows the collection of the experimental observa-tions of Pmax, (dP/dt)max and their corresponding times forpropane–air mixture, while those for LPG are shown inFig. 10. From these figures it can be clearly observed that:
1. As the initial pressure (Pi) increases, the maximum pres-sure (Pmax) increases linearly as observed from Fig. 12,due to higher heat liberated resulting from increasingthe charge mass. The same behavior is observed forthe rate of pressure rise, as Pi increases, (dP/dt)max
increases for both fuels. As shown, for LPG–air mixtureat U = 0.745, mixture cannot be ignited at Pi = 50 kPa,which indicates that the lower flammability limitdecreases as the initial pressure decreases.
2. For different initial pressure, the peak value of Pmax
occurred at U = 1.2 for propane and begins to fall grad-ually for both rich and lean mixtures for all pressurerange studied. The same observation for LPG, but withdifferent numerical values. At elevated pressure higherthan atmospheric, Patm, LPG–air mixtures has higherpeaks for Pmax compared with that for propane–air mix-tures. Increasing of Pi indicates higher explosionseverity.
3. The time of the combustion and that of (dP/dt)max areapproximately independent of pressure. This effect isclearer for LPG than for propane, which indicates thatpropane has higher pressure dependency than LPG.Also, values of tc and time of (dP/dt)max are observedto be lower in case of propane than those for LPG forall pressure, which confirm the truth of higher flamepropagation for propane than for LPG.
4. It can be observed that the time of (dP/dt)max is nearly60–75% of the total combustion duration (tc) for eachpressure line and for wide ranges of equivalence ratios.
0
25
50
75
100Panel B
(dP
/dt)
max
[MP
a/s]
kPa, Pi=300 kPa, P
i=400 kPa
Equivalence ratio, F
0.8 1.0 1.2 1.4
50
100
150
Panel D
t of (
dP/d
t)m
ax [m
s]
r propane–air mixtures versus U for different Pi at normal temperature.
50 A.S. Huzayyin et al. / Fuel 87 (2008) 39–57
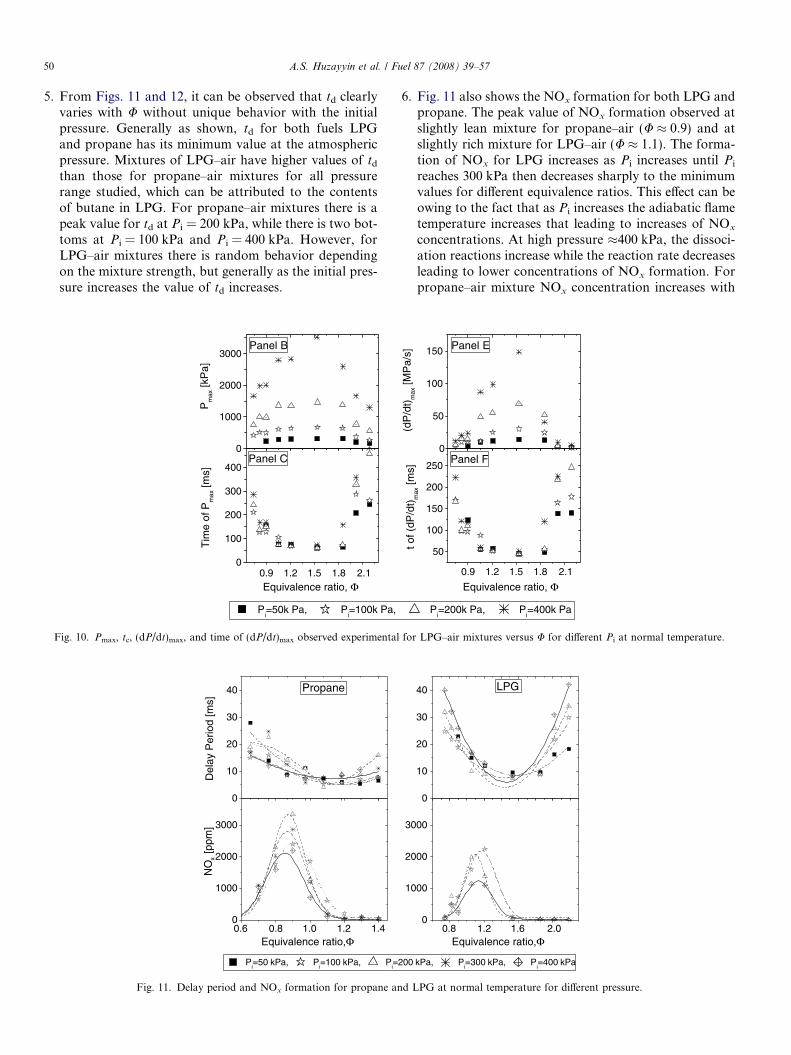
5. From Figs. 11 and 12, it can be observed that td clearlyvaries with U without unique behavior with the initialpressure. Generally as shown, td for both fuels LPGand propane has its minimum value at the atmosphericpressure. Mixtures of LPG–air have higher values of td
than those for propane–air mixtures for all pressurerange studied, which can be attributed to the contentsof butane in LPG. For propane–air mixtures there is apeak value for td at Pi = 200 kPa, while there is two bot-toms at Pi = 100 kPa and Pi = 400 kPa. However, forLPG–air mixtures there is random behavior dependingon the mixture strength, but generally as the initial pres-sure increases the value of td increases.
0
10
20
30
40
Pi=50 kPa, P
i=100 kPa, P
i=
Del
ay P
erio
d [m
s]
Propane
0.6 0.8 1.0 1.2 1.40
1000
2000
3000
NO
x [p
pm]
Equivalence ratio,Φ
Fig. 11. Delay period and NOx formation for propane an
0
1000
2000
3000Panel B
Pi=50k Pa, P
i=100k Pa,
Pm
ax [k
Pa]
0
100
200
300
400Panel C
Tim
e of
Pm
ax [m
s]
Equivalence ratio, Φ0.9 1.2 1.5 1.8 2.1
Fig. 10. Pmax, tc, (dP/dt)max, and time of (dP/dt)max observed experimental
6. Fig. 11 also shows the NOx formation for both LPG andpropane. The peak value of NOx formation observed atslightly lean mixture for propane–air (U � 0.9) and atslightly rich mixture for LPG–air (U � 1.1). The forma-tion of NOx for LPG increases as Pi increases until Pi
reaches 300 kPa then decreases sharply to the minimumvalues for different equivalence ratios. This effect can beowing to the fact that as Pi increases the adiabatic flametemperature increases that leading to increases of NOx
concentrations. At high pressure �400 kPa, the dissoci-ation reactions increase while the reaction rate decreasesleading to lower concentrations of NOx formation. Forpropane–air mixture NOx concentration increases with
200 kPa, Pi=300 kPa, P
i=400 kPa
0
10
20
30
40 LPG
0.8 1.2 1.6 2.00
1000
2000
3000
Equivalence ratio,Φ
d LPG at normal temperature for different pressure.
Pi=200k Pa, P
i=400k Pa
0
50
100
150 Panel E
(dP
/dt)
max
[MP
a/s]
Equivalence ratio, Φ0.9 1.2 1.5 1.8 2.1
50
100
150
200
250Panel F
t of (
dP/d
t)m
ax [m
s]
for LPG–air mixtures versus U for different Pi at normal temperature.

A.S. Huzayyin et al. / Fuel 87 (2008) 39–57 51
initial pressure increases until Pi reaches 200 kPa, afterwhich sharp decreases of NOx as pressure increases asobserved in Fig. 11.
Data of burning velocity obtained for both LPG andpropane at different initial pressure is collected in Fig. 13.From Fig. 13 it can be noticed for both fuels that, as theinitial pressure increases, the burning velocity decreases.However the rate of decreasing of SL with Pi for pro-pane–air mixtures is faster than that for LPG–air mixture,which indicates lower dependency of SL on Pi for LPG–airmixtures. The behavior of the explosion index, KG,depends on the effects of SL and Pmax. This is why explo-sion index for LPG–air is observed to be lower than thatfor propane–air at Pi 6 100 kPa, then increased to behigher at elevated pressure (Pi P 200 kPa). Because thepressure has a clear effect on SL for propane–air mixturethan for LPG–air mixture, the accumulated effect of Pmax
in addition to the lower pressure dependency give reasonwhy KG for both fuels have approximately the same peakvalue at higher pressure (Pi = 400 kPa).
Mainly the effects of temperature and pressure on theflame propagation can be explained in terms of the com-plex kinetic processes that occurred in the flame. As dis-cussed by Glassman [47] for mixtures of SL < 600 mm/s,the pressure exponent varies from 0 to �0.5 while for fasterburning mixtures it is zero or slightly positive. Theoreticaldescription of this behavior, can owe the competitionbetween the chain-branching reactions [that has first orderpressure sensitivity and very sensitive to temperature] andthe recombination reactions [considered not affected bytemperature and has a second order pressure sensitivity],Strehlow [29].
Since the burning velocity is lower than 600 mm/s, thecompetition between chain-branching and recombinationreaction, show negative pressure exponent [increase of
0
1000
2000
3000Panel A Propane
Pm
ax [k
Pa]
Φ=0.7, Φ =0.8, Φ =0.9,Φ=1.0, Φ =1.1, Φ =1.2,Φ=1.3, Φ =1.4
00
10
20
30
Normalized pressure (Pi /Po)
Panel B
t d [m
s]
1 2 3 4
Fig. 12. Maximum pressure and delay period versus normalized initial pressur
pressure inhibits the recombination reactions and so tem-perature variation with pressure for chain-branching reac-tion will be slight, so SL decreases as pressure increase].Which is exactly what is observed from the obtained datafor pressure effect for both LPG–air and propane–air com-bustion. As shown in Figs. 13 and 14, the burning velocitydecay as the pressure increases following a power function.Comparison of the burning velocity at various initial pres-sures with those available in the literature gives acceptedagreement as shown in Fig. 14. At Pi = 50 kPa the presentdata show higher values than those of Hassan et al. [39].The same behavior is observed at Pi = 400 kPa. Howeverat Pi = 200 kPa and Pi = 300 kPa comparison reveals wellagreement. At Pi = 200 kPa there are well agreementbetween present data and those of Jomaas et al. [19] andHassan et al. [39].
6.3. Effect of initial temperature
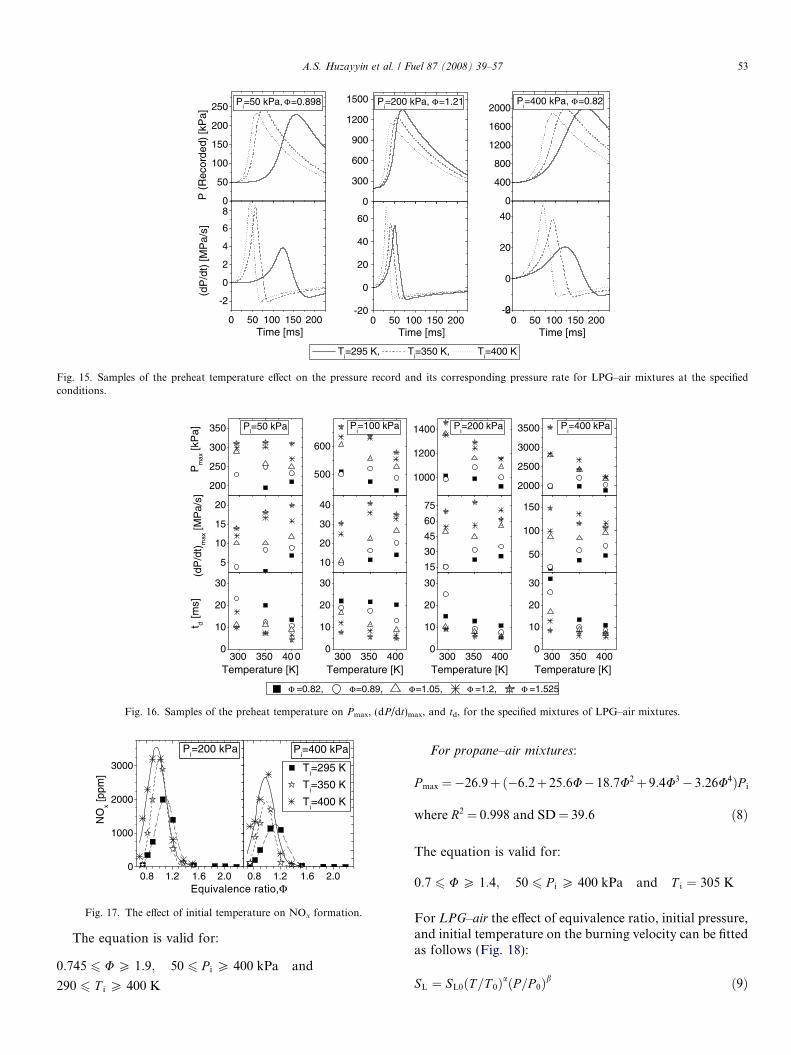
The initial preheat temperature (Ti) generally enhancesthe flame propagation rate [47]. Fig. 15 shows sampleresults of the effect of Ti on the P–t records and dP/dt
for LPG–air mixtures at selected values of Pi and U. Thecorresponding variations of Pmax, (dP/dt)max and td withTi at various values of Pi (50–400 kPa) and U (0.82–1.525) are given in Fig. 16.
For the same value of U and Pi it is evident that theincrease in the value of Ti causes a decline in the value ofPmax owing to the lower density of the charge that leadsto lower mass of the charge burned and hence lower quan-tity of the heat liberated. The increase in Ti enhances therate of flame propagation that leads to higher (dP/dt)max
and lower delay (td) and combustion periods (tc). It canbe noticed that the values of Pmax and (dP/dt)max are moreaffected by the initial pressure relative to the initial temper-
0
1000
2000
3000Panel D LPG
Φ =0.745, Φ =0.8211, Φ =0.899,Φ =1.054, Φ =1.211, Φ =1.534,
=1.854, Φ =2.017
00
10
20
30Panel E
Normalized pressure (Pi/P
o)
Φ
1 2 3 4
e. Dashed lines represent calculated pressure values using Eqs. (7) and (8).

0
100
200
300
400
500 Propane
SL
[mm
/s]
Pi= 50 kPa, P
i= 100 kPa, P
i= 200 kPa, P
i= 300 kPa, P
i= 400 kPa
LPG
0.8 1.0 1.2 1.40
100
200
300K
G [b
ar.m
/s]
Equivalence ratio,Φ 0.8 1.2 1.6 2.0
Equivalence ratio,Φ
Fig. 13. The laminar burning velocity and explosion index versus U at various initial pressures and normal temperature.
200
300
400
500
Equivalence ratio, Φ Equivalence ratio, Φ
Pi=50 kPa
150
200
250
300
350
Present study 2005 Hassan et. al. [36] Jom aas et. al. [19]
Lam
inar
bur
ning
vel
ocity
, SL [m
m/s
]
Pi=200 kPa
0.8 1.0 1.2 1.4 0.8 1.0 1.2 1.4
150
200
250
300 Pi=300 kPa
100
150
200
250
300P
i=400 kPa
Fig. 14. The laminar burning velocity for propane–air mixtures at various initial pressure and normal temperature compared with available data.
52 A.S. Huzayyin et al. / Fuel 87 (2008) 39–57
ature. The opposite is true for the variations of tc and td
(see Fig. 16).Fig. 17 shows the variations of NOx emissions with the
value of U at three values of Ti (295, 350, 400 K) and twovalues of Pi (200, 400 kPa). The increase in Ti causes dras-tic rise in the maximum level of NOx and a shift of the loca-tion of NOx,max to lower values of U.
The values of burning velocity, calculated based on themodel of Manton et al. [10], are shown in Fig. 18 in addi-tion to the corresponding explosion index. From Fig. 18 itcan be observed that, the burning velocity shows a remark-able increase as the initial temperature increase. However,the explosion index show lower dependency on the preheattemperature, due to two opposing effects of lower expan-sion ratio and the faster burning rate.
The increase of the preheat temperature causes markedincrease of the chemical reaction rate and so the flame
propagation. In addition to the enhancement effect of thecompetition of recombination/chain-branching reactionsin the preheat zone that leads to strong effect on SL. Thisis exactly what is found for the combustion of LPG–airmixture as shown in Fig. 18.
7. The derived correlations
The effect of U, Pi, and Ti on Pmax can be fitted to thefollowing equation; see Fig. 12:
For LPG–air mixtures:
P max ¼ �8:3þ ð�3424:7þ 10586:5U� 6986:5U2
þ 2203U3 � 372U4ÞðP i=T iÞ ð7Þ
where chi-square R2 = 0.973 and standard deviationSD = 131.5
0
50
100
150
200
250 Pi=50 kPa, Φ=0.898
P (
Rec
orde
d) [k
Pa]
Ti=295 K, T
i=350 K, T
i=400 K
0 50 100 150 200
-2
0
2
4
6
8
Time [ms]0 50 100 150 200
Time [ms]0 50 100 150 200
Time [ms]
(dP
/dt)
[MP
a/s]
0
300
600
900
1200
1500 Pi=200 kPa, Φ=1.21
0
400
800
1200
1600
2000 P
i=400 kPa, Φ=0.82
-20
0
20
40
60
-20
0
20
40
Fig. 15. Samples of the preheat temperature effect on the pressure record and its corresponding pressure rate for LPG–air mixtures at the specifiedconditions.
200
250
300
350 Pi=50 kPa
Pm
ax [k
Pa]
500
600
Pi=100 kPa
Φ =0.82, Φ=0.89, Φ=1.05, Φ =1.2, Φ =1.525
1000
1200
1400 Pi=200 kPa
2000
2500
3000
3500 Pi=400 kPa
5
10
15
20
(dP
/dt)
max
[MP
a/s]
10
20
30
40
15
30
45
60
75
50
100
150
300 350 40 00
10
20
30
Temperature [K]
t d [m
s]
300 350 4000
10
20
30
Temperature [K]300 350 400
0
10
20
30
Temperature [K]300 350 400
0
10
20
30
Temperature [K]
Fig. 16. Samples of the preheat temperature on Pmax, (dP/dt)max, and td, for the specified mixtures of LPG–air mixtures.
0.8 1.2 1.6 2.00
1000
2000
3000
Pi=200 kPa
NO
x [ppm
]
Equivalence ratio,Φ 0.8 1.2 1.6 2.0
Pi=400 kPa
Ti=295 K
Ti=350 K
Ti=400 K
Fig. 17. The effect of initial temperature on NOx formation.
A.S. Huzayyin et al. / Fuel 87 (2008) 39–57 53
The equation is valid for:
0:745 6 U P 1:9; 50 6 P i P 400 kPa and
290 6 T i P 400 K
For propane–air mixtures:
P max ¼�26:9þð�6:2þ 25:6U� 18:7U2þ 9:4U3� 3:26U4ÞP i
where R2 ¼ 0:998 and SD¼ 39:6 ð8Þ
The equation is valid for:
0:7 6 U P 1:4; 50 6 P i P 400 kPa and T i ¼ 305 K
For LPG–air the effect of equivalence ratio, initial pressure,and initial temperature on the burning velocity can be fittedas follows (Fig. 18):
SL ¼ SL0ðT =T 0ÞaðP=P 0Þb ð9Þ

300 350 4000
200
400
600
800Φ=1.36
Temperature [K]300 350 400
Φ=1.21
300 350 400
SL [m
m/s
]
Φ=0.9
Pi=50 kPa
Pi=100 kPa
Pi=200 kPa
Pi=400 kPa
Fig. 18. Variation of SL with T at different P for LPG–air mixture, points show calculated data and the dashed line at U = 1.36 show sample of dataextracted from Eq. (9).
54 A.S. Huzayyin et al. / Fuel 87 (2008) 39–57
where
SL0 ¼ �492:8þ 1209:1U� 935:5U2 þ 708:1U3 � 229U4
a ¼ 2þ 2:75U� 2:13U2; and
b ¼ �0:137þ 0:029U� 0:026U2
The equation is valid for:
0:745 6 U P 1:9; 50 6 P i P 400 kPa and
290 6 T i P 400 K
With SD ¼ 30:57 and R2 ¼ 0:972
For propane–air mixture, the obtained data of the burningvelocity is fitted to (see Fig. 19):
SL ¼ SL0ðP=P 0Þb ð10Þwhere
SL0 ¼ 5766:8� 24761:3Uþ 38798:1U2 � 25188:3U3
þ 5795:9U4
b ¼ �0:463þ 0:56U� 0:354U2
The equation is valid for:
0:7 6 U P 1:4; 50 6 P i P 400 kPa and T i ¼ 305 K
SD ¼ 19:1 and R2 ¼ 0:971
1100
200
300
400
500
Φ =0.7 =0.8Φ =0.9 Φ =1.0Φ =1.1 Φ =1.2Φ =1.3 Φ =1.4
SL [m
m/s
]
Normalized pressure, (P/Po)
2 3 4
Φ
Fig. 19. Variation of SL with normalized pressure for propane–airmixtures at different equivalence ratio, points represent the calculateddata and the dashed line show data extracted from Eq. (10).
The maximum explosion index (commonly called severityindex) varies linearly with pressure. For LPG–air mixturethe variation of the severity index can be fit to temperatureand pressure [for Ti varies from 295 to 400 and Pi variesfrom 50 to 400 kPa], as follows:
KGmax ¼ 8:4þ 0:724P þ 0:0394T ð11ÞWith SD ¼ 8:35 and R2 ¼ 0:99
While, for propane, the obtained data for KGmax, [that testonly for various initial pressure] according to the followingequation:
KGmax ¼ 18þ 0:64P ð12ÞWith SD ¼ 19:6 and R2 ¼ 0:97
8. Conclusions
The main conclusion from the present study is that, themodification done for the model of Rallis et al. [11] gives anaccurate data for the determination of the laminar burningvelocity.
However, there are some specific conclusions from thepresent experimental study according to the experimentalobservations and the calculations of the burning velocityand explosion index.
(1) For the same Pi, as Ti increases Pmax decreases while(dP/dt)max increases but the corresponding durationsfor Pmax and (dP/dt)max decrease.
(2) At Pi 6 Patm, Pmax for propane is higher than that forLPG, while at elevated pressure LPG is higher. Thepeak value of (dP/dt)max for propane is 20% higherthan that for LPG.
(3) The period of inflection point of pressure record arefound to be nearly 60–75% of the maximum combus-tion duration.
(4) Maximum SL for propane is nearly 455 mm/s, whichis considerably higher than that for LPG of approxi-mate 432 mm/s.
(5) As Pi increases, SL decreases for both fuels, and SL
increases as Ti increases for LPG–air mixture.
A.S. Huzayyin et al. / Fuel 87 (2008) 39–57 55
(6) KG increases as Pi increases, but slightly increases asTi increases.
Appendix A. Error analysis
For an experimental result ‘‘R’’ being computed from aset of N measurements;
R ¼ RðX 1;X 2;X 2; . . . ;X N Þ
The absolute uncertainty in R following the ISO model thatutilizes the root-sum-square (RSS) of the individual vari-ables Xi is given by:
UR ¼
ffiffiffiffiffiffiffiffiffiffiffiffiffiffiffiffiffiffiffiffiffiffiffiffiffiffiffiffiffiffiffiffiffiffiffiffiffiXi¼N
i¼1
oRoX i
U X i
� �2s
The relative uncertainty is given by:
URR¼ oR
oX 1
UX 1
R
� �2
þ oRoX 2
UX 2
R
� �2
þ � � � þ oRoX n
UXN
R
� �2" #1
2
In the uncertainty analysis all partial derivatives were per-formed using Maple 9.01 (Maple is a complete mathemat-ical problem-solving environment that supports a widevariety of mathematical operations such as numerical anal-ysis, symbolic algebra, and graphics).
A.1. Mixture preparation
Mixture was prepared using partial pressure of its con-stituents as follows:
AF actual ¼P air
P fuel
¼ P mixture � P fuel
P fuel
From which the relative uncertainty in the actual air fuelratio is:
UðAF actualÞAF actual
¼
ffiffiffiffiffiffiffiffiffiffiffiffiffiffiffiffiffiffiffiffiffiffiffiffiffiffiffiffiffiffiffiffiffiffiffiffiffiffiffiffiffiffiffiffiffiffiffiffiffiffiffiffiffiffiffiffiffiffiffiffiffiffiffiffiffiffiffiffiffiffiffiffiffiffiffiffiffiffiffiffiffiffiffiffiffiffiffiffiffiffiffiffiffiffiffiffiffiffiffiffiffiffiffiffiUP mixture
P mixture � P fuelð Þ
� �2
þ � P mixture � UP fuel
P fuel � P mixture � P fuelð Þ
� �2s
It has its maximum value of nearly ±0.78% at lean condi-tions (U = 0.7) and its minimum value of ±0.38% at richconditions (U = 1.5).
A.2. Initial pressure
In fact, the initial pressure is the sum of the obtainedvacuum pressure (measured by Setra280E) and the addi-tional pressure (measured by Setra206 of range 0–3.4 bar)due to charging of the prepared mixture. In this case therelative uncertainty in the initial pressure is calculated asfollows:
UP i
P i
¼
ffiffiffiffiffiffiffiffiffiffiffiffiffiffiffiffiffiffiffiffiffiffiffiffiffiffiffiffiffiffiffiffiffiffiffiffiffiffiffiffiffiffiffiffiffiffiffiffiffiffiffiffiffiffiffiffiffiffiffiffiffiffiffiffiffiffiffiffiffiffiffiffiffiffiffiffiffiffiffiffiffiffiffiffiffiffiffiffiffiffiffiffiffiU P vacuum
P added þ P vacuumð Þ
� �2
þ U P added
P added þ P vacuumð Þ
� �2s
Its maximum value of about ±0.96% occurs at lower initialpressure (50 kPa) and its minimum value of ±0.12% athigher pressure (400 kPa).
A.3. Pressure history
The pressure measured with the piezoelectric pressuresensor and its corresponding numerical differentiation canbe considered the major source of error in the uncertaintyanalysis of the burning velocity calculation. Using the RSSmethod the uncertainty in pressure reading from sensor(Kistler 6123) is about ±1.118% of the reading. Thus, therelative uncertainty of reading pressure is:
UPP¼ �0:01118
A.4. Pressure differentiation
The numerical derivative of the pressure history is per-formed according to equation:
dP iðtÞ ¼1
2
P iþ1 � P i
tiþ1 � ti
þ P i � P i�1
ti � ti�1
� �
The error produced from Data Acquisition (CIO-DAS1602/12) is ignored. Hence, the relative uncertainty associ-ated with pressure derivative using RSS becomes:
UdP i
dP iðtÞ¼ �2:24%
A.5. Initial temperature
The possible error in the initial temperature comes fromtwo sources namely: (i) the error of the used digital ther-mometer (±1�K) and (ii) the error due to unavoidable mix-ture heating by the slightly hot combustion wall bombwhich does not exceed ±3�K. Thus, the uncertainty in ini-tial temperature becomes:
UTT i
¼ � 3
T i
Note that, generally, if the error from one source exceedsby three times the other, the later is ignored.
A.6. Mass fraction burned
The relative uncertainty in mass fraction burned is:
Uxx¼
ffiffiffiffiffiffiffiffiffiffiffiffiffiffiffiffiffiffiffiffiffiffiffiffiffiffiffiffiffiffiffiffiffiffiffiffiffiffiffiffiffiffiffiffiffiffiffiffiffiffiffiffiffiffiffiffiffiffiffiffiffiffiffiffiffiffiffiffiffiffiffiffiffiffiffiffiffiffiffiffiffiffiffiffiUP
P � P i
� �2
þ P � P i
P e � P i
� 1
� �� UP i
P � P i
� �2s
Naturally, it possesses a higher value at the very beginningof the pre-pressure period and decreases to about ±7% as
56 A.S. Huzayyin et al. / Fuel 87 (2008) 39–57
the pressure rises to P � 1.2Pi. The average relative uncer-tainty in x overall the entire pre-pressure period is less than±12%.
A.7. Flame radius
Using the model of Manton et al. [10] to calculate flameradius, the relative uncertainty in the calculated flameradius can be estimated as follows:
fac1 ¼ 1
3 � rb
r
� �3 � ðP e � P iÞPP i
� �1=cu
Urb
rb
¼
ffiffiffiffiffiffiffiffiffiffiffiffiffiffiffiffiffiffiffiffiffiffiffiffiffiffiffiffiffiffiffiffiffiffiffiffiffiffiffiffiffiffiffiffiffiffiffiffiffiffiffiffiffiffiffiffiffiffiffiffiffiffiffiffiffiffiffiffiffiffiffiUrr
� �2 þ fac1 � P e�PcuP þ 1
� � UP
� 2
þ fac1 � P e�PcuP iþ 1
x
� � UP i
� 2
vuuuutwhere fac1 is a dummy factor.
It is noted that the relative uncertainty in flame radiuscalculations is less than one-third that of the mass fractionburned. Its average value over the pre-pressure period isabout ±6% and about ±2% at P � 1.2Pi. The value ofthe relative uncertainty of flame radius varies accordingto the initial pressure from around ±5% (at 400 kPa) to±9% (at 50 kPa).
A.8. Burning velocity
The relative uncertainty in the calculation of burningvelocity using Dahoe et al. [17] thin flame model can be cal-culated as follows:
fac2 ¼ 1
ðP e � P iÞ � ðP e � PÞ � PP i
� 1=cu
PP i
� �1=cu
USL
SL
¼
ffiffiffiffiffiffiffiffiffiffiffiffiffiffiffiffiffiffiffiffiffiffiffiffiffiffiffiffiffiffiffiffiffiffiffiffiffiffiffiffiffiffiffiffiffiffiffiffiffiffiffiffiffiffiffiffiffiffiffiffiffiffiffiffiffiffiffiffiffiffiffiffiffiffiffiffiffiffiffiffiffiffiffiffiffiffiffiffiffiffiffiffiffiffiffiffiffiffiffiffiffiffiffiffiffiffiffiffiffiffiffiUrr
� �2 þ UdPdP=dt
� 2
þ �1cu�P� 2
3� fac2 � P e�P
cuP þ 1�
� UP� 2
þ 1cu�P iþ 1þ fac2ð Þ � P e�P
P e�P i� P e�P i
cuP iþ 1
� � UP i
� 2
vuuuut
where fac2 is a dummy factor.
0.8 1.0 1.2 1.4 1.6 1.8 2.0 2.20
200
400
600
800 Initial Temp.=293 KInitial Temp.=400 K
Equivalence Ratio, Φ
Burn
ing
velo
city,
SL [
mm
/s]
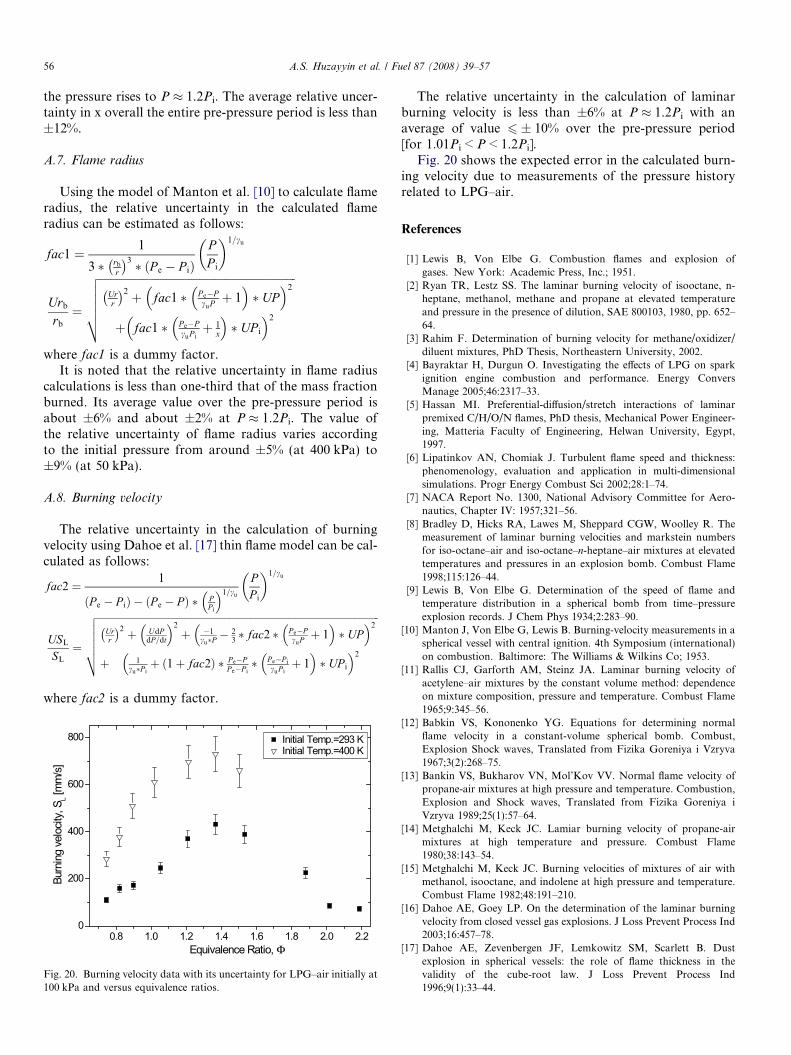
Fig. 20. Burning velocity data with its uncertainty for LPG–air initially at100 kPa and versus equivalence ratios.
The relative uncertainty in the calculation of laminarburning velocity is less than ±6% at P � 1.2Pi with anaverage of value 6 ± 10% over the pre-pressure period[for 1.01Pi < P < 1.2Pi].
Fig. 20 shows the expected error in the calculated burn-ing velocity due to measurements of the pressure historyrelated to LPG–air.
References
[1] Lewis B, Von Elbe G. Combustion flames and explosion ofgases. New York: Academic Press, Inc.; 1951.
[2] Ryan TR, Lestz SS. The laminar burning velocity of isooctane, n-heptane, methanol, methane and propane at elevated temperatureand pressure in the presence of dilution, SAE 800103, 1980, pp. 652–64.
[3] Rahim F. Determination of burning velocity for methane/oxidizer/diluent mixtures, PhD Thesis, Northeastern University, 2002.
[4] Bayraktar H, Durgun O. Investigating the effects of LPG on sparkignition engine combustion and performance. Energy ConversManage 2005;46:2317–33.
[5] Hassan MI. Preferential-diffusion/stretch interactions of laminarpremixed C/H/O/N flames, PhD thesis, Mechanical Power Engineer-ing, Matteria Faculty of Engineering, Helwan University, Egypt,1997.
[6] Lipatinkov AN, Chomiak J. Turbulent flame speed and thickness:phenomenology, evaluation and application in multi-dimensionalsimulations. Progr Energy Combust Sci 2002;28:1–74.
[7] NACA Report No. 1300, National Advisory Committee for Aero-nautics, Chapter IV: 1957;321–56.
[8] Bradley D, Hicks RA, Lawes M, Sheppard CGW, Woolley R. Themeasurement of laminar burning velocities and markstein numbersfor iso-octane–air and iso-octane–n-heptane–air mixtures at elevatedtemperatures and pressures in an explosion bomb. Combust Flame1998;115:126–44.
[9] Lewis B, Von Elbe G. Determination of the speed of flame andtemperature distribution in a spherical bomb from time–pressureexplosion records. J Chem Phys 1934;2:283–90.
[10] Manton J, Von Elbe G, Lewis B. Burning-velocity measurements in aspherical vessel with central ignition. 4th Symposium (international)on combustion. Baltimore: The Williams & Wilkins Co; 1953.
[11] Rallis CJ, Garforth AM, Steinz JA. Laminar burning velocity ofacetylene–air mixtures by the constant volume method: dependenceon mixture composition, pressure and temperature. Combust Flame1965;9:345–56.
[12] Babkin VS, Kononenko YG. Equations for determining normalflame velocity in a constant-volume spherical bomb. Combust,Explosion Shock waves, Translated from Fizika Goreniya i Vzryva1967;3(2):268–75.
[13] Bankin VS, Bukharov VN, Mol’Kov VV. Normal flame velocity ofpropane-air mixtures at high pressure and temperature. Combustion,Explosion and Shock waves, Translated from Fizika Goreniya iVzryva 1989;25(1):57–64.
[14] Metghalchi M, Keck JC. Lamiar burning velocity of propane-airmixtures at high temperature and pressure. Combust Flame1980;38:143–54.
[15] Metghalchi M, Keck JC. Burning velocities of mixtures of air withmethanol, isooctane, and indolene at high pressure and temperature.Combust Flame 1982;48:191–210.
[16] Dahoe AE, Goey LP. On the determination of the laminar burningvelocity from closed vessel gas explosions. J Loss Prevent Process Ind2003;16:457–78.
[17] Dahoe AE, Zevenbergen JF, Lemkowitz SM, Scarlett B. Dustexplosion in spherical vessels: the role of flame thickness in thevalidity of the cube-root law. J Loss Prevent Process Ind1996;9(1):33–44.

A.S. Huzayyin et al. / Fuel 87 (2008) 39–57 57
[18] Stone R, Clarke A, Beckwith P. Correlations for the laminar-burningvelocity of methane/diluent/air mixtures obtained in free-fall exper-iments. Combust Flame 1998;114:546–55.
[19] Jomaas G, Zheng XL, Zhu DL, Law CK. Experimental determina-tion of counterflow ignition temperatures and laminar flame speeds ofC2–C3 hydrocarbons at atmospheric and elevated pressures. ProcCombust Inst 2005;30:193–200.
[20] Rallis CJ, Garforth AM. The determination of laminar burningvelocity. Progr Energy Combust Sci 1980;6:303–29.
[21] Fiock EF, Marvin CF, Caldwell FR, Roeder CH. Flame speed andenergy considerations for explosions in a spherical bomb, 1940,NACA Report No. 682.
[22] Bradley D, Mitcheson A. A mathematical solution for explosions inspherical vessels. Combust Flame 1976;26:201–17.
[23] Shebeko YN, Tsarichenko SG, Korolchenko AY, Trunev AV,Navzenya VY, Papkov SN, et al. Burning velocities and flammabilitylimits of gaseous mixtures at elevated temperatures and pressures.Combust Flame 1995;102:427–37.
[24] Elia M, Ulinski M, Metghalchi M. Laminar burning velocity ofmethane–air-diluent mixtures. J Eng Gas Turbines Power, TransASME 2001;123:190–6.
[25] Rahim F, Elia M, Ulinski M, Metghalchi M. Burning velocitymeasurements of methane-oxygen-argon mixtures and its applicationto extend methane–air burning velocity measurements. Int J EngineRes 2002;3(2):81–92.
[26] NFPA 68, A guide for venting of deflagration, 1998.[27] ASTM E1226-00, Standard test method for pressure and rate of
pressure rise for combustible dusts; 2000.[28] Kelin SA, Alvarado FL. Engineering equation solver: commercial
version 6.883-3D, F Chart Software; 2003 <http://www.Fchart.com>.
[29] Strehlow RA. Combustion fundamentals. New York: McGraw-Hill;1984, ISBN 0-07-062221-3.
[30] Attia AMA. Burning velocity of combustible mixtures in a cylindricalcombustion bomb, M.Sc. Thesis of Engineering and Technology,Mechanical Engineering, High Institute of Technology, BenhaUniversity, Benha , Egypt, January, 2006.
[31] Oh K-H, Kim H, Kim J-B, Lee S-E. A study of obstacle-inducedvariation of the gas explosion characteristics. J Loss Prevent ProcessInd 2001;14:597–602.
[32] Saeed K, Stone CR. Measurements of the laminar burning velocityfor mixtures of methanol and air from a constant-volume vessel usinga multizone model. Combust Flame 2004;139:152–66.
[33] Clarke A, Stone R, Beckwith P. Measurement of the laminar burningvelocity of n-butane and isobutane mixtures under micro-gravityconditions in a constant volume vessel. J Inst Energy 2001;74(September):70–6.
[34] Tanoue K. Turbulent burning velocities of outwardly propagatingflames, SAE 2002-01-2842, 2002.
[35] Kido H, Nakashima K, Nakahara M, Hashimoto J. Experimentalstudy on the configuration and propagation characteristics ofpremixed turbulent flame. JSAE Rev 2001;22:131–8.
[36] Desoky AA, Abdel-gafar YA, El-Badrawy RM. Hydrogen, propane,and gasoline laminar flame development in a spherical vessel. Int JHydrogen Energy 1990;15(12):895–905.
[37] Tseng LK, Ismail MA, Faeth GM. Laminar burning velocities andmarkstein numbers of hydrocarbon/air flames. Combust Flame1993;95:410–26.
[38] Zhou M, Garner CP. Brief communication: direct measurements ofburning velocity of propane-air using particle image velocimetry.Combust Flame 1996;106:363–7.
[39] Hassan MI, Aung KT, Kwon OC, Faeth GM. Properties of laminarpremixed hydrocarbon/air flames at various pressures. J PropulsionPower 1998;14(4):479–89.
[40] Liao SY, Jiang DM, Gao J, Huang ZH, Cheng Q. Measurements ofMarkstein numbers and laminar burning velocities for liquefiedpetroleum gas–air mixtures. Fuel 2004;83:1281–8.
[41] Law CK, Kwon OC. Effect of hydrocarbon substitution on atmo-spheric hydrogen-air flame propagation. Int J Hydrogen Energy2004;29:867–79.
[42] Gibbs GJ, Calcote HF. Effect of molecular structure on burningvelocity. J Chem Eng 1959;4(3).
[43] Bosschaart KJ, Goey LPH. The laminar burning velocity of flamespropagating in mixtures of hydrocarbons and air measured with theheat flux method. Combust Flame 2004;136:261–9.
[44] Davis SG, Quinard J, Searby G. Markstein numbers in counterflow,methane- and propane-air flames: a computational study. CombustFlame 2002;130:123–36.
[45] Chakraborty SK, Mukhopadhyay BN, Chanda BC. Effect of inhib-itors on flammability range of flames produced from LPG/airMixture. Fuel 1975;54:10–6.
[46] Senecal JA, Beaulieu PA. KG: new data and analysis. Process SafetyProgr 1998;17(1):9–15.
[47] Glassman I. Combustion. 3rd ed. San Diego: Academic Press; 1996.[48] Dugger GL, Heimel S. Flame speeds of methane-air, propane-air, and
ethylene-air mixtures at low initial temperatures. NACA TN 2624,1952.
[49] Joedick A, Peters N, Mansour M. The stabilization mechanism andstructure of turbulent hydrocarbon lifted flames. Proc Combust Inst2005;30:901–9.
[50] Zhao Z, Kazakov A, Li J, Dryer FL. The initial temperature and N2
dilution effect on the laminar flame speed of propane/air. CombustSci Technol 2004;176:1705–23.
[51] Law CK, Sung CJ. Structure, aerodynamics, and geometry ofpremixed flamelets. Progr Energy Combust Sci 2000;26:459–505.
[52] Leung KM, Indstedt RP. Detailed kinetic modeling of C1–C3 alkanediffusion flames. Combust Flame 1995;102:129–60.
[53] El Bakali A, Dagaut P, Pillier L, Desgroux, Pauwels JF, Rida A,et al. Experimental and modeling study of the oxidation of naturalgas in a premixed flame, shock tube, and jet-stirred reactor. CombustFlame 2004;137:109–28.