lampiran 1. kuesioner penelitian · 2017-11-23 · mean std. deviation n kk1 4,0263 ,75290 38 kk2...
TRANSCRIPT

53
LAMPIRAN 1.
KUESIONER PENELITIAN

54
LAMPIRAN 2.
TABULASI KUESIONER
55
LAMPIRAN 3.
UJI VALIDITAS DAN
RELIABILITAS
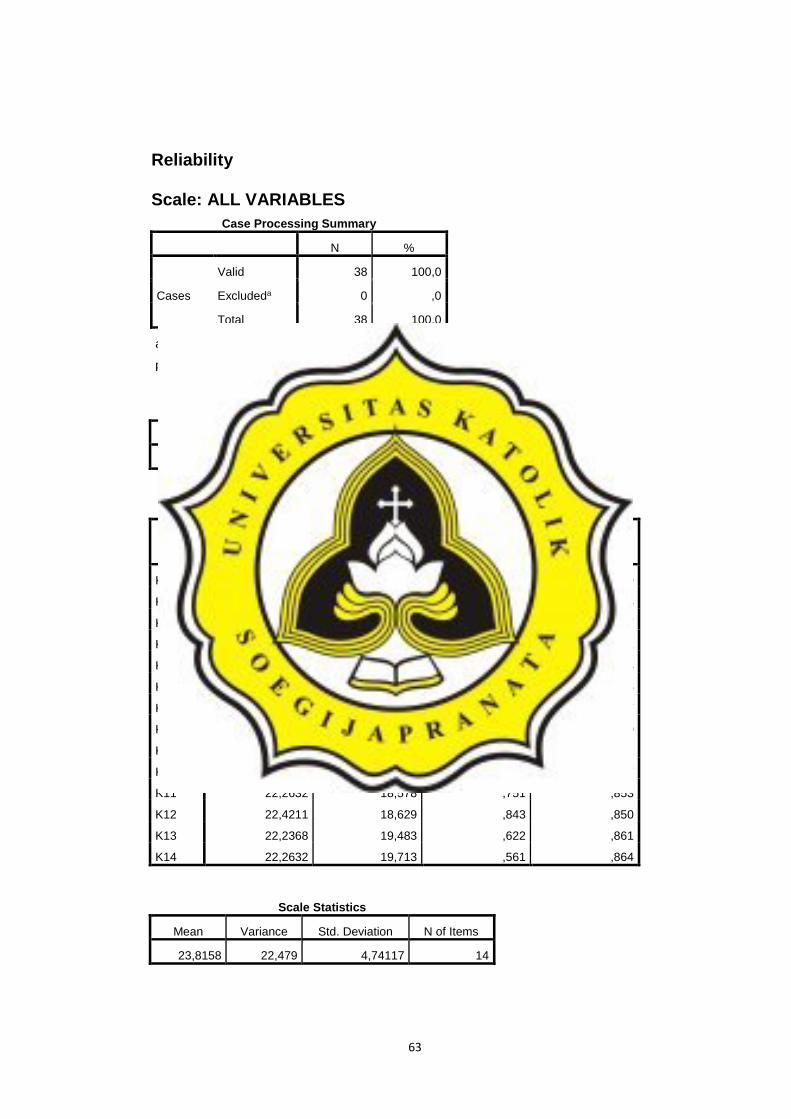
Scale: ALL VARIABLES
Case Processing Summary
N %
Cases
Valid 38 100,0
Excludeda 0 ,0
Total 38 100,0
a. Listwise deletion based on all variables in the
procedure.
Reliability Statistics
Cronbach's Alpha N of Items
,840 6
Item Statistics
Mean Std. Deviation N
KK1 4,0263 ,75290 38
KK2 4,1579 ,78933 38
KK3 4,1579 ,75431 38
KK4 4,1053 ,76369 38
KK5 3,8421 ,82286 38
KK6 3,8684 ,81111 38
56
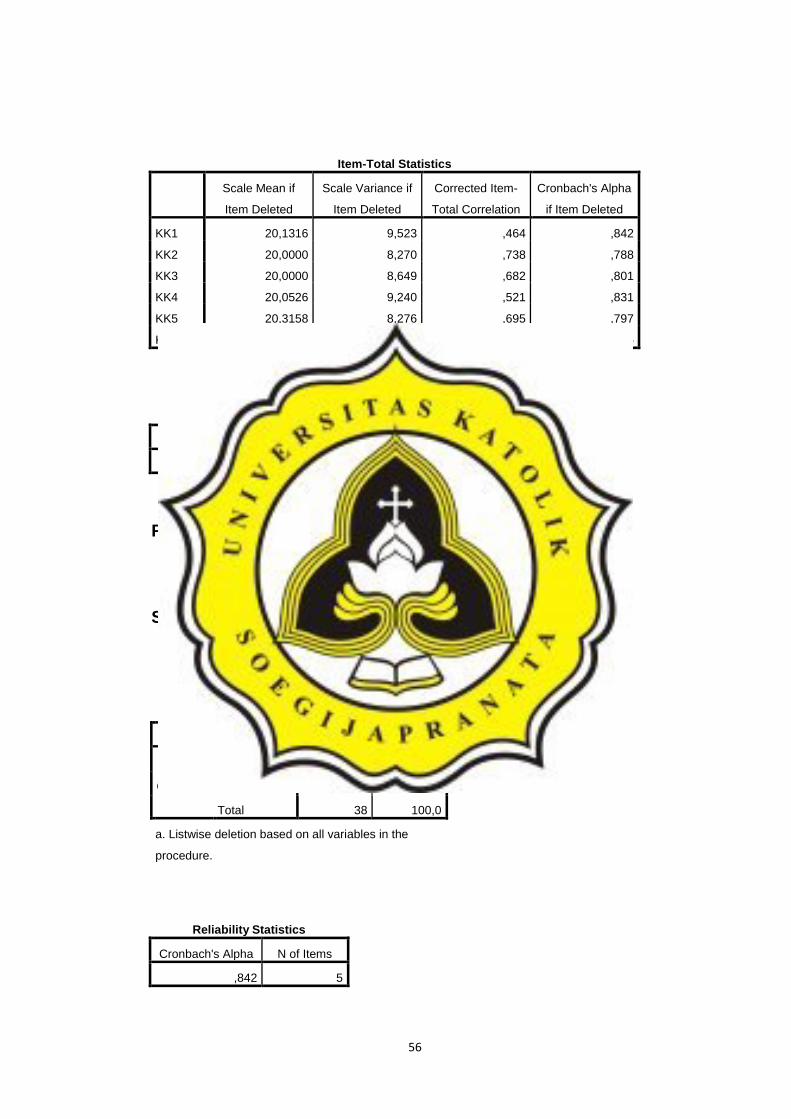
Item-Total Statistics
Scale Mean if
Item Deleted
Scale Variance if
Item Deleted
Corrected Item-
Total Correlation
Cronbach's Alpha
if Item Deleted
KK1 20,1316 9,523 ,464 ,842
KK2 20,0000 8,270 ,738 ,788
KK3 20,0000 8,649 ,682 ,801
KK4 20,0526 9,240 ,521 ,831
KK5 20,3158 8,276 ,695 ,797
KK6 20,2895 8,698 ,604 ,816
Scale Statistics
Mean Variance Std. Deviation N of Items
24,1579 12,245 3,49924 6
Reliability
Scale: ALL VARIABLES
Case Processing Summary
N %
Cases
Valid 38 100,0
Excludeda 0 ,0
Total 38 100,0
a. Listwise deletion based on all variables in the
procedure.
Reliability Statistics
Cronbach's Alpha N of Items
,842 5
57
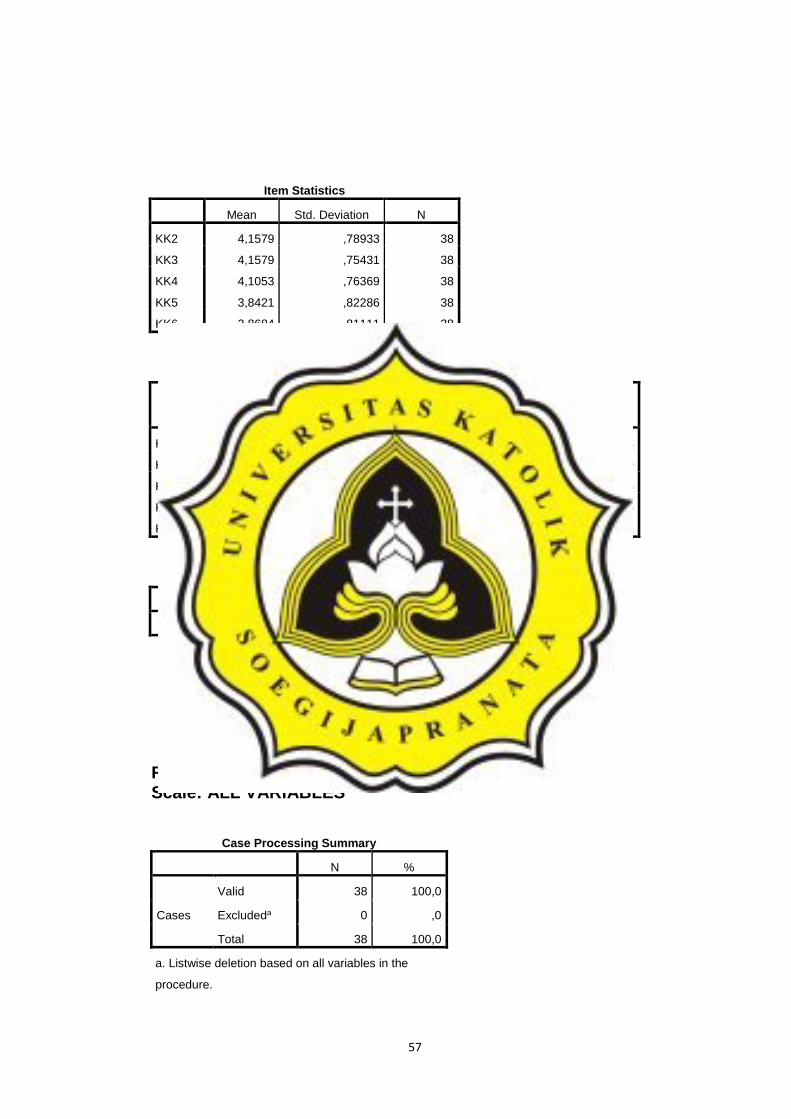
Item Statistics
Mean Std. Deviation N
KK2 4,1579 ,78933 38
KK3 4,1579 ,75431 38
KK4 4,1053 ,76369 38
KK5 3,8421 ,82286 38
KK6 3,8684 ,81111 38
Item-Total Statistics
Scale Mean if
Item Deleted
Scale Variance if
Item Deleted
Corrected Item-
Total Correlation
Cronbach's Alpha
if Item Deleted
KK2 15,9737 5,918 ,776 ,773
KK3 15,9737 6,459 ,651 ,809
KK4 16,0263 6,621 ,590 ,824
KK5 16,2895 6,157 ,658 ,806
KK6 16,2632 6,523 ,565 ,832
Scale Statistics
Mean Variance Std. Deviation N of Items
20,1316 9,523 3,08590 5
Reliability Scale: ALL VARIABLES
Case Processing Summary
N %
Cases
Valid 38 100,0
Excludeda 0 ,0
Total 38 100,0
a. Listwise deletion based on all variables in the
procedure.
58
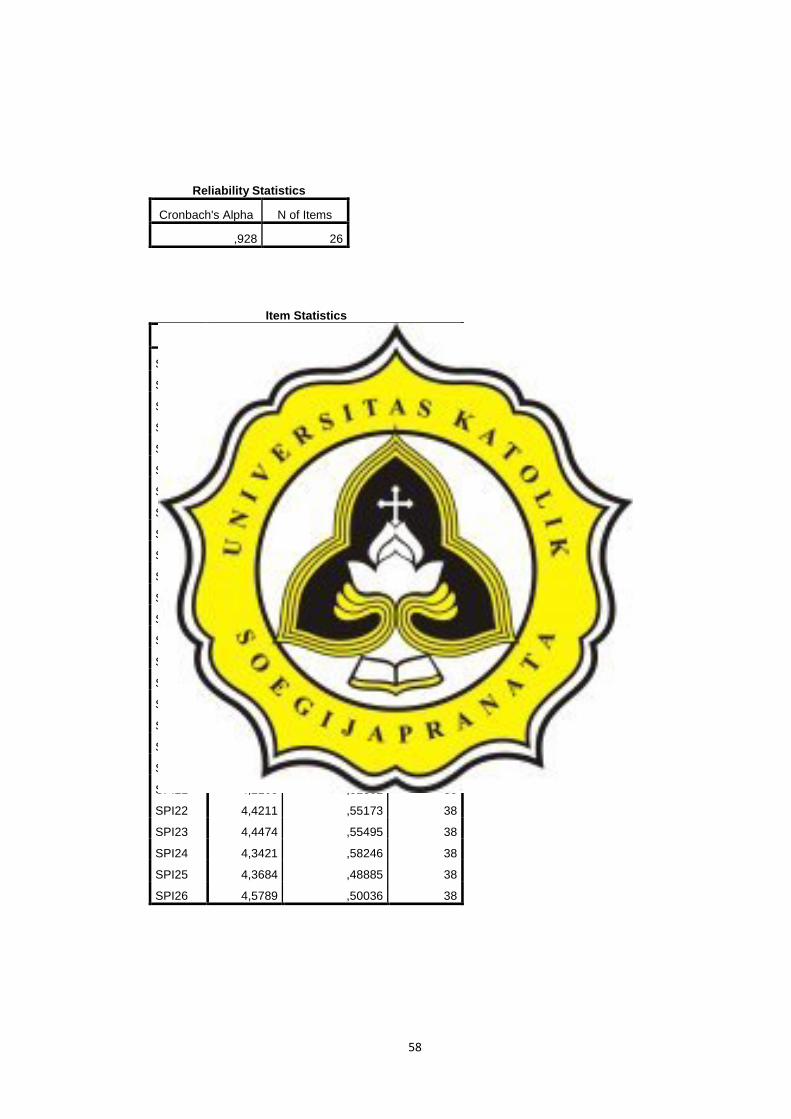
Reliability Statistics
Cronbach's Alpha N of Items
,928 26
Item Statistics
Mean Std. Deviation N
SPI1 4,5526 ,50390 38
SPI2 4,5526 ,50390 38
SPI3 4,5000 ,50671 38
SPI4 4,5000 ,50671 38
SPI5 4,4474 ,55495 38
SPI6 4,3684 ,58914 38
SPI7 4,4211 ,50036 38
SPI8 4,1316 ,57756 38
SPI9 4,3684 ,58914 38
SPI10 4,3421 ,58246 38
SPI11 4,3421 ,48078 38
SPI12 4,4737 ,55687 38
SPI13 4,4211 ,55173 38
SPI14 4,3158 ,57447 38
SPI15 4,3421 ,58246 38
SPI16 4,4211 ,55173 38
SPI17 4,3421 ,58246 38
SPI18 4,3421 ,53405 38
SPI19 4,2632 ,55431 38
SPI20 4,3158 ,47107 38
SPI21 4,2105 ,52802 38
SPI22 4,4211 ,55173 38
SPI23 4,4474 ,55495 38
SPI24 4,3421 ,58246 38
SPI25 4,3684 ,48885 38
SPI26 4,5789 ,50036 38
59
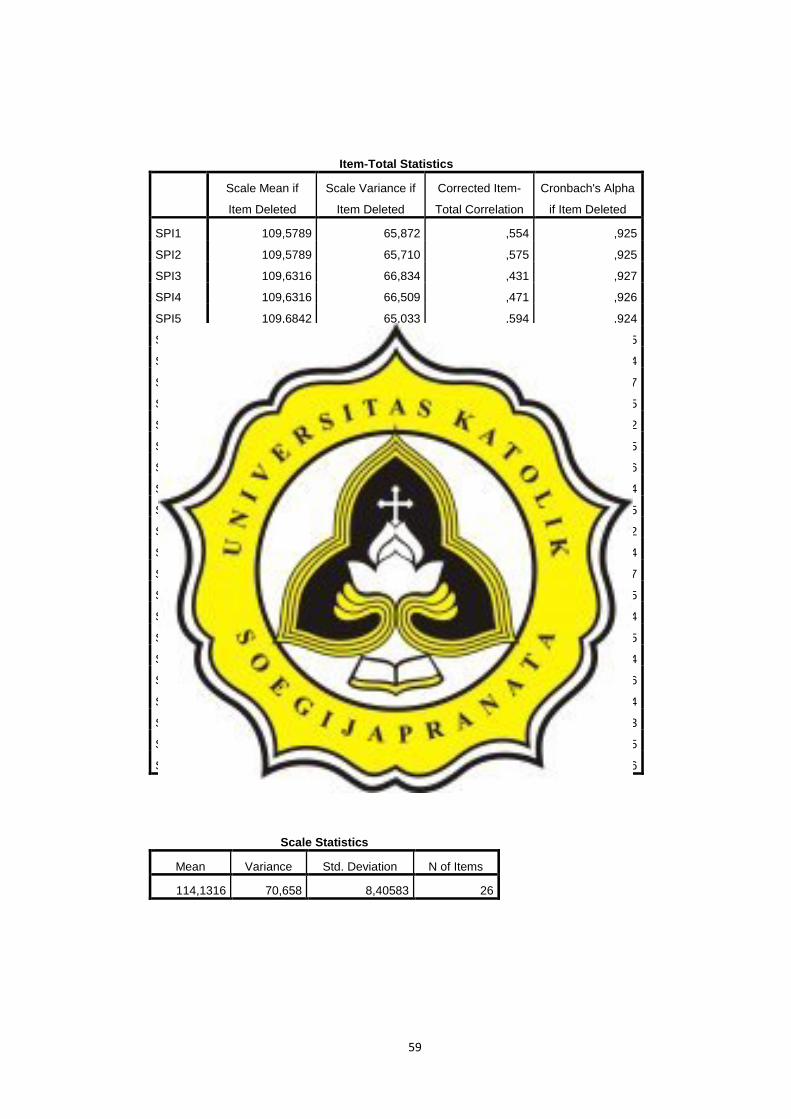
Item-Total Statistics
Scale Mean if
Item Deleted
Scale Variance if
Item Deleted
Corrected Item-
Total Correlation
Cronbach's Alpha
if Item Deleted
SPI1 109,5789 65,872 ,554 ,925
SPI2 109,5789 65,710 ,575 ,925
SPI3 109,6316 66,834 ,431 ,927
SPI4 109,6316 66,509 ,471 ,926
SPI5 109,6842 65,033 ,594 ,924
SPI6 109,7632 64,888 ,571 ,925
SPI7 109,7105 65,563 ,598 ,924
SPI8 110,0000 66,595 ,396 ,927
SPI9 109,7632 65,375 ,518 ,925
SPI10 109,7895 63,630 ,720 ,922
SPI11 109,7895 66,387 ,516 ,925
SPI12 109,6579 65,853 ,497 ,926
SPI13 109,7105 65,184 ,580 ,924
SPI14 109,8158 65,073 ,567 ,925
SPI15 109,7895 63,738 ,708 ,922
SPI16 109,7105 65,076 ,593 ,924
SPI17 109,7895 66,279 ,426 ,927
SPI18 109,7895 65,792 ,529 ,925
SPI19 109,8684 65,036 ,594 ,924
SPI20 109,8158 66,371 ,530 ,925
SPI21 109,9211 64,940 ,639 ,924
SPI22 109,7105 66,265 ,455 ,926
SPI23 109,6842 64,654 ,638 ,924
SPI24 109,7895 64,225 ,653 ,923
SPI25 109,7632 65,969 ,560 ,925
SPI26 109,5526 66,578 ,469 ,926
Scale Statistics
Mean Variance Std. Deviation N of Items
114,1316 70,658 8,40583 26
60
Reliability Scale: ALL VARIABLES
Case Processing Summary
N %
Cases
Valid 38 100,0
Excludeda 0 ,0
Total 38 100,0
a. Listwise deletion based on all variables in the
procedure.
Reliability Statistics
Cronbach's Alpha N of Items
,751 12
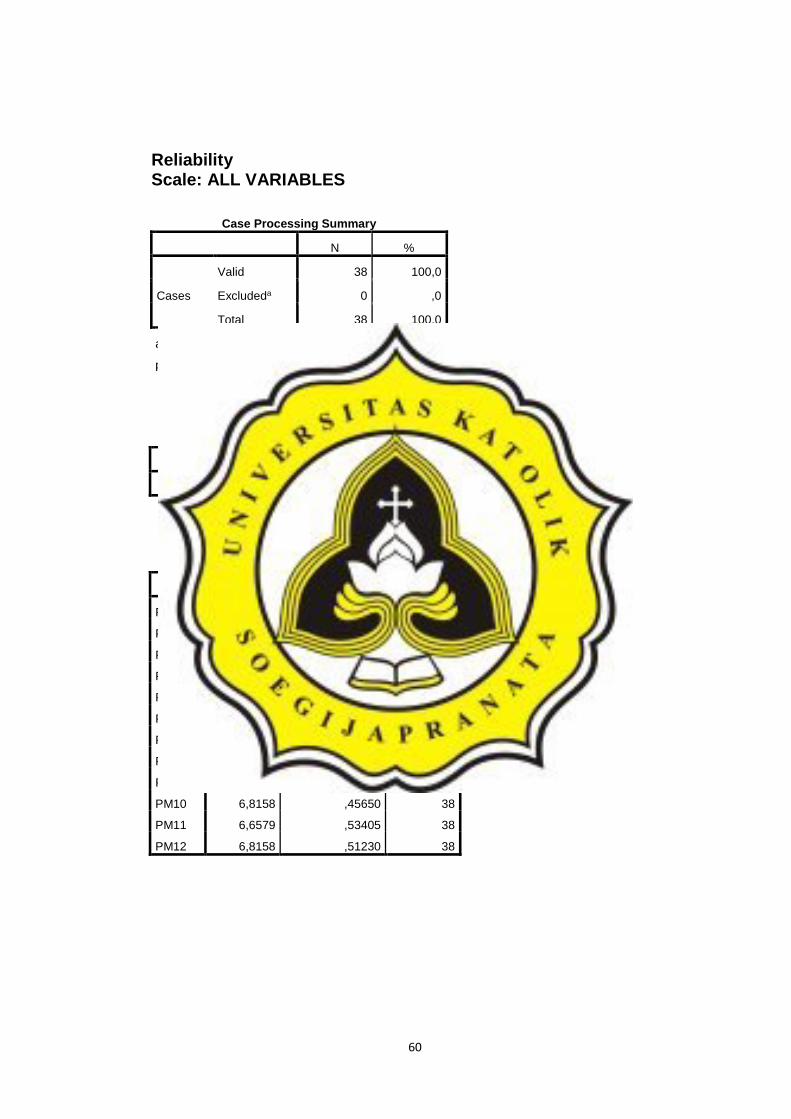
Item Statistics
Mean Std. Deviation N
PM1 6,6316 ,63335 38
PM2 6,5789 ,55173 38
PM3 6,9737 ,16222 38
PM4 6,3158 1,09311 38
PM5 6,9211 ,27328 38
PM6 6,6053 ,63839 38
PM7 6,1842 ,92577 38
PM8 6,1842 ,98242 38
PM9 6,5526 ,64504 38
PM10 6,8158 ,45650 38
PM11 6,6579 ,53405 38
PM12 6,8158 ,51230 38
61
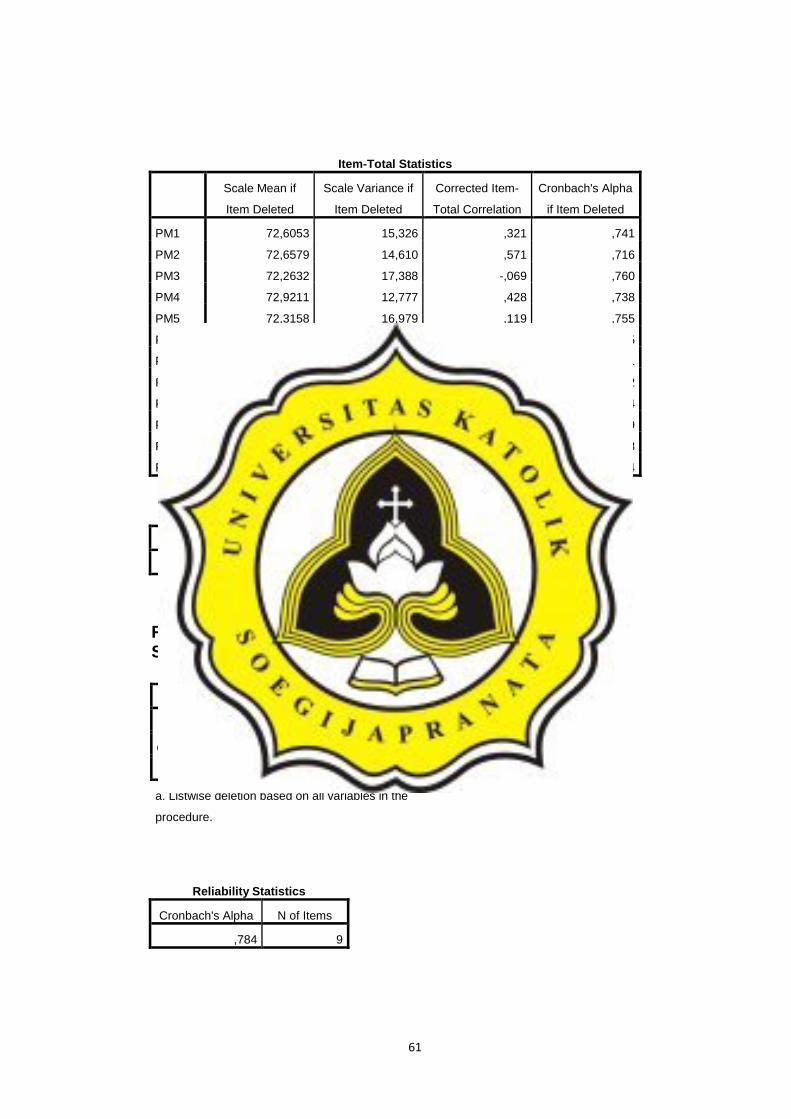
Item-Total Statistics
Scale Mean if
Item Deleted
Scale Variance if
Item Deleted
Corrected Item-
Total Correlation
Cronbach's Alpha
if Item Deleted
PM1 72,6053 15,326 ,321 ,741
PM2 72,6579 14,610 ,571 ,716
PM3 72,2632 17,388 -,069 ,760
PM4 72,9211 12,777 ,428 ,738
PM5 72,3158 16,979 ,119 ,755
PM6 72,6316 16,401 ,099 ,765
PM7 73,0526 12,213 ,657 ,691
PM8 73,0526 12,592 ,540 ,712
PM9 72,6842 13,519 ,714 ,694
PM10 72,4211 15,818 ,356 ,739
PM11 72,5789 15,548 ,353 ,738
PM12 72,4211 15,440 ,402 ,734
Scale Statistics
Mean Variance Std. Deviation N of Items
79,2368 17,321 4,16182 12
Reliability Scale: ALL VARIABLES
Case Processing Summary
N %
Cases
Valid 38 100,0
Excludeda 0 ,0
Total 38 100,0
a. Listwise deletion based on all variables in the
procedure.
Reliability Statistics
Cronbach's Alpha N of Items
,784 9
62
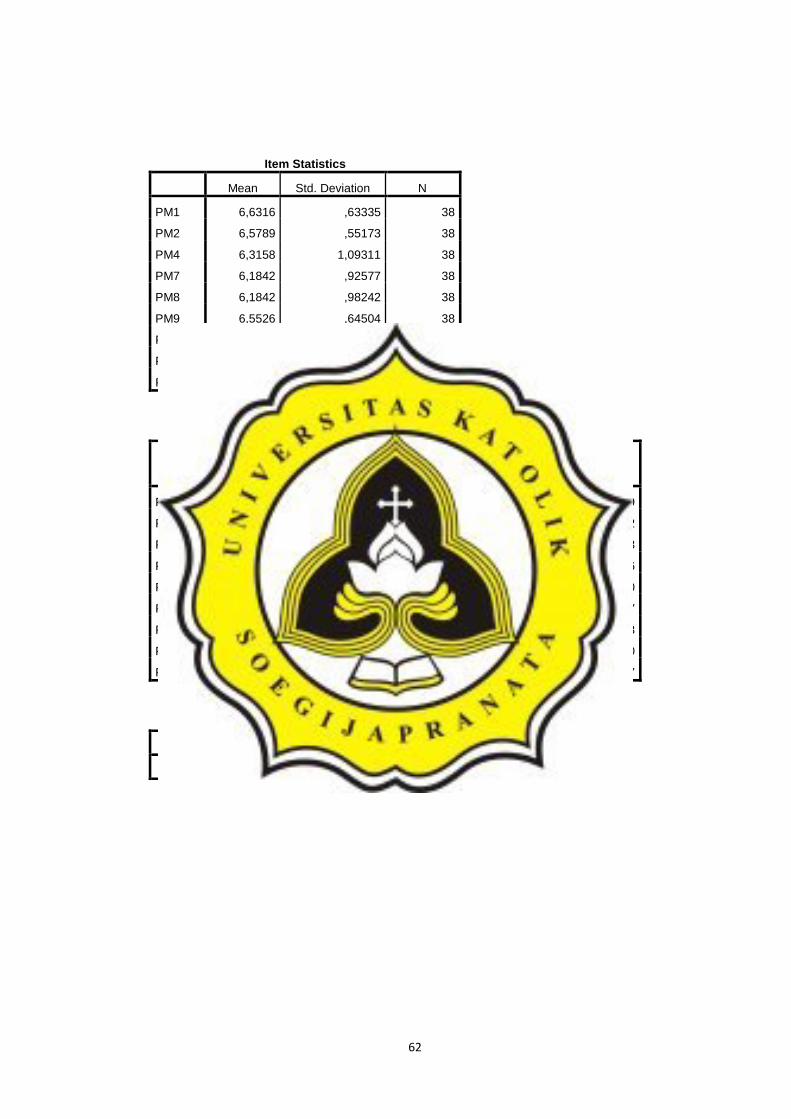
Item Statistics
Mean Std. Deviation N
PM1 6,6316 ,63335 38
PM2 6,5789 ,55173 38
PM4 6,3158 1,09311 38
PM7 6,1842 ,92577 38
PM8 6,1842 ,98242 38
PM9 6,5526 ,64504 38
PM10 6,8158 ,45650 38
PM11 6,6579 ,53405 38
PM12 6,8158 ,51230 38
Item-Total Statistics
Scale Mean if
Item Deleted
Scale Variance if
Item Deleted
Corrected Item-
Total Correlation
Cronbach's Alpha
if Item Deleted
PM1 52,1053 14,097 ,346 ,779
PM2 52,1579 13,434 ,595 ,752
PM4 52,4211 11,440 ,475 ,773
PM7 52,5526 11,335 ,634 ,736
PM8 52,5526 11,443 ,562 ,750
PM9 52,1842 12,317 ,754 ,727
PM10 51,9211 14,885 ,298 ,783
PM11 52,0789 14,507 ,333 ,780
PM12 51,9211 14,453 ,367 ,777
Scale Statistics
Mean Variance Std. Deviation N of Items
58,7368 16,145 4,01810 9
63
Reliability Scale: ALL VARIABLES
Case Processing Summary
N %
Cases
Valid 38 100,0
Excludeda 0 ,0
Total 38 100,0
a. Listwise deletion based on all variables in the
procedure.
Reliability Statistics
Cronbach's Alpha N of Items
,873 14
Item-Total Statistics
Scale Mean if
Item Deleted
Scale Variance if
Item Deleted
Corrected Item-
Total Correlation
Cronbach's Alpha
if Item Deleted
K1 21,8684 22,334 ,044 ,879
K2 22,0526 19,457 ,371 ,878
K3 21,8421 22,245 ,136 ,877
K4 22,1842 18,208 ,618 ,861
K5 22,2632 19,767 ,549 ,864
K6 22,0000 17,135 ,710 ,855
K7 21,9211 21,804 ,199 ,877
K8 22,1053 18,853 ,613 ,860
K9 22,0789 18,669 ,609 ,861
K10 22,1053 19,124 ,686 ,857
K11 22,2632 18,578 ,751 ,853
K12 22,4211 18,629 ,843 ,850
K13 22,2368 19,483 ,622 ,861
K14 22,2632 19,713 ,561 ,864
Scale Statistics
Mean Variance Std. Deviation N of Items
23,8158 22,479 4,74117 14

64
Reliability Scale: ALL VARIABLES
Case Processing Summary
N %
Cases
Valid 38 100,0
Excludeda 0 ,0
Total 38 100,0
a. Listwise deletion based on all variables in the
procedure.
Reliability Statistics
Cronbach's Alpha N of Items
,900 10
Item Statistics
Mean Std. Deviation N
K4 1,6316 ,71361 38
K5 1,5526 ,50390 38
K6 1,8158 ,80052 38
K8 1,7105 ,61106 38
K9 1,7368 ,64449 38
K10 1,7105 ,51506 38
K11 1,5526 ,55495 38
K12 1,3947 ,49536 38
K13 1,5789 ,50036 38
K14 1,5526 ,50390 38
65
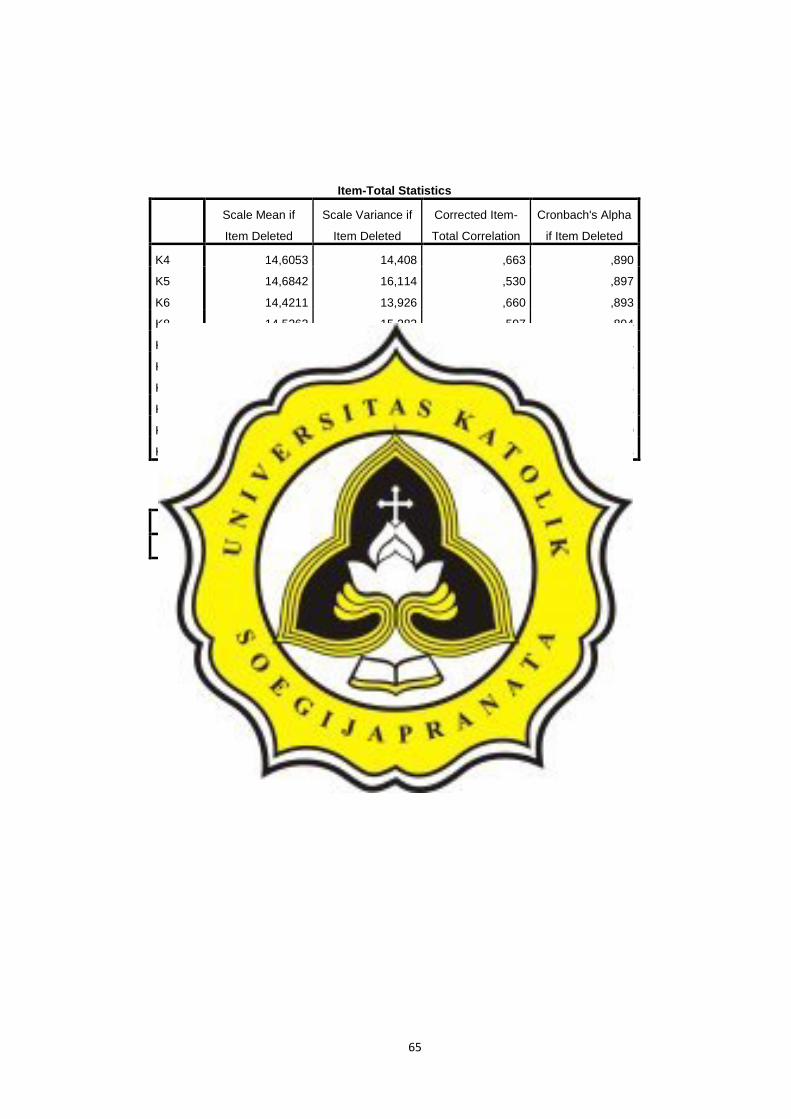
Item-Total Statistics
Scale Mean if
Item Deleted
Scale Variance if
Item Deleted
Corrected Item-
Total Correlation
Cronbach's Alpha
if Item Deleted
K4 14,6053 14,408 ,663 ,890
K5 14,6842 16,114 ,530 ,897
K6 14,4211 13,926 ,660 ,893
K8 14,5263 15,283 ,597 ,894
K9 14,5000 15,122 ,593 ,894
K10 14,5263 15,283 ,735 ,886
K11 14,6842 14,925 ,764 ,883
K12 14,8421 15,055 ,835 ,881
K13 14,6579 15,637 ,663 ,890
K14 14,6842 15,844 ,601 ,893
Scale Statistics
Mean Variance Std. Deviation N of Items
16,2368 18,510 4,30232 10

66
LAMPIRAN 4.
UJI ASUMSI KLASIK
NPar Tests
One-Sample Kolmogorov-Smirnov Test
Standardized
Residual
N 38
Normal Parametersa,b Mean 0E-7
Std. Deviation ,95860259
Most Extreme Differences
Absolute ,145
Positive ,145
Negative -,054
Kolmogorov-Smirnov Z ,892
Asymp. Sig. (2-tailed) ,403
a. Test distribution is Normal.
b. Calculated from data.
67
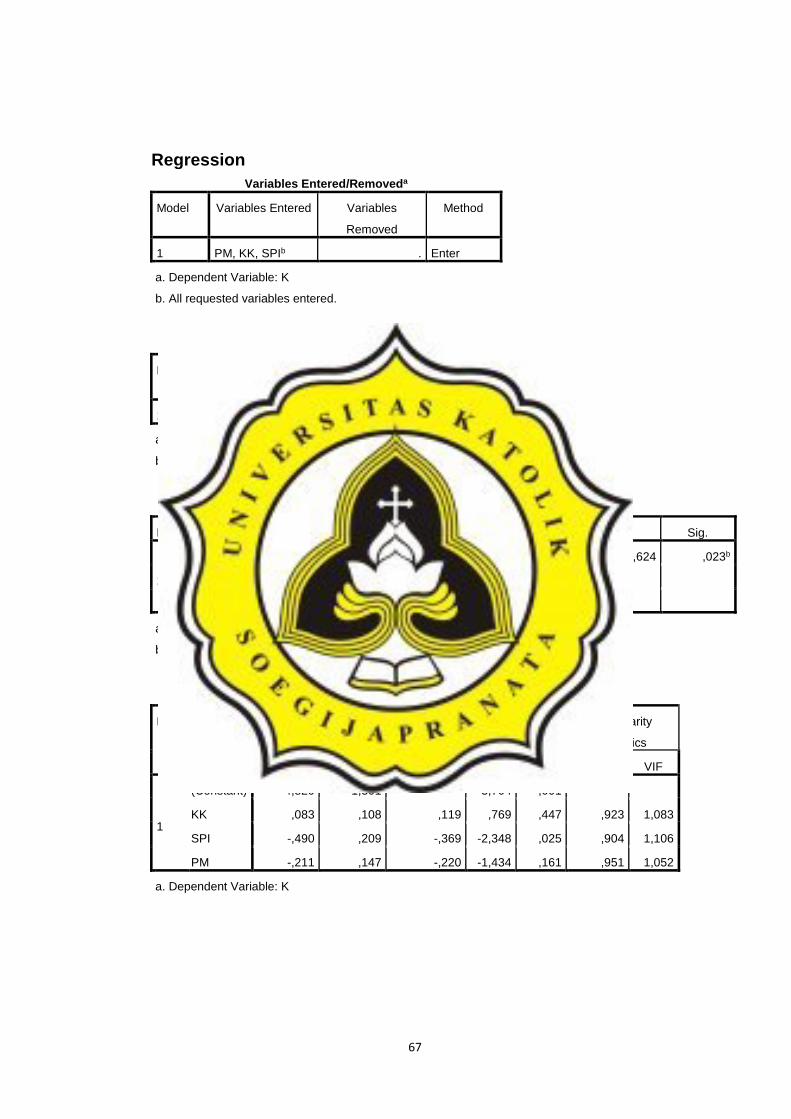
Regression
Variables Entered/Removeda
Model Variables Entered Variables
Removed
Method
1 PM, KK, SPIb . Enter
a. Dependent Variable: K
b. All requested variables entered.
Model Summaryb
Model R R Square Adjusted R
Square
Std. Error of the
Estimate
1 ,492a ,242 ,175 ,39067
a. Predictors: (Constant), PM, KK, SPI
b. Dependent Variable: K
ANOVAa
Model Sum of Squares df Mean Square F Sig.
1
Regression 1,659 3 ,553 3,624 ,023b
Residual 5,189 34 ,153
Total 6,849 37
a. Dependent Variable: K
b. Predictors: (Constant), PM, KK, SPI
Coefficientsa
Model Unstandardized
Coefficients
Standardized
Coefficients
t Sig. Collinearity
Statistics
B Std. Error Beta Tolerance VIF
1
(Constant) 4,820 1,301 3,704 ,001
KK ,083 ,108 ,119 ,769 ,447 ,923 1,083
SPI -,490 ,209 -,369 -2,348 ,025 ,904 1,106
PM -,211 ,147 -,220 -1,434 ,161 ,951 1,052
a. Dependent Variable: K
68
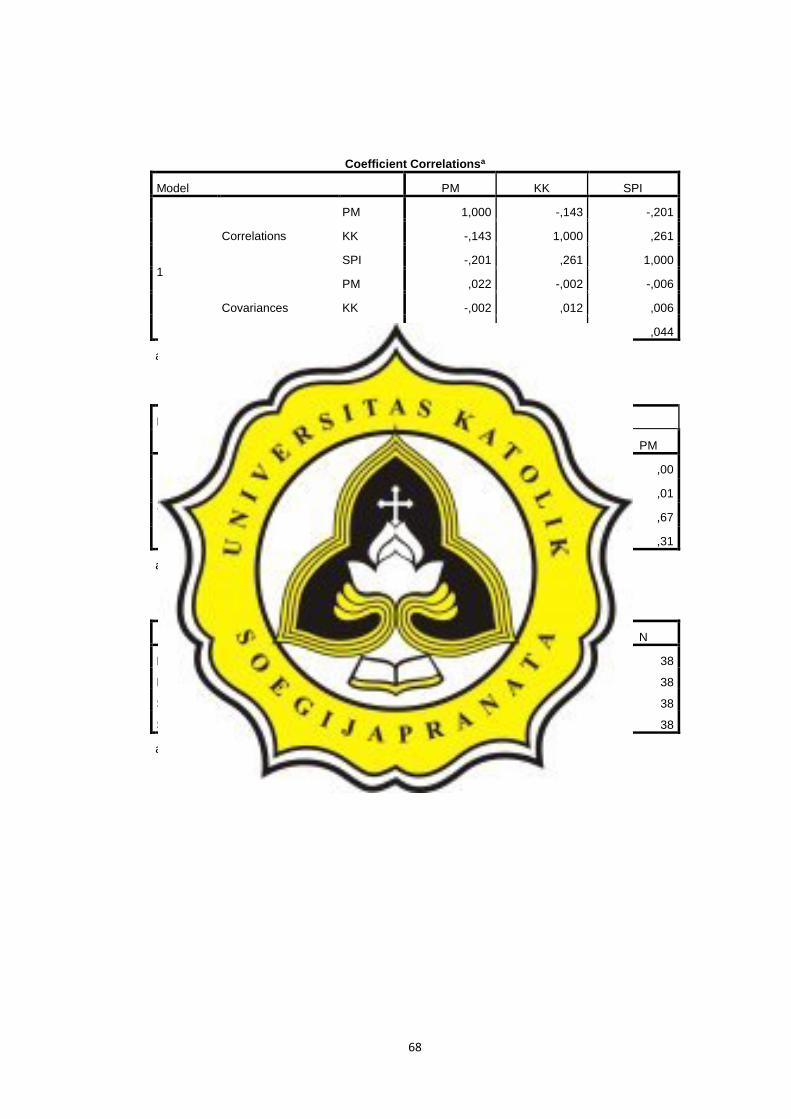
Coefficient Correlationsa
Model PM KK SPI
1
Correlations
PM 1,000 -,143 -,201
KK -,143 1,000 ,261
SPI -,201 ,261 1,000
Covariances
PM ,022 -,002 -,006
KK -,002 ,012 ,006
SPI -,006 ,006 ,044
a. Dependent Variable: K
Residuals Statisticsa
Minimum Maximum Mean Std. Deviation N
Predicted Value 1,2640 2,1980 1,6237 ,21178 38
Residual -,61983 ,88072 ,00000 ,37450 38
Std. Predicted Value -1,698 2,712 ,000 1,000 38
Std. Residual -1,587 2,254 ,000 ,959 38
a. Dependent Variable: K
Collinearity Diagnosticsa
Model Dimension Eigenvalue Condition
Index
Variance Proportions
(Constant) KK SPI PM
1
1 3,975 1,000 ,00 ,00 ,00 ,00
2 ,019 14,397 ,00 ,78 ,05 ,01
3 ,004 32,768 ,00 ,09 ,52 ,67
4 ,002 48,398 1,00 ,13 ,43 ,31
a. Dependent Variable: K
69
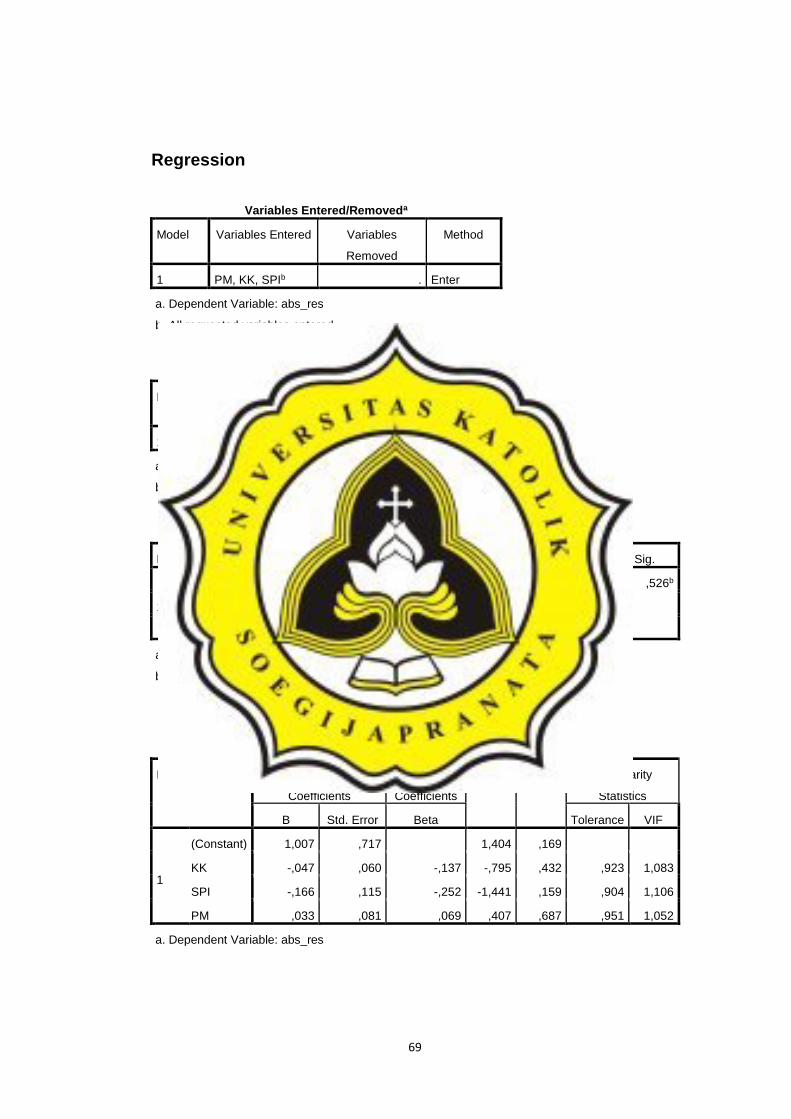
Regression
Variables Entered/Removeda
Model Variables Entered Variables
Removed
Method
1 PM, KK, SPIb . Enter
a. Dependent Variable: abs_res
b. All requested variables entered.
Model Summaryb
Model R R Square Adjusted R
Square
Std. Error of the
Estimate
1 ,250a ,063 -,020 ,21524
a. Predictors: (Constant), PM, KK, SPI
b. Dependent Variable: abs_res
ANOVAa
Model Sum of Squares df Mean Square F Sig.
1
Regression ,105 3 ,035 ,757 ,526b
Residual 1,575 34 ,046
Total 1,680 37
a. Dependent Variable: abs_res
b. Predictors: (Constant), PM, KK, SPI
Coefficientsa
Model Unstandardized
Coefficients
Standardized
Coefficients
t Sig. Collinearity
Statistics
B Std. Error Beta Tolerance VIF
1
(Constant) 1,007 ,717 1,404 ,169
KK -,047 ,060 -,137 -,795 ,432 ,923 1,083
SPI -,166 ,115 -,252 -1,441 ,159 ,904 1,106
PM ,033 ,081 ,069 ,407 ,687 ,951 1,052
a. Dependent Variable: abs_res
70
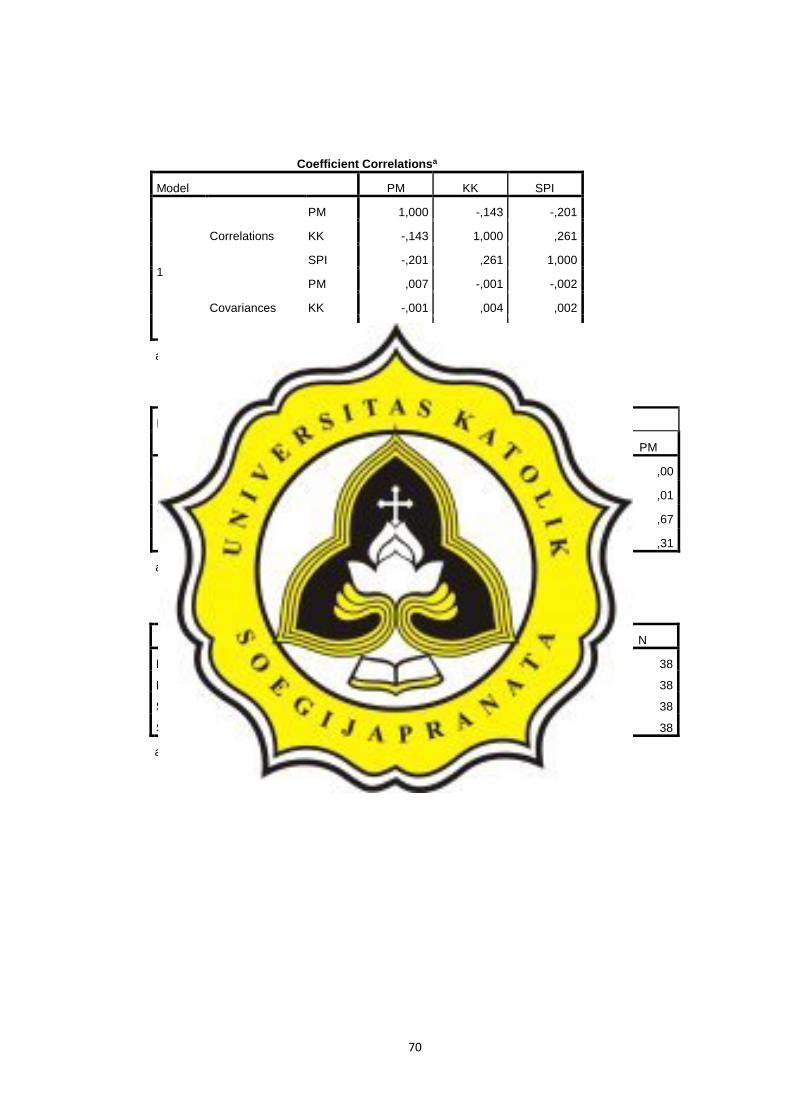
Coefficient Correlationsa
Model PM KK SPI
1
Correlations
PM 1,000 -,143 -,201
KK -,143 1,000 ,261
SPI -,201 ,261 1,000
Covariances
PM ,007 -,001 -,002
KK -,001 ,004 ,002
SPI -,002 ,002 ,013
a. Dependent Variable: abs_res
Collinearity Diagnosticsa
Model Dimension Eigenvalue Condition
Index
Variance Proportions
(Constant) KK SPI PM
1
1 3,975 1,000 ,00 ,00 ,00 ,00
2 ,019 14,397 ,00 ,78 ,05 ,01
3 ,004 32,768 ,00 ,09 ,52 ,67
4 ,002 48,398 1,00 ,13 ,43 ,31
a. Dependent Variable: abs_res
Residuals Statisticsa
Minimum Maximum Mean Std. Deviation N
Predicted Value ,1817 ,4521 ,3039 ,05331 38
Residual -,25562 ,48947 ,00000 ,20633 38
Std. Predicted Value -2,292 2,781 ,000 1,000 38
Std. Residual -1,188 2,274 ,000 ,959 38
a. Dependent Variable: abs_res

71
LAMPIRAN 5.
UJI STATISTIK DESKRIPTIF Means
Case Processing Summary
Cases
Included Excluded Total
N Percent N Percent N Percent
KK * JenisKelamin 38 100,0% 0 0,0% 38 100,0%
SPI * JenisKelamin 38 100,0% 0 0,0% 38 100,0%
PM * JenisKelamin 38 100,0% 0 0,0% 38 100,0%
K * JenisKelamin 38 100,0% 0 0,0% 38 100,0%
KK * Umur 38 100,0% 0 0,0% 38 100,0%
SPI * Umur 38 100,0% 0 0,0% 38 100,0%
PM * Umur 38 100,0% 0 0,0% 38 100,0%
K * Umur 38 100,0% 0 0,0% 38 100,0%
KK * Pendidikan 38 100,0% 0 0,0% 38 100,0%
SPI * Pendidikan 38 100,0% 0 0,0% 38 100,0%
PM * Pendidikan 38 100,0% 0 0,0% 38 100,0%
K * Pendidikan 38 100,0% 0 0,0% 38 100,0%
KK * MasaKerja 38 100,0% 0 0,0% 38 100,0%
SPI * MasaKerja 38 100,0% 0 0,0% 38 100,0%
PM * MasaKerja 38 100,0% 0 0,0% 38 100,0%
K * MasaKerja 38 100,0% 0 0,0% 38 100,0%
KK * Gaji 38 100,0% 0 0,0% 38 100,0%
SPI * Gaji 38 100,0% 0 0,0% 38 100,0%
PM * Gaji 38 100,0% 0 0,0% 38 100,0%
K * Gaji 38 100,0% 0 0,0% 38 100,0%
72
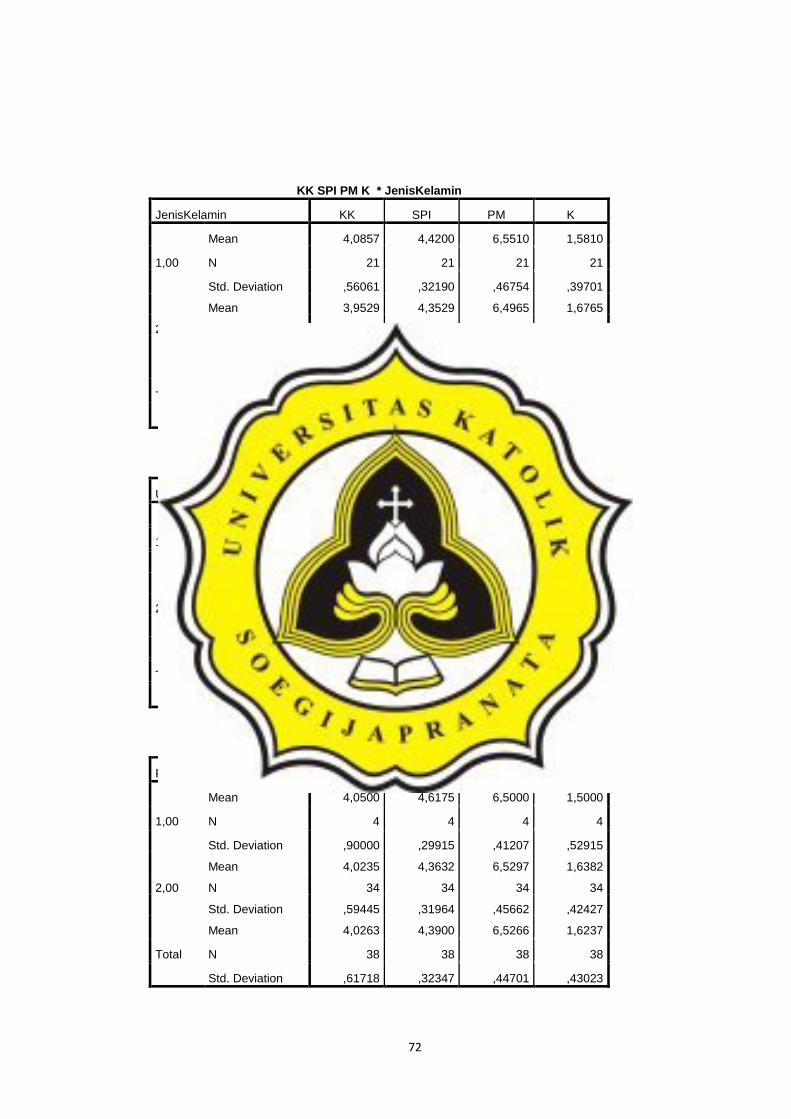
KK SPI PM K * JenisKelamin
JenisKelamin KK SPI PM K
1,00
Mean 4,0857 4,4200 6,5510 1,5810
N 21 21 21 21
Std. Deviation ,56061 ,32190 ,46754 ,39701
2,00
Mean 3,9529 4,3529 6,4965 1,6765
N 17 17 17 17
Std. Deviation ,69112 ,33136 ,43255 ,47504
Total
Mean 4,0263 4,3900 6,5266 1,6237
N 38 38 38 38
Std. Deviation ,61718 ,32347 ,44701 ,43023
KK SPI PM K * Umur
Umur KK SPI PM K
1,00
Mean 3,9000 4,5040 6,4100 1,5200
N 10 10 10 10
Std. Deviation ,67495 ,28787 ,48735 ,45412
2,00
Mean 4,0714 4,3493 6,5682 1,6607
N 28 28 28 28
Std. Deviation ,60176 ,33050 ,43339 ,42369
Total
Mean 4,0263 4,3900 6,5266 1,6237
N 38 38 38 38
Std. Deviation ,61718 ,32347 ,44701 ,43023
KK SPI PM K * Pendidikan
Pendidikan KK SPI PM K
1,00
Mean 4,0500 4,6175 6,5000 1,5000
N 4 4 4 4
Std. Deviation ,90000 ,29915 ,41207 ,52915
2,00
Mean 4,0235 4,3632 6,5297 1,6382
N 34 34 34 34
Std. Deviation ,59445 ,31964 ,45662 ,42427
Total
Mean 4,0263 4,3900 6,5266 1,6237
N 38 38 38 38
Std. Deviation ,61718 ,32347 ,44701 ,43023
73
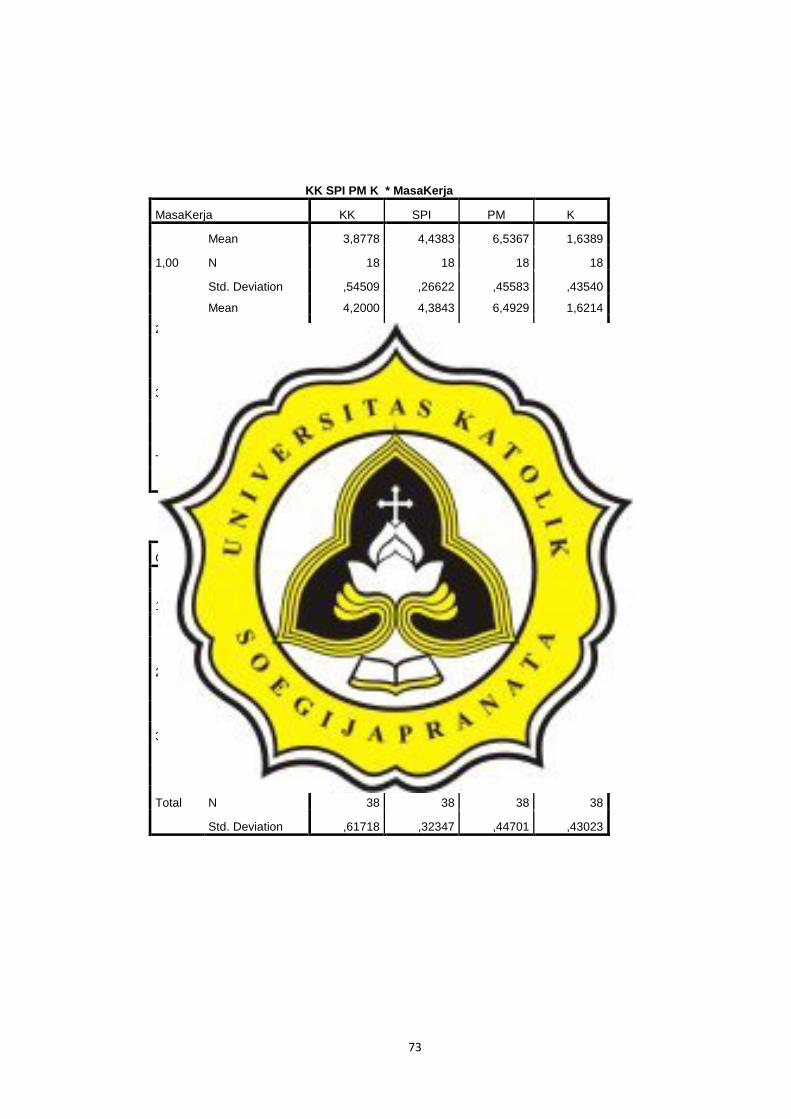
KK SPI PM K * MasaKerja
MasaKerja KK SPI PM K
1,00
Mean 3,8778 4,4383 6,5367 1,6389
N 18 18 18 18
Std. Deviation ,54509 ,26622 ,45583 ,43540
2,00
Mean 4,2000 4,3843 6,4929 1,6214
N 14 14 14 14
Std. Deviation ,76460 ,42082 ,49014 ,46769
3,00
Mean 4,0667 4,2583 6,5750 1,5833
N 6 6 6 6
Std. Deviation ,35024 ,20875 ,37581 ,39200
Total
Mean 4,0263 4,3900 6,5266 1,6237
N 38 38 38 38
Std. Deviation ,61718 ,32347 ,44701 ,43023
KK SPI PM K * Gaji
Gaji KK SPI PM K
1,00
Mean 3,9048 4,4124 6,4281 1,7190
N 21 21 21 21
Std. Deviation ,64998 ,35905 ,46190 ,49560
2,00
Mean 4,2267 4,3673 6,7567 1,5000
N 15 15 15 15
Std. Deviation ,57005 ,29339 ,28251 ,32293
3,00
Mean 3,8000 4,3250 5,8350 1,5500
N 2 2 2 2
Std. Deviation ,28284 ,24749 ,23335 ,21213
Total
Mean 4,0263 4,3900 6,5266 1,6237
N 38 38 38 38
Std. Deviation ,61718 ,32347 ,44701 ,43023