land cover map of the lower mekong basin - mrc
TRANSCRIPT

Page i
Land Cover Map of the Lower Mekong Basin
Mekong River Commission
Land Cover Map of the Lower Mekong Basin
MRC Technical Paper No. 59
March 2016
C a m b o d i a . L a o P D R . T h a i l a n d . V i e t N a m
For sustainable development
ISSN: 1683-1489


Mekong River Commission
Land Cover Mapof the Lower Mekong Basin
MRC Technical Paper No. 59
March 2016
C a m b o d i a . L a o P D R . T h a i l a n d . V i e t N a m
For sustainable development

Page iv
Land Cover Map of the Lower Mekong Basin
Published in Phnom Penh, Cambodia in March 2016 by the Mekong River Commission
Cite this document as:
Kityuttachai, K.; Heng, S. and Sou, V. (2016) Land Cover Map of the Lower Mekong Basin, MRC Technical Paper No. 59, Information and Knowledge Management Programme, Mekong River Commission, Phnom Penh, Cambodia. 82pp. ISSN: 1683-1489
The opinions and interpretations expressed within are those of the authors and do not necessarily reflect the views of the Mekong River Commission.
Editor: P. Starr
Graphic design and layout: C. Chheana
Cover: Mosaic of satellite images from the Lower Mekong Basin from LaNdSaT 5 TM
© Mekong River Commission E-mail: [email protected] Website: www.mrcmekong.org
Office of the Secretariat in Phnom Penh (OSP)576 National Road, #2, Chak angre Krom,
P.O. Box 623, Phnom Penh, CambodiaTel. (855-23) 425 353 Fax. (855-23) 425 363
Office of the Secretariat in Vientiane (OSV) Office of the Chief Executive Officer 184 Fa Ngoum Road, P.O. Box 6101,
Vientiane, Lao PdRTel. (856-21) 263 263 Fax. (856-21) 263 264
Page v
Contents
List of Figures ...................................................................................................................................... vii
List of Tables .....................................................................................................................................viii
abbreviations and acronyms ................................................................................................................. ix
Executive Summary ................................................................................................................................ xi
acknowledgements ..............................................................................................................................xiii
1. Introduction ........................................................................................................................................ 1 1.1 Background ................................................................................................................................. 1 1.2 Project to update the Land Cover Map ........................................................................................ 1 1.3 Definitions under the Land Cover Classification System ........................................................... 2
2 Project description ............................................................................................................................. 9 2.1 description ................................................................................................................................... 9 2.2 Outcomes ................................................................................................................................... 10 2.3 Objectives .................................................................................................................................. 10 2.4 Scope and Limitation ................................................................................................................ 11 2.5 Outputs .... .................................................................................................................................. 11 2.6 Methodology ............................................................................................................................. 11
3 Study area .... .................................................................................................................................... 17
4 Field Survey data Collection ........................................................................................................... 21 4.1 Objective ................................................................................................................................... 21 4.2 Methodology and Tools ............................................................................................................. 21 4.3 Processing for LMB .................................................................................................................. 23 4.4 Results ...................................................................................................................................... 26
5 Satellite Image Interpretation ............................................................................................................ 33 5.1 acquisition ................................................................................................................................ 33 5.2 data Preparation ....................................................................................................................... 35 5.2.1 Radiometric Correction ................................................................................................... 35 5.2.2 Geometric Correction ...................................................................................................... 35 5.2.3 data Normalisation ......................................................................................................... 35 5.2.4 Projection and Format Conversion ................................................................................. 36
Page vi
Land Cover Map of the Lower Mekong Basin
5.3 Image Classification ............................................................................................................... 36 5.3.1 Classification Techniques ............................................................................................... 36 5.4 Land Cover Maps for dry and Wet Period ................................................................................ 39 5.5 accuracy assessment ................................................................................................................. 46
6 annual Land Cover Map 2010 ......................................................................................................... 51 6.1 derivation of the annual Land Cover Map 2010 ...................................................................... 51 6.2 Comparison of Land Cover Maps 2003 and 2010 ..................................................................... 56
7 Quality assurance, Metadata and Storage ........................................................................................ 63
8 Conclusions ...................................................................................................................................... 67 8.1 Common Land Cover Classification for the LMB .................................................................... 67 8.2 Methodology and Tools ............................................................................................................. 67 8.3 Outputs ...................................................................................................................................... 68 8.4 Recommendations ..................................................................................................................... 68 8.5 Lessons Learnt and Limitations ................................................................................................. 69
9 References ...................................................................................................................................... 71
annex 1: description Card for Field Survey Result ............................................................................ 75
annex 2: Field Surveys in the Four Countries ..................................................................................... 81

Page vii
List of Figures
Figure 1: FaO Overview of the Land Cover Classification System, its Two Phases and Classifiers ..................3
Figure 2: Final Land Cover Classification for 2010 (Project Output 1) .............................................................13
Figure 3: Land Cover Classification Information Catalogue (Project Output 2) ...............................................15
Figure 4: Improved Capacity of MRC Information System (Project Output 3) .................................................16
Figure 5: Study area (Landform Zones in the LMB) .........................................................................................18
Figure 6: Flow Chart for Field for data Processing of Land Cover Information for the LMB ........................24
Figure 7: distribution of Target areas within the LMB ....................................................................................25
Figure 8: Example of 15 Target Points (Small Plots) in a Target area...............................................................26
Figure 9: Hotlink in arcGIS to description Card for Field Survey Results ......................................................27
Figure 10: Main Types of Land Cover at Survey Points ......................................................................................28
Figure 11: Homogeneity of Land Cover at Survey Points ...................................................................................29
Figure 12: Landsat 5 Thematic Mapper Satellite Images acquired Showing Paths and Rows ...........................33
Figure 13: Flow Chart for Image Interpretation and Classification .....................................................................38
Figure 14a: areas of Periodic Land Cover Change Between dry and Wet Periods in the Mekong delta ............39
Figure 14b: Enhanced area of Water body in Wet Period; Flooded Forest and Returning annual Crop in dry Period or Receding Paddy Rice after flood period .............................................................................40
Figure 15: Land Cover Map for dry Period .........................................................................................................41
Figure 16: Land Cover Map for Wet Period .........................................................................................................44
Figure 17: Land Cover Map for 2010 ...................................................................................................................53
Figure 18: distribution of Land Cover Types in the Lower Mekong Basin in 2010 ...........................................55
Figure 19: Land Cover Map 2003 ........................................................................................................................58
Figure 20: Land Cover Changes in the Lower Mekong Basin between 2003 and 2010 .....................................59
Figure 21: Land Cover Changes at district Level between 2003 and 2010 .........................................................61
Page viii
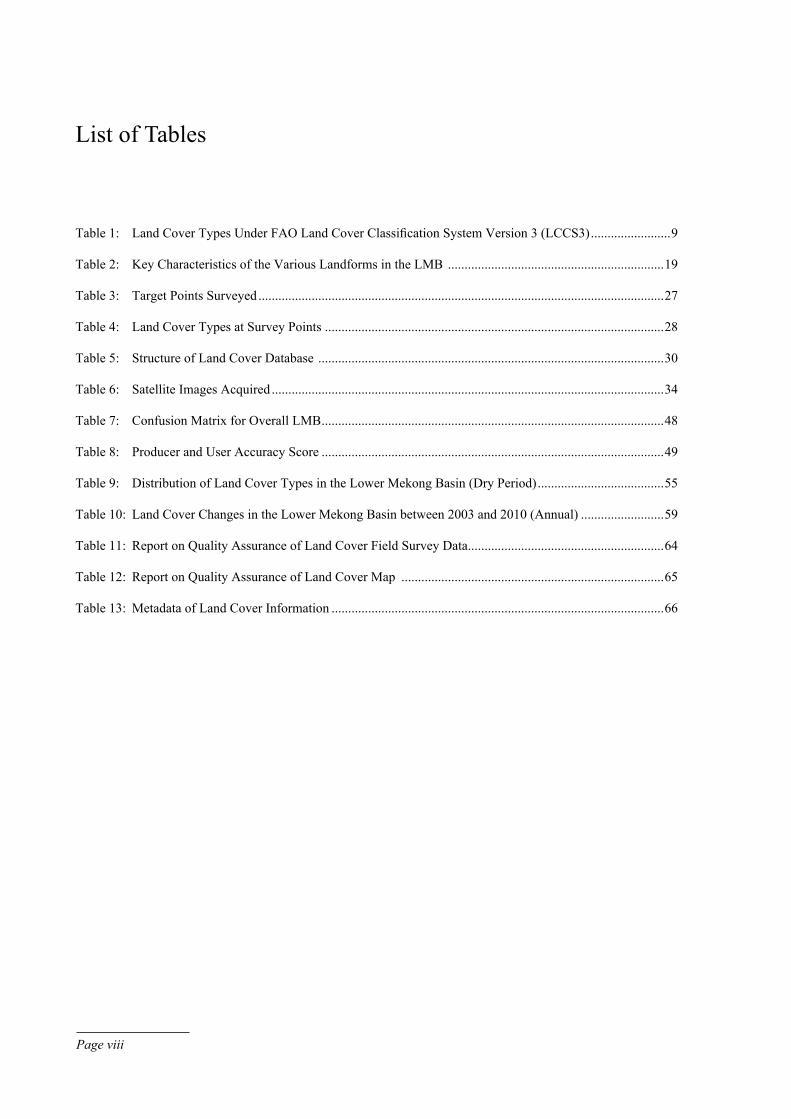
List of Tables
Table 1: Land Cover Types Under FAO Land Cover Classification System Version 3 (LCCS3) ........................9
Table 2: Key Characteristics of the Various Landforms in the LMB .................................................................19
Table 3: Target Points Surveyed ..........................................................................................................................27
Table 4: Land Cover Types at Survey Points ......................................................................................................28
Table 5: Structure of Land Cover database ........................................................................................................30
Table 6: Satellite Images acquired ......................................................................................................................34
Table 7: Confusion Matrix for Overall LMB .......................................................................................................48
Table 8: Producer and User accuracy Score .......................................................................................................49
Table 9: distribution of Land Cover Types in the Lower Mekong Basin (dry Period) ......................................55
Table 10: Land Cover Changes in the Lower Mekong Basin between 2003 and 2010 (annual) .........................59
Table 11: Report on Quality assurance of Land Cover Field Survey data ...........................................................64
Table 12: Report on Quality assurance of Land Cover Map ...............................................................................65
Table 13: Metadata of Land Cover Information ....................................................................................................66
Page ix
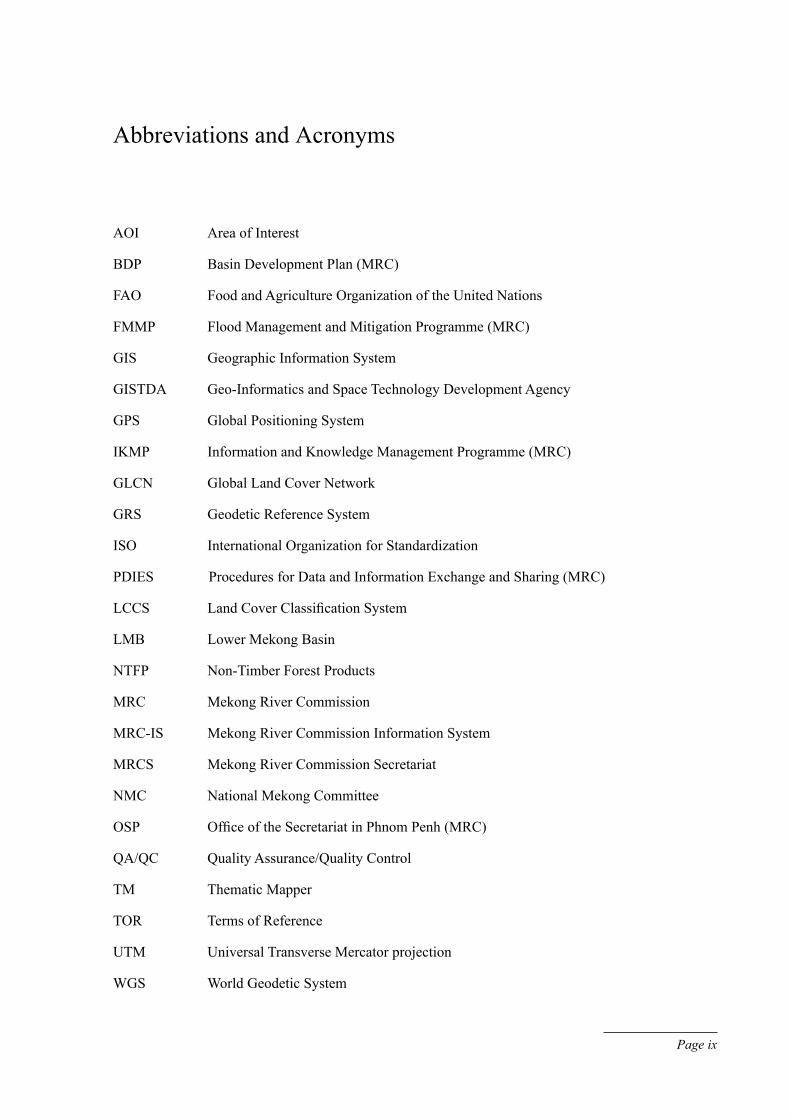
abbreviations and acronyms
aOI area of Interest
BdP Basin development Plan (MRC)
FaO Food and agriculture Organization of the United Nations
FMMP Flood Management and Mitigation Programme (MRC)
GIS Geographic Information System
GISTda Geo-Informatics and Space Technology development agency
GPS Global Positioning System
IKMP Information and Knowledge Management Programme (MRC)
GLCN Global Land Cover Network
GRS Geodetic Reference System
ISO International Organization for Standardization
PdIES Procedures for data and Information Exchange and Sharing (MRC)
LCCS Land Cover Classification System
LMB Lower Mekong Basin
NTFP Non-Timber Forest Products
MRC Mekong River Commission
MRC-IS Mekong River Commission Information System
MRCS Mekong River Commission Secretariat
NMC National Mekong Committee
OSP Office of the Secretariat in Phnom Penh (MRC)
Qa/QC Quality assurance/Quality Control
TM Thematic Mapper
TOR Terms of Reference
UTM Universal Transverse Mercator projection
WGS World Geodetic System

Page x
Land Cover Map of the Lower Mekong Basin

Page xi
Executive Summary
Land cover is defined as the observed (bio)physical cover on the earth’s surface which is believed to provide critical refuge and spawning habitats for many life forms. In the Lower Mekong Basin (LMB), the health of these habitats is considered "good" but threatened by development. a wide range of stakeholders recognises the importance of land cover for sustaining human-dependent livelihoods and maintaining the ecological integrity of the basin, as reflected in the widespread use of land cover types as the basis for agro-ecological zones.
To develop and update a land cover map of the Lower Mekong Basin for 2010, the MRC Secretariat cooperated with Member Countries to conduct field surveys on land cover at 9,357 points in 703 areas across the basin. This report seeks to contribute to improving knowledge and understanding of the distribution, ecological functioning and conservation of land cover with a synthesis of the results of field surveys coupled with interpretations of satellite imagery. Information is illustrated in land cover description cards in annex 1.
The Project to Update the Land Cover Map of the Lower Mekong Basin has generated important baseline data for water resource planning, floodplain management and other activities such as hydrological and climate change studies together with environmental modelling.
The land cover data set covers both the dry and wet periods in 2010 as well as separate annual data comprising a combination of the two. The annual map for 2010 shows that Broadleaved deciduous Forest and Paddy Rice accounted for more than half of the land cover of the Lower Mekong Basin. Shrubland was the next most common type of land cover followed by Broadleaved Evergreen Forest, annual Crops, Industrial Plantations and Urban areas. Broadleaved deciduous Forest alone accounted for 29 percent of the basin's land cover, up from 21 percent in the previous map of land cover produced for 2003. Paddy Rice accounted for 23 percent, down from 24 percent. In addition to providing updated estimates for other types of land cover, the map for 2010 also features new seasonal crop data for Shrimp rotating with Paddy Rice between the dry and wet periods and Paddy Rice rotating with annual Crops.
The updated land cover data set is very important to support decision making. The data, information and image interpretation are also useful for those engaged in studies and research in the Lower Mekong Basin. at the same time, this report seeks to raise awareness among stakeholders of the significance and ecological functions of land cover in the LMB.

Page xii
Land Cover Map of the Lower Mekong Basin
Page xiii
acknowledgements
This report is the product of many land cover assemblages which contributed in different ways to establish technical approaches to project implementation, the regional land cover typology of the Lower Mekong Basin, the field survey approach as well as satellite image interpretation and classification with accuracy assessments.
The authors would like to thank the Finland Fund for financing this study. Special thanks go to the National Mekong Committees (NMCs) of Cambodia, Lao PdR, Thailand and Viet Nam for good cooperation with national field survey teams and line agencies. The study was completed with special efforts from land cover expert teams from the Ministry of Environment (MOE) of Cambodia, the department of Forestry (dOF) of Lao PdR, the Land development department (Ldd) of Thailand and the Sub-National Institute of agricultural Planning and Projection (Sub-NIaPP) of Viet Nam.
We would also like to thank the FAO team for providing methods and knowledge for field survey documentation concerning the management of land cover field data collection and training including in Mad-CaT software for object-based operations. We also express our appreciation to our former colleagues Mr Erland d. Jensen, Ms Vo Thi Be Nam and dr Michael Haase who were the intermittent team contributing inputs to the project.

Page xiv
Land Cover Map of the Lower Mekong Basin

Page 1
1 Introduction
1.1 Background
In 1997, the Mekong River Commission completed a project to produce forest cover data on the Lower Mekong Basin. The project, launched by the Interim Mekong Committee in 1992, was followed by another to update maps of land cover and wetlands across the basin. This second project was completed in cooperation with the Food and agriculture Organization of the United Nations (FaO) in 2003. This new data set was aligned to the FAO's Land Cover Classification System. The information on wetlands, however, was out of date, being based on aggregated data from Member Countries between 1993 and 1997.
all Member Countries requested updates to these data sets, which are essential for sustainable resource management as well as being core data for monitoring and modelling. almost all MRC programmes require updated data on land cover. Potential applications include fish production models (Fisheries Programme), development planning (Basin development Plan Programme), wetlands monitoring and climate change scenarios (Environment Programme), and flood and land management (Flood Management and Mitigation Programme).
1.2 Project to update the Land Cover Map
The Project to Update the Land Cover Map of the Lower Mekong Basin (LMB) in 2010 was a core activity of the Information and Knowledge Management Programme (IKMP). Such updates can provide a significant amount of core geospatial data and information to support MRC programmes as well as National Mekong Committees and line agencies in terms of GIS analysis, mapping, modelling and decision-making in national and regional planning.
To establish a baseline for producing an updated and qualified land cover data set and catalogue for the basin, the National Mekong Committees and line agencies collected field data on land cover between October 2011 and February 2012. The main objectives were to collect, compile and provide accurate and reliable information to help interpret satellite imagery, conduct achievable accuracy assessments and establish a land cover information catalogue for the LMB.
The project is described in more detail in Chapter 2. The information generated is expected to support national planners, policy-makers, MRC programmes and research institutes in sustainably managing and developing water resources for the mutual benefit of the countries and the well-being of the people living in the basin. It is also expected to promote and facilitate the exchange and sharing of data among Member Countries, their line agencies and external users through the MRC Information System and Web Portal. The updated information is therefore an important asset to enhance GIS-based information to support studies related to land and natural resources by all MRC programmes.
Page 2
Land Cover Map of the Lower Mekong Basin
1.3 Definitions under the Land Cover Classification System
The Food and agricultural Organization of the United Nations (FaO) developed the Land Cover Classification System (LCCS) as part of an initiative towards an internationally agreed reference base for land cover. In 1996, an international working group endorsed the classification concepts which the FaO originally published together with a user manual in 1998 (Version 1). These concepts note that defining land cover is fundamental because many existing classifications and legends confuse it with land use. By 2010, Version 3 of the LCCS (FaO, 2000) was available for use in the IKMP project. Technical Committee 211 of the International Organisation for Standardisation (ISO/TC211) adopted this version as the ISO 19144 standard. ISO 19144 consists of two parts, the Classification System Structure and the Land Cover Classification System.
The LCCS definition states that land cover is the “observed (bio) physical cover on the earth's surface" and that "when considering land cover in a very pure and strict sense it should be confined to describe vegetation and man-made features. Consequently, areas where the surface consists of bare rock or bare soil are describing land itself rather than land cover. also, it is disputable whether water surfaces are real land cover. However, in practise, the scientific community usually describes those aspects under the term land cover."
The LCCS is designed with two main phases of classification. In the initial Dichotomous Phase, eight major land cover types are defined. In the second so-called Modular-Hierarchical Phase of classification, land cover classes are created by combining sets of pre-defined classifiers. These classifiers are tailored to each of the eight major land cover types. The tailoring allows the use of most appropriate classifiers to define land cover classes derived from the major land cover types and at the same time reduces the likelihood of impractical combinations of classifiers. (Figure 1). Three levels of distinction are differentiated.
Major Land Cover Types
• Cultivated and Managed Terrestrial areas• Natural and Semi-Natural Terrestrial Vegetation • Cultivated aquatic or Regularly Flooded areas • Natural and Semi-Natural aquatic or Regularly Flooded Vegetation • Artificial Surfaces and Associated Areas • Bare areas • Artificial Water Bodies, Snow and Ice • Natural Water Bodies, Snow and Ice

Page 3
Introduction
Figure 1: FaO Overview of the Land Cover Classification System, its Two Phases and Classifiers
Primarily Vegetated Areas Primarily Non-Vegetated Areas
Dichotom
ous PhaseM
odular-Hierarchical Phase
Aquatic or Regularly Flooded
Aquatic or Regularly Flooded Terrestrial Terrestrial
Cultivated and
Managed Terrestrial
areas
Artificial Surfaces and associated
areas
Life Form
Spacial aspects
Crop Combination
Cover-Related Cultural Practices
Land Form
Lithology/Soils
Climate
altitude Erosion Cover/density
Crop Type
Surface aspect
Land Form
Climate altitude
Built-Up Object
Physical Status
Persistence
depth Sediment Load
Climate altitude Vegetation
Salinity
Physical Status
Persistence
depth Sediment Load
Climate altitude Vegetation
Salinity
Surface aspect
Macropattern
Land Form Climate
altitude Erosion Vegetation
Soil Type/ Lithology
Life Form
Spacial aspects
Water Seasonality
Cover-Related Cultural Practices
Crop Combination
Land Form
Lithology/Soils
Climate
altitude Erosion Crop Cover
Crop Type
Life Form & Cover
Height
Water Seasonality
Leaf TypeLife Cycle
Leaf Phenology
Stratification
Land Form
Lithology/Soils
Climate
altitude Erosion Water Quality
Floristic aspect
Life Form & Cover
Height Special distribution
Leaf TypeLife Cycle
Leaf Phenology
Stratification
Land Form Lithology/Soils
Climate altitude Erosion
Floristic aspect
Cultivated aquatic or Regularly-Flooded areas
ArtificialWater Bodies,
Snow and Ice
Natural and
Semi-Natural Terrestrial Vegetation
Bare areas
Natural and Semi-Natural
aquatic or Regularly-Flooded
Vegetation
Natural Water Bodies,
Snow and Ice
Page 4
Land Cover Map of the Lower Mekong Basin
FIRST LEVEL OF dISTINCTIONThe initial phase of classification has three levels of distinction, with the first level dividing all land cover into primarily vegetated or non-vegetated areas.
Primarily Vegetated AreasThis class applies to areas that have a vegetative cover of at least 4% for at least two months of the year. This cover may consist of the life forms woody (trees, shrubs), herbaceous (forbs, Graminoids) or a combination of them, or consist of lichens/mosses (only when other life forms are absent). a separate cover condition exists for lichens/mosses that can be only applied if this life form contributes at least 25% to the total vegetative cover.
Primarily Non-Vegetated AreasThis class includes areas that have a total vegetative cover of less than 4% for more than 10 months of the year, or in the absence of woody or herbaceous life forms less than 25% cover of lichens/mosses.
SECONd LEVEL OF dISTINCTIONThe second level of distinction divides the vegetated and non-vegetated areas into terrestrial and aquatic areas (including areas that are regularly flooded).
Terrestrial Primarily Vegetated AreasThe vegetation is influenced by the edaphic substratum.
Terrestrial Primarily Non-Vegetated AreasThe cover is influenced by the edaphic substratum.
Aquatic or Regularly Flooded Primarily Vegetated AreasThe environment is significantly influenced by the presence of water over extensive periods of time. The water is the dominant factor determining natural soil development and the type of plant communities living on its surface. It includes marshes, swamps, bogs and all areas where water is present for a substantial period regularly every year. This class includes floating vegetation.
Aquatic or Regularly Flooded Primarily Non-Vegetated Areas The environment is significantly influenced by the presence of water over an extensive period of time each year.
THIRd LEVEL OF dISTINCTIONThe third level of distinction further divides these four types into the eight major land cover types mentioned above. The four types of primarily vegetated areas and four types of primarily non-vegetated areas are defined below.
Cultivated and Managed Terrestrial AreasThis class refers to areas where the natural vegetation has been removed or modified and replaced by other types of vegetative cover of anthropogenic origin. This vegetation is artificial and requires

Page 5
Introduction
human activities to maintain it in the long term. In between the human activities, or before starting crop cultivation, the surface can be temporarily without vegetative cover. Its seasonal phenological appearance can be regularly modified by humans (e.g. tillage, harvest and irrigation). All vegetation that is planted or cultivated with an intent to harvest is included in this class (e.g. wheat fields, orchards, rubber and teak plantations).
Natural and Semi-Natural VegetationNatural vegetated areas are defined as areas where the vegetative cover is in balance with the abiotic and biotic forces of its biotope. Semi-natural vegetation is defined as vegetation not planted by humans but influenced by human actions. These may result from grazing, possibly overgrazing the
Problems with previous classification system
The initiative to develop the new classification system dates back to 1993 when the United Nations Environment Programme (UNEP) and the FAO took the first step towards an internationally agreed reference base for land cover and land use. at the time, the FaO needed a reference system for a project to map land cover across Africa. When the new classification concepts were published in 1998, the FaO highlighted the problems with previous systems.
Some of these systems were limited to classifying vegetation, broad land cover or specific features such as agricultural areas. Many had been developed for a certain purpose, at a certain scale and using a certain data type, such as the data set based on the National Oceanic and atmospheric administration – advanced Very High Resolution Radiometer (NOaa-aVHRR). Hence the derived classes were strictly dependent on the means used (only classes that could be detected using NOaa, for example).
Many systems were also not suitable for mapping and subsequent monitoring. diagnostic criteria and their hierarchical arrangement were very often in conflict with the ability to define a clear boundary between two classes. For monitoring, changes in land cover could involve conversion from one category to another, such as from forest to grassland, or modification within a category such as from cultivated area to intensively cultivated area. Broader and fewer categories of land cover meant fewer conversions from one to another. If they were as broad as “forest and woodland”, “arable land” and “permanent meadows and pastures” (from the FAO Production Yearbook), developments such as forest fragmentation, a shift from rainfed to irrigated cultivated areas and less dense grass cover due to overgrazing would register neither as conversion nor as modification. A multi-user-oriented classification system should capture both.
The FaO publication noted that "people have reshaped the earth continually but the present magnitude and rate are unprecedented. Nowadays it is realized that it is very important to know how land cover has changed over time, in order to make assessments of the changes one could expect in the (near) future and the impact these changes will have on peoples’ lives. as people are the main users of the land, it is important for any system to be oriented towards them."

Page 6
Land Cover Map of the Lower Mekong Basin
natural phytocenoses, or else from practices such as selective logging in a natural forest whereby the floristic composition has been changed. Previously cultivated areas which have been abandoned and where vegetation is regenerating are also included. The secondary vegetation developing during the fallow period of shifting cultivation is a further example. The human disturbance may be deliberate or inadvertent. Hence semi-natural vegetation includes vegetation due to human influences but which has recovered to such an extent that species composition and environmental and ecological processes are indistinguishable from, or in a process of achieving, its undisturbed state. The vegetative cover is not artificial and it does not require human activities to be maintained in the long term.
Cultivated Aquatic or Regularly Flooded AreasThis class includes areas where an aquatic crop is purposely planted, cultivated and harvested, and which is standing in water over extensive periods during its cultivation period (e.g. paddy rice, tidal rice and deepwater rice). In general, it is the emerging part of the plant that is fully or partly harvested. Other plants (e.g. for purification of water) are free-floating. They are not harvested but they are maintained. This class excludes irrigated cultivated areas.
Natural and Semi-Natural Aquatic or Regularly Flooded VegetationThis class describes areas which are transitional between pure terrestrial and aquatic systems and where the water table is usually at or near the surface, or the land is covered by shallow water. The predominant vegetation, at least periodically, comprises hydrophytes. Marshes, swamps, bogs or flats where drastic fluctuations in water level or high concentration of salts may prevent the growth of hydrophytes are all part of this class. The vegetative cover is significantly influenced by water and dependent on flooding (e.g. mangroves, marshes, swamps and aquatic beds). Occasionally-flooded vegetation within a terrestrial environment is not included in this class. Natural Vegetated Aquatic habitats are defined as biotopes where the vegetative cover is in balance with the influence of biotic and abiotic forces. Semi-Natural Aquatic vegetation is defined as vegetation that is not planted by humans but which is influenced directly by human activities that are undertaken for other, unrelated purposes. Human activities (e.g. urbanisation, mining and agriculture) may influence abiotic factors (e.g. water quality), affecting species composition. Furthermore, this class includes vegetation that developed due to human activities but which has recovered to such an extent that it is indistinguishable from its former state, or which has built up a new biotope which is in balance with the present environmental conditions. a distinction between Natural and Semi-Natural aquatic Vegetation is not always possible because human activities distant to the habitat may create chain reactions which ultimately disturb the aquatic vegetative cover. Human activities may also take place deliberately to compensate for effects as noted above with the aim of keeping a "natural" state.
Artificial Surfaces and Associated Areas This class describes areas that have an artificial cover as a result of human activities such as construction (e.g. cities, towns and transportation), extraction (e.g. open mines and quarries) or waste disposal. Bare Areas This class describes areas that do not have an artificial cover as a result of human activities. These areas include areas with less than 4% vegetative cover. Included are bare rock areas, sands and deserts.
Page 7
Introduction
Artificial Waterbodies, Snow and Ice This class applies to areas that are covered by water due to the construction of artefacts such as reservoirs, canals, artificial lakes, etc. Without these, the area would not be covered by water, snow or ice.
Natural Waterbodies, Snow and Ice This class refers to areas that are naturally covered by water, such as lakes, rivers, snow or ice. In the case of rivers, the lack of vegetation cover is often due to high flow rates and/or steep banks. In the case of lakes, their geological origin affects the life conditions for aquatic vegetation. The following circumstances might cause water surfaces to be without vegetation cover: depth, rocky basins, rocky and/or steep shorelines, infertile washed-in material, hard and coarse substrates.
Since developing the Land Cover Classification System, the FAO established the Global Land Cover Network (GLCN) with the United Nations Environment Programme (UNEP) in 2004 and published Version 2 of the LCCS software in 2005.
This report on the Land Cover Map of the Lower Mekong Basin in 2010 uses 19 classes of land cover derived from Version 3 of the LCCS software, which was last updated in 2009: These 19 classes of land cover in the Lower Mekong Basin are defined in Table 1 of this report.
Classes used in this report
• annual Crop• Paddy Rice• Shifting Cultivation• Orchard• Flooded Forest• Grassland• Shrubland• Urban area• Bare Soil• Industrial Plantation• Broadleaved deciduous Forest• Broadleaved Evergreen Forest• Forest Plantation• Bamboo Forest• Coniferous Forest• Mangrove• Marsh/Swamp area• aquaculture• Water Body

Page 8
Land Cover Map of the Lower Mekong Basin

Page 9
.
2 Project description
2.1 description
The Project to Update the Land Cover Map of the Lower Mekong Basin for 2010 was designed to produce three data sets based on 19 types of single-class land cover based on the FaO Land Cover Classification System (Table 1). This required the purchase of 57 time-series Landsat 5 Thematic Mapper images for the four Member Countries of the MRC.
To ensure the quality and reliability of the land cover classification, ground truthing was conducted. Field data collection was designed to focus on hot-spot areas (55% percent) and non-hot spot areas (45%).
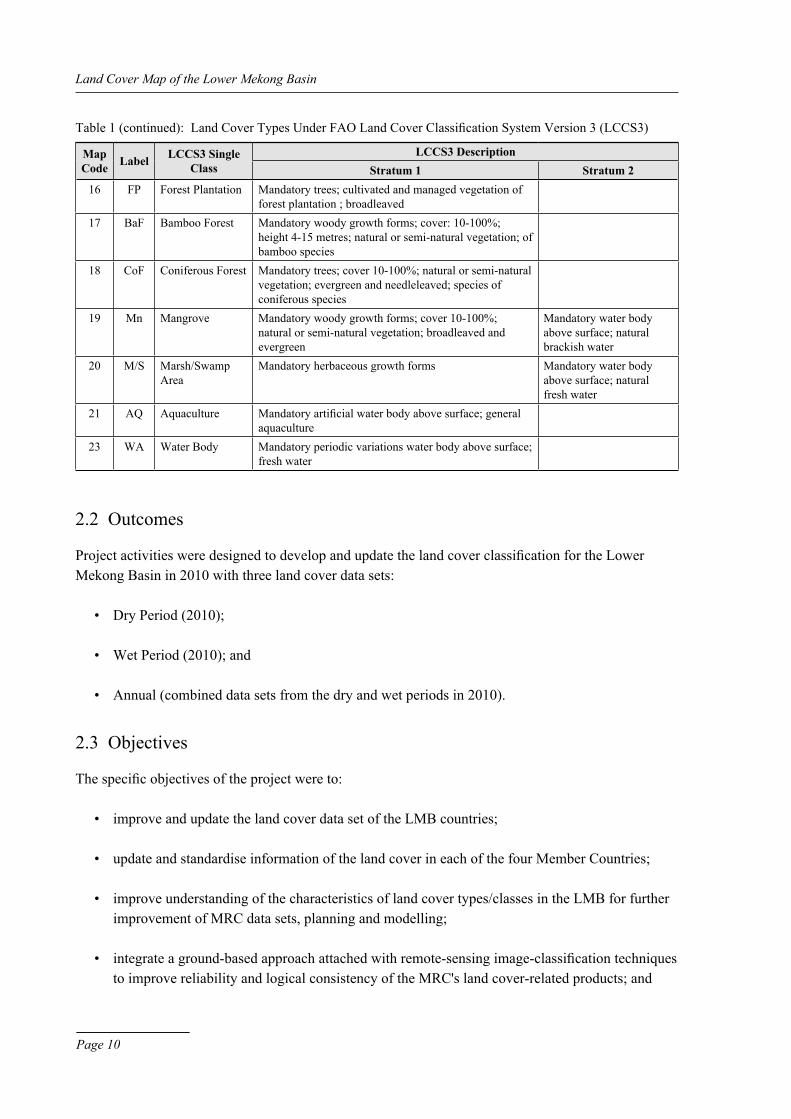
Table 1: Land Cover Types Under FAO Land Cover Classification System Version 3 (LCCS3)
MapCode Label LCCS3 Single
ClassLCCS3 Description
Stratum 1 Stratum 24 aG annual Crop Mandatory herbaceous growth forms; cultivated and
managed vegetation
5 PR Paddy Rice Mandatory Graminae (true grasses); cultivated and managed vegetation with field size 0.2-2.0 hectares; species of rice
Mandatory water body above surface; fresh water
6 SC Shifting Cultivation
Temporary sequence between herbaceous growth forms of cultivated and managed vegetation and woody growth forms of natural/semi-natural vegetation; sequency length 3 to 7 years
7 Or Orchard Mandatory trees; cultivated and managed vegetation of orchard and other plantation; field size 1-3 hectares
8 FF Flooded Forest Multi-stratum of mandatory trees/shrubs/herbaceous; natural or semi-natural vegetation; cover 10-100%.
Mandatory water body above surface; fresh water
9 GR Grassland Mandatory herbaceous growth forms; natural or semi-natural vegetation; cover 10-100 %
Mandatory woody growth forms; natural or semi-natural vegetation; cover 1-10 %
10 SH Shrubland Mandatory shrubs; natural or semi-natural vegetation; cover 10-80 %
11 Ua Urban area Mandatory built-up surface 12 BS Bare Soil Mandatory bare soil; optional coarse mineral fragments
(rocks/stones 1-40%)Optional shrubs (1-5%) or herbaceous growth forms (1-10%); natural or semi-natural vegetation
13 IP Industrial Plantation
Mandatory woody growth form; cultivated and managed vegetation of orchards and other plantations; industrial crop species
14 Bd Broadleaved deciduous Forest
Mandatory trees; cover 10-100%; natural or semi-natural vegetation; deciduous and broadleaved
15 BE Broadleaved Evergreen Forest
Mandatory trees; cover 10-100%; natural or semi-natural vegetation; evergreen
Page 10
Land Cover Map of the Lower Mekong Basin
MapCode Label LCCS3 Single
ClassLCCS3 Description
Stratum 1 Stratum 216 FP Forest Plantation Mandatory trees; cultivated and managed vegetation of
forest plantation ; broadleaved
17 BaF Bamboo Forest Mandatory woody growth forms; cover: 10-100%; height 4-15 metres; natural or semi-natural vegetation; of bamboo species
18 CoF Coniferous Forest Mandatory trees; cover 10-100%; natural or semi-natural vegetation; evergreen and needleleaved; species of coniferous species
19 Mn Mangrove Mandatory woody growth forms; cover 10-100%; natural or semi-natural vegetation; broadleaved and evergreen
Mandatory water body above surface; natural brackish water
20 M/S Marsh/Swamp area
Mandatory herbaceous growth forms Mandatory water body above surface; natural fresh water
21 aQ aquaculture Mandatory artificial water body above surface; general aquaculture
23 Wa Water Body Mandatory periodic variations water body above surface; fresh water
2.2 Outcomes
Project activities were designed to develop and update the land cover classification for the Lower Mekong Basin in 2010 with three land cover data sets:
• Dry Period (2010);
• Wet Period (2010); and
• Annual (combined data sets from the dry and wet periods in 2010).
2.3 Objectives
The specific objectives of the project were to:
• improve and update the land cover data set of the LMB countries;
• update and standardise information of the land cover in each of the four Member Countries;
• improve understanding of the characteristics of land cover types/classes in the LMB for further improvement of MRC data sets, planning and modelling;
• integrate a ground-based approach attached with remote-sensing image-classification techniques to improve reliability and logical consistency of the MRC's land cover-related products; and
Table 1 (continued): Land Cover Types Under FAO Land Cover Classification System Version 3 (LCCS3)

Page 11
Project Description
• ensure land cover products are quality controlled and assured, stored, catalogued and made available to data users.
2.4 Scope and Limitation
The following scopes and limitations were inherent to the project:
• Due to budget limitations, the project used Landsat 5 Thematic Mapper images with 30 metres spatial resolution.
• Information on the 19 land cover types had similar limitations to the ground survey points and satellite image spectral resolution.
• Land cover maps are to be used at a scale of 1:50,000 or lower.
2.5 Outputs
The project was designed with three outputs:
• Output 1: Development and update of the land cover classification for 2010 with:
- a proposal for 2010 land cover classification developed;
- communication and dialogue on land cover map production between regional and national IKMP units improved;
- satellite images made available and quality assured;
- capacity of staff members at national IKMP units improved; and
- land cover data sets for 2010 generated.
• Output 2: Establishment of a land cover classification information catalogue based on field data collection information and reports.
• Output 3: Improvement in the capacity of the MRC Information System (MRC-IS).
2.6 Methodology
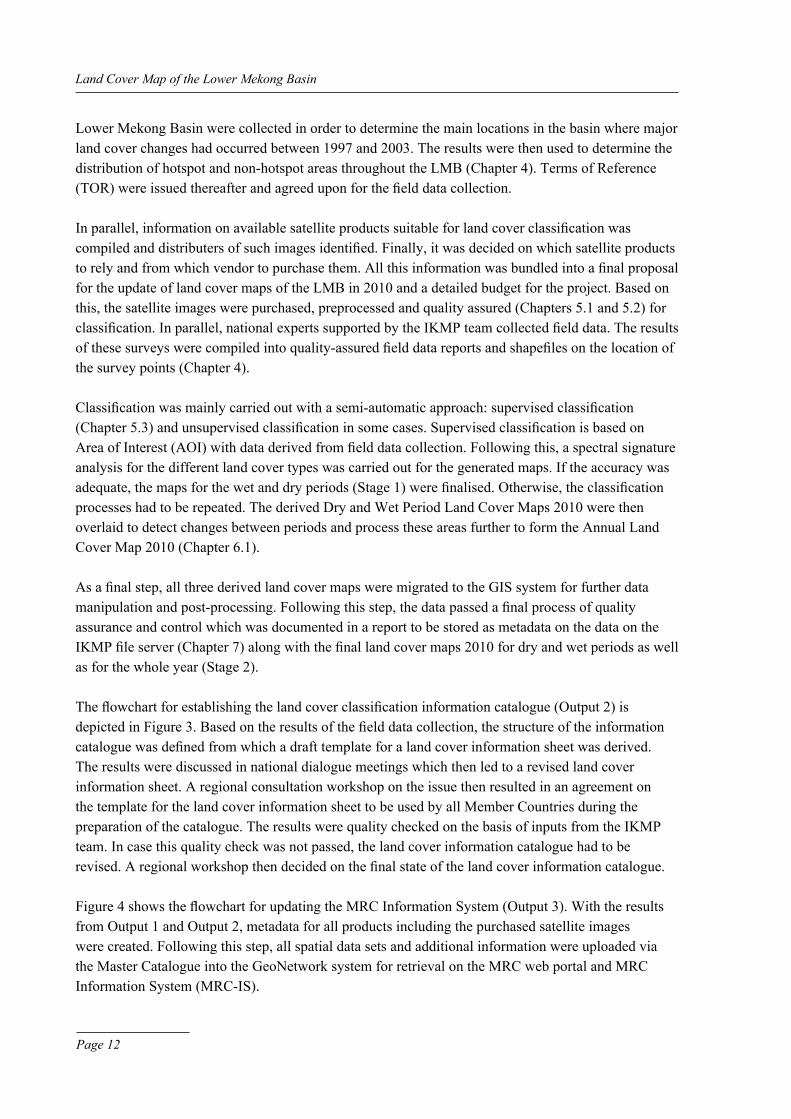
Figure 2 depicts the flow chart to determine the land cover maps 2010 (Output 1). The concept is based on two almost parallel lines of activities. Existing land cover maps and satellite images from the
Page 12
Land Cover Map of the Lower Mekong Basin
Lower Mekong Basin were collected in order to determine the main locations in the basin where major land cover changes had occurred between 1997 and 2003. The results were then used to determine the distribution of hotspot and non-hotspot areas throughout the LMB (Chapter 4). Terms of Reference (TOR) were issued thereafter and agreed upon for the field data collection.
In parallel, information on available satellite products suitable for land cover classification was compiled and distributers of such images identified. Finally, it was decided on which satellite products to rely and from which vendor to purchase them. All this information was bundled into a final proposal for the update of land cover maps of the LMB in 2010 and a detailed budget for the project. Based on this, the satellite images were purchased, preprocessed and quality assured (Chapters 5.1 and 5.2) for classification. In parallel, national experts supported by the IKMP team collected field data. The results of these surveys were compiled into quality-assured field data reports and shapefiles on the location of the survey points (Chapter 4).
Classification was mainly carried out with a semi-automatic approach: supervised classification (Chapter 5.3) and unsupervised classification in some cases. Supervised classification is based on Area of Interest (AOI) with data derived from field data collection. Following this, a spectral signature analysis for the different land cover types was carried out for the generated maps. If the accuracy was adequate, the maps for the wet and dry periods (Stage 1) were finalised. Otherwise, the classification processes had to be repeated. The derived dry and Wet Period Land Cover Maps 2010 were then overlaid to detect changes between periods and process these areas further to form the annual Land Cover Map 2010 (Chapter 6.1).
As a final step, all three derived land cover maps were migrated to the GIS system for further data manipulation and post-processing. Following this step, the data passed a final process of quality assurance and control which was documented in a report to be stored as metadata on the data on the IKMP file server (Chapter 7) along with the final land cover maps 2010 for dry and wet periods as well as for the whole year (Stage 2).
The flowchart for establishing the land cover classification information catalogue (Output 2) is depicted in Figure 3. Based on the results of the field data collection, the structure of the information catalogue was defined from which a draft template for a land cover information sheet was derived. The results were discussed in national dialogue meetings which then led to a revised land cover information sheet. a regional consultation workshop on the issue then resulted in an agreement on the template for the land cover information sheet to be used by all Member Countries during the preparation of the catalogue. The results were quality checked on the basis of inputs from the IKMP team. In case this quality check was not passed, the land cover information catalogue had to be revised. A regional workshop then decided on the final state of the land cover information catalogue.
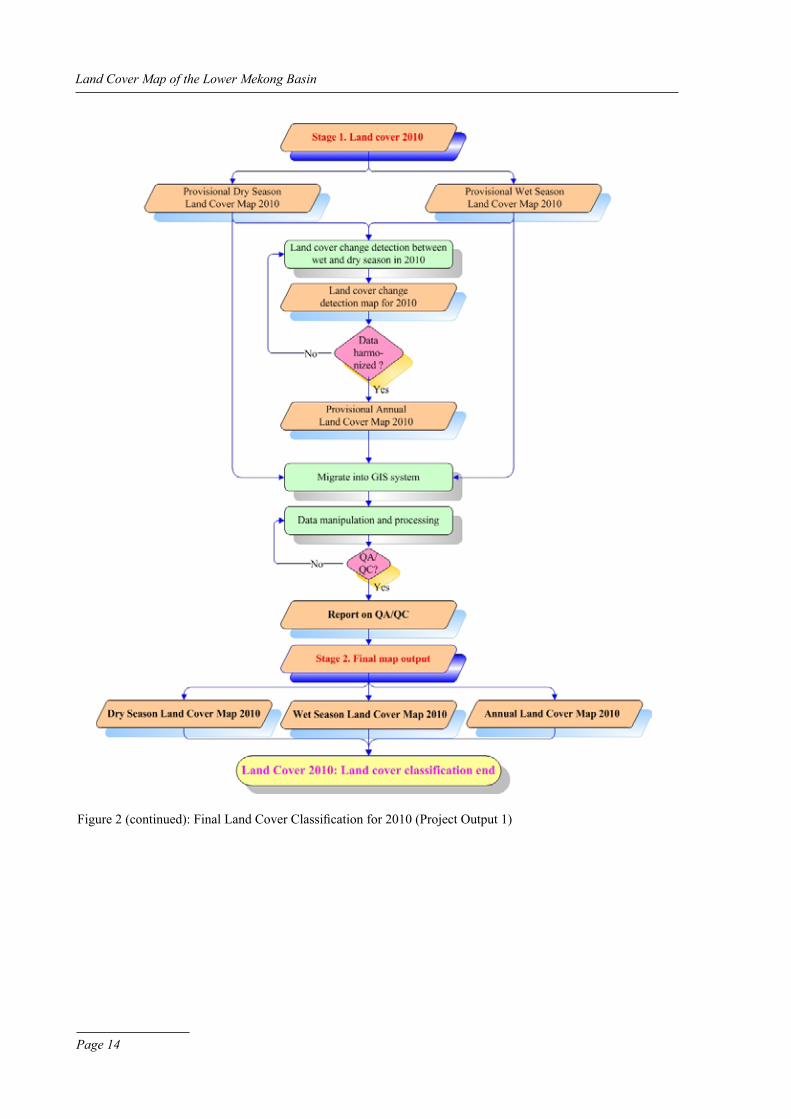
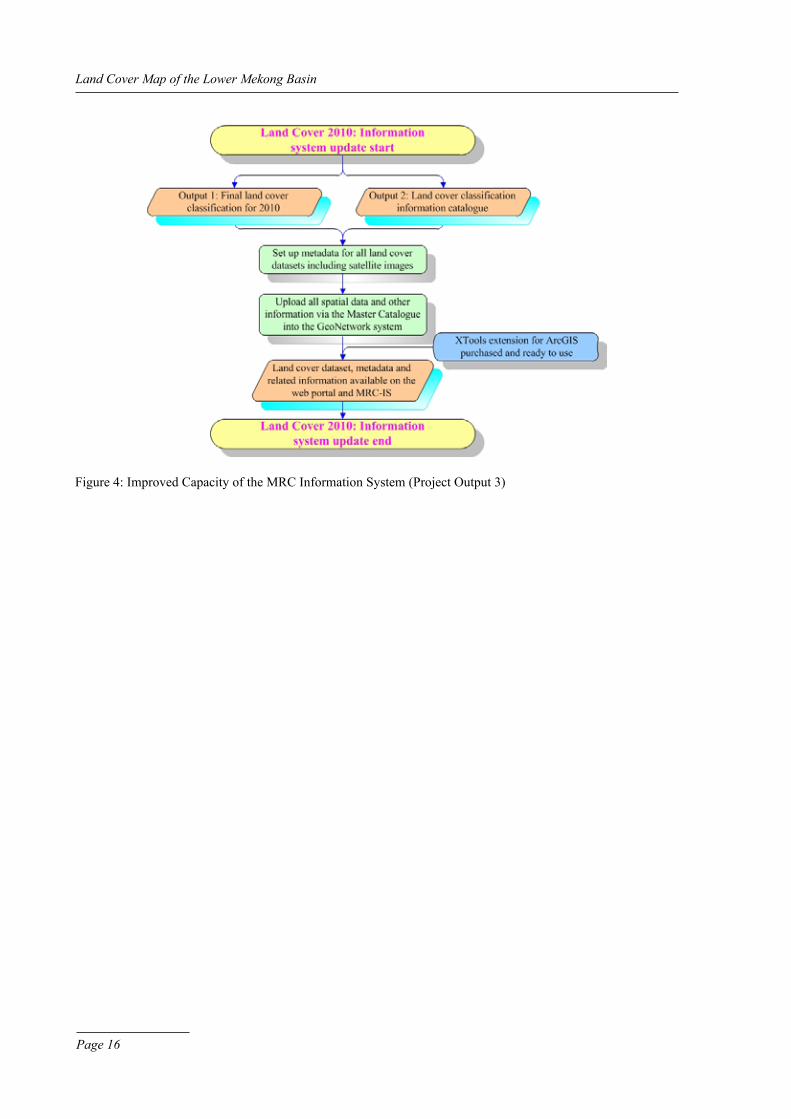
Figure 4 shows the flowchart for updating the MRC Information System (Output 3). With the results from Output 1 and Output 2, metadata for all products including the purchased satellite images were created. Following this step, all spatial data sets and additional information were uploaded via the Master Catalogue into the GeoNetwork system for retrieval on the MRC web portal and MRC Information System (MRC-IS).

Page 13
Project Description
Figure 2: Final Land Cover Classification for 2010 (Project Output 1)
Page 14
Land Cover Map of the Lower Mekong Basin
Figure 2 (continued): Final Land Cover Classification for 2010 (Project Output 1)

Page 15
Project Description
Figure 3: Land Cover Classification Information Catalogue (Project Output 2)
Page 16
Land Cover Map of the Lower Mekong Basin
Figure 4: Improved Capacity of the MRC Information System (Project Output 3)
Page 17
3 Study area
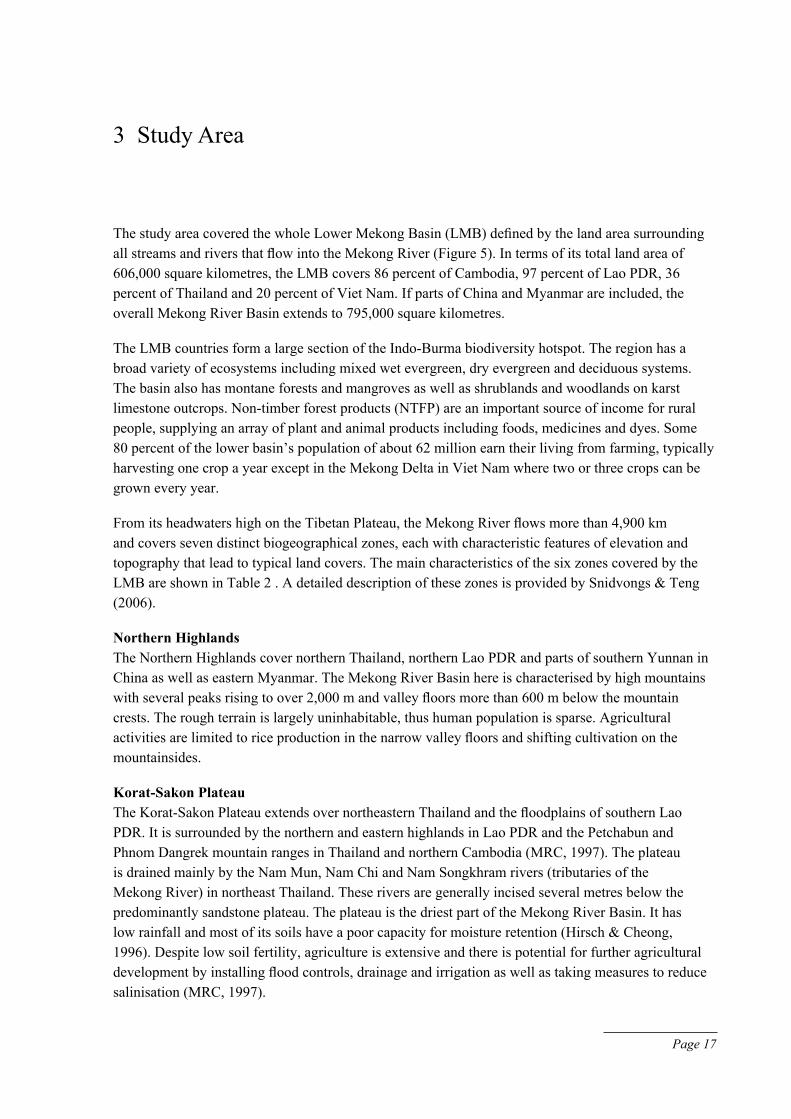
The study area covered the whole Lower Mekong Basin (LMB) defined by the land area surrounding all streams and rivers that flow into the Mekong River (Figure 5). In terms of its total land area of 606,000 square kilometres, the LMB covers 86 percent of Cambodia, 97 percent of Lao PdR, 36 percent of Thailand and 20 percent of Viet Nam. If parts of China and Myanmar are included, the overall Mekong River Basin extends to 795,000 square kilometres.
The LMB countries form a large section of the Indo-Burma biodiversity hotspot. The region has a broad variety of ecosystems including mixed wet evergreen, dry evergreen and deciduous systems. The basin also has montane forests and mangroves as well as shrublands and woodlands on karst limestone outcrops. Non-timber forest products (NTFP) are an important source of income for rural people, supplying an array of plant and animal products including foods, medicines and dyes. Some 80 percent of the lower basin’s population of about 62 million earn their living from farming, typically harvesting one crop a year except in the Mekong delta in Viet Nam where two or three crops can be grown every year.
From its headwaters high on the Tibetan Plateau, the Mekong River flows more than 4,900 km and covers seven distinct biogeographical zones, each with characteristic features of elevation and topography that lead to typical land covers. The main characteristics of the six zones covered by the LMB are shown in Table 2 . a detailed description of these zones is provided by Snidvongs & Teng (2006).
Northern HighlandsThe Northern Highlands cover northern Thailand, northern Lao PdR and parts of southern Yunnan in China as well as eastern Myanmar. The Mekong River Basin here is characterised by high mountains with several peaks rising to over 2,000 m and valley floors more than 600 m below the mountain crests. The rough terrain is largely uninhabitable, thus human population is sparse. agricultural activities are limited to rice production in the narrow valley floors and shifting cultivation on the mountainsides.
Korat-Sakon Plateau The Korat-Sakon Plateau extends over northeastern Thailand and the floodplains of southern Lao PdR. It is surrounded by the northern and eastern highlands in Lao PdR and the Petchabun and Phnom dangrek mountain ranges in Thailand and northern Cambodia (MRC, 1997). The plateau is drained mainly by the Nam Mun, Nam Chi and Nam Songkhram rivers (tributaries of the Mekong River) in northeast Thailand. These rivers are generally incised several metres below the predominantly sandstone plateau. The plateau is the driest part of the Mekong River Basin. It has low rainfall and most of its soils have a poor capacity for moisture retention (Hirsch & Cheong, 1996). despite low soil fertility, agriculture is extensive and there is potential for further agricultural development by installing flood controls, drainage and irrigation as well as taking measures to reduce salinisation (MRC, 1997).

Page 18
Land Cover Map of the Lower Mekong Basin
Figure 5: Study area (Landform Zones in the LMB)
Source: MRC, 1997
Page 19
Study Area
Eastern HighlandsThe Eastern Highlands cover the mountain ranges extending over eastern Lao PdR, central Viet Nam and northeast Cambodia, spanning an area of approximately 300 km long and 50 km wide (Hirsch & Cheong, 1996; MRC, 1997). Networks of tributary rivers draining the highlands are numerous. The large ones are the Nam Cadinh, Se Bang Fai, Se Bang Hieng, Se Kong, Se San and Sre Pok. Rainfall is the highest in the Mekong River Basin with its tributaries contributing about two-fifths of the total water volume in the Mekong River (Hirsch & Cheong, 1996). It is the most heavily forested area of the entire basin and rich in biodiversity. Rotational farming is the commonest crop production method practised by a wide range of indigenous communities in this area (Evans, 1992).
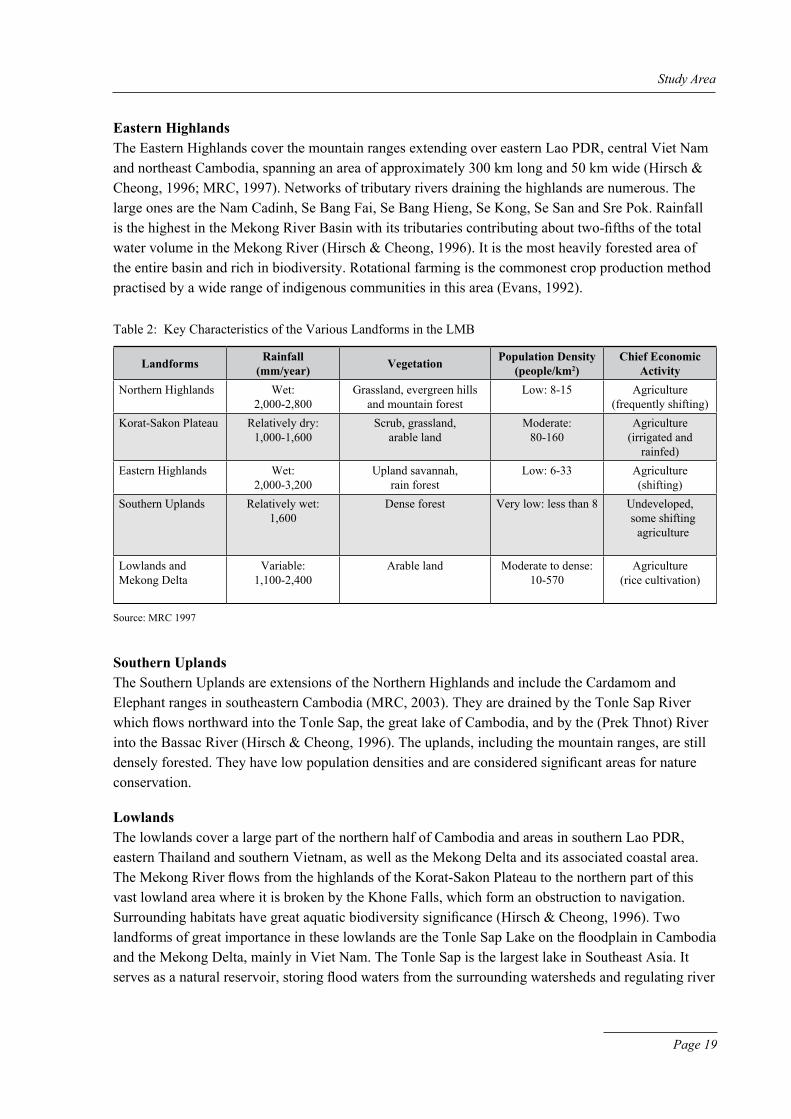
Table 2: Key Characteristics of the Various Landforms in the LMB
Landforms Rainfall(mm/year) Vegetation Population Density
(people/km2)Chief Economic
ActivityNorthern Highlands Wet:
2,000-2,800Grassland, evergreen hills
and mountain forestLow: 8-15 agriculture
(frequently shifting)Korat-Sakon Plateau Relatively dry:
1,000-1,600Scrub, grassland,
arable landModerate:
80-160agriculture
(irrigated and rainfed)
Eastern Highlands Wet:2,000-3,200
Upland savannah, rain forest
Low: 6-33 agriculture (shifting)
Southern Uplands Relatively wet:1,600
dense forest Very low: less than 8 Undeveloped, some shifting
agriculture
Lowlands and Mekong delta
Variable:1,100-2,400
arable land Moderate to dense:10-570
agriculture (rice cultivation)
Source: MRC 1997
Southern UplandsThe Southern Uplands are extensions of the Northern Highlands and include the Cardamom and Elephant ranges in southeastern Cambodia (MRC, 2003). They are drained by the Tonle Sap River which flows northward into the Tonle Sap, the great lake of Cambodia, and by the (Prek Thnot) River into the Bassac River (Hirsch & Cheong, 1996). The uplands, including the mountain ranges, are still densely forested. They have low population densities and are considered significant areas for nature conservation.
LowlandsThe lowlands cover a large part of the northern half of Cambodia and areas in southern Lao PdR, eastern Thailand and southern Vietnam, as well as the Mekong delta and its associated coastal area. The Mekong River flows from the highlands of the Korat-Sakon Plateau to the northern part of this vast lowland area where it is broken by the Khone Falls, which form an obstruction to navigation. Surrounding habitats have great aquatic biodiversity significance (Hirsch & Cheong, 1996). Two landforms of great importance in these lowlands are the Tonle Sap Lake on the floodplain in Cambodia and the Mekong delta, mainly in Viet Nam. The Tonle Sap is the largest lake in Southeast asia. It serves as a natural reservoir, storing flood waters from the surrounding watersheds and regulating river
Page 20
Land Cover Map of the Lower Mekong Basin
flows in the dry period, thus helping to relieve droughts in southern Cambodia and the Mekong Delta (MRC, 2003). The lake’s area can increase from 250,000 ha to 300,000 ha in the dry period to as much as 1.3 million ha in the wet period (MRC,1997; MRC, 2003).
Mekong DeltaThe Mekong delta is a triangular area at the southern tip of the lowlands. It covers around 49,520 km2 with 74 percent of this area in Viet Nam and the rest in Cambodia (MRC, 1997). The delta is historically the most densely populated area of the LMB with large areas of fertile agricultural lands (Snidvongs et al., 2003). It can be divided into three sections: upper, middle and lower. The upper section has strong natural levees – embankments built on either side of the river by accumulated deposits of silt. Behind the levees are wide depressions. The middle section includes well-drained arable land and poorly drained areas. The lower section is formed by the river distributaries and their associated sediments (Tuvy, 2015). The coastline along the delta is around 650 km in length of which around 350 km borders the South China Sea and the remaining 300 km flanks the Gulf of Thailand (MRC, 1997). The coastal area is characterised by large estuaries, sand dunes, tidal marshes and mangrove forest (MRC, 1997).

Page 21
4 Field Survey data Collection
4.1 Objective
In the framework of updating the land cover map for 2010, MRCS/IKMP cooperated with Member Countries in the Lower Mekong Basin to collect land cover field data. Field surveys updated data and information on land cover types and their characteristics at 9,357 points in 703 areas across the basin. Results of the field surveys have been generated into Member Country reports (Annex 2). The reports reflect knowledge and understanding of the distribution, ecological functioning and conservation at each location and also contain summaries of background information available for each point. Land cover description cards for the 9,357 points are stored on the IKMP Server for internal users and are accessible through the data portal of the MRC website.
The overall objective of collecting field data for the project was to provide good baseline information for producing updated and qualified land cover data sets and land cover information for the Lower Mekong Basin. Specific objectives included an improved understanding of the characteristics of the land cover types or classes in the basin.
4.2 Methodology and Tools
The number of ground-reference test samples to be used to access the accuracy of individual categories in a remote sensing classification map is a very important consideration (Jensen 2005). Various analytical methods and rules of thumb for determining the sample size are discussed in the literature. Hereafter, examples for probability theory-based sample determination and empirical methods for determining sample sizes will be given.
Fitzpatrick-Lins (1981) proposes to determine the sample size by a binominal method:
Z2 × p × (100 – p)N = (Eq. 1) E2
Where,
N required sample size;
Z z-score of a certain probability;
E allowable error in percent; and
p expected accuracy in percent.
Page 22
Land Cover Map of the Lower Mekong Basin
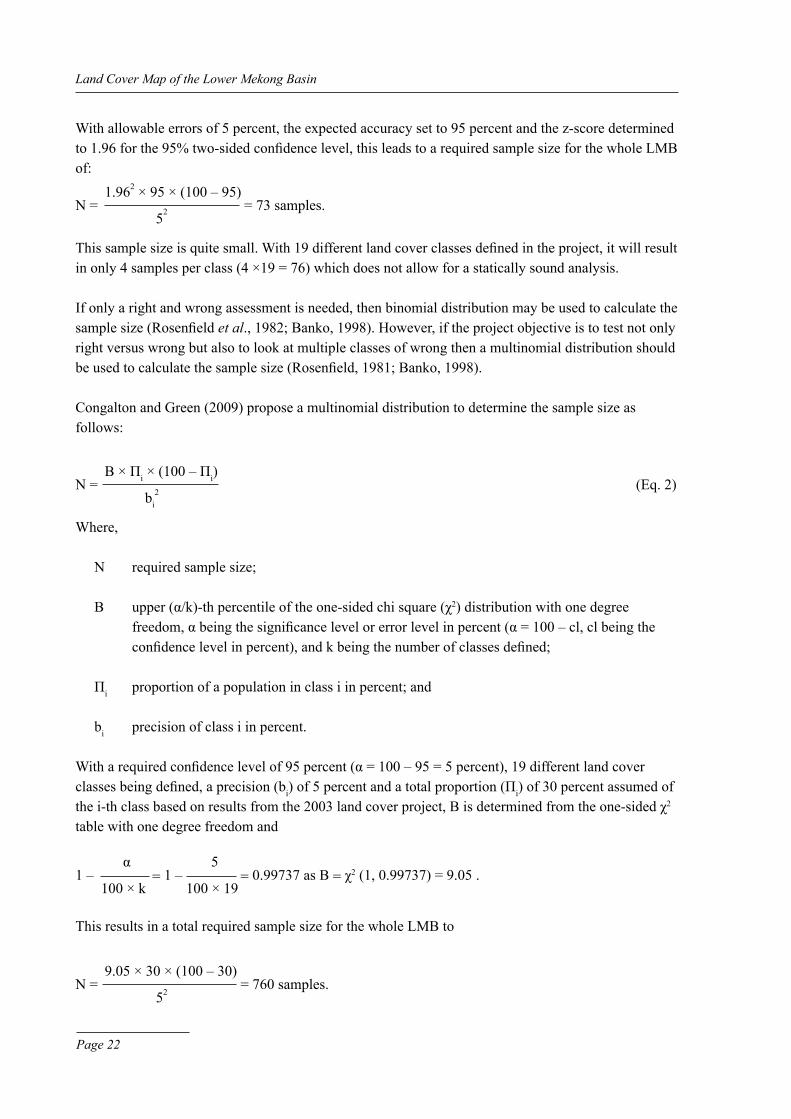
With allowable errors of 5 percent, the expected accuracy set to 95 percent and the z-score determined to 1.96 for the 95% two-sided confidence level, this leads to a required sample size for the whole LMB of: 1.962 × 95 × (100 – 95)N = = 73 samples. 52
This sample size is quite small. With 19 different land cover classes defined in the project, it will result in only 4 samples per class (4 ×19 = 76) which does not allow for a statically sound analysis.
If only a right and wrong assessment is needed, then binomial distribution may be used to calculate the sample size (Rosenfield et al., 1982; Banko, 1998). However, if the project objective is to test not only right versus wrong but also to look at multiple classes of wrong then a multinomial distribution should be used to calculate the sample size (Rosenfield, 1981; Banko, 1998).
Congalton and Green (2009) propose a multinomial distribution to determine the sample size as follows:
B × Πi × (100 – Πi)N = (Eq. 2) bi
2
Where,
N required sample size;
B upper (α/k)-th percentile of the one-sided chi square (χ2) distribution with one degree freedom, α being the significance level or error level in percent (α = 100 – cl, cl being the confidence level in percent), and k being the number of classes defined;
Πi proportion of a population in class i in percent; and
bi precision of class i in percent.
With a required confidence level of 95 percent (α = 100 – 95 = 5 percent), 19 different land cover classes being defined, a precision (bi) of 5 percent and a total proportion (Πi) of 30 percent assumed of the i-th class based on results from the 2003 land cover project, B is determined from the one-sided χ2 table with one degree freedom and
α 51 – = 1 – = 0.99737 as B = χ2 (1, 0.99737) = 9.05 . 100 × k 100 × 19
This results in a total required sample size for the whole LMB to
9.05 × 30 × (100 – 30)N = = 760 samples. 52

Page 23
Field Survey Data Collection
With 19 different land cover classes defined in the project, this gives 46 samples per class (40 × 19 = 760).
Congalton (1991) recommends as a rule of thumb at least 50 samples per class. If the area exceeds 500 km2 (the area of the LMB covers 624,665 km2) or the number of defined land cover classes is bigger than then 12 (19 classes were defined in the LMB Land Cover Update project), then at least 75 per class should be taken. These recommendations coincide with those recommended by Hay (1979) and Fenstermaker (1991). The number of samples for each category might have to be adjusted based on the relative importance of this particular class within the study area. Furthermore, sampling might be allocated with respect to the variability within each class (Congalton, 1991; Banko, 1998). according to the above recommendations, at least 1,425 samples should be taken.
after carrying out these calculations, it was decided to sample at 703 grids which are randomly distributed over the LMB; each grid covers a 3 km × 3 km area. Within each grid 20 points were aimed for sampling (randomized cluster sampling). All 19 land cover types defined as shown in Table 1 were covered by the samples. This approach would have resulted in 14,060 samples for the whole LMB. However, the targeted sample size was reduced to 10,575 (Table 3) resulting in a total number of 9,357 samples collected in the field.
Data collection mainly focused on hotspots (areas with changes in land cover of high significance), which accounted for 55 percent of all points. Non-hotspot areas (those with changes in land cover of low significance) accounted for the remaining 45 percent. Data were collected in each of the Member Countries by national field data collection and land cover experts. The experts were responsible for data quality assurance and reported to IKMP for final approval. As data were being collected, a remote-sensing specialist conducted two field missions in each country.
4.3 Processing for LMB
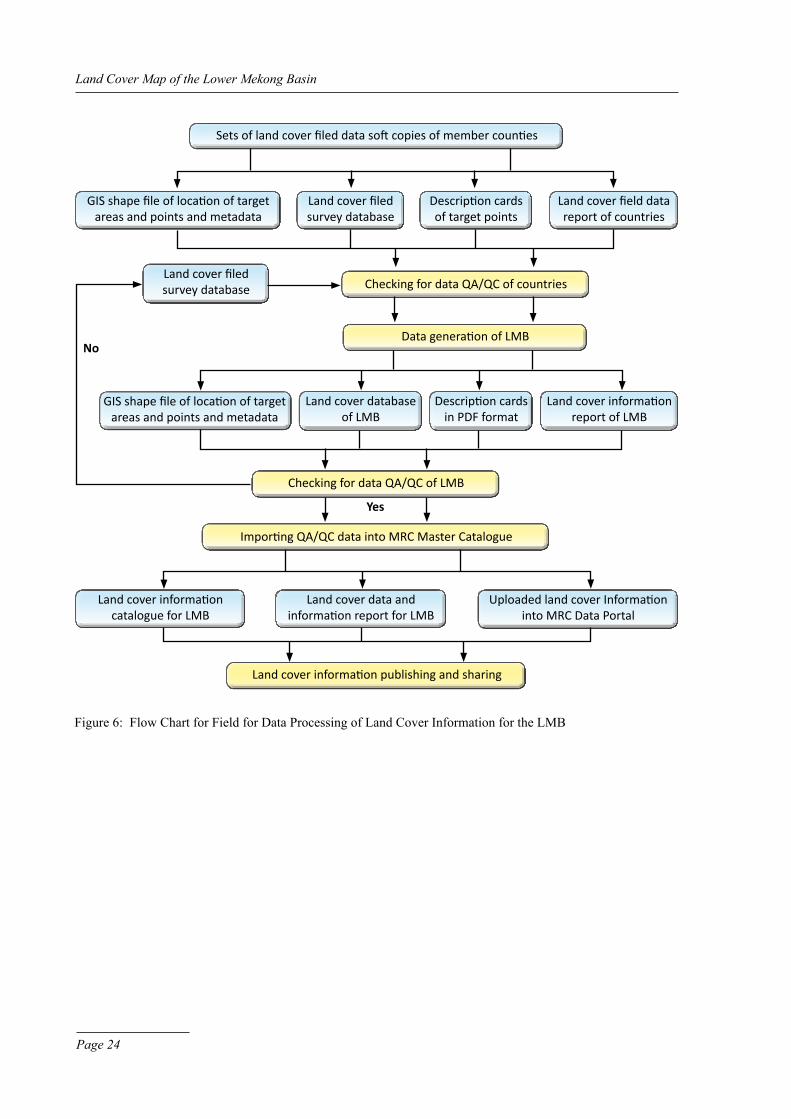
Land cover information for the LMB was generated from data and field surveys implemented by Member Countries. The processing of the data and information is depicted in Figure 6. To generate description cards in the field, national survey teams observed and described survey outputs, including GIS data sets of locations of target points, in terms of characteristics such as the type and spatial distribution of land cover. Two remaining outputs, a database and a survey report, were prepared after the field surveys as the data were being generated and checked.
Member Countries provided data and information to the IKMP team to generate data and information for the LMB. as part of standard IKMP procedures, the data and information for the basin was subject to Qa/QC processes with reference to the database for cross checking.
The set of LMB land cover information completed for uploading to the MRC data Portal comprised (i) the land cover information report, (ii) the land cover information database, (iii) land cover description cards and (iv) the GIS data sets of the location of target points.
Page 24
Land Cover Map of the Lower Mekong Basin
Figure 6: Flow Chart for Field for data Processing of Land Cover Information for the LMB
Sets of land cover filed data soft copies of member counties
GIS shape file of location of target areas and points and metadata
Land cover filed survey database
Land cover filed survey database
GIS shape file of location of target areas and points and metadata
Land cover database of LMB
No
Yes
Description cards in PDF format
Land cover information report of LMB
Checking for data QA/QC of LMB
Checking for data QA/QC of countries
Data generation of LMB
Importing QA/QC data into MRC Master Catalogue
Land cover information publishing and sharing
Land cover information catalogue for LMB
Uploaded land cover Information into MRC Data Portal
Land cover data and information report for LMB
Description cards of target points
Land cover field data report of countries

Page 25
Field Survey Data Collection
Figure 7: distribution of Target areas within the LMB

Page 26
Land Cover Map of the Lower Mekong Basin
4.4 Results
National teams conducted field surveys to collect information on land cover from 9,357 target points in 703 target areas across the Lower Mekong Basin between 31 Oct 2011 and 15 February 2012 (Figure 7). Each area was 3 km × 3 km and had 15 points. Each point measured 30 m × 30 m (Figure 8).
1603
000
160
3500
1604
000
160
4500
1
6050
00
160
5500
776000 776500 777000 777500 778000 778500
776000 776500 777000 777500 778000 778500
1603
000
1603
500
1
6040
00
160
4500
1
6050
00
160
5500
.+01
+02
03+
+04
+05
+06
+07
#08
+09
+10+11
+12
+13
+14
+15
#08
+01 Target point
Far-distance target point
Survey route
Road
LEGEND
Figure 8: Example of 15 Target Points (Small Plots) in a Target area
Province: Kon Tum; District: Sa Thay; Commune: Ro KoiProjection: UTM zone 48 Datum: WGS 1984
Target Area: 018; Area size: 3 × 3 km

Page 27
Field Survey Data Collection
Table 3: Target Points Surveyed
Country Expected Targets Number Implemented Percentage Implemented
areas Points areas Points areas (%) Points (%) Cambodia 173 2,595 173 1,851 100 % 71 % Lao PdR 213 3,195 211 2,726 99 % 85 % Thailand 164 2,460 164 2,455 100 % 99 % Viet Nam 155 2,325 155 2,325 100 % 100 % Whole LMB 705 10,575 703 9,357 100 % 89 %
Due to field conditions, not all points could be surveyed. The number of points from where field data was collected totalled 9,357 or 89 percent of the target (Table 3). at the 8 to 15 points in each target area that were reached, the teams filled in questionnaires on bio-physical and land cover data and other information (Figure 9). The survey results were compiled into a database to store land cover information for each point (Table 5).
Paddy Rice was the dominant type of land cover across the basin, accounting for 29 percent of the points surveyed. Broadleaved deciduous Forests were the next most common type of land cover (15 percent) followed by annual Crops (10 percent), Urban areas (9 percent) and Scrubland (8 percent). Ranked next were Industrial Plantations (such as coconut, oil palm, rubber, sesame, soybean and sugarcane) along with Broadleaved Evergreen Forest (both 7 percent). Mangroves were the least common type of land cover together with Flooded Forests as well as Marsh/Swamp areas (Table 4 and Figure 10).
Figure 9: Hotlink in arcGIS to description Card for Field Survey Results

Page 28
Land Cover Map of the Lower Mekong Basin
Table 4: Land Cover Types at Survey Points
Map Code Label Type/Class KH LA TH VN LMB %4 aG annual Crop 218 126 408 162 914 105 PR Paddy Rice 532 395 1,082 667 2,676 296 SC Shifting Cultivation 1 62 2 65 17 Or Orchard 16 54 482 552 68 FF Flooded Forest 1 21 22 09 GR Grassland 47 92 10 23 172 2
10 SH Shrubland 127 562 43 10 742 811 Ua Urban area 189 114 400 149 852 912 BS Bare Soil 1 5 7 25 38 013 IP Industrial Plantation 69 81 178 358 686 714 Bd Broadleaved deciduous Forest 451 771 189 20 1,431 1515 BE Broadleaved Evergreen Forest 170 315 32 147 664 716 FP Forest Plantation 2 23 5 20 50 117 BaF Bamboo Forest 16 66 1 17 100 118 CoF Coniferous Forest 108 22 130 119 Mn Mangrove 8 8 020 M/S Marsh/Swamp area 2 15 7 24 021 aQ aquaculture 7 129 136 223 Wa Water Body 12 3 24 56 95 1
Total target points 1,851 2,726 2,455 2,325 9,357 100
Paddy Rice29 %
B/L Deciduous Forest15 %Annual
Crops10 %
Urban Areas9 %
Shrubland8 %
Industrial Planta�ons7 %
B/L Evergreen Forest 7 %
Other15 %
Figure 10: Main Types of Land Cover at Survey Points
Land Cover in the Lower Mekong Basin (Field Data)

Page 29
Field Survey Data Collection
KH LA TH VN LMB
NonHomogeneous 716 219 1080 337 1636
Homogeneous 1135 2507 1375 1987 5869
0%
10%
20%
30%
40%
50%
60%
70%
80%
90%
100%
Distribu�on of Homogeneous Land Cover Types
Figure 11: Homogeneity of Land Cover at Survey Points
It was recommended to select homogeneous characteristics at each point surveyed. Limitations in field conditions, however, led to non-homogeneous characteristics at numerous points. Overall, almost 80 percent of the points surveyed across the basin had land cover with homogeneous characteristics. Homogeneity was higher in Lao PdR and Viet Nam and lower in Cambodia and Thailand (Figure 11).
Description cards were a core output of the field data collection and were formatted to the standard FaO form to provide land cover information at the survey points:
The results from the field data collection helped to interpret satellite images, validate land cover products and generate a catalogue on land cover information. The data are one of the baselines for implementing MRC programmes as well as being a knowledge base for modelling.
The successful cooperation between the MRC Secretariat and the land cover teams from the National Mekong Committees enabled the project to provide good baseline information for producing an updated and qualified land cover data set and information catalogue for the Lower Mekong Basin.
Country Code Province Code district Code Target area Code Target Point Code
La 202 20201 101 10

Page 30
Land Cover Map of the Lower Mekong Basin
Table 5: Structure of Land Cover database
ID Field Name Data Type
Field Length Detail Field Description
1 RELEVEEN Character 14 Relevee number2 COUNT_COdE Character 2 Country Code3 PROV_NaME Character 14 Provincial Name 4 PROV_COdE Character 4 Provincial code 5 dIST_NaME Character 18 district Name6 dIST_COdE Character 6 district Code7 aREa_COdE Character 3 Target area Code 8 POINT_COdE Character 2 Target Point code9 LCMaP_COdE Character 2 LC Map Code10 LCC_COdE Character 16 LCCS Code11 LC_TYPE Character 21 Land cover Types12 LOCaTION Character 25 Location (Commune)13 OBSERVER Character 17 Observer Name14 daTE date 10 Observer date15 TIME Time 5 Observer time16 REL_SIZE Integer 6 Relevee size (in m2) 17 COORd_Y Integer 8 North coordinate of object point18 COORd_X Integer 8 East coordinate of object point19 COORd_SYS Character 16 Coordinate System (should be UTM_GPS)20 aCCESIBL Character 9 accessibility21 ON_SPOT Integer 1 On the spot22 dISTaNCE Float 6 distance from viewpoint to observed point (m)23 BEaRING Integer 3 The bearing of the observed point (o)24 PHOTO1 Character 7 Photo Shot No 1 (P00905N) 25 PHOTO2 Character 7 Photo Shot No 226 PHOTO3 Character 7 Photo Shot No 327 PHOTO4 Character 7 Photo Shot No 428 SaT_IMaGE Character 6 Satellite Image Sense29 SLOPE Character 84 Slop30 GLC_a Character 13 General Land Cover Type Relevee Site: a 31 GLC_B Character 56 General Land Cover Type Relevee Site: B32 SINGLE Character 22 Single Major Land Cover aspect33 IMPORT Character 22 Two Mixed Major Land Cover aspects (Most Important)34 SECONd Character 22 Two Mixed Major Land Cover aspects (Second)35 HOMOGENE Logic 1 Land Cover Homogeneous for more than 300 m around the sample area:36 H1 Integer 1 Homogene land cover direction Horizontal 137 H2 Integer 1 Homogene land cover direction Horizontal 238 H3 Integer 1 Homogene land cover direction Horizontal 339 H4 Integer 1 Homogene land cover direction Horizontal 440 V1 Integer 1 Homogene land cover direction Vertical 141 V2 Integer 1 Homogene land cover direction Vertical 242 V3 Integer 1 Homogene land cover direction Vertical 343 V4 Integer 1 Homogene land cover direction Vertical 444 aSPECT Character 22 Land cover seasonal aspects45 NaTURaL Character 9 Natural / Semi-Natural Vegetation46 CULTIVaTEd Character 15 Cultivated Fields47 N1_VEGET Character 22 natural and semi-natural vegetation

Page 31
Field Survey Data Collection
ID Field Name Data Type
Field Length Detail Field Description
48 N1_LEVEL Integer 1 Natural and semi-natural vegetation: Level (description) 49 N1_COVER Integer 3 Natural and semi-natural vegetation: Cover (%)50 N1HEIGHT Float 4 Natural and semi-natural vegetation: Height ( m)51 N1LEaF_T Character 6 Natural and semi-natural vegetation: Leaf Type52 N1LEaF_P Character 9 Natural and semi-natural vegetation: Leaf Phenology53 N2_VEGET Character 22 natural and semi-natural vegetation54 N2_LEVEL Integer 1 Natural and semi-natural vegetation: Level (description)55 N2_COVER Integer 3 Natural and semi-natural vegetation: Cover (%)56 N2HEIGHT Float 4 Natural and semi-natural vegetation: Height ( m)57 N2LEaF_T Character 6 Natural and semi-natural vegetation: Leaf Type58 N2LEaF_P Character 9 Natural and semi-natural vegetation: Leaf Phenology59 N3_VEGET Character 22 natural and semi-natural vegetation60 N3_LEVEL Integer 1 Natural and semi-natural vegetation: Level (description)61 N3_COVER Integer 3 Natural and semi-natural vegetation: Cover (%)62 N3HEIGHT Float 4 Natural and semi-natural vegetation: Height ( m)63 N3LEaF_T Character 6 Natural and semi-natural vegetation: Leaf Type64 N3LEaF_P Character 9 Natural and semi-natural vegetation: Leaf Phenology65 COV_EST_Veg Character 6 Cover estimation of vegetation66 C1_MaIN_CROP Character 10 Cultivated main crop: Life Form67 C1_LEaF_T Character 6 Cultivated main crop: Leaf Type68 C1_LEaF_P Character 9 Cultivated main crop: Leaf Phenology69 C1_CaLT_TYPE Character 12 Cultivated types: Fruit Trees and or Plantation 70 C1_CROP_NaM Character 40 Cultivated main crop: Name of crop 1 71 C2_SEC_CROP Character 10 Cultivated main crop: Life Form72 C2_LEaF_T Character 6 Cultivated main crop: Leaf Type73 C2_LEaF_P Character 9 Cultivated main crop: Leaf Phenology74 C2_Calt_Type Character 12 Cultivated types: Fruit Trees and or Plantation 75 C2_CROP_NaM Character 40 Cultivated main crop: Name of crop 2 76 aVG_FIELdSIZ Float 10 average Field Size (m2)77 Field_dISTR Character 60 Field distribution78 Cult_PERIOd Character 64 Cultivation period79 Cult_TIMELaP Character 21 Cultivation Time Factor80 WS_IRRIG Character 24 Water Supply/Irrigation81 SUPP_IRRIG Character 13 Types of supplementary Irrigation 82 MaNaG_LaN Character 21 Urban Vegetated area and area covered by trees is83 BaRE Character 40 Bare areas84 ENG_COMENT Character 255 Comments/observations national language 85 NaT_COMENT Character 255 Comments/observations English language 86 dOC_LINK Character 100 Link to description card or PHOTOs
Table 5 (continued): Structure of Land Cover database

Page 32
Land Cover Map of the Lower Mekong Basin

Page 33
5 Satellite Image Interpretation
5.1 acquisition
The project acquired Landsat 5 Thematic Mapper satellite images for pre-processing. There were 40 images cover the Lower Mekong Basin (LMB) and 80 images for both the dry and wet periods, mostly taken in 2009 and 2010 (Figure 12). due to overlapping areas, the number of images acquired for the national teams in the four countries to be shared and processed totalled 57 (Table 6).
Figure 12: Landsat 5 Thematic Mapper Satellite Images acquired Showing Paths and Rows

Page 34
Land Cover Map of the Lower Mekong Basin
Table 6: Satellite Images acquired
Country Block Path Row Acquisition Date (Dry Period) Acquisition Date (Wet Period)
Cambodia
C1
128 50 2011 01 02 2009 11 28128 51 2011 01 02 2009 11 28127 50 2010 12 26 2010 11 24127 51 2010 04 14 2010 09 21127 52 2010 12 26 2010 09 21
C2
126 52 2011 01 20 2011 11 30126 53 2009 01 14 2009 07 09126 50 2010 02 18 2009 11 30126 51 2009 01 14 2009 11 30125 50 2010 01 26 2009 08 19125 51 2010 02 11 2009 08 19125 52 2010 02 11 2008 11 20
Lao PdR
L1
130 045 2010 04 03 2009 11 10130 046 2010 04 19 2010 05 05129 045 2010 02 07 2009 11 03129 046 2011 02 10 2010 11 06128 046 2009 02 13 2009 11 12
L2
129 047 2011 02 10 2010 11 06129 048 2011 02 10 2010 11 22128 047 2009 02 13 2010 10 30128 048 2011 01 02 2009 11 12127 047 2010 02 25 2010 11 08127 048 2010 04 14 2010 11 08
L3
126 048 2009 02 15 2009 08 26126 049 2011 02 05 2009 11 30126 050 2010 02 18 2009 11 30125 049 2010 02 11 2009 10 06125 050 2010 01 26 2009 08 19
Thailand
T1
131 045 2011 02 08 2010 11 04131 046 2011 02 08 2010 11 04131 047 2011 02 08 2010 11 04130 046 2010 04 19 2010 05 05130 047 2010 04 03 2009 11 10
T2
129 047 2011 02 10 2010 11 06129 048 2011 02 10 2010 11 22129 049 2010 04 12 2010 11 22129 050 2009 01 19 2010 11 22128 050 2011 01 02 2009 11 28128 051 2011 01 02 2009 11 28
T3
128 047 2009 02 13 2010 10 30128 048 2011 01 02 2009 11 12128 049 2011 01 02 2009 11 12127 048 2010 04 14 2010 11 08127 049 2010 04 14 2010 11 24127 050 2010 12 26 2010 11 24126 049 2011 02 05 2009 11 30126 050 2010 02 18 2009 11 30
Viet Nam
V1
125 049 2010 02 11 2009 10 06125 050 2010 01 26 2009 08 19124 050 2011 02 07 2008 08 25124 051 2011 02 07 2010 05 11124 052 2011 02 07 2010 05 11
V2
126 052 2011 01 20 2011 11 30126 053 2009 01 14 2009 07 09126 054 2009 01 14 2008 11 27125 053 2009 12 09 2010 05 18125 054 2009 12 09 2010 05 18

Page 35
Satellite Image Interpretation
5.2 data Preparation
Remotely sensed data are usually digital image data so processing is predominantly treated as digital image processing.
5.2.1 Radiometric Correction
The two most common types of errors encountered in remotely sensed data are radiometric and geometric. Radiometric correction is concerned with improving the accuracy of surface spectral reflectance, emittance, or back-scattered measurements obtained using a remote sensing system. The radiometric correction of remotely sensed data is normally referred to as preprocessing operations because it is performed prior to information extraction. Image processing hopefully produces a corrected image that is as close as possible, radiometrically, to the true radiant energy characteristics of the study area at the time of data collection. Internal and external errors must be identified to correct the remotely sensed data (Jensen, 2005).
5.2.2 Geometric Correction
Geometric correction is concerned with placing the reflected, emitted, or back-scattered measurements or derivative products in their proper planimetric (map) location. The geometric correction of remotely sensed data is normally referred to as preprocessing operations because it is performed prior to information extraction. Image pre-processing aims at producing a corrected image that is as close as possible, geometrically, to the true spatial characteristics of the study area at the time of data collection. Internal and external errors must be identified to correct the remotely sensed data (Jensen, 2005).
• Internal errors are introduced by the remote sensing system itself. They are generally systematic (predictable) and may be identified and then corrected based on pre-launch or in-flight calibration measurements (Jensen, 2005).
• External errors are usually introduced by phenomena that vary in nature through space and time. The most important external variables that can cause remote sensor data to exhibit radiometric and geometric error are the atmosphere, terrain elevation, slope, and aspect (Jensen, 2005).
5.2.3 Data Normalisation
The image normalisation process aims to remove radiometric differences between muli-temporal images that are due to non-surface factors. The goal of image normalisation is to reduce the radiometric influence of non-surface factors, so that differences in brightness values between satellite images from different dates will reflect actual changes on the surface of the earth (Eckhardt et al., 1990; Jensen et al., 1995). accurate normalisation is essential for image processing procedures that use multi-date imagery such as change detection, where changes in brightness values over time are used to identify changes in land cover or other surface characteristics. Non-surface factors that can influence brightness values include sun angle, earth/sun distance, detector calibration, atmospheric conditions and sun/target/
Page 36
Land Cover Map of the Lower Mekong Basin
sensor geometry. Ideally, the influence of such factors would be eliminated through a sophisticated atmospheric transmission model (Jensen, 1996; Heo & FitzHugh, 2000).
5.2.4 Projection and Format Conversion
archived images are mostly stored in a geodetic coordinate system such as GRS 80 (Geodetic Reference System) with map projection UTM. In the land cover map update project, the coordinate system of the satellite images used in the classification process needed to be converted into the local projection system UTM Zone 48 N with WGS84 (World Geodetic System) datum. all archived satellite image data sets were converted from different formats into the default format of ERdaS IMAGINE. This software was mainly used for image processing and classification by the countries within the project, except for Cambodia which used Mad-CaT (Mapping device–Change analysis Tool) provided by the Global Land Cover Network (GLCN). The latter has been jointly set up by FaO and UNEP (United Nations Environmental Programme).
Thermal Band RemovalThe mapping project removed the Image Band No. 6 which is the thermal band with a different spatial resolution (120 m × 120 m). Layer stacking and band composites were processed into raw images for both dry and wet periods. a mosaic of the image tiles for the entire LMB was then produced from which subsets were made using a template block from IKMP. These subset images were inputs for segmentation and classification. IKMP provided the mosaic image with layer stacking of 12 bands for the dry and wet periods to national experts from line agencies in the Member Countries. Image Bands No. 1 to 6 represented the dry period and No. 7 to 12 the wet period.
Image Segmentationa systematic approach was taken to operate the work area by image block with each country responsible within the main block. The fundamental step of any image analysis using eCognition technology is to segment a scene―representing an image―into basic unclassified image objects called image object primitives. Initial segmentation is therefore the subdivision of an image into separate regions represented by these image object primitives. Image interpretation and classification used object-based-operations. Image segmentation was the key step before further processing.
5.3 Image Classification
5.3.1 Classification Techniques
There are two basic methods of classification: supervised and unsupervised classification. In supervised classification, the spectral features of some areas of known land cover types are extracted from the image. These areas are known as the "training areas" (Malgorzata, 2010).
Image interpretation and classification of Landsat 5 TM data were carried out for the identified land cover classes. The aim was to discriminate multiple objects within an image into groups with homogeneous characteristics (classification). This interpretation and classification of image features was based on spectral or spectrally defined features such as density or texture in the feature space.

Page 37
Satellite Image Interpretation
The interpretation and classification divide the feature space into several regions (classes) based on decision rules. In many cases, they were undertaken using a computer program with mathematical classification techniques. The interpretation and classification procedure applied is shown below (Figure 13).
Step 1: Definition of Classification ClassesThe land cover type classes within the Lower Mekong Basin were defined by grouping spectral reflectance values on pixel or object scale. Nineteen classes were clearly identified by using the Land Cover Classification System (LCCS) from the FAO.
Step 2: Selection of FeaturesOnce the classification system (LCCS) had been defined, features identifying these 19 classes had to be sought. The features to discriminate between classes were selected by using parameters such as multi-spectral characteristics and texture reflectance values from each pixel on the image.
Step 3: Sampling of Training DataFor the supervised classification of the LMB land cover data set, the training areas data were sampled to derive with appropriate decision rules. The training areas were defined on the basis of clustered homogenous pixel values or clustered reflectance value ranges in adjoined areas. Every pixel in the whole image is then classified as belonging to one of the classes depending on how close its spectral features are to the spectral features of the training areas. Ground truth data from the field data survey were also utilised during this step. during the training stage the location, size, shape and orientation of each pixel type for each class is determined (Malgorzata, 2010).
Step 4: Estimation of Universal StatisticsStatistical analysis is the key informant for semi-automated classification. Various classification techniques were compared with training area data and an appropriate decision rule selected for subsequent classification. In general, supervised classification applied the Bayesian Theory (Cheeseman et al., 1988) while the filter operations for post-classification applied mathematical morphology theory (Serra & Vincent, 1992).
Step 5: ClassificationImage classification was the next step in satellite image interpretation. Prior steps consisted of data pre-processing. In the classification step, similar reflectance values were regrouped or clustered following Bayesian Theory. The maximum likelihood technique from Bayesian Theory was applied for the supervised classification. The classification depended on decision rules, and all pixels were first classified into a single class. For segmented areas, the two methods used were pixel-by-pixel classification and per-field classification, also referred to as the semi-automatic approach.
Step 6: Verification of Resultsafter pre-processing the remotely sensed data is subjected to quantitative analysis to assign individual pixels to specific classes. Interpretation and classification of the image were based on the known and unknown identity to classify the remainder of the image consisting of those pixels of unknown identity. After classification is complete, it is necessary to evaluate its accuracy by comparing the

Page 38
Land Cover Map of the Lower Mekong Basin
Figure 13: Flow Chart for Image Interpretation and Classification
categories on the classified images with the areas of known identity on the ground. (Malgorzata, 2010)The final process of image interpretation and classification is the verification of the classified results to ensure that the results are accurate and reliable for further use. The classified results were checked and verified for their accuracy and reliability based on the sample points from the field data survey by using an error matrix. Four main parameters were applied for accuracy assessment, namely Overall accuracy, Producer accuracy, User accuracy and Kappa Statistics.

Page 39
Satellite Image Interpretation
5.4 Land Cover Maps for dry and Wet Period
Change detection is the process of identifying differences in the state of an object or phenomenon by observing it at different times (Singh, 1989). The objective is to compare spatial representation of two points in time by controlling all variance cases by differences in variables that are not of interest and to measure changes caused by differences in variables of interest (Green et al., 1994).
The process helps understand landscape dynamics, particularly by illustrating the spatio-temporal dynamics of land cover in the Lower Mekong Basin. Remote-sensing data are primary sources extensively used for change detection in recent decades. Change detection techniques have been developed and grouped into seven categories: (1) algebra (2) transformation (3) classification,(4) advanced models (5) GIS approaches (6) visual analysis and (7) other approaches (Lu et al., 2004). To compare land cover maps 2003 and 2010 and the change detection of land cover map 2010 between dry and wet periods, the change detection technique was applied to study temporal differences including significant changes by applied GIS approach.
There are two categories of changes between and within classes. a change between classes is a conversion of land cover in one category to a completely different category (Lu et al., 2010) (Bare Soil to Built-up area, for example). Figures 15 and 16 depict maps derived for the dry and wet periods. Land cover types in the legends of these maps are not alphabetically sorted but merely follow the sequencing of the numerical map code as shown in Table 7.
Figure 14a: areas of Periodic Land Cover Change Between dry and Wet Periods in the Mekong delta
Paddy rice in wet period; upland crops in dry period
Shrimp field in dry period; paddy rice in wet period
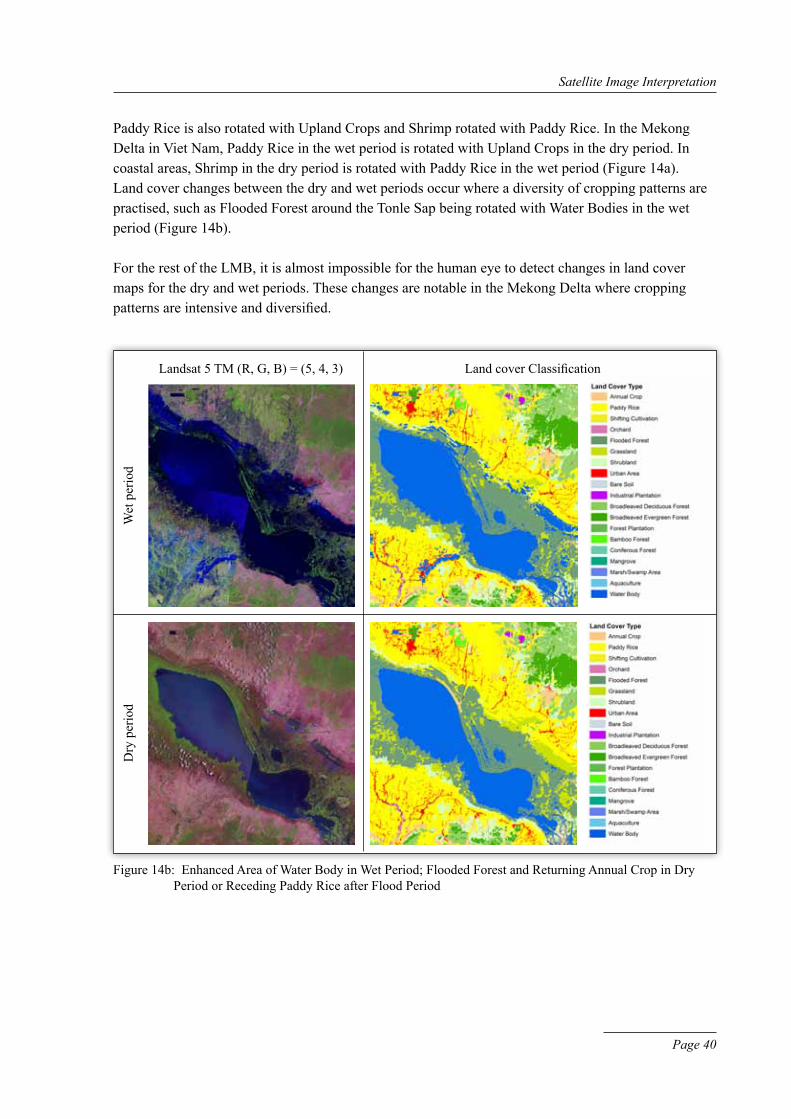
Page 40
Satellite Image Interpretation
Figure 14b: Enhanced area of Water Body in Wet Period; Flooded Forest and Returning annual Crop in dry Period or Receding Paddy Rice after Flood Period
Landsat 5 TM (R, G, B) = (5, 4, 3)
Wet
per
iod
dry
per
iod
Land cover Classification
Paddy Rice is also rotated with Upland Crops and Shrimp rotated with Paddy Rice. In the Mekong delta in Viet Nam, Paddy Rice in the wet period is rotated with Upland Crops in the dry period. In coastal areas, Shrimp in the dry period is rotated with Paddy Rice in the wet period (Figure 14a). Land cover changes between the dry and wet periods occur where a diversity of cropping patterns are practised, such as Flooded Forest around the Tonle Sap being rotated with Water Bodies in the wet period (Figure 14b).
For the rest of the LMB, it is almost impossible for the human eye to detect changes in land cover maps for the dry and wet periods. These changes are notable in the Mekong delta where cropping patterns are intensive and diversified.

Sate
llite
Imag
e In
terp
reta
tion
Page 41

Figu
re 1
5: L
and
Cov
er M
ap fo
r dry
Per
iod

Sate
llite
Imag
e In
terp
reta
tion
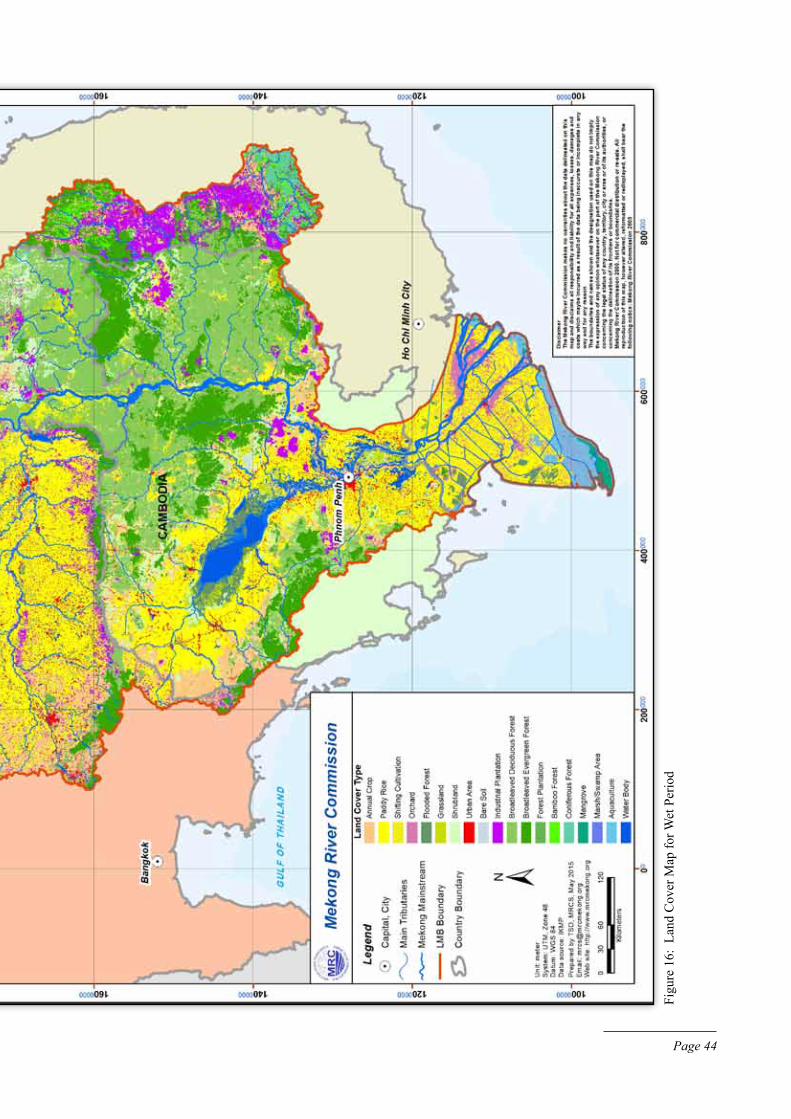
Figu
re 1
6: L
and
Cov
er M
ap fo
r Wet
Per
iod
Page 44

Page 45
Land Cover Map of the Lower Mekong Basin

Page 46
Land Cover Map of the Lower Mekong Basin
5.5 accuracy assessment
Accuracy assessment is a technique to measure and control the quality of classified maps. Accuracy statistics provide objective information about the quality of the land cover classification by addressing overall quality and per-class quality.
Two main errors in image interpretation and classification are position and thematic errors. Position errors often involve incorrect registration of base information and the area being mapped. This can be difficult to notice unless compared with accurate base data. Thematic errors occur when individual features are misidentified. Accuracy assessment sampling is often skewed towards detecting thematic errors. Sampling designs usually allow for "reasonable" position errors by assuring sample points are not close to a class edge. The project applied four parameters to determine the quality of the classified land-cover maps which are based on a computed Confusion Matrix (Jensen, 2005). a Confusion Matrix lists the values for known cover types of the reference data in the columns and for the classified data in the rows. The applied quality parameters include:
• The Overall Accuracy of a classification, a measure in percent derived from the Confusion Matrix by adding how many pixels were classified the same in the satellite images and on the ground and dividing the result by the total number of pixels. It does not refer to how well individual classes were classified.
• The Producer Accuracy, the probability in percent that a certain land cover of an area on the ground is classified as such. It includes the error of omission which refers to the proportion of observed features on the ground that are not classified in the map.
• The User Accuracy, the probability in percent that a pixel labeled as a certain land- cover class in the map is really this class on the ground. The User's accuracy is therefore a measure of the reliability of the derived map.
• The Kappa Coefficient, a discrete multivariate measure that differs from the usual measures of overall accuracy assessment in basically two ways. First, the calculation takes into account all of the elements of the error matrix, not just the diagonals of the matrix. This has the effect
Overall accuracy = ×100 = ×100 (Eq. 3)∑ niii=1
k∑ niii=1
k
∑ n+ii=1
k∑ ni+i=1
k
Producer accuracy = ×100 (Eq. 4)nii
∑ n+ii=1
k
User accuracy = ×100 (Eq. 5)nii
∑ ni+i=1
k
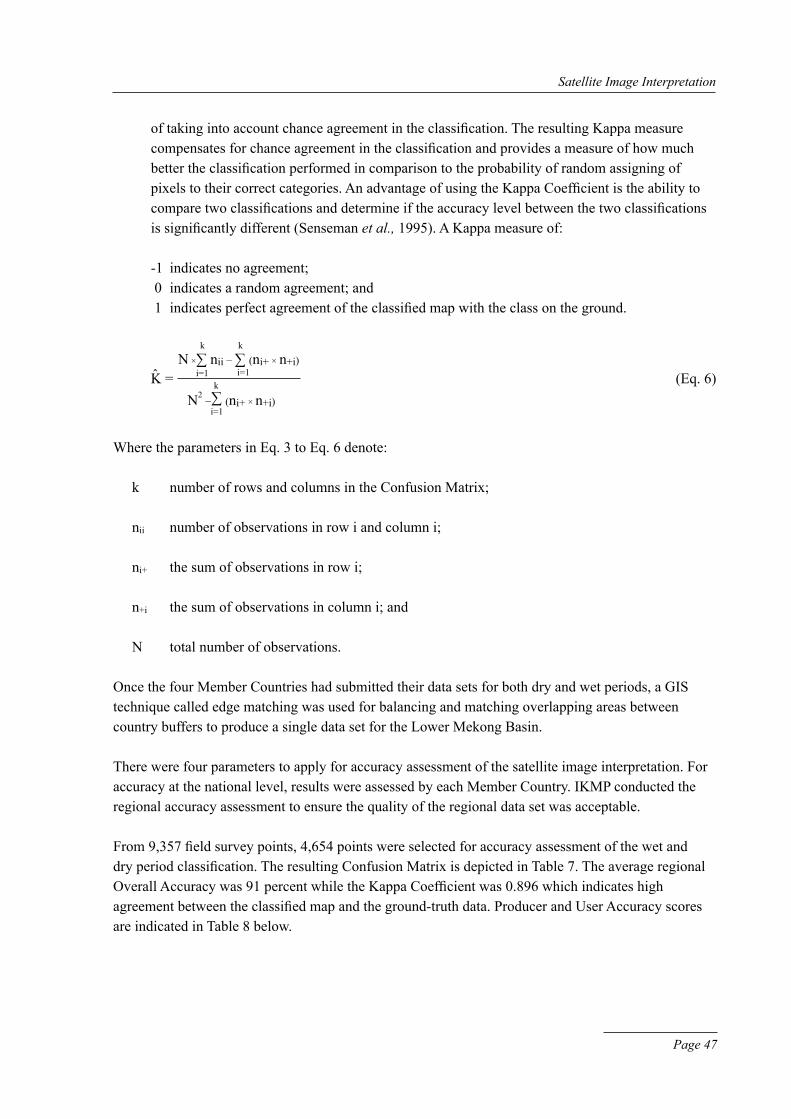
Page 47
Satellite Image Interpretation
of taking into account chance agreement in the classification. The resulting Kappa measure compensates for chance agreement in the classification and provides a measure of how much better the classification performed in comparison to the probability of random assigning of pixels to their correct categories. An advantage of using the Kappa Coefficient is the ability to compare two classifications and determine if the accuracy level between the two classifications is significantly different (Senseman et al., 1995). a Kappa measure of:
-1 indicates no agreement; 0 indicates a random agreement; and 1 indicates perfect agreement of the classified map with the class on the ground.
Where the parameters in Eq. 3 to Eq. 6 denote:
k number of rows and columns in the Confusion Matrix;
nii number of observations in row i and column i;
ni+ the sum of observations in row i;
n+i the sum of observations in column i; and
N total number of observations.
Once the four Member Countries had submitted their data sets for both dry and wet periods, a GIS technique called edge matching was used for balancing and matching overlapping areas between country buffers to produce a single data set for the Lower Mekong Basin.
There were four parameters to apply for accuracy assessment of the satellite image interpretation. For accuracy at the national level, results were assessed by each Member Country. IKMP conducted the regional accuracy assessment to ensure the quality of the regional data set was acceptable.
From 9,357 field survey points, 4,654 points were selected for accuracy assessment of the wet and dry period classification. The resulting Confusion Matrix is depicted in Table 7. The average regional Overall Accuracy was 91 percent while the Kappa Coefficient was 0.896 which indicates high agreement between the classified map and the ground-truth data. Producer and User Accuracy scores are indicated in Table 8 below.
K = (Eq. 6)N2 −∑ (ni+ × n+i)
i=1
k
N ×∑ nii − ∑ (ni+ × n+i)i=1 i=1
k k
ˆ
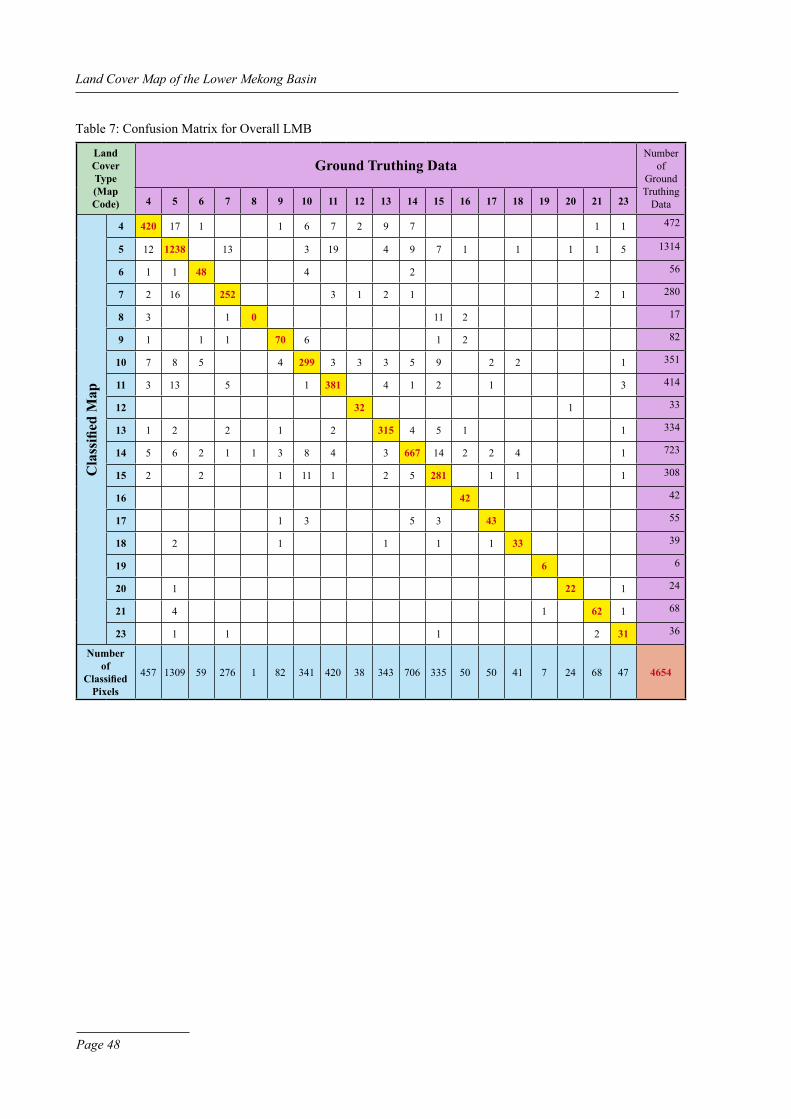
Page 48
Land Cover Map of the Lower Mekong Basin
Table 7: Confusion Matrix for Overall LMB
Land Cover Type (Map Code)
Ground Truthing DataNumber
of Ground Truthing
data4 5 6 7 8 9 10 11 12 13 14 15 16 17 18 19 20 21 23
Cla
ssifi
ed M
ap
4 420 17 1 1 6 7 2 9 7 1 1 472
5 12 1238 13 3 19 4 9 7 1 1 1 1 5 1314
6 1 1 48 4 2 56
7 2 16 252 3 1 2 1 2 1 280
8 3 1 0 11 2 17
9 1 1 1 70 6 1 2 82
10 7 8 5 4 299 3 3 3 5 9 2 2 1 351
11 3 13 5 1 381 4 1 2 1 3 414
12 32 1 33
13 1 2 2 1 2 315 4 5 1 1 334
14 5 6 2 1 1 3 8 4 3 667 14 2 2 4 1 723
15 2 2 1 11 1 2 5 281 1 1 1 308
16 42 42
17 1 3 5 3 43 55
18 2 1 1 1 1 33 39
19 6 6
20 1 22 1 24
21 4 1 62 1 68
23 1 1 1 2 31 36
Number of
Classified Pixels
457 1309 59 276 1 82 341 420 38 343 706 335 50 50 41 7 24 68 47 4654

Page 49
Satellite Image Interpretation
Table 8: Producer and User accuracy Score
Map Code Description Producer Accuracy [%] User Accuracy [%]4 annual Crop 91.9 89.05 Paddy Rice 94.6 94.26 Shifting Cultivation 81.4 85.77 Orchard 91.3 90.08 Flooded Forest 0.0 0.09 Grassland 85.4 85.4
10 Shrubland 87.7 85.211 Urban area 90.7 92.012 Bare Soil 84.2 97.013 Industrial Plantation 91.8 94.314 Broadleaved deciduous Forest 94.5 92.315 Broadleaved Evergreen Forest 83.9 91.216 Forest Plantation 84.0 100.017 Bamboo Forest 86.0 78.218 Coniferous Forest 80.5 84.619 Mangrove 85.7 100.020 Marsh/Swamp area 91.7 91.721 aquaculture 91.2 91.223 Water Body 66.0 86.1

Page 50
Land Cover Map of the Lower Mekong Basin
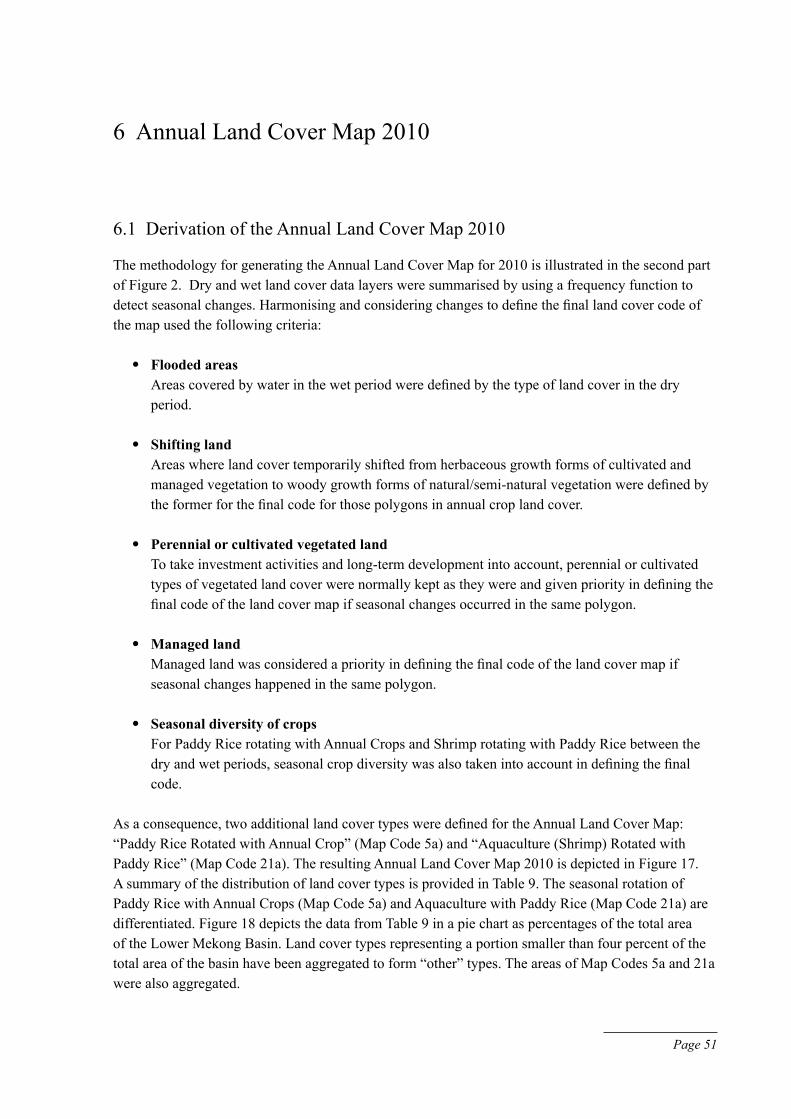
Page 51
6 annual Land Cover Map 2010
6.1 derivation of the annual Land Cover Map 2010
The methodology for generating the annual Land Cover Map for 2010 is illustrated in the second part of Figure 2. dry and wet land cover data layers were summarised by using a frequency function to detect seasonal changes. Harmonising and considering changes to define the final land cover code of the map used the following criteria:
• Flooded areas Areas covered by water in the wet period were defined by the type of land cover in the dry
period.
• Shifting land areas where land cover temporarily shifted from herbaceous growth forms of cultivated and
managed vegetation to woody growth forms of natural/semi-natural vegetation were defined by the former for the final code for those polygons in annual crop land cover.
• Perennial or cultivated vegetated land To take investment activities and long-term development into account, perennial or cultivated
types of vegetated land cover were normally kept as they were and given priority in defining the final code of the land cover map if seasonal changes occurred in the same polygon.
• Managed land Managed land was considered a priority in defining the final code of the land cover map if
seasonal changes happened in the same polygon.
• Seasonal diversity of crops For Paddy Rice rotating with annual Crops and Shrimp rotating with Paddy Rice between the
dry and wet periods, seasonal crop diversity was also taken into account in defining the final code.
As a consequence, two additional land cover types were defined for the Annual Land Cover Map: “Paddy Rice Rotated with Annual Crop” (Map Code 5a) and “Aquaculture (Shrimp) Rotated with Paddy Rice” (Map Code 21a). The resulting annual Land Cover Map 2010 is depicted in Figure 17. a summary of the distribution of land cover types is provided in Table 9. The seasonal rotation of Paddy Rice with annual Crops (Map Code 5a) and aquaculture with Paddy Rice (Map Code 21a) are differentiated. Figure 18 depicts the data from Table 9 in a pie chart as percentages of the total area of the Lower Mekong Basin. Land cover types representing a portion smaller than four percent of the total area of the basin have been aggregated to form “other” types. The areas of Map Codes 5a and 21a were also aggregated.

Page 52
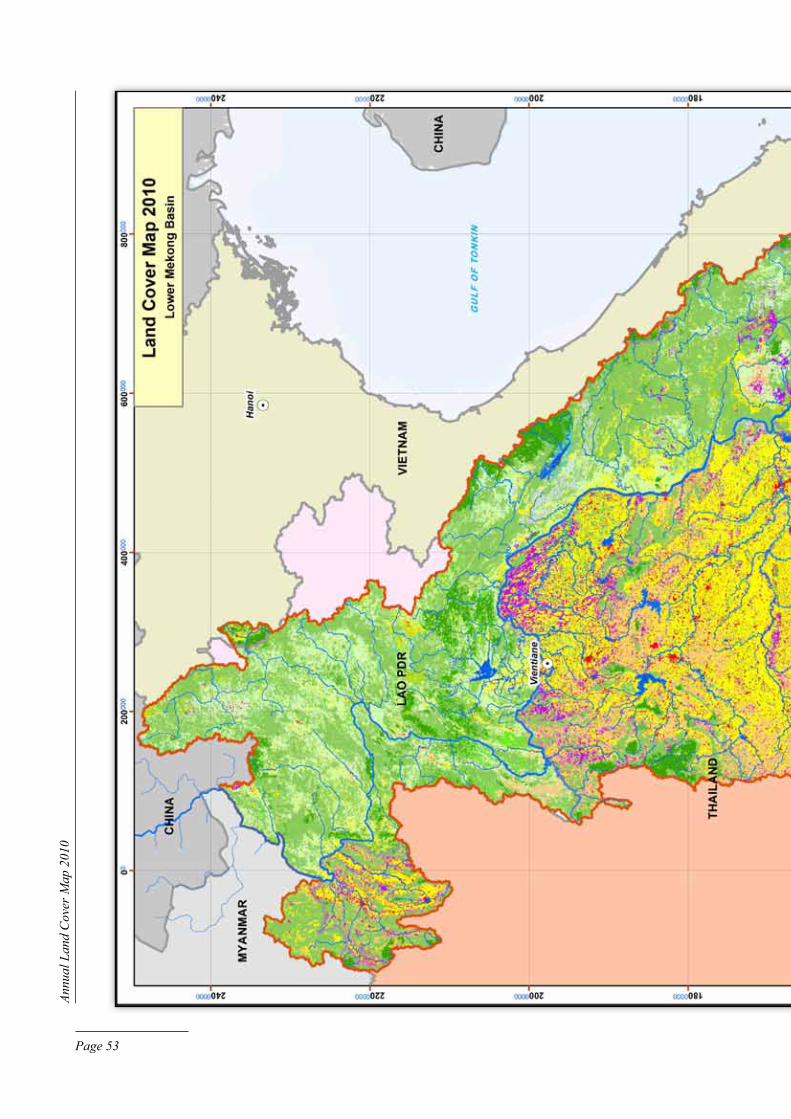
Annu
al L
and
Cov
er M
ap 2
010
Page 53

Figu
re 1
7: L
and
Cov
er M
ap 2
010
(ann
ual L
and
Cov
er M
ap)

Page 55
Annual Land Cover Map 2010
Table 9: distribution of Land Cover Types in the Lower Mekong Basin (dry Period)
Map Code Land Cover Types
2010km2 Percent
Total Area 625,365.57 1004 annual Crop 52,281.07 8.36 5 Paddy Rice 140,540.97 22.47 5a Paddy Rice rotated with annual Crop 198.27 0.03 6 Shifting Cultivation 10,868.66 1.74 7 Orchard 12,123.10 1.94 8 Flooded Forest 4,886.50 0.78 9 Grassland 8,313.68 1.33
10 Shrubland 69,493.72 11.11 11 Urban area 15,779.54 2.52 12 Bare Soil 3,807.98 0.61 13 Industrial Plantation 25,351.64 4.05 14 Broadleaved deciduous Forest 180,103.26 28.80 15 Broadleaved Evergreen Forest 65,111.60 10.41 16 Forest Plantation 1,497.78 0.24 17 Bamboo Forest 5,665.68 0.91 18 Coniferous Forest 3,900.62 0.62 19 Mangrove 1,302.66 0.21 20 Marsh/Swamp area 2,623.29 0.42 21 aquaculture 4,089.71 0.65 21a aquaculture (Shrimp) rotated with Paddy Rice 2,794.10 0.45 23 Water Body 14,631.75 2.34
B/L DeciduousForest29 %
Paddy Rice23 %
Shrubland11 %
B/L Evergreen Forest10 %
Annual Crops 8 %
Industrial Planta�ons
4 %
Other15 %
Figure 18: distribution of Land Cover Types in the Lower Mekong Basin in 2010
Land Cover in the Lower Mekong Basin (Updated Map for 2010)

Land Cover Map of the Lower Mekong Basin
Page 56
6.2 Comparison of Land Cover Maps 2003 and 2010
The existing Land Cover Map 2003 (Figure 19) of the LMB was reprocessed by aggregating the land cover and land use maps from the previous project from the four Member Countries which took place from 2001 to 2003. The derived map was then in a second step reclassified following the FAO LCCS which was applied in this project to derive the Land Cover Map 2010. The resulting Land Cover Map 2003 is depicted in Figure 19. The correspondence of land cover types and map codes in the legend of the map coincides with the one for the dry and wet period maps given in Table 1.
In Figure 20, blue columns represent a percentage increase and red columns represent a percentage decrease of areas of the particular land cover types. Here, Map Codes 5 and 5a as well as 21 and 21a were aggregated; Table 9 shows seperate values for each of these Map Codes. Paddy Rice (Map Code 5) and Broadleaved Evergreen Forest (Map Code 15) were substantially reduced in the period between 2003 and 2010. Shrubland (Map Code 10) and Broadleaved deciduous Forest (Map Code 14) increased considerably during the same period.
Table 10 lists changes in square kilometers and as percentages of the total area of the Lower Mekong Basin between 2003 and 2010. In order to compare the classification results of 2003 and 2010, the values for Map Codes 5 and 5a as well as 21 and 21a were combined. The values for Map Codes 5 and 21 therefore differ in Tables 9 and 10. Figure 21 shows the percentage of land cover type changes at district levels in the LMB between 2003 and 2010.
It should be mentioned, however, that the classification results obtained for the 2003 and 2010 land cover mapping are based on different approaches. Thus, the results derived by the comparison of these two mapping projects should be merely referred to in a qualitative way.

Annu
al L
and
Cov
er M
ap 2
010
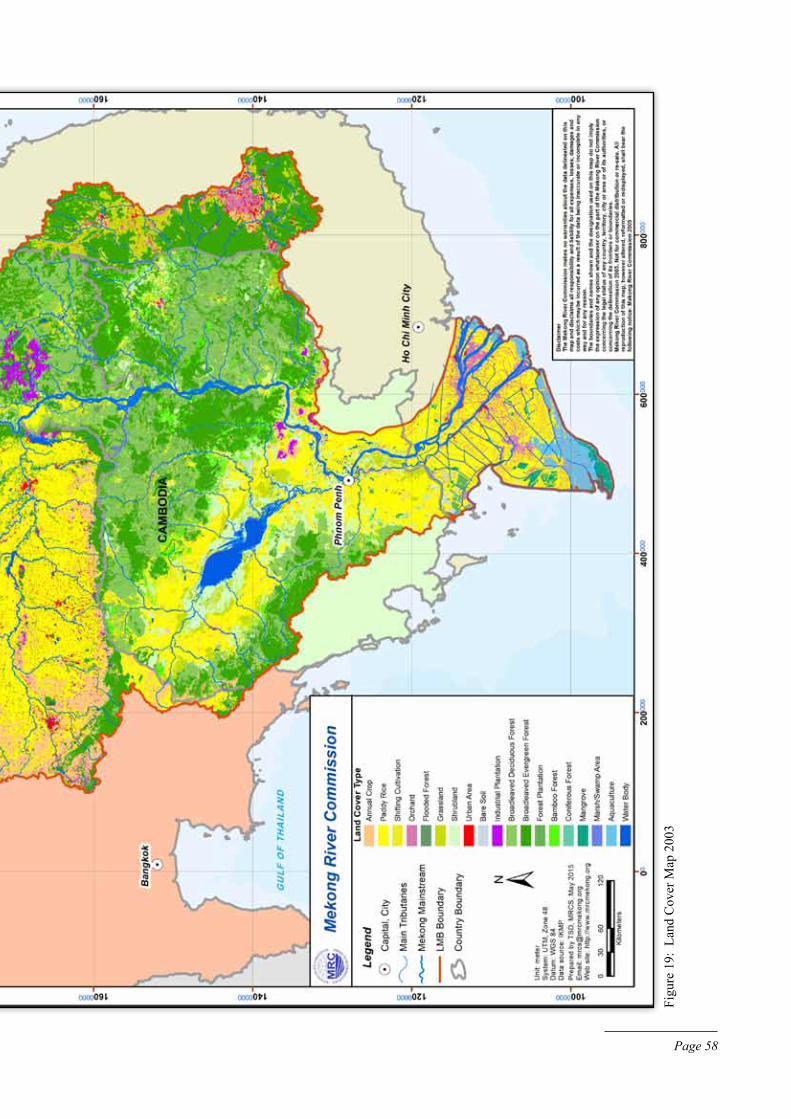
Figu
re 1
9: L
and
Cov
er M
ap 2
003
Page 58
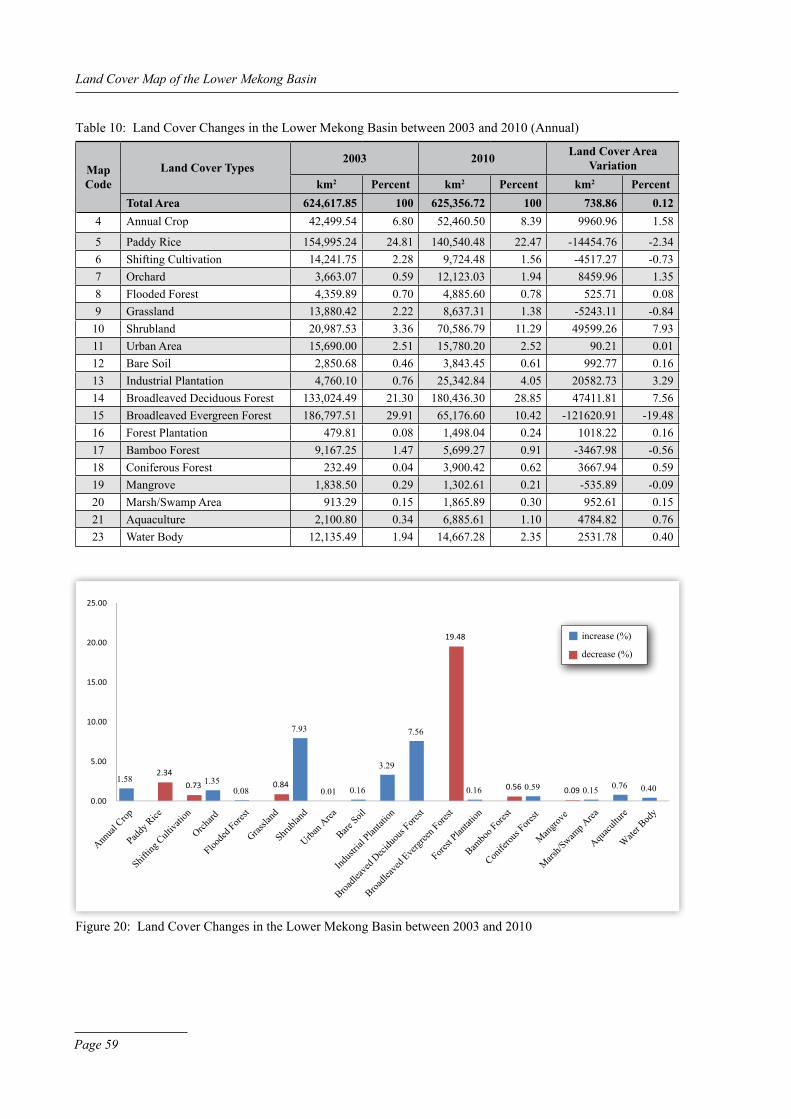
Land Cover Map of the Lower Mekong Basin
Page 59
Table 10: Land Cover Changes in the Lower Mekong Basin between 2003 and 2010 (annual)
MapCode
Land Cover Types2003 2010 Land Cover Area
Variationkm2 Percent km2 Percent km2 Percent
Total Area 624,617.85 100 625,356.72 100 738.86 0.124 annual Crop 42,499.54 6.80 52,460.50 8.39 9960.96 1.58
5 Paddy Rice 154,995.24 24.81 140,540.48 22.47 -14454.76 -2.346 Shifting Cultivation 14,241.75 2.28 9,724.48 1.56 -4517.27 -0.737 Orchard 3,663.07 0.59 12,123.03 1.94 8459.96 1.358 Flooded Forest 4,359.89 0.70 4,885.60 0.78 525.71 0.089 Grassland 13,880.42 2.22 8,637.31 1.38 -5243.11 -0.84
10 Shrubland 20,987.53 3.36 70,586.79 11.29 49599.26 7.9311 Urban area 15,690.00 2.51 15,780.20 2.52 90.21 0.0112 Bare Soil 2,850.68 0.46 3,843.45 0.61 992.77 0.1613 Industrial Plantation 4,760.10 0.76 25,342.84 4.05 20582.73 3.2914 Broadleaved deciduous Forest 133,024.49 21.30 180,436.30 28.85 47411.81 7.5615 Broadleaved Evergreen Forest 186,797.51 29.91 65,176.60 10.42 -121620.91 -19.4816 Forest Plantation 479.81 0.08 1,498.04 0.24 1018.22 0.1617 Bamboo Forest 9,167.25 1.47 5,699.27 0.91 -3467.98 -0.5618 Coniferous Forest 232.49 0.04 3,900.42 0.62 3667.94 0.5919 Mangrove 1,838.50 0.29 1,302.61 0.21 -535.89 -0.0920 Marsh/Swamp area 913.29 0.15 1,865.89 0.30 952.61 0.1521 aquaculture 2,100.80 0.34 6,885.61 1.10 4784.82 0.7623 Water Body 12,135.49 1.94 14,667.28 2.35 2531.78 0.40
Figure 20: Land Cover Changes in the Lower Mekong Basin between 2003 and 2010
1.58 1.35 0.08
7.93
0.01 0.16
3.29
7.56
0.16 0.59 0.15 0.76 0.40
2.34 0.73 0.84
19.48
0.56 0.09 0.00
5.00
10.00
15.00
20.00
25.00
increase (%)
decrease (%)
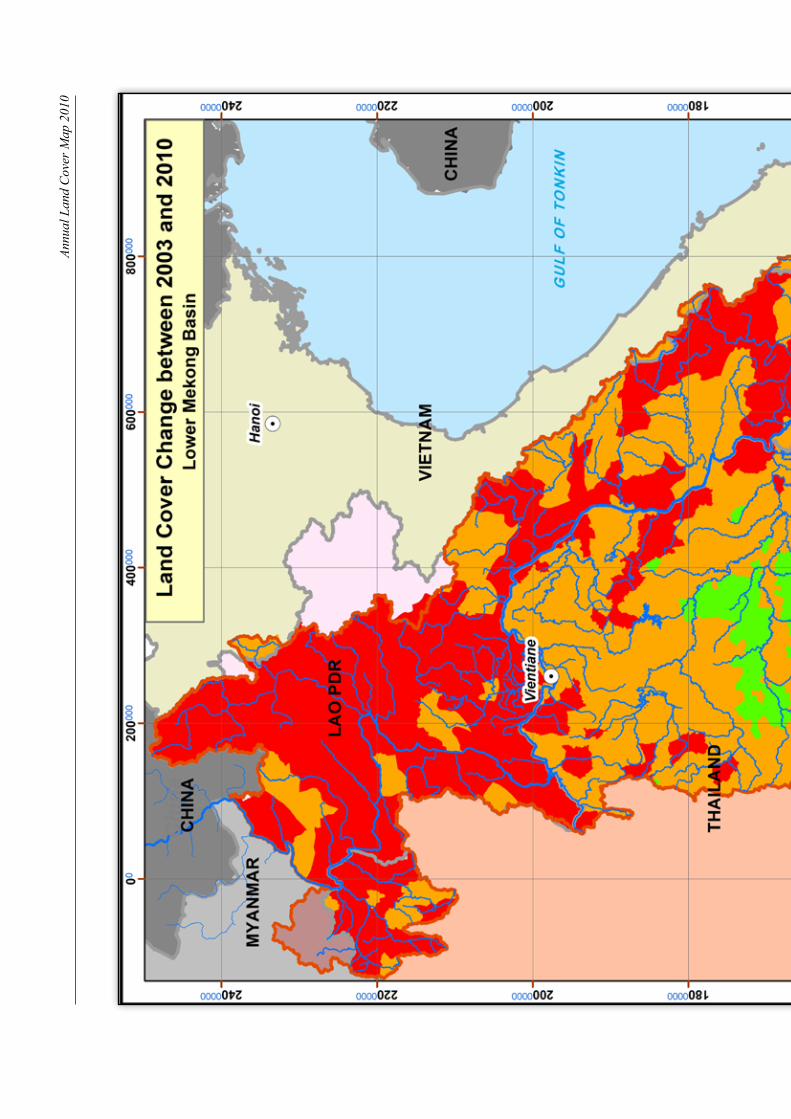
Annu
al L
and
Cov
er M
ap 2
010

Page 61
Figu
re 2
1: L
and
Cov
er C
hang
es a
t dis
trict
Lev
el b
etw
een
2003
and
201
0

Page 62
Land Cover Map of the Lower Mekong Basin
Page 63
7 Quality assurance, Metadata and Storage
The quality of the derived products (land cover field survey data and land cover maps) was assured by following MRC guidelines on quality assurance. The quality assurance procedures are laid out in the MRC document “Quality Assurance and Transformation Parameters for Geographic Data” (MRC 2015).
The three stages differentiated in the quality assurance process are review, correction and verification. a checklist will be followed during the review that is comprised of checking for completeness, validity, logical consistency, physical consistency, referential integrity and positional accuracy. The quality assurance is either visual or automated.
Visual inspections of data sets involve a preliminary check of map feature qualities of areas also available from base maps. Random error checks on attributes are carried out. Visual quality assurance also includes checks on metadata, geographic feature definitions (terminology and classification), geodetic datums and map projections, geographic feature completeness and consistency with relevant information, positional accuracy and spelling correctness of attribute values.
automated quality assurance aims at inspecting big data sets and detecting inconsistencies that may not be detected by visual inspection. The automated approach takes two issues into account. First, topological rules are checked. Second, the alphanumeric attributes of geographic features are checked against referential integrity rules, attribute consistency as well as attribute accuracy and completeness (domain).
Both, visual and automated quality assurance were applied in the project. Table 11 shows the quality assurance report of the land cover field survey data and Table 12 contains the quality assurance report of the land cover maps itself. The derived metadata of the land cover field survey are presented in Table 13 and the metadata of the land cover maps are shown in Table 14. The land cover field data and land cover maps including corresponding metadata were uploaded to the IKMP server at the Office of the MRC Secretariat in Phnom Penh and are retrievable by accessing the Master Catalogue of the MRC data and Information Services.
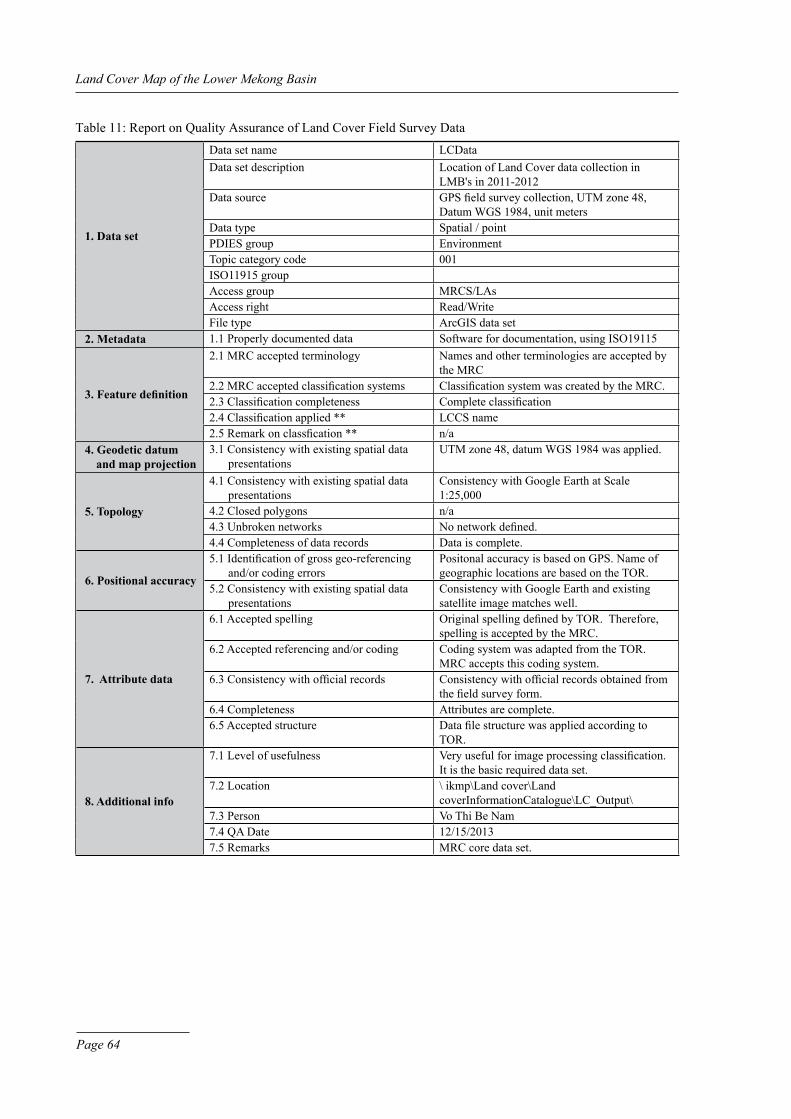
Page 64
Land Cover Map of the Lower Mekong Basin
Table 11: Report on Quality assurance of Land Cover Field Survey data
1. Data set
data set name LCdatadata set description Location of Land Cover data collection in
LMB's in 2011-2012data source GPS field survey collection, UTM zone 48,
datum WGS 1984, unit metersdata type Spatial / pointPdIES group EnvironmentTopic category code 001ISO11915 group access group MRCS/Lasaccess right Read/WriteFile type arcGIS data set
2. Metadata 1.1 Properly documented data Software for documentation, using ISO19115
3. Feature definition
2.1 MRC accepted terminology Names and other terminologies are accepted by the MRC
2.2 MRC accepted classification systems Classification system was created by the MRC.2.3 Classification completeness Complete classification2.4 Classification applied ** LCCS name2.5 Remark on classfication ** n/a
4. Geodetic datum and map projection
3.1 Consistency with existing spatial data presentations
UTM zone 48, datum WGS 1984 was applied.
5. Topology
4.1 Consistency with existing spatial data presentations
Consistency with Google Earth at Scale 1:25,000
4.2 Closed polygons n/a4.3 Unbroken networks No network defined.4.4 Completeness of data records data is complete.
6. Positional accuracy
5.1 Identification of gross geo-referencing and/or coding errors
Positonal accuracy is based on GPS. Name of geographic locations are based on the TOR.
5.2 Consistency with existing spatial data presentations
Consistency with Google Earth and existing satellite image matches well.
7. Attribute data
6.1 accepted spelling Original spelling defined by TOR. Therefore, spelling is accepted by the MRC.
6.2 accepted referencing and/or coding Coding system was adapted from the TOR. MRC accepts this coding system.
6.3 Consistency with official records Consistency with official records obtained from the field survey form.
6.4 Completeness attributes are complete.6.5 accepted structure Data file structure was applied according to
TOR.
8. Additional info
7.1 Level of usefulness Very useful for image processing classification. It is the basic required data set.
7.2 Location \ ikmp\Land cover\Land coverInformationCatalogue\LC_Output\
7.3 Person Vo Thi Be Nam7.4 Qa date 12/15/20137.5 Remarks MRC core data set.

Page 65
Quality Assurance, Metadata and Storage
Table 12: Report on Quality assurance of Land Cover Map
1. Data set
data set name dryLandCover2010; WetlandCover2010; Land Cover2010
data set description FAO classified Land Cover Types of LMB in 2010
data source Generation of FAO classification land cover types is based on Landsat 5 TM taken in dry and wet period from 2009-2010 at spatial resolution of 30 metres.
data type Spatial/polyPdIES group EnvironmentTopic category code 001ISO11915 group access group MRCS/Lasaccess right Read/WriteFile type arcGIS data set
2. Metadata 1.1 Properly documented data Software for documentation, using ISO19115
3. Feature definition 2.1 MRC accepted terminology Names and other terminologies are accepted by the MRC
2.2 MRC accepted classification systems Classification system was created in the MRC after FAO Land Cover classification.
2.3 Classification completeness Complete classification2.4 Classification applied ** LC_Code and LCCS name2.5 Remark on classfication ** n/a
4. Geodetic datum and map projection
3.1 Consistency with existing spatial data presentations
UTM zone 48, datum WGS 1984 was applied.
5. Topology
4.1 Consistency with existing spatial data presentations
Consistency with Google Earth at Scale 1:50,000
4.2 Closed polygons Polygon4.3 Unbroken networks No network defined.4.4 Completeness of data records data is complete.
6. Positional accuracy
5.1 Identification of gross geo-referencing and/or coding errors
Positonal accuracy is based on geo-referenced Landsat images by Jaxa Thailand.
5.2 Consistency with existing spatial data presentations
Consistency with Google Earth and existing satellite image matches well.
7. Attribute data
6.1 accepted spelling Original spelling FAO definition. Therefore, spelling is accepted by the MRC.
6.2 accepted referencing and/or coding Coding system was adapted from the Guideline. MRC accepts this coding system.
6.3 Consistency with official records Consistency with official records obtained from the FAO Land Cover Classification.
6.4 Completeness attributes are complete.6.5 accepted structure Data file structure was applied according to
Guideline.
8. Additional info
7.1 Level of usefulness Very useful for wetland and ecological classification. It is the basic required data set.
7.2 Location \ ikmp\Land cover\Land coverInformationCatalogue\LC_Output\
7.3 Person Vo Thi Be Nam7.4 Qa date 12/11/20147.5 Remarks MRC core data set.
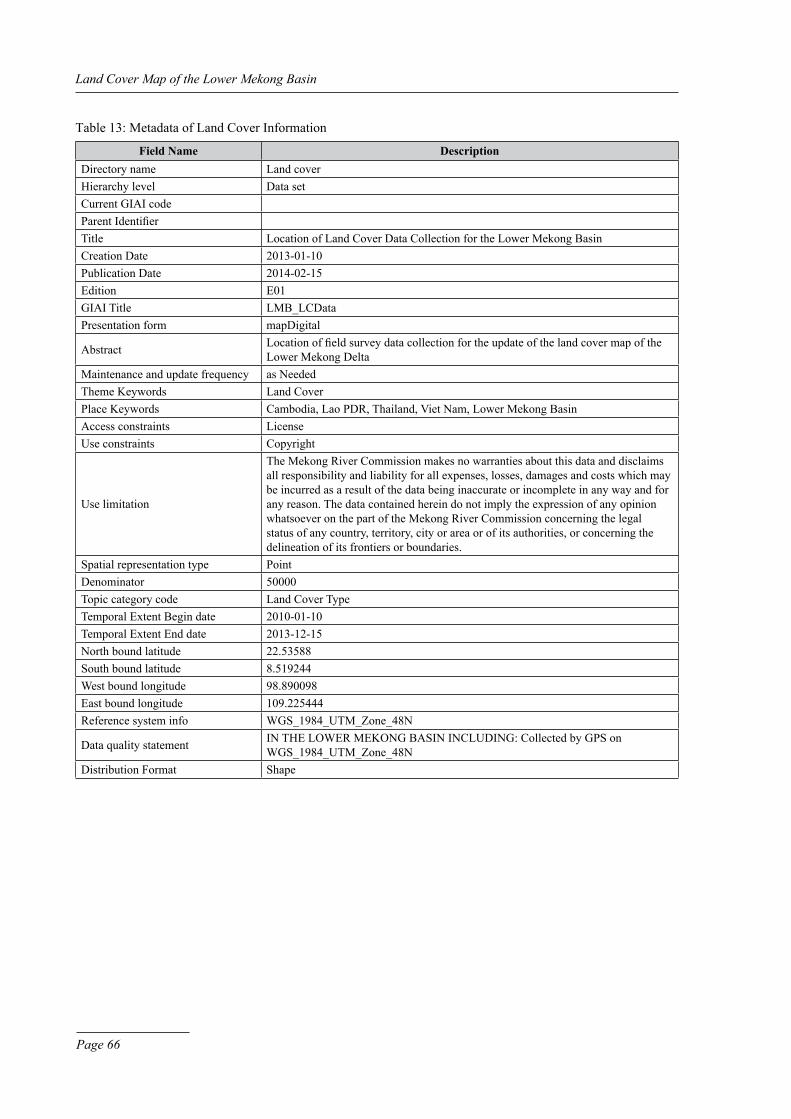
Page 66
Land Cover Map of the Lower Mekong Basin
Table 13: Metadata of Land Cover Information
Field Name Descriptiondirectory name Land coverHierarchy level data setCurrent GIaI codeParent Identifier Title Location of Land Cover data Collection for the Lower Mekong Basin Creation date 2013-01-10Publication date 2014-02-15Edition E01GIaI Title LMB_LCdataPresentation form mapdigital
abstract Location of field survey data collection for the update of the land cover map of the Lower Mekong delta
Maintenance and update frequency as NeededTheme Keywords Land CoverPlace Keywords Cambodia, Lao PdR, Thailand, Viet Nam, Lower Mekong Basin access constraints LicenseUse constraints Copyright
Use limitation
The Mekong River Commission makes no warranties about this data and disclaims all responsibility and liability for all expenses, losses, damages and costs which may be incurred as a result of the data being inaccurate or incomplete in any way and for any reason. The data contained herein do not imply the expression of any opinion whatsoever on the part of the Mekong River Commission concerning the legal status of any country, territory, city or area or of its authorities, or concerning the delineation of its frontiers or boundaries.
Spatial representation type Pointdenominator 50000Topic category code Land Cover TypeTemporal Extent Begin date 2010-01-10Temporal Extent End date 2013-12-15North bound latitude 22.53588South bound latitude 8.519244West bound longitude 98.890098East bound longitude 109.225444Reference system info WGS_1984_UTM_Zone_48N
data quality statement IN THE LOWER MEKONG BaSIN INCLUdING: Collected by GPS on WGS_1984_UTM_Zone_48N
distribution Format Shape

Page 67
8 Conclusions
8.1 Common Land Cover Classification for the LMB
The project used the FAO Land Cover Classification System (LCCS) to generate a common classification for 19 classes of land cover in the Lower Mekong Basin. The work rationalises and harmonises national reference systems for data sharing and exchange between the MRC, Member Countries and other development organisations or users.
The project used the FAO Land Cover Classification System (LCCS) Version 3 to generate a common classification of 19 land cover classes which cover all land cover types in the Lower Mekong Basin. The procedure of the LCCS Version 3 has been adopted by ISO to form ISO 19144 which consists of the two parts “Classification System Structure” and “Land Cover Classification System”. LCCS Version 3 comprises a unique and universally applicable land cover classification system. Agreeing to a unique land cover classification system among the MRC Member Countries provides a means for logically consistent data sharing within the MRC and between MRC and its Member Countries as well as development organisations and other users. The land cover classes defined in the course of the project form a solid basis for further land cover monitoring projects in the future. In particular, this approach also enables for an easy comparison of different land cover states of the LMB in the future. This will help scientists to analyse land cover changes and allow decision makers to rely on sound information for policy and decision making.
8.2 Methodology and Tools
During the project setup, field surveys, satellite image interpretation, quality assessment and map post-processing, a plethora of software tools were applied. National teams of the Member Countries partly differed in using these tools. Therefore, only an overview of the software tools used in the project is provided here.
Within the project GIS, remote sensing and mapping technologies together with other geoinformatic applications were used. These included arcPad 10, arcMap 10, LCCS 3, GLCN Mad-CaT, eCognition Developer and ERDAS IMAGINE for field-survey data collection, image processing, interpretation and classification, spatial analysis and mapping.

Page 68
Land Cover Map of the Lower Mekong Basin
8.3 Outputs
The project generated several outputs including:
• a common land cover classification and a unique approach for assessing land cover in the Lower Mekong Basin;
• land cover maps for three data sets (dry period, wet period and annual data);
• a land cover survey network across the Lower Mekong Basin documented in the information catalogue; and
• an update of the MRC Data Portal and Master Catalogue with all data generated in the project.
The importance of a common land cover classification and a unique approach for assessing land cover in the Lower Mekong Basin has been discussed in Chapter 8.1. The unique approach ensures that results of future land cover surveys in the LMB will be comparable with the current one and thereby contribute to the sustainability of the project.
as the LMB is subject to seasonal changes, three different land cover maps were developed. Seasonal land cover maps for the wet and dry periods were developed as well as an annual land cover map derived from these two maps. The annual Land Cover Map 2010 was then compared with the annual Land Cover Map 2003 to determine land cover changes in the LMB between 2003 and 2010. This clearly showed the importance of a unique land cover assessment method as the Land Cover Map 2003 was derived from a different specification. Mapping these two different classifications resulted in fuzziness in analysing results.
A land cover field-monitoring network was set up across the whole LMB and documented. This vast network, consisting of 703 grids measuring 3 km × 3 km with 9,357 survey points, constitutes a solid basis for further regular land cover updates in the LMB.
Finally, all information and data acquired or generated during the project have been added to the MRC data Portal and are retrievable via the MRC Master Catalogue. This ensures sustainable future use of the investment made in the project.
8.4 Recommendations
Land cover survey projects pose a big logistical challenge to project managers. against this background, it is quite important to agree on a common approach to carry out such projects. Land Cover Classification for the Lower Mekong Basin, as developed during this project, is an important prerequisite to streamline these processes. Secondly, a uniform approach will allow for easy analysis of changes between different land cover survey projects.

Page 69
Member Countries should regularly monitor the established land cover field-monitoring network. Monitoring on a yearly basis would be optimal. The results should be shared with MRCS and also archived there for further analysis. This will ease the very tedious and timely process of acquiring ground-truth data for future land cover survey projects and may also serve as an indicator of ongoing land cover changes between such land cover survey campaigns.
To streamline processes in a new land cover survey project, it would help if the involved parties could agree on using the same tools and methodologies for data processing. This would greatly ease the Qa/QC tasks at MRCS and also help raise the analysis results to a uniform level. a high degree of expertise is required to efficiently carry out land cover updates. However, as the period between updates is several years, there is a risk of know-how getting lost on the procedures and processes to be applied. The aim would be to automate as many processes as possible.
The literature refers to periods of between five and ten years for updating land cover maps to provide a reliable source of information to planners and decision makers. In this sense, the MRC Member Countries should agree on a common return period for updating land cover information in the Lower Mekong Basin. It would be of special benefit to the Member Countries if these surveys could temporally coincide with national activities on this important issue. Following the periodicity of these activities, another land cover update project for the LMB should be considered for carrying out in 2020.
8.5 Lessons Learnt and Limitations
There are six main limitations for lessons learnt from the Land Cover Mapping Project:
• limitations in MAD-CAT software for vector-based operations and classification;
• delayed submission of satellite images (Landsat 5 TM);
• delayed field data collection;
• lack of ground truth data for wet period;
• limitations in hotspot detection from satellite images for field data collection; and
• limitations in different data sets for comparison.
The updating of the land cover map was a pilot project for the LMB with cooperation between FaO and MRCS. The Mad-CaT software from FaO was the main platform for the vector-based operation for satellite-image interpretation and classification. However, the version of this platform is not stable enough to operate big data on a regional scale. Therefore, national experts and operators were necessary to cut areas of interest to smaller sizes until the software could perform properly. This was the main constraint to working smoothly and affected man-hours and man-days of the project timeline.
Conclusions

Page 70
Land Cover Map of the Lower Mekong Basin
The Mad-CaT software could be operated in the Cambodia area only. Other areas applied vector-based operations processed via the arcGIS or MapInfo platform.
The delayed submission of satellite images Landsat 5 TM was also a lesson for project management. The purchase order from MRCS to GISTda and the submission of acceptable images from GISdTa to MRCS were quite delayed, affecting the project timeline for data processing and the following processes of satellite-image interpretation and classification. Project management should buffer time for ordering and submitting data including the timeline for Qa/QC of satellite images before the project kicks off.
Due to limitations in data collection, field data collection could not be done for the wet period. Ground truth data from field data collection during the dry period were applied for the interpretation and accuracy assessment of the land cover map in both dry and wet periods. But the ground truth data did not apply for the annual data set because the annual land cover map was generated by summarising the frequency function of the GIS approach to detect seasonal changes.
Limitations in hotspot detection from satellite images for field data collection was also a lesson learnt from this project. Hotspot detection was applied to select the field survey area by using change detection between two temporal images. The results from hotspot analysis may not significantly detect the specific area, which should be selected as the outstanding field survey area.
In additional, the Land Cover Classification System (LCCS) from FAO focused on biology and physical entities whereas the LMB region has specific landforms. Therefore, future studies involving field data collection for land cover or land use maps should focus on the specific landforms and not apply only hotspot detection from satellite images. For example, field data collection should be performed in specific areas such as Songkhram River Basin in Thailand. This area has flooded forests but the project did not collect the ground truth data. Therefore, it had less field data for flooded forests to do the image interpretation and classification for accuracy assessment.
another limitation is the comparison study between different data sets (comparison between the land cover data in 2003 and 2010 and change detection of land cover in 2010 between dry and wet periods). The land cover map of 2003 has less information than the map of 2010 and the boundaries of the Mekong delta are different. So water bodies and other land cover types in 2003 lack data.
However, policy makers who focus on the dynamics of land cover changes in the LMB can apply change detection analysis for any other studies by using the base map from the standardization of the land cover map of 2010.
Page 71
9 References
Banco, G. (1998) A review of assessing the accuracy of classifications of remotely sensed data and of methods including remote sensing data in forest inventory. Interim report IR-98-081, International Institute for applied Systems analysis, Laxenburg.
Cheeseman, P.; Seif, M.; Kelly, J.; Stutz, J.; Taylor, W.; Freeman, D. (1988) Bayesian Classification. Seventh National Conference on Artificial Intelligence (AAAI-88) Proceedings: 607-611.
Congalton, R.G. (1991) A review of assessing the accuracy of classifications of remotely sensed data, Remote Sensing of Environment, 37: 35-46.
Congalton, R.G.; Green, K. (2009) assessing the accuracy of remotely sensed data - principles and practices. 2nd edition, CRC Press, Taylor & Francis Group, Boca Raton.
Di Gregorio, A; Jansen, L.J.M. (1998) Land Cover Classification System (LCCS): Classification Concepts and User Manual, Food and agriculture Organization of the United Nations, Rome.
Eckhardt, d.W.; Verdin, J.P.; Lyford, G.R. (1990) automated Update of an Irrigated Lands GIS Using SPOT HRV Imagery, Photogrammetric Engineering and Remote Sensing, 56(11): 1515-1522.
Evans, G. (1992) Internal colonisation in the central highlands of Vietnam. Sojourn, 7(2): 274-304.
FAO (2000) Land Cover Classification System, Retrieved May, 2015 from: http://www.fao.org/docrep/003/x0596e/X0596e00.htm#P-1_0.
Fenstermaker, L. (1991) a proposed approach for national to global scale error assessments. In: Proceedings GIS/LIS '91, aSPRS, aCSM, aaG, aM/FM International and URISa, 1: 293-300.
Fitzpatrick-Lins, K. (1981) Comparison of sampling procedures and data analysis for a land-use and landcover map. Photogrammetric Engineering and Remote Sensing, 47(3): 343–351.
Green, K.d.; Kempka, d.; Lackey, L. (1994) Using Remote Sensing to detect and Monitor Land-Cover and Land-Use Change. Photogrammetric Engineering and Remote Sensing, 60: 331-337.
Hay, a. (1979) Sampling designs to test land-use map accuracy. Photogrammetric Engineering and Remote Sensing, 45(4): 529-533.
Heo, J.; FitzHugh, T.W. (2000) a Standardized Radiometrie Normalization Method for Change detection Using Remotely Sensed Imagery. Photogrammetric Engineering and Remote Sensing, 66(2): 173-181.

Page 72
Land Cover Map of the Lower Mekong Basin
Hirsch, P.; Cheong, G. (1996) Natural resource management in the Mekong River Basin: perspectives for australian development Cooperation – Final overview report to ausaId. School of Geoscience, University of Sydney, Sidney, australia.
Jensen, J.R.; Rutchey, K.; Koch, M.S.; Narumalani, S. (1995) Inland Wetland Change detection in the Everglades Water Conservation area 2a Using a Time Series of Normalized Remotely Sensed data, Photogrammetric Engineering and Remote Sensing, 61(2): 199-209.
Jensen, J.R. (1996) Introductory digital Image Processing: a Remote Sensing Perspective, Prentice Hall, Upper Saddle River, New Jersey.
Jensen, J.R. (2005) Introductory digital Image Processing: a Remote Sensing Perspective, 3rd ed., Prentice Hall, Upper Saddle River, New Jersey.
Lu, d.; Mauselb, P.; Brondízioc, E.; Moranac, E. (2004) Change detection Techniques. International Journal of Remote Sensing, 25(12): 2365-2401.
Lu, d.; Moran, E.; Hetrick, S.; Li, G. (2010) Land-Use and Land-Cover Change detection. advances in Environmental Remote Sensing. Taylor&Francis Group, Indiana.
Malgorzata, V. (2010) data acquisition and integration 6., 6 Remote Sensing, Nyugat-magyarországi Egyetem, Hungary.
Mekong River Commission (1997) Mekong River Basin diagnostic study – Final report. Report No. MKG/R. 97010. Bangkok, Thailand.
Mekong River Commission (2003) State of the Basin Report. Phnom Penh, Cambodia.
Mekong River Commission (2005) MRC Information System data Quality Procedures. Phnom Penh, Cambodia.
Mekong River Commission (2009) Reviewed proposal for updating land cover and wetland maps for the Lower Mekong. Information and Knowledge Management Programme. Phnom Penh, Cambodia.
Mekong River Commission (2010a) Project Implementation Plan (2010-2013) on 2009 Updates of Land Cover Maps of the Lower Mekong Basin, Information and Knowledge Management Programme, Phnom Penh, Cambodia.
Mekong River Commission (2010b) Final Proposal on 2009 Updates of Land Cover Maps of the Lower Mekong Basin, Information and Knowledge Management Programme, Phnom Penh, Cambodia.

Page 73
References
Mekong River Commission (2015) Quality assurance and Transformation Parameters for Geographic data. Phnom Penh, Cambodia.
Papadavid G.; Hadjimitsis, D.; Agapiou, A. (2009) Surface reflectance retrieval from Landsat TM/ ETM+ images for monitoring irrigation demand in Cyprus, 29th EaRSeL Symposium, Chania, Crete, dOI: 10.3233/978-1-60750-494-8-166.
Rosenfield, G. (1981) Analysis of variance of thematic mapping experiment data. Photogrammetric Engineering and Remote Sensing, 47(12): 1685-1692.
Rosenfield, G.H.; Fitzpatrick-Lins, K.; Ling, H. (1982) Sampling for thematic map accuracy testing. Photogrammetric Engineering and Remote Sensing, 48: 131-137.
Senseman, G.M.C.; Bagley, C.; Tweddale, S.a. (1995) accuracy assessment of the discrete Classification of Remotely-Sensed Digital Data for Landcover Mapping, US Army Corps of Engineers Construction Engineering USaCERL Technical Report EN-95/04.
Serra, J.; Vincent, L. (1992) an Overview of Morphological Filtering. Circuits, Systems and Signal Processing, 11(1): 47-108.
Singh, a. (1989) digital Change detection Techniques Using Remotely Sensed data. International Journal of Remote Sensing, 10(6): 989-1003.
Snidvongs, a.; Choowaew, S.; Chinvanno, S. (2003) Background paper: Impact of climate change on water and wetland resources in Mekong River Basin: directions for preparedness and action. Regional Centre Report No 12. Southeast asia STaRT, Bangkok, Thailand.
Snidvongs, a.; Teng, S.-K. (2006) Mekong River, Global International Waters assessment Regional assessment 55. UNEP, University of Kalmar, Kalmar, Sweden.
Tuvy (2015) Mekong River. Tuvy Resource Centre, Bangkok, Thailand. Retrieved May, 2015 from: http://www.tuvy.com/Countries/vietnamese/land/mekong_river.htm.
Wehrmann, T. (2004) development and evaluation of methods for automated land use / land cover classification. In: Proceedings Workshop CORINE Land Cover 2000 Workshop, 20-21 January 2004, Berlin.
Yuan, F.; Sawaya, K.E.; Loeffelholz, B.C.; Bauer, M.E. (2005) Land cover classification and change analysis of the Twin Cities (Minnesota) Metropolitan area by multitemporal Landsat remote sensing, Remote Sensing of Environment, 98: 317 - 328.

Page 74
Land Cover Map of the Lower Mekong Basin

Page 75
annex 1: description Card for Field Survey Result
N or S East1142619 665669
a. General Land Cover Information
RELEVEE NO. VN828220791205
aREa NaME Tien Giang, Cho Gao
LOCaTION an Thanh Thuy
OBSERVER Le Vu Tuan
daTE 2011/11/21
TIME 13:50
RELEVEE SIZE 90000
LaT/LONG UTM GPS Topo Map V V
Film Roll No
Photo Shot No Position
P07912N 1
P07912E 2
P07912S 3
P07912W 4
On the spot Observing the spot from a distance
Indicate Relative Positionof Coordinates
distance from viewpoint to observed point (m)The bearing of the observed point ( º )
FIELd SaMPLECOORdINaTE
aCCESSIBILITY
FIELd PHOTOGRaPHS
Relative Position of photograph
(in m2 or ha)
N or S East LaT/LONG UTM GPS Topo MapCOORdINaTES
Very GoodV Good Medium Bad
N
N 81
34 2
7
5
6
2
1
S
3
5
V
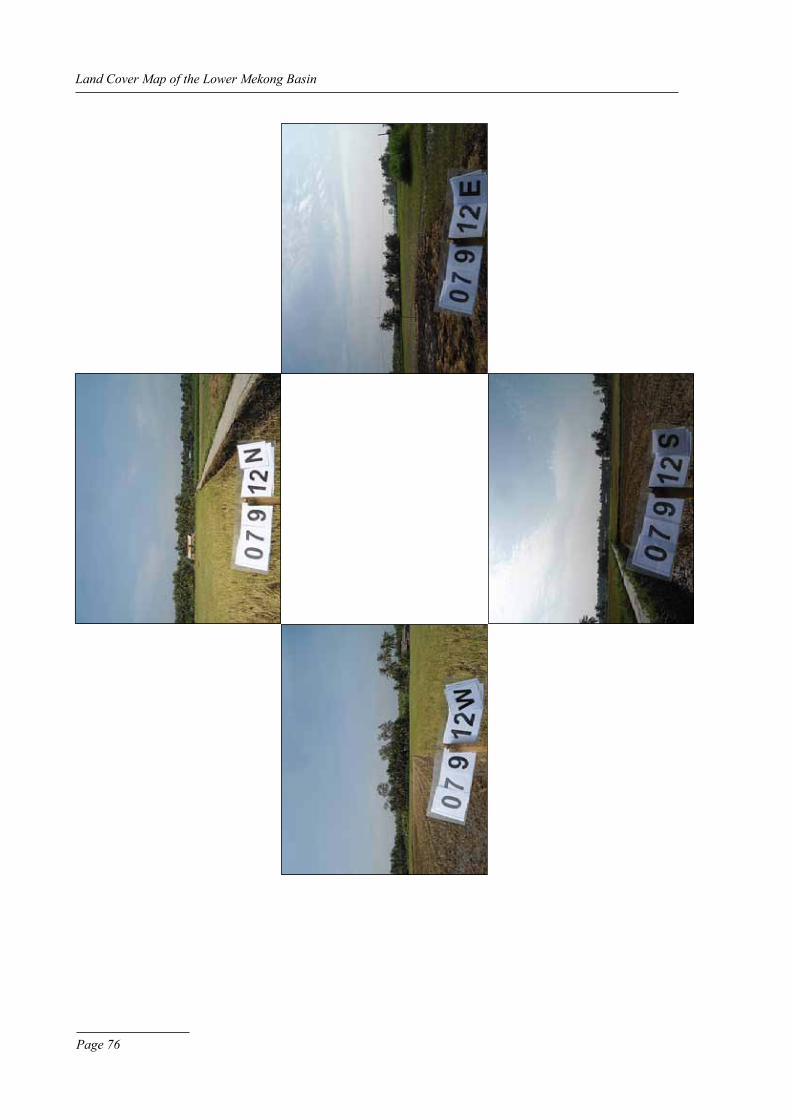
Page 76
Land Cover Map of the Lower Mekong Basin

Page 77
Annex 1: Description Card for Field Survey Result
Comparisons between photo feature and satellite image feature at 1:25,000 scale (R.G.B) = (5.4.3)

Page 78
Land Cover Map of the Lower Mekong Basin
General Landform(Slope)
Flat to Gently Sloping Terrain ( 0 - 7 % )
Bằng phẳng ( 0 - 7 % )
B. General Land Cover Information
General Description of Land Cover Types(English and National Languages)
General Land Cover Type ReleveeSite: Vegetated & TerrestrialSpecific Land Cover Type: Single major land cover aspect - Cultivated
Khái quát về lớp phủ: có thực vật & không ngập nướcLớp phủ: Đồng nhất - Cây trồng
aREa LaNdCOVER HOMOGENITY (applicable if on spot)
Land Cover Homogeneous for more than 300 m V Yesaround the sample area: No
Land Cover Seasonal Aspects (English and National Languages)
Cultivated herbs in the harvested stage.
Dạng cỏ trồng, trong giai đoạn thu hoạch.
V
V150 m
150 mVVV
V
V
V

Page 79
Annex 1: Description Card for Field Survey Result
C. Specific Land Cover Information
Natural and Semi-Natural (English and National Languages)
Cultivated Terrestrial Area And Managed Tioninformation (English and National Languages)
Life form of main crop: Graminoids; Crop Name: Winter-Spring riceLife form of second crop: Graminoids; Crop Name: Summer-autumn rice
Average field size: 40000 m2
Field distribution: Bordering FieldsCultivation period: main crop, during two or more different periods within same yearCultivation Time Factor: =<1 yearWater Supply / Irrigation: Supplementary IrrigationTypes of supplimentary Irrigation: Sprinkler
Cây trồng chính, vụ thứ 1: Lúa; Cây trồng/Vụ: Lúa Đông Xuân (ĐX)Cây trồng phụ, vụ thứ 2: Lúa; Cây trồng/Vụ: Lúa Hè Thu (HT)
Kích thước cánh đồng : 40000 m2
Tình trạng phân bố đồng ruộng: Ruộng có bờ thửaChu kỳ gieo trồng: vụ chính, của vụ chính khác với các vụ khác trong năm (cây lâu năm, 1 vụ, 3 vụ)Vòng lặp gieo trồng: =<1 nămKhả năng cấp nước: Có tướiPhương thức tưới: Tưới sũng nước (vd: Lúa)

Page 80
Land Cover Map of the Lower Mekong Basin
Bare Areas (English and National Languages)
Comments / Observations(English and National Languages)
General land cover type is Vegetated Terrestrial areas, which is single major land cover aspect with Cultivated land cover type.
Cultivated herbs in the harvested stage.
3 rice crops (WS-SS-Sa).
Vùng có thực vật và không ngập nước, lớp phủ đồng nhất - Cây trồng.
Dạng cỏ trồng, trong giai đoạn thu hoạch.
3 vụ Lúa (ĐX-XH-HT).

Page 81
Field Surveys in the Four Countries
Cambodia In Cambodia, national consultants were selected to conduct the field survey with technical staff from the Cambodian National Mekong Committee (CNMC) and IKMP. The survey targeted 2,595 points in 173 areas in 17 provinces, although three areas in Preah Vihear province could not be reached due to security issues. data was collected from 1,851 of the target points, amounting to 71 percent of the total.
The survey classified land cover according to 14 classes drawn from the 19 classes designated for the project. Paddy Rice covered almost 29 percent of the land surveyed and deciduous Forests amounted to more than 24 percent. Other major types of land cover were annual Crops other than Paddy Rice (12 percent), urban areas (11 percent), Evergreen Forests (9 percent) and Shrubland (7 percent).
Lao PDRWorking with experts from the Forest Resources Information Center and the Natural Resources and Environment Institute, the Lao National Mekong Committee (LNMC) focused on 17 provinces. The field survey had six teams targetting 3,165 points in 211 areas. The teams reached 176 of the areas (83 percent) and 2,725 points (86 percent). alternative locations were targeted for 35 areas in three provinces that could not be reached for various reasons. These ranged from military activities and the presence of land mines or land concessions to inaccessibility during the wet period and absence of local guides. alternative areas were between 30 and 50 kilometres from the areas originally targeted.
deciduous Forest covered 29 percent of the land surveyed with Shrubland ranking second at 21 percent. Other major classes were Paddy Rice (14 percent) and Evergreen Forest (12 percent) followed by annual Crops other than Paddy Rice (5 percent) and Urban areas (4 percent).
annex 2

Page 82
Land Cover Map of the Lower Mekong Basin
ThailandThe Thai National Mekong Committee (TNMC) implemented the land cover survey through the Land development department to which it provides technical and administrative support. data collection focussed on 2,460 survey points in 164 target areas in 24 provinces. Survey teams reached 2,455 points or 99.8 percent of those targetted. Some points were shifted because they were in inaccessible locations, national forests, water bodies or restricted areas.
Fifteen types of land cover were observed. Paddy Rice was the most common, accounting for 44 percent of the locations surveyed. Rice fields were mostly distributed in flat to gently sloping terrain and were mostly rainfed. Other annual Crops including corn, cassava, sugarcane and pineapples ranked second (17 percent). Next came Urban areas (16 percent), deciduous Forest including rubber, eucalyptus and teak (8 percent) and Industrial Plantations such as rubber, oil palm and timber (7 percent). Orchards (2 percent) included longan, mango, orange, tamarind, banana, coconut, custard apple, dragon fruit and jackfruit.
Viet NamThrough experts from the Sub-National Institute for agricultural Planning and Projection, the Vietnam National Mekong Committee (VNMC) targetted 2,325 points in 155 areas. The surveys covered 18 provinces including 11 in the Mekong delta and 5 in the Central Highlands. also included were part of dien Bien Province in northwestern Viet Nam and the Huong Hoa region of Quang Tri province in the central coastal region.
Paddy Rice covered 29 percent of the land area surveyed. Orchards were the next most common type of cover (21 percent) followed by Industrial Plantations (15 percent). among other major types of land cover were Broadleaved Evergreen Forest and annual Crops (both 7 percent) and Urban areas and aquaculture (both 6 percent).


Mekong River Commission
Office of the Secretariat in Phnom Penh (OSP)576 National Road, #2, Chak angre Krom,
P.O. Box 623, Phnom Penh, CambodiaTel. (855-23) 425 353 Fax. (855-23) 425 363
Office of the Secretariat in Vientiane (OSV) Office of the Chief Executive Officer 184 Fa Ngoum Road, P.O. Box 6101,
Vientiane, Lao PdRTel. (856-21) 263 263 Fax. (856-21) 263 264
© Mekong River CommissionE-mail: [email protected]: www.mrcmekong.org