land seismic techniques for high-quality data
TRANSCRIPT
28 Oilfield Review
Land Seismic Techniques for High-Quality Data
Innovative seismic techniques are energizing exploration and development activities
in onshore areas, many of which have proved difficult to image in the past. New
seismic sources, acquisition methods and processing approaches help illuminate
reservoirs hidden beneath complex near-surface layers.
Claudio BagainiOslo, Norway
Tim BuntingKuala Lumpur, Malaysia
Adel El-EmamKuwait Oil CompanyKuwait City, Kuwait
Andreas LaakeClaudio Strobbia Gatwick, England
Oilfield Review Summer 2010: 22, no. 2. Copyright © 2010 Schlumberger.For help in preparation of this article, thanks to Abdulmohsin Al-Dulaijan, South Rub Al-Khali Co. Ltd, South Rub Al-Khali, Saudi Arabia; Jarrah Al-Genai, Kuwait Oil Company, Kuwait City, Kuwait; Danny Burns, Beach Petroleum, Adelaide, South Australia, Australia; Daniele Colombo, Saudi Aramco, Dhahran, Saudi Arabia; Dennis Cooke, Santos, Perth, Western Australia, Australia; Tim Dean, Tom Heesom, Anthony McGlue, John Quigley, Paul Taylor and Richard Whitebread, Gatwick, England; Benjamin Jeffryes, Cambridge, England; Leif Larsen, Perth, South Australia; Marco Mantovani, Milan, Italy; Denis Sweeney, Dubai, UAE; Randall Taylor, Origin Energy Limited, Brisbane, Queensland, Australia; and Pieter van Mastrigt, Brunei Shell Petroleum Company, Brunei.dBX, Desert Explorer, DX-80, MD Sweep, Q-Land, Q-Technology and UniQ are marks of Schlumberger.
Since the first land seismic surveys, performed in the 1920s, the quality of data has improved dra-matically through the use of better survey design practices, acquisition techniques and data pro-cessing. Despite these advances, seismic surveys still may deliver disappointing results in several challenging parts of the world—including some with significant onshore reserves.
Often, the cause of inadequate imaging of deep structures lies in the presence of geologic complexity near the surface. Variations in topog-raphy and in the velocity of near-surface layers create distortions in the seismic signal. Strongly refractive layers near the surface can prevent deep penetration of seismic energy, as can inter-vals of anomalously low velocity. Abrupt lateral changes in near-surface properties warp raypaths and weaken the effectiveness of traditional pro-cessing methods. Provinces with rough topogra-phy, surface dunes, permafrost and buried soft layers are notorious for the obstacles they pre-sent to exploration; companies prospecting in these regions have learned to temper their expectations of seismic surveys.
Recent advances in land seismic data acquisi-tion and processing are enhancing imaging in these problem areas. Advanced sources, optimized acquisition practices and improved processing algorithms are producing seismic data rich in usable content, resulting in superior structural imaging and successful inversion for reservoir properties without compromising acquisition efficiency. Sophisticated evaluation of signals—
particularly those usually considered purely noise—is enabling subsurface imaging in areas that previously yielded poor results. With addi-tional information, such as gravity, electromag-netic or remote-sensing data, uncertainty in near-surface properties can be minimized, thereby improving imaging of deep targets.
This article describes developments in land seismic data acquisition and processing to help oil and gas companies obtain effective results in geographic areas that have proved difficult to image in the past. Among the acquisition innova-tions are high-performance explosive and vibra-tor sources, a new way of activating vibrators that extends the bandwidth of seismic energy imparted to the earth and techniques for deploying multiple vibrators to acquire data more efficiently. New pro-cessing methods involve characterizing near-sur-face properties using additional information from surface waves and other geophysical surveys.
Because these advances rely on the enabling technologies of point-receiver acquisition and continuous recording available with the most up-to-date land seismic systems, a brief review of these systems is in order.
The Point of Point ReceiversPoint-receiver acquisition involves recording traces from individual receivers rather than sum-ming the responses of a group or array of receivers before recording the summed trace (next page, bottom). Conventional seismic acquisition uses group summing to attenuate coherent noise, which is assumed to travel horizontally, and to
1. Quigley J: “An Integrated 3D Acquisition and Processing Technique Using Point Sources and Point Receivers,” Expanded Abstracts, 74th SEG International Exposition and Annual Meeting, Denver (October 10–15, 2004): 17–20.
Ait-Messaoud M, Boulegroun M-Z, Gribi A, Kasmi R, Touami M, Anderson B, Van Baaren P, El-Emam A, Rached G, Laake A, Pickering S, Moldoveanu N and Özbek A: “New Dimensions in Land Seismic Technology,” Oilfield Review 17, no. 3 (Autumn 2005): 42–53.
2. Papworth S: “Stepping Up Land Seismic,” E&P (March 1, 2009), http://www.epmag.com/Magazine/2009/3/item31469.php (accessed May 11, 2010).
31424schD6R1.indd 28 7/30/10 7:59 PM

Summer 2010 29
enhance signal, which is assumed to travel verti-cally. However, summing the responses of a group of receivers before recording the signal reduces flexibility in subsequent processing. Furthermore, the presence of near-surface heterogeneities can complicate the desired enhancement of verti-cally traveling signals sought by grouping. Also, a trace resulting from group summation generally contains only the low end of the bandwidth of the original individual traces.
WesternGeco pioneered point-receiver land seismic acquisition and processing in 2002 with the Q-Land single-sensor system, capable of recording 30,000 live channels.1 The new- generation UniQ integrated point-receiver system, introduced in 2009, relies on the same principle of using a large number of receivers—up to 150,000—to sample the signal and noise in the seismic wavefield.2 Compared with conventional approaches that deploy fewer live channels, the point-receiver approach allows much lower overall sensor density on the ground yet provides superior signal-to-noise ratio (S/N) and frequency content.
Oilfield ReviewSummer 10Land Seismic Fig. OpenerORSUM10-LNDSMC Fig. Opener> Point-receiver acquisition. In land seismic acquisition, receivers (inverted triangles) are deployed
on the ground surface (green). In this case the ground is an uneven surface, which causes signal arrival times (red) to vary. Conventional acquisition (top) sums the responses of several receivers before recording. Arrival-time variations are averaged and the resulting sum is a broader signal than that of the originals. Point-receiver technology (bottom) records a trace from every receiver and applies corrections to each of the traces before they are summed, resulting in a compact signal with high signal-to-noise ratio. The seismic image created from point-receiver acquisition (bottom right) is usually of higher resolution than that obtained from grouped acquisition (top right).
Copyright Andreas Laake.
Oilfield ReviewSummer 10Land Seismic Fig. 1ORSUM10-LNDSMC Fig. 1
100m
Q-Technology point receivers Trace-by-trace correctionsbefore grouping
Conventional groups No correctionsbefore grouping
Conventional image
Q-Technology image
31424schD6R1.indd 29 7/30/10 7:59 PM
30 Oilfield Review
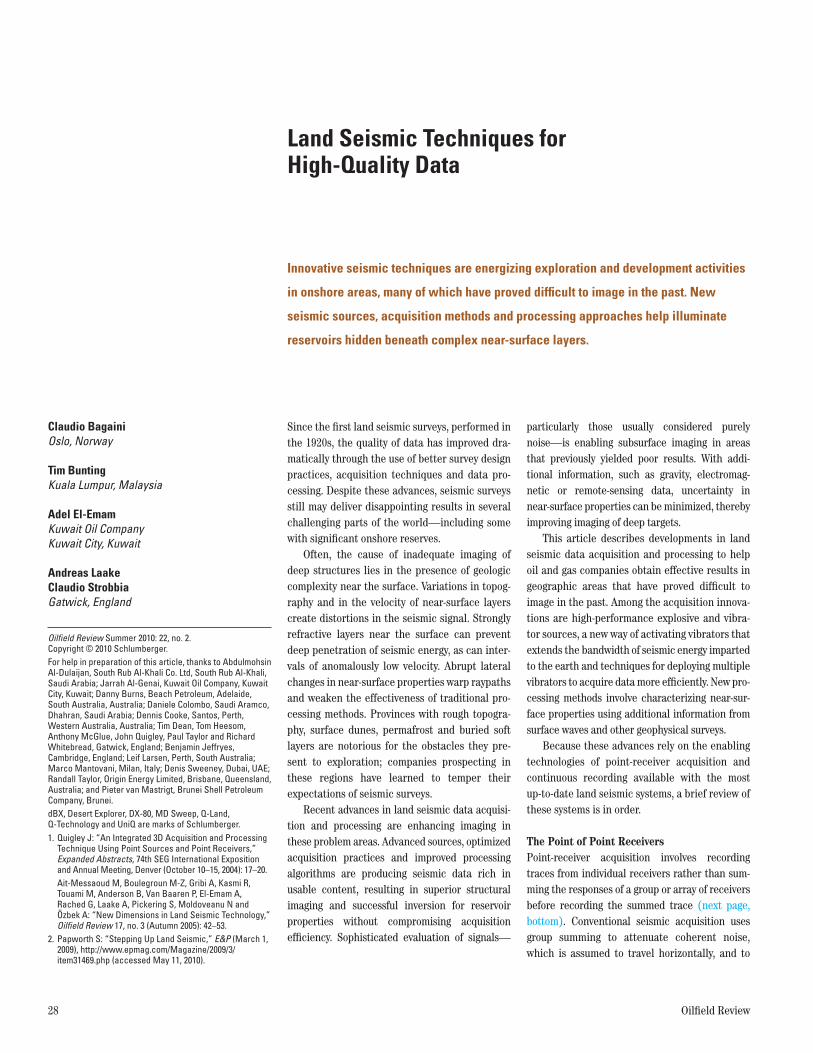
Signal preservation and noise removal in the point-receiver approach are achieved in part by a digital process that enhances the signal by sum-ming recorded traces into groups at the spacing required to correctly image the target without aliasing.3 Before summation, individual traces undergo noise-removal processing: Random noise
is removed on a trace-by-trace basis by proprie-tary programs; statics, or time shifts, are applied to correct for elevation and other traveltime differences; and amplitude compensations cor-rect for variations in coupling of the source or receiver to the earth. Noise that is coherent from trace to trace, such as source-generated noise—ground roll, for instance—is removed by filters that perform effectively because the noise is not aliased (above).
Sources of Seismic EnergyEnhancing the receiving end of the acquisition process is just half the story. Recent advances in source technology are further improving data quality by putting more seismic energy into the earth at a wider range of frequencies.
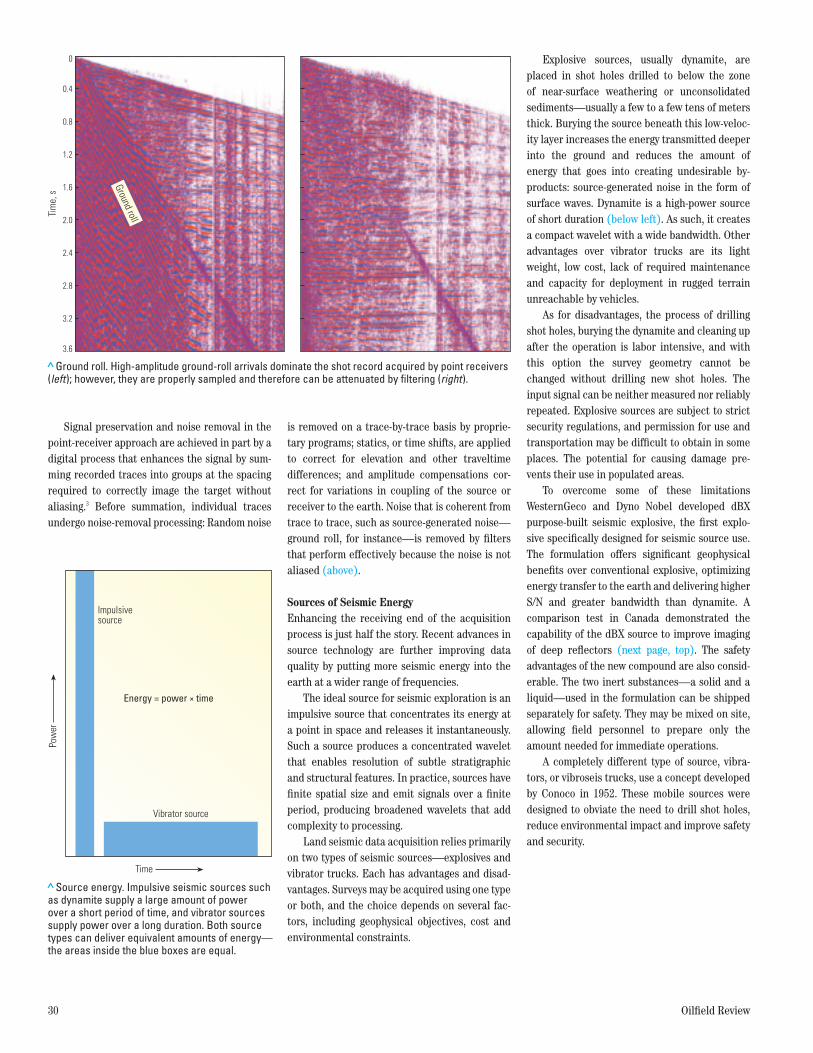
The ideal source for seismic exploration is an impulsive source that concentrates its energy at a point in space and releases it instantaneously. Such a source produces a concentrated wavelet that enables resolution of subtle stratigraphic and structural features. In practice, sources have finite spatial size and emit signals over a finite period, producing broadened wavelets that add complexity to processing.
Land seismic data acquisition relies primarily on two types of seismic sources—explosives and vibrator trucks. Each has advantages and disad-vantages. Surveys may be acquired using one type or both, and the choice depends on several fac-tors, including geophysical objectives, cost and environmental constraints.
Explosive sources, usually dynamite, are placed in shot holes drilled to below the zone of near-surface weathering or unconsolidated sediments—usually a few to a few tens of meters thick. Burying the source beneath this low-veloc-ity layer increases the energy transmitted deeper into the ground and reduces the amount of energy that goes into creating undesirable by-products: source-generated noise in the form of surface waves. Dynamite is a high-power source of short duration (below left). As such, it creates a compact wavelet with a wide bandwidth. Other advantages over vibrator trucks are its light weight, low cost, lack of required maintenance and capacity for deployment in rugged terrain unreachable by vehicles.
As for disadvantages, the process of drilling shot holes, burying the dynamite and cleaning up after the operation is labor intensive, and with this option the survey geometry cannot be changed without drilling new shot holes. The input signal can be neither measured nor reliably repeated. Explosive sources are subject to strict security regulations, and permission for use and transportation may be difficult to obtain in some places. The potential for causing damage pre-vents their use in populated areas.
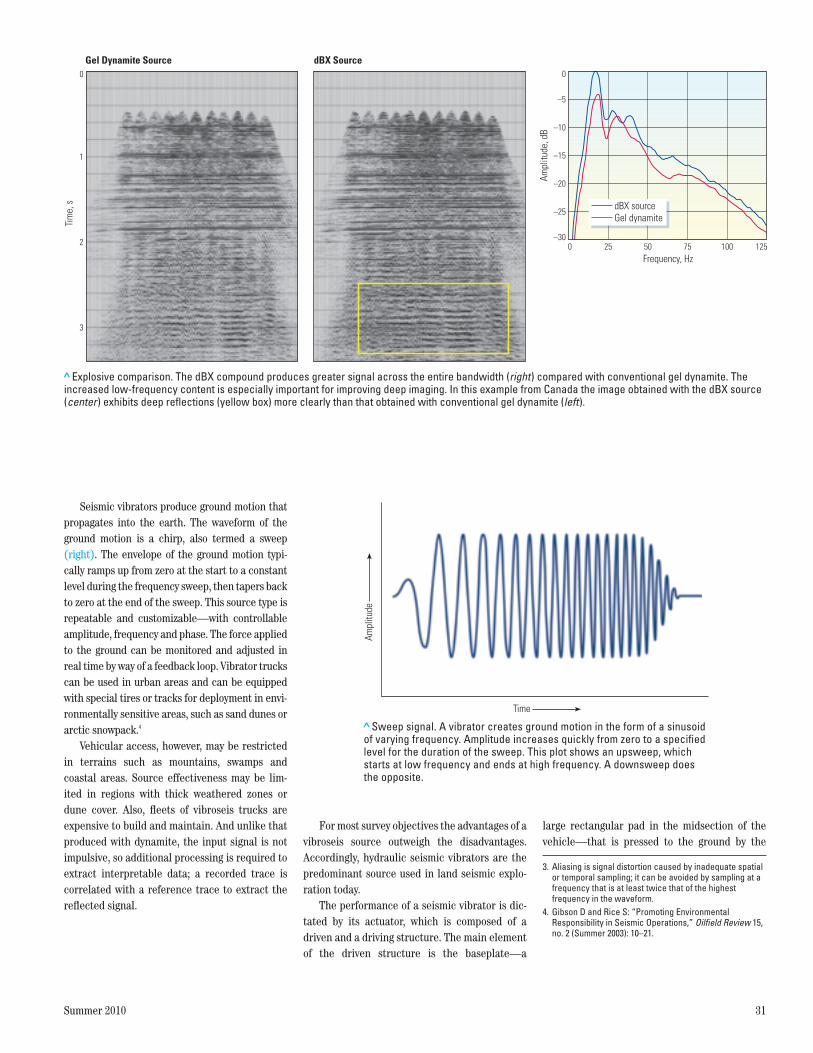
To overcome some of these limitations WesternGeco and Dyno Nobel developed dBX purpose-built seismic explosive, the first explo-sive specifically designed for seismic source use. The formulation offers significant geophysical benefits over conventional explosive, optimizing energy transfer to the earth and delivering higher S/N and greater bandwidth than dynamite. A comparison test in Canada demonstrated the capability of the dBX source to improve imaging of deep reflectors (next page, top). The safety advantages of the new compound are also consid-erable. The two inert substances—a solid and a liquid—used in the formulation can be shipped separately for safety. They may be mixed on site, allowing field personnel to prepare only the amount needed for immediate operations.
A completely different type of source, vibra-tors, or vibroseis trucks, use a concept developed by Conoco in 1952. These mobile sources were designed to obviate the need to drill shot holes, reduce environmental impact and improve safety and security.
> Ground roll. High-amplitude ground-roll arrivals dominate the shot record acquired by point receivers (left); however, they are properly sampled and therefore can be attenuated by filtering (right).
Tim
e, s
0
0.4
0.8
1.2
1.6
2.0
2.4
2.8
3.2
3.6
Ground roll
Oilfield ReviewSummer 10Land Seismic Fig. 2ORSUM10-LNDSMC Fig. 2
> Source energy. Impulsive seismic sources such as dynamite supply a large amount of power over a short period of time, and vibrator sources supply power over a long duration. Both source types can deliver equivalent amounts of energy—the areas inside the blue boxes are equal.
Oilfield ReviewSummer 10Land Seismic Fig. 3ORSUM10-LNDSMC Fig. 3
Time
Pow
er
Vibrator source
Impulsivesource
Energy = power time
31424schD6R1.indd 30 7/30/10 7:59 PM
Summer 2010 31
Seismic vibrators produce ground motion that propagates into the earth. The waveform of the ground motion is a chirp, also termed a sweep (right). The envelope of the ground motion typi-cally ramps up from zero at the start to a constant level during the frequency sweep, then tapers back to zero at the end of the sweep. This source type is repeatable and customizable—with controllable amplitude, frequency and phase. The force applied to the ground can be monitored and adjusted in real time by way of a feedback loop. Vibrator trucks can be used in urban areas and can be equipped with special tires or tracks for deployment in envi-ronmentally sensitive areas, such as sand dunes or arctic snowpack.4
Vehicular access, however, may be restricted in terrains such as mountains, swamps and coastal areas. Source effectiveness may be lim-ited in regions with thick weathered zones or dune cover. Also, fleets of vibroseis trucks are expensive to build and maintain. And unlike that produced with dynamite, the input signal is not impulsive, so additional processing is required to extract interpretable data; a recorded trace is correlated with a reference trace to extract the reflected signal.
For most survey objectives the advantages of a vibroseis source outweigh the disadvantages. Accordingly, hydraulic seismic vibrators are the predominant source used in land seismic explo-ration today.
The performance of a seismic vibrator is dic-tated by its actuator, which is composed of a driven and a driving structure. The main element of the driven structure is the baseplate—a
large rectangular pad in the midsection of the vehicle—that is pressed to the ground by the
3. Aliasing is signal distortion caused by inadequate spatial or temporal sampling; it can be avoided by sampling at a frequency that is at least twice that of the highest frequency in the waveform.
4. Gibson D and Rice S: “Promoting Environmental Responsibility in Seismic Operations,” Oilfield Review 15, no. 2 (Summer 2003): 10–21.
> Explosive comparison. The dBX compound produces greater signal across the entire bandwidth (right) compared with conventional gel dynamite. The increased low-frequency content is especially important for improving deep imaging. In this example from Canada the image obtained with the dBX source (center) exhibits deep reflections (yellow box) more clearly than that obtained with conventional gel dynamite (left).
Oilfield ReviewSummer 10Land Seismic Fig. 4ORSUM10-LNDSMC Fig. 4
0 25 50 75 100 125
0
–5
–10
–15
–20
–25
–30
Frequency, Hz
Ampl
itude
, dB
Gel dynamitedBX source
0
1
2
3
Tim
e, s
Gel Dynamite Source dBX Source
> Sweep signal. A vibrator creates ground motion in the form of a sinusoid of varying frequency. Amplitude increases quickly from zero to a specified level for the duration of the sweep. This plot shows an upsweep, which starts at low frequency and ends at high frequency. A downsweep does the opposite.
Oilfield ReviewSummer 10Land Seismic Fig. 5ORSUM10-LNDSMC Fig. 5
Time
Ampl
itude
31424schD6R1.indd 31 7/30/10 7:59 PM
32 Oilfield Review
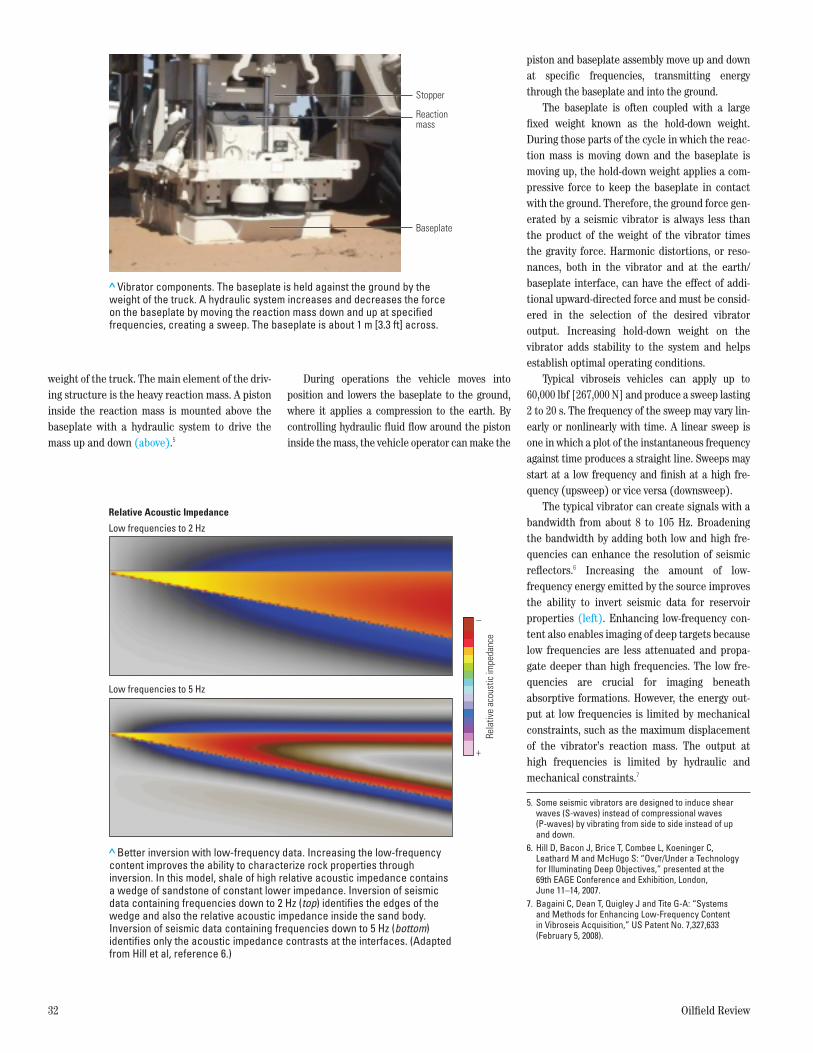
weight of the truck. The main element of the driv-ing structure is the heavy reaction mass. A piston inside the reaction mass is mounted above the baseplate with a hydraulic system to drive the mass up and down (above).5
During operations the vehicle moves into position and lowers the baseplate to the ground, where it applies a compression to the earth. By controlling hydraulic fluid flow around the piston inside the mass, the vehicle operator can make the
5. Some seismic vibrators are designed to induce shear waves (S-waves) instead of compressional waves (P-waves) by vibrating from side to side instead of up and down.
6. Hill D, Bacon J, Brice T, Combee L, Koeninger C, Leathard M and McHugo S: “Over/Under a Technology for Illuminating Deep Objectives,” presented at the 69th EAGE Conference and Exhibition, London, June 11–14, 2007.
7. Bagaini C, Dean T, Quigley J and Tite G-A: “Systems and Methods for Enhancing Low-Frequency Content in Vibroseis Acquisition,” US Patent No. 7,327,633 (February 5, 2008).
piston and baseplate assembly move up and down at specific frequencies, transmitting energy through the baseplate and into the ground.
The baseplate is often coupled with a large fixed weight known as the hold-down weight. During those parts of the cycle in which the reac-tion mass is moving down and the baseplate is moving up, the hold-down weight applies a com-pressive force to keep the baseplate in contact with the ground. Therefore, the ground force gen-erated by a seismic vibrator is always less than the product of the weight of the vibrator times the gravity force. Harmonic distortions, or reso-nances, both in the vibrator and at the earth/baseplate interface, can have the effect of addi-tional upward-directed force and must be consid-ered in the selection of the desired vibrator output. Increasing hold-down weight on the vibrator adds stability to the system and helps establish optimal operating conditions.
Typical vibroseis vehicles can apply up to 60,000 lbf [267,000 N] and produce a sweep lasting 2 to 20 s. The frequency of the sweep may vary lin-early or nonlinearly with time. A linear sweep is one in which a plot of the instantaneous frequency against time produces a straight line. Sweeps may start at a low frequency and finish at a high fre-quency (upsweep) or vice versa (downsweep).
The typical vibrator can create signals with a bandwidth from about 8 to 105 Hz. Broadening the bandwidth by adding both low and high fre-quencies can enhance the resolution of seismic reflectors.6 Increasing the amount of low- frequency energy emitted by the source improves the ability to invert seismic data for reservoir properties (left). Enhancing low-frequency con-tent also enables imaging of deep targets because low frequencies are less attenuated and propa-gate deeper than high frequencies. The low fre-quencies are crucial for imaging beneath absorptive formations. However, the energy out-put at low frequencies is limited by mechanical constraints, such as the maximum displacement of the vibrator’s reaction mass. The output at high frequencies is limited by hydraulic and mechanical constraints.7
> Vibrator components. The baseplate is held against the ground by the weight of the truck. A hydraulic system increases and decreases the force on the baseplate by moving the reaction mass down and up at specified frequencies, creating a sweep. The baseplate is about 1 m [3.3 ft] across.
Oilfield ReviewSummer 10Land Seismic Fig. 6ORSUM10-LNDSMC Fig. 6
Stopper
Reactionmass
Baseplate
> Better inversion with low-frequency data. Increasing the low-frequency content improves the ability to characterize rock properties through inversion. In this model, shale of high relative acoustic impedance contains a wedge of sandstone of constant lower impedance. Inversion of seismic data containing frequencies down to 2 Hz (top) identifies the edges of the wedge and also the relative acoustic impedance inside the sand body. Inversion of seismic data containing frequencies down to 5 Hz (bottom) identifies only the acoustic impedance contrasts at the interfaces. (Adapted from Hill et al, reference 6.)
Relative Acoustic Impedance
Low frequencies to 5 Hz
Low frequencies to 2 Hz
Oilfield ReviewSummer 10Land Seismic Fig. 7ORSUM10-LNDSMC Fig. 7
Rela
tive
acou
stic
impe
danc
e
–
+
31424schD6R1.indd 32 7/30/10 7:59 PM

Summer 2010 33
Oilfield ReviewSummer 10Land Seismic Fig. 9ORSUM10-LNDSMC Fig. 9
Two-
way
tim
e, s
0
1
2
3
4
Linear Sweep MD Sweep Nonlinear Sweep
70
65
60
55
50
45
404 6 8 10 12 14 16
Frequency, Hz
Pow
er s
pect
ral d
ensi
ty, d
B
MD Sweepnonlinear sweep
Linear sweep
New VibrationsTo overcome these limitations, WesternGeco developed two related source technologies: the 80,000-lbf [356,000-N] DX-80 vibrator and the MD Sweep maximum displacement vibration methodology. Together these systems enhance the generation of both low- and high-frequency energy delivered to the subsurface.
The DX-80 vehicle has a unique actuator design that extends the high-frequency content to more than 150 Hz, an improvement over the 105 Hz achievable from conventional vibrators. The vehicle’s greater weight imparts more energy to the formation to enhance the signal-to-noise ratio. Also, the vehicles can be equipped with rubber tracks, which offers several advantages: In soft sand the enhanced traction enables the vehicle to move to the next source location more quickly, speeding up acquisition (right). A tracked vehicle is more maneuverable, maintains a straighter line and does not have to detour around obstacles. It can climb steep slopes, cut-ting the amount of time spent bulldozing or otherwise preparing lines and thus minimizing environmental impact.
At the other end of the spectrum, the MD Sweep approach increases the low-frequency content of the signal. The method helps geophysi-cists design an optimized nonlinear sweep that spends more time generating the frequencies that need to be strengthened. This technique can add up to one and a half octaves of full-power, low-fre-
quency bandwidth over what is possible using con-ventional practices. A DX-80 vibrator using the MD Sweep technique can extend signal bandwidth to below 3 Hz, greatly improving imaging results at depth. A test in the Middle East highlights the superiority of the nonlinear maximum displace-ment sweep in generating low frequencies and illuminating deep reflectors (below).
> A fleet of WesternGeco DX-80 vibrators. The 80,000-lbf Desert Explorer vibrator can be equipped with tracks for use in soft-surface environments.
Oilfield ReviewSummer 10Land Seismic Fig. 8ORSUM10-LNDSMC Fig. 8
> Linear and nonlinear sweeps. These lines (top) from a Middle East survey were shot with the DX-80 seismic vibrator source but with different sweeps. The results of the MD Sweep methodology (right) show better definition of deep reflectors (green box) than the results of the linear sweep (top left). The deep imaging capability of the nonlinear sweep is due to the addition of frequencies lower than 8 Hz in the power spectrum (bottom left).
31424schD6R1.indd 33 7/30/10 7:59 PM

34 Oilfield Review
Santos and its joint-venture partners Origin Energy and Beach Energy used this combination of technologies to help map reservoir thickness and sand quality in a pilot project in the Cooper basin of Australia.8 Log data from a nearby field indicated that reservoir quality, driven by low clay content, could be linked to low Poisson’s ratio.9 Part of the pilot study involved investigat-ing the ability to invert high-resolution seismic data for Poisson’s ratio and other attributes.
Earlier efforts with grouped receivers and conventional vibrators produced a signal band-width of 8.5 to 83 Hz at the depth of interest. A survey acquired with the Q-Land point-receiver system and the advanced source technology achieved a bandwidth of 5.1 to 92 Hz and deliv-ered a clearer image of the target (left).
The new survey produced coherent signals with some frequency content even below 4 Hz at the reservoir depth (next page, top). Including the wider bandwidth in seismic inversion pro-duced a more detailed picture of Poisson’s ratio than was previously available (below left).
Improving ProductivityVibrators can be deployed individually or as a group—often with four trucks operating simulta-neously at one source location. After the pre-scribed number of sweeps is completed, the baseplates are raised and the vehicles “move up” to the next location, typically a distance of 10 to 50 m [33 to 160 ft]. Meanwhile, signals from sub-surface reflectors continue to be recorded by the recording truck for 4 to 6 seconds, a period called the “listen time.” For an 8-s sweep duration and 8-s move-up time, a minimum of 16 s is required between sweeps (next page, bottom). Cycle time, or the interval between two consecutive sweeps, is the main limiting factor for productivity of land seismic crews. Productivity, or the number of seismic traces recorded in a given time, can be increased by using more than one fleet; a second fleet begins its sweep immediately following the listen time of the first fleet’s sweep. This method, called flip-flop acquisition, is currently in wide-spread practice.
Another factor that limits productivity is the finite record length of traces acquired by conven-tional systems. These systems typically record for only 30 to 60 s before they have to stop and write the data to a hard disk. Efficient field deployment of high-productivity vibroseis methods also requires that the seismic crew be capable of redeploying the receiver lines quickly.
Several techniques have been developed to improve the vibroseis productivity that can be obtained with flip-flop acquisition, mainly by
> Pilot project in Australia. Point-receiver acquisition with the DX-80 vibrator and MD Sweep design produced a seismic image with better definition than that achieved with grouped receivers and conventional vibrators (top). The new survey increased signal bandwidth by almost one octave (bottom).
Oilfield ReviewSummer 10Land Seismic Fig. 10ORSUM10-LNDSMC Fig. 10
Conventional AcquisitionPoint-Receiver Acquisition withDX-80 Vibrator and MD Sweep Design
Two-
way
tim
e, m
s
1,400
1,500
1,600
1,700
1,800
1,900
2,000
2,100
Conventional bandwidthFrom 8.5 Hz to 83 Hz = 74.5 Hz
3.2 Octaves
Q-Land bandwidthFrom 5.1 Hz to 92 Hz = 86.9 Hz
4.2 Octaves
0 20 40 60 80 100Frequency, Hz
20
25
30
35
40
45
Ampl
itude
, dB
> Inversion for Poisson’s ratio. The broader bandwidth of the new survey produced inversion results with improved apparent definition of zones of low Poisson’s ratio (ovals) in the reservoir interval (right) compared with that of the conventional survey (left). Log values of Poisson’s ratio are shown at three well locations (purple).
Poisson’s Ratio
Two-
way
tim
e, s
1.3
1.4
1.5
1.6
1.7
1.8
1.9
2.0
2.1
Conventional acquisitionQ-Land acquisition with DX-80 sourceand MD Sweep design
0.10 0.25 0.40Poisson’s ratio
Oilfield ReviewSummer 10Land Seismic Fig. 12ORSUM10-LNDSMC Fig. 12
31424schD6R1.indd 34 7/30/10 7:59 PM

Summer 2010 35
deploying many fleets of vibrators. These tech-niques can be grouped into three categories: cascaded sweeps, simultaneous shooting and slip-sweep acquisition.10 Cascaded sweeps elimi-nate the listen time between sweeps when more than one sweep is needed at each shot location.
In simultaneous shooting two or more groups of vibrators generate orthogonal sweeps at nearly the same time.11 The simultaneously acquired records are then separated at the processing stage.12
During slip-sweep acquisition a second vibra-tor group starts its sweep before the end of the listen time of the first sweep.13 This overlapping approach is different from simultaneous shooting in that it does not require the vibrators to be ready at their locations at the same time. However, harmonic noise from adjacent sweeps can leak into each other, contaminating the records. Numerous methods have been developed to suppress the harmonic noise and separate the shot records without affecting slip-sweep data quality.14 Some of these acquisition techniques can be used in combination for additional pro-ductivity improvement.
Geophysicists strive to find the most produc-tive vibroseis acquisition technique that pre-serves data quality. Once the acquisition parameters are set, including sweep length and number of sources, the effectiveness of any of these techniques at preserving data quality can be determined. For a given set of acquisition parameters, one study found an order of magni-tude difference in productivity between the least and most effective techniques.15
8. Bunting T, Bayly M, Tham M, McBride P, Daly M and Barclay F: “Bookabourdie Q-Land* 3D Proof of Concept Study; Mapping Sand Thickness and Sand Quality in the Cooper Basin,” presented at the 20th ASEG Geophysical Conference, Adelaide, South Australia, February 22–25, 2009.
9. Poisson’s ratio, an elastic constant, is a measure of a material’s compressibility perpendicular to applied stress. It can be expressed in terms of compressional and shear velocities and varies with mineral composition and fluid content.
10. Bagaini C: “Acquisition and Processing of Simultaneous Vibroseis Data,” Geophysical Prospecting 58, no. 1 (January 2010): 81–100.
11. Two sweeps are orthogonal if their initial phases differ by 90°.
12. Stefani J, Hampson G and Herkenhoff ER: “Acquisition Using Simultaneous Sources,” paper B006, presented at the 69th EAGE Conference and Exhibition, London, June 11–14, 2007.
Moore I, Dragoset B, Ommundsen T, Wilson D, Ward C and Eke D: “Simultaneous Source Separation Using Dithered Sources,” Expanded Abstracts, 78th SEG Annual International Meeting and Exposition, Las Vegas, Nevada, USA (November 9–14, 2008): 2806–2810.
13. Rozemond HJ: “Slip-Sweep Acquisition,” Expanded Abstracts, 66th SEG Annual International Meeting and Exposition, Denver (November 10–15, 1996): 64–67.
14. Jeffryes BP: “Method of Seismic Surveying,” US Patent No. 7,050,356 (May 23, 2006).
Bagaini, reference 10.15. Bagaini, reference 10.
> Coherent low frequencies. Comparison of a series of band-pass panels shows the coherent energy present in the point-receiver survey (bottom) relative to the conventional survey (top). Although the point-receiver survey bandwidth of signal greater than about 35 dB was 5.1 to 92 Hz, the record still contained energy in the 0- to 4-Hz range (left) where the conventional survey has none. The additional low frequencies helped obtain high-quality images at greater depths.
Oilfield ReviewSummer 10Land Seismic Fig. 11ORSUM10-LNDSMC Fig. 11
Two-
way
tim
e, m
s
1,400
1,600
1,800
2,000
2,200
2,400
0 to 4 Hz 4 to 8 Hz 8 to 12 Hz
Two-
way
tim
e, m
s
1,400
1,600
1,800
2,000
2,200
2,400
0 to 4 Hz 4 to 8 Hz 8 to 12 Hz
Conventional Acquisition, Low-Frequency Panels
Point-Receiver Acquisition, Low-Frequency Panels
> Improving acquisition productivity. Flip-flop operations (center) reduce cycle time over single-fleet operations (top) by beginning a sweep immediately after the listen time of the first fleet’s sweep. In single-fleet operation and flip-flop acquisition, cycle time depends on the sweep length. Slip-sweep operations (bottom) deliver a far greater productivity improvement because they eliminate the wait for the end of listen time. In slip-sweep acquisition, the minimum allowed interval between two consecutive shots is called slip time. The cycle time is therefore identical to the slip time and does not depend directly on the sweep length. However, acquisition with longer sweeps typically requires longer slip times to avoid severe contamination from harmonics generated from successive sweeps.
Oilfield ReviewSummer 10Land Seismic Fig. 13ORSUM10-LNDSMC Fig. 13
Fleet 1
Fleet 2
Fleet 3
Fleet 1
Fleet 1
Fleet 2
Single-Fleet Operations
Flip-Flop Operations
Slip-Sweep Operations
Cycle time = sweep time +move-up time = 16 s
Cycle time = sweep time +listen time = 13 s
Cycle time = slip time = 6 s
Sweep time: 8 s Listen time: 5 s Move-up time: 8 s Slip time: 6 s
31424schD6R1.indd 35 7/30/10 8:00 PM
36 Oilfield Review
However, until recently, an inherent limita-tion of the most productive vibroseis techniques has been a compromise in data quality caused by overlapping sweeps. Each record is contami-nated with noise from the next record. An acqui-sition and processing technique developed by Schlumberger scientists enables high vibroseis productivity while retaining the data quality of
conventionally acquired records.16 This tech-nique, distance-separated dithered slip-sweep acquisition, manages the interference noise caused by simultaneous acquisition so that it can be effectively removed at the processing stage (above). Because the data quality of indi-vidual records after separation is essentially identical to that of conventionally acquired
records, and because many more records can be acquired, the overall data quality is improved. The method is able to separate the records and eliminate interference noise, yielding final data with quality comparable to that obtained with sequential shooting.
Realizing the potential gains from this tech-nique requires several enabling technologies offered by the UniQ system that conventional acquisition systems cannot provide. First, con-tinuous recording is required to facilitate high-productivity acquisition without having to stop to write data to disk. Second, the high channel count with 150,000 active receivers allows deploy-ment of wide receiver spreads. With receivers spread over a wide area, sources can be working at distant corners of the survey with negligible interaction, promoting high productivity.
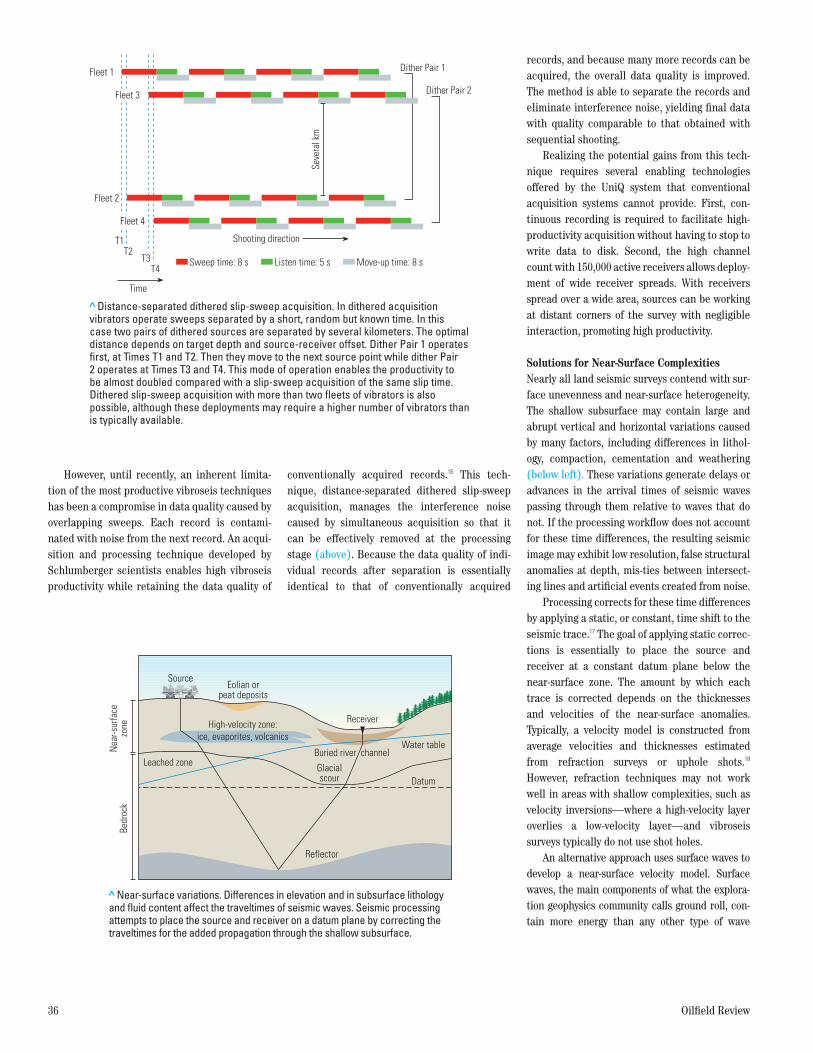
Solutions for Near-Surface ComplexitiesNearly all land seismic surveys contend with sur-face unevenness and near-surface heterogeneity. The shallow subsurface may contain large and abrupt vertical and horizontal variations caused by many factors, including differences in lithol-ogy, compaction, cementation and weathering (below left). These variations generate delays or advances in the arrival times of seismic waves passing through them relative to waves that do not. If the processing workflow does not account for these time differences, the resulting seismic image may exhibit low resolution, false structural anomalies at depth, mis-ties between intersect-ing lines and artificial events created from noise.
Processing corrects for these time differences by applying a static, or constant, time shift to the seismic trace.17 The goal of applying static correc-tions is essentially to place the source and receiver at a constant datum plane below the near-surface zone. The amount by which each trace is corrected depends on the thicknesses and velocities of the near-surface anomalies. Typically, a velocity model is constructed from average velocities and thicknesses estimated from refraction surveys or uphole shots.18 However, refraction techniques may not work well in areas with shallow complexities, such as velocity inversions—where a high-velocity layer overlies a low-velocity layer—and vibroseis surveys typically do not use shot holes.
An alternative approach uses surface waves to develop a near-surface velocity model. Surface waves, the main components of what the explora-tion geophysics community calls ground roll, con-tain more energy than any other type of wave
> Distance-separated dithered slip-sweep acquisition. In dithered acquisition vibrators operate sweeps separated by a short, random but known time. In this case two pairs of dithered sources are separated by several kilometers. The optimal distance depends on target depth and source-receiver offset. Dither Pair 1 operates first, at Times T1 and T2. Then they move to the next source point while dither Pair 2 operates at Times T3 and T4. This mode of operation enables the productivity to be almost doubled compared with a slip-sweep acquisition of the same slip time. Dithered slip-sweep acquisition with more than two fleets of vibrators is also possible, although these deployments may require a higher number of vibrators than is typically available.
Oilfield ReviewSummer 10Land Seismic Fig. 14ORSUM10-LNDSMC Fig. 14
Sweep time: 8 s Listen time: 5 s Move-up time: 8 s
Dither Pair 1Fleet 1
Fleet 2
T1T2
T3T4
Time
Shooting direction
Fleet 4
Fleet 3
Seve
ral k
m
Dither Pair 2
>Near-surface variations. Differences in elevation and in subsurface lithology and fluid content affect the traveltimes of seismic waves. Seismic processing attempts to place the source and receiver on a datum plane by correcting the traveltimes for the added propagation through the shallow subsurface.
Oilfield ReviewSummer 10Land Seismic Fig. 15ORSUM10-LNDSMC Fig. 15
Nea
r-sur
face
zone
Bedr
ock
Source
Reflector
DatumGlacialscour
Receiver
Leached zone
Water tableBuried river channel
High-velocity zone:ice, evaporites, volcanics
Eolian orpeat deposits
31424schD6R1.indd 36 7/30/10 8:00 PM
Summer 2010 37
generated by a surface seismic source, and they usually overwhelm the desired P-wave signals. Surface waves are so called because they propagate along the surface of the earth; their amplitude decreases with depth. They typically have lower velocities and shorter wavelengths than P-waves. Surface waves can be dispersive, meaning velocity depends on wavelength—long wavelengths travel faster and penetrate deeper than short ones.
Historically, exploration geophysicists have regarded surface waves as coherent noise; in conventional acquisition, receiver groups are designed to attenuate them. But with proper sampling by single receivers, these waves can be analyzed for the information they contain about the near-surface zone. Geotechnical engineers use surface waves, especially Rayleigh waves, which form the vertical component of ground roll, to derive properties of shallow sediments.19 Applying this concept to exploration-scale sur-veys, WesternGeco scientists developed a work-flow for surface-wave analysis for 3D land data (above right).20 In this approach surface waves are treated as useful signals until the near-sur-face properties have been extracted; then they are removed.
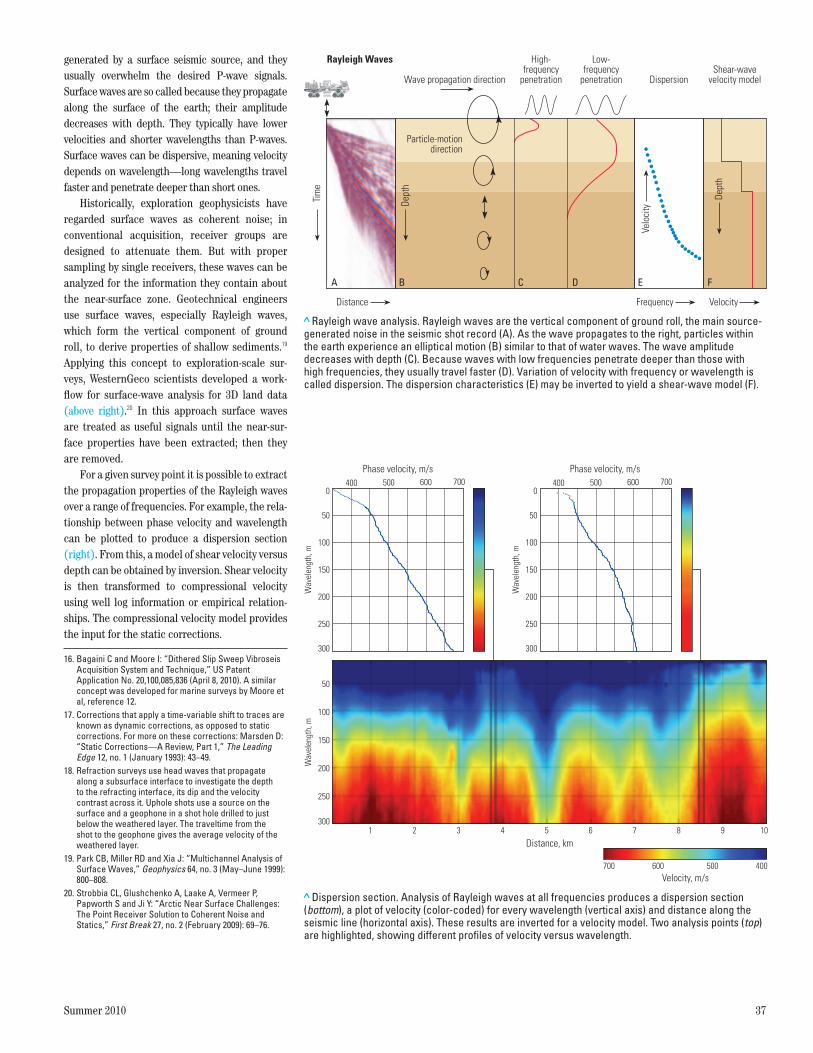
For a given survey point it is possible to extract the propagation properties of the Rayleigh waves over a range of frequencies. For example, the rela-tionship between phase velocity and wavelength can be plotted to produce a dispersion section (right). From this, a model of shear velocity versus depth can be obtained by inversion. Shear velocity is then transformed to compressional velocity using well log information or empirical relation-ships. The compressional velocity model provides the input for the static corrections.
16. Bagaini C and Moore I: “Dithered Slip Sweep Vibroseis Acquisition System and Technique,” US Patent Application No. 20,100,085,836 (April 8, 2010). A similar concept was developed for marine surveys by Moore et al, reference 12.
17. Corrections that apply a time-variable shift to traces are known as dynamic corrections, as opposed to static corrections. For more on these corrections: Marsden D: “Static Corrections—A Review, Part 1,” The Leading Edge 12, no. 1 (January 1993): 43–49.
18. Refraction surveys use head waves that propagate along a subsurface interface to investigate the depth to the refracting interface, its dip and the velocity contrast across it. Uphole shots use a source on the surface and a geophone in a shot hole drilled to just below the weathered layer. The traveltime from the shot to the geophone gives the average velocity of the weathered layer.
19. Park CB, Miller RD and Xia J: “Multichannel Analysis of Surface Waves,” Geophysics 64, no. 3 (May–June 1999): 800–808.
20. Strobbia CL, Glushchenko A, Laake A, Vermeer P, Papworth S and Ji Y: “Arctic Near Surface Challenges: The Point Receiver Solution to Coherent Noise and Statics,” First Break 27, no. 2 (February 2009): 69–76.
> Rayleigh wave analysis. Rayleigh waves are the vertical component of ground roll, the main source-generated noise in the seismic shot record (A). As the wave propagates to the right, particles within the earth experience an elliptical motion (B) similar to that of water waves. The wave amplitude decreases with depth (C). Because waves with low frequencies penetrate deeper than those with high frequencies, they usually travel faster (D). Variation of velocity with frequency or wavelength is called dispersion. The dispersion characteristics (E) may be inverted to yield a shear-wave model (F).
Particle-motiondirection
Dept
h
Dept
h
Velo
city
DistanceTi
me
Frequency Velocity
Wave propagation direction
High-frequency
penetration
Low-frequency
penetration DispersionShear-wave
velocity model
Rayleigh Waves
A B C D E F
Oilfield ReviewSummer 10Land Seismic Fig. 16ORSUM10-LNDSMC Fig. 16
> Dispersion section. Analysis of Rayleigh waves at all frequencies produces a dispersion section (bottom), a plot of velocity (color-coded) for every wavelength (vertical axis) and distance along the seismic line (horizontal axis). These results are inverted for a velocity model. Two analysis points (top) are highlighted, showing different profiles of velocity versus wavelength.
Oilfield ReviewSummer 10Land Seismic Fig. 17ORSUM10-LNDSMC Fig. 17
500 600 700Phase velocity, m/s
0
50
100
150
200
250
300
Wav
elen
gth,
m
50
100
150
200
250
300
0
50
100
150
200
250
300
Wav
elen
gth,
m
Wav
elen
gth,
m
400 500 600 700Phase velocity, m/s
400
1 2 3 4 5 6 7 8 9 10
Distance, km
700 600 500 400Velocity, m/s
31424schD6R1.indd 37 7/30/10 8:00 PM

38 Oilfield Review
Shallow TargetsCharacterizing shallow complexity is especially important when the near-surface zone contains the target formation. Such is the case confront-ing Kuwait Oil Company (KOC) in a field in north-ern Kuwait.21 This reservoir contains what is probably the largest accumulation of heavy oil in the country—1,000 km2 [390 mi2] with 12 to 15 billion bbl [1.9 to 2.4 billion m3].22 The reser-voir is extremely shallow, less than 200 m [about 650 ft], and thin: two 20-m [66-ft] sands sepa-rated by a 10-m shale. The shallow depth pres-ents challenges to heavy-oil recovery methods.
The shallowness of the heavy-oil reservoir also adds difficulty to seismic characterization. The horizons of interest are in the interval usu-ally considered the near-surface zone and are
embedded in a complex sequence of layers with velocity inversions. Heterogeneities in the shal-low subsurface that would normally be averaged through static corrections are precisely the infor-mation required to understand reservoir proper-ties and identify compartmentalization. The attenuating nature of the near-surface sediments requires powerful sources to achieve adequate S/N and closely spaced receivers to record the high frequencies needed for shallow imaging.
Kuwait Oil Company selected two sites for acquisition testing, with point receivers deployed in 2D lines. Different sources were investigated, including a single DX-80 vibrator with nonlinear MD Sweep operation from 3.5 to 120 Hz.23
Near-surface time corrections were computed by two means: conventional refraction statics
using a refractor below the reservoir and a hybrid method that included analysis of surface waves along with refraction statics. Although both methods produced similar images, the refraction static corrections alone resulted in a seismic sec-tion with some residual dip that was inconsistent with the regional geology. The hybrid method resulted in a section without residual dip.
Inversion of Rayleigh wave dispersion profiles revealed a shear-wave velocity section with a strong velocity inversion (above). This velocity contrast corresponds to a change in compaction or cementation of the sediments. Corrections based on the associated P-wave velocity were applied to traces before they were summed to produce a stacked section. The resulting resolu-tion of shallow reflectors is excellent. A strong
21. Strobbia C, El Emam A, Al-Genai J and Roth J: “Rayleigh Wave Inversion for the Near-Surface Characterization of Shallow Targets in a Heavy Oil Field in Kuwait,” First Break 28, no. 5 (May 2010): 103–109.
22. Oskui GP, Al Naqi A and Dusseault MB: “Screening Potential Production Technologies for the Lower Fars Heavy Oil Asset in Kuwait,” paper SPE 126268, presented at the Kuwait International Petroleum Conference and Exhibition, Kuwait City, Kuwait, December 14–16, 2009.
23. Bagaini C: “Low-Frequency Vibroseis Data with Maximum Displacement Sweeps,” The Leading Edge 27, no. 5 (May 2008): 582–591.
24. Strobbia et al, reference 20.
>Near-surface velocity anomalies and a deeper image. The shear-wave velocity section (top) resulting from Rayleigh wave inversion shows a notable velocity inversion with a high-velocity interval (red) overlying lower-velocity formations (yellow). This velocity section was converted to compressional velocity, which was used to correct the seismic data before stacking. The stacked section (bottom) reveals the high quality with which shallow reflectors above Refractor B can be imaged. (Adapted from Strobbia et al, reference 21.)
Oilfield ReviewSummer 10Land Seismic Fig. 18ORSUM10-LNDSMC Fig. 18
Shallow target
–80
80
0
Dept
h, m
Shallow target
Refractor A
Refractor B
Tim
e, m
s
0
100
200
300
400
500
0 0.5 1.0 1.5 2.0 2.5
Distance, km
Kuwait Heavy-Oil Field
25. Bird KJ, Charpentier RR, Gautier DL, Houseknecht DW, Klett TR, Pitman JK, Moore TE, Schenk CJ, Tennyson ME and Wandrey CR: “Circum-Arctic Resource Appraisal: Estimates of Undiscovered Oil and Gas North of the Arctic Circle,” US Geological Survey, Fact Sheet 2008-3049 (2008), http://pubs.usgs.gov/fs/2008/3049/fs2008-3049.pdf (accessed June 11, 2010).
26. Colombo D, Mantovani M, Hallinan S and Virgilio M: “Sub-Basalt Depth Imaging Using Simultaneous Joint Inversion of Seismic and Electromagnetic (MT) Data: A CRB Field Study,” Expanded Abstracts, 78th SEG Annual International Meeting and Exposition, Las Vegas, Nevada (November 9–14, 2008): 2674–2678.
27. Colombo D, Cogan M, Hallinan S, Mantovani M, Virgilio M and Soyer W: ”Near-Surface P-Velocity Modelling by Integrated Seismic, EM, and Gravity Data: Examples from the Middle East,” First Break 26, no. 10 (October 2008): 91–102.
For more on TDEM: Dawoud M, Hallinan S, Herrmann R and van Kleef F: “Near-Surface Electromagnetic Surveying,” Oilfield Review 21, no. 1 (Spring 2009): 20–25.
28. Colombo D, Mantovani M, Sfolciaghi M, van Mastrigt P, Al-Dulaijan A and Nafie T: “Near Surface Solutions in South Rub Al-Khali, Saudi Arabia Applying Seismic-Gravity Joint Inversion and Redatuming,” First Break 28, no. 2 (February 2010): 77–84.
Karst is a term applied to carbonate formations that have large cavities and irregular topography caused by surface or groundwater dissolution.
31424schD6R1.indd 38 7/30/10 8:00 PM
Summer 2010 39
reflection near the bottom of the section, Refractor B, is a Tertiary anhydrite and limestone layer that is continuous throughout most of Kuwait. For typi-cal surveys it is considered the base of the near-surface zone, and the reflectors and structures above it are generally ignored. In this area con-taining a shallow, heavy-oil resource, they are the layers of interest, and the hybrid method using surface waves successfully imaged them.
In addition to creating velocity models for com-puting near-surface corrections, Rayleigh wave inversion provides information about the shear-wave properties of the reservoir and surrounding formations. These results may be important for planning enhanced recovery operations for pro-duction of heavy oil.
Integrating Other MeasurementsApproaches abound for improving land seismic results, whether by enhancing signal, attenuating noise, reducing model uncertainty or including other measurements. For example, surface wave inversion for near-surface velocity estimation has been successfully applied to land seismic surveys in arctic regions, where permafrost and season-ally frozen layers induce large, abrupt vertical and lateral variations of elastic properties.24 The region north of the Arctic Circle has long been thought to contain a large portion of the remain-ing global oil and gas resources. In 2008 the US Geological Survey (USGS) estimated undiscov-ered resources within the Arctic Circle at 14 bil-lion m3 [90 billion bbl] of oil and 47.8 trillion m3
[1,688 Tcf] of gas.25 More than 15% of the reserves occur onshore, and finding them will require ingenuity and high-quality surveys.
Variations in subsurface properties can also be detected by gravity and electromagnetic mea-surements. Joint inversion of these data with seis-mic datasets is enhancing seismic imaging in a wide range of environments. In the Columbia River Valley, in Washington, USA, where a near-surface basalt layer up to 10,000 ft [3,000 m] thick refracts seismic energy, integration of seismic and magnetotelluric data has improved imaging at depths of more than 16,000 ft [4,900 m].26
Integration is also improving analysis of near-surface properties. In the United Arab Emirates, WesternGeco geophysicists incorporated data from a time-domain electromagnetic (TDEM) survey to compute static time shifts caused by thick sand dunes.27 The high contrast in electro-magnetic properties at the base of the dry sand helped map the base of the dunes for the shallow-velocity model.
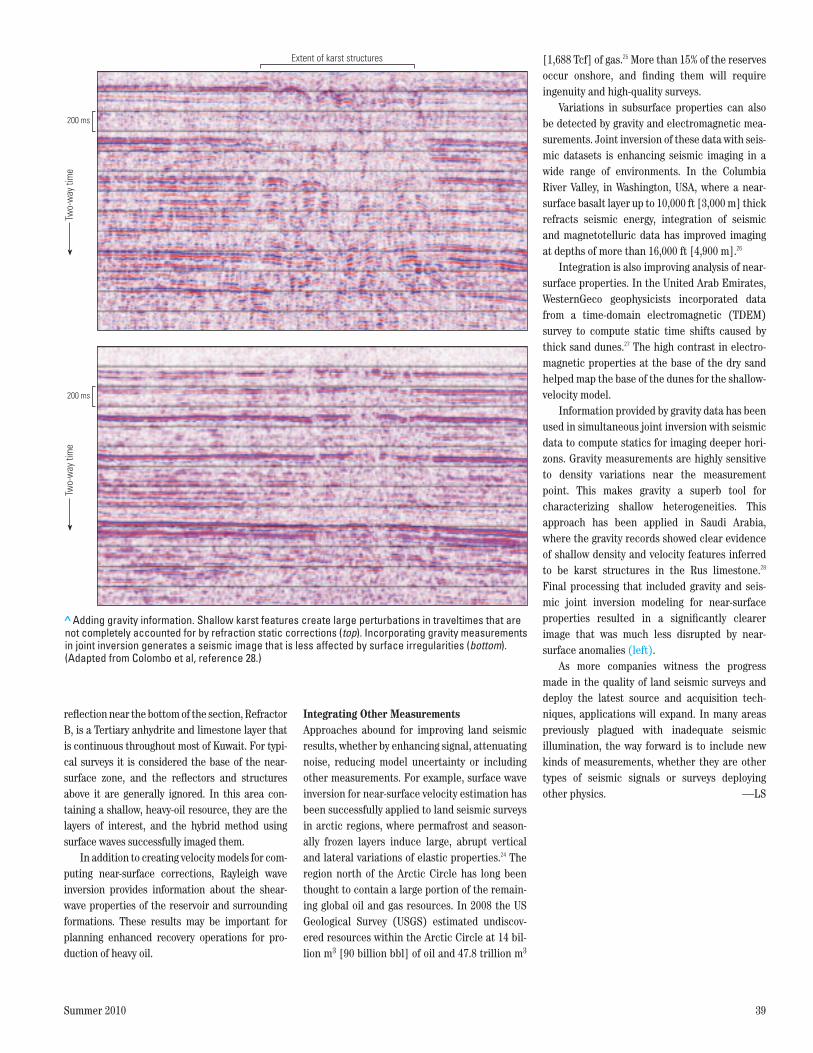
Information provided by gravity data has been used in simultaneous joint inversion with seismic data to compute statics for imaging deeper hori-zons. Gravity measurements are highly sensitive to density variations near the measurement point. This makes gravity a superb tool for characterizing shallow heterogeneities. This approach has been applied in Saudi Arabia, where the gravity records showed clear evidence of shallow density and velocity features inferred to be karst structures in the Rus limestone.28 Final processing that included gravity and seis-mic joint inversion modeling for near-surface properties resulted in a significantly clearer image that was much less disrupted by near- surface anomalies (left).
As more companies witness the progress made in the quality of land seismic surveys and deploy the latest source and acquisition tech-niques, applications will expand. In many areas previously plagued with inadequate seismic illumination, the way forward is to include new kinds of measurements, whether they are other types of seismic signals or surveys deploying other physics. —LS
> Adding gravity information. Shallow karst features create large perturbations in traveltimes that are not completely accounted for by refraction static corrections (top). Incorporating gravity measurements in joint inversion generates a seismic image that is less affected by surface irregularities (bottom). (Adapted from Colombo et al, reference 28.)
Oilfield ReviewSummer 10Land Seismic Fig. 19ORSUM10-LNDSMC Fig. 19
200 ms
Extent of karst structuresTw
o-w
ay ti
me
200 ms
Two-
way
tim
e
31424schD6R1.indd 39 7/30/10 8:00 PM