land use efficiency - productivity commission · land use efficiency ... pc (2012). another is...
TRANSCRIPT
Land use efficiency
Shifting the Dial: 5 year Productivity Review —Canberra, August 2017
Commonwealth of Australia 2017 ISBN 978-1-74037-638-9 (PDF)
Except for the Commonwealth Coat of Arms and content supplied by third parties, this copyright work is licensed under a Creative Commons Attribution 3.0 Australia licence. To view a copy of this licence, visit http://creativecommons.org/licenses/by/3.0/au. In essence, you are free to copy, communicate and adapt the work, as long as you attribute the work to the Productivity Commission (but not in any way that suggests the Commission endorses you or your use) and abide by the other licence terms.
Use of the Commonwealth Coat of Arms For terms of use of the Coat of Arms visit the ‘It’s an Honour’ website: http://www.itsanhonour.gov.au
Third party copyright Wherever a third party holds copyright in this material, the copyright remains with that party. Their permission may be required to use the material, please contact them directly.
Attribution This work should be attributed as follows, Source: Productivity Commission, Realising the Productive Potential of Land, Shifting the Dial: 5 year Productivity Review, Supporting Paper No. 10. If you have adapted, modified or transformed this work in anyway, please use the following, Source: based on Productivity Commission data, Realising the Productive Potential of Land, Shifting the Dial: 5 year Productivity Review, Supporting Paper No. 10.
An appropriate reference for this publication is: Productivity Commission 2017, Realising the Productive Potential of Land, Shifting the Dial: 5 year Productivity Review, Supporting Paper No. 10, Canberra.
Publications enquiries Media and Publications, phone: (03) 9653 2244 or email: [email protected] The Productivity Commission The Productivity Commission is the Australian Government’s independent research and advisory body on a range of economic, social and environmental issues affecting the welfare of Australians. Its role, expressed most simply, is to help governments make better policies, in the long term interest of the Australian community. The Commission’s independence is underpinned by an Act of Parliament. Its processes and outputs are open to public scrutiny and are driven by concern for the wellbeing of the community as a whole. Further information on the Productivity Commission can be obtained from the Commission’s website (www.pc.gov.au).

SP 10 – REALISING THE PRODUCTIVE POTENTIAL OF LAND 1
Contents
Key points 2
1 How land use policies affect city productivity 3
2 Reducing land use restrictions 12
3 Planning and provision for growth 16
4 Streamlining development assessment systems 24
5 Stamp duties 29
6 The impacts of land reforms 36
References 38
2 PRODUCTIVITY REVIEW
Key points • State and Territory Governments have made good progress in planning reform over the past
five years, and are continuing to pursue changes. Despite this progress, there remain some key areas that have not yet been addressed or remain high priorities for continued effort:
– reducing the number and complexity of restrictions on land use created by overly prescriptive zoning systems, which discourage investment and create unnecessary barriers to business entry and diversification
– ensuring the coherence of State and Local-level planning strategies and the efficient provision of infrastructure to greenfield or new release areas
– adoption of the known best practice model for development assessments to reduce unnecessary costs and complexity.
• Stamp duties on property transfers raise the cost of housing, discourage people from moving to more desired locations, and prevent the freeing up properties for more valued uses. They are also one of the most inefficient taxes in Australia. There is a strong case to transition from stamp duties to taxes based on unimproved land value.
SP 10 – REALISING THE PRODUCTIVE POTENTIAL OF LAND 3
1 How land use policies affect city productivity Planning and land-use policies affect how cities physically develop and function, and therefore many aspects of the perceived ‘liveability’ of cities and their attractiveness as places to conduct business.
These include the availability of suitable dwelling types, the types, locations and modes of operation of businesses and, through their determinations of the location of activity and facilitative infrastructure, ease of access to jobs, services and attractions. Planning policies also help determine the quality of environmental amenities and other aspects of urban design that affect the use and enjoyment of space, such as the designation of public areas and dimensions of buildings.
Planning policies particularly affect the productivity and growth of cities through their determination of possibilities for the use of land, coordination of different activities, and the management of positive and negative spillover effects from concentrations of people and activity. For example, planning rules determine the allocable locations, types and densities of housing and businesses, and hence the potential benefits to be gained from using land. The location of homes and businesses and their impact on the costs of travel, in turn, are key determinants of other land uses and development. And the ease of commuting and the availability of housing, in addition to earnings, are key influences on city population sizes (Duranton and Puga 2013).
Planning systems also set out how potentially competing objectives for land–use should be met (for example, economic development and the maintenance of social and environmental amenity in an area), and seek to ensure the optimum use of land by helping to manage trade-offs between urban costs, such as crowding and congestion, and agglomeration efficiencies (the flow-on benefits from firms and people being located close together) (Glaeser 2010). More flexible zoning designations supporting complementary land uses, for example, can enable the better sharing of facilities, suppliers and customers, matching of labour to firms, and opportunities for the diffusion of knowledge. How well urban trade-offs are managed are systematically related to productivity and earnings (Duranton and Puga 2013).
The locations of homes and businesses, and proximity to infrastructure, such as transport and communications, further affect ease of access to employment opportunities and services, which can affect socioeconomic outcomes (Kelly and Donegan 2015), and the costs and efficiency of businesses.
In addition, the availability of amenities and quality of the built and natural environments play an important role in creating a sense of belonging and local identity for residents, supporting healthy lifestyles, as well as attracting skilled people to cities. Improvements in Melbourne’s city design during the 1990s to make more people-friendly streets, public places and the city more ‘green’ have led to a substantial increase in pedestrian traffic throughout the day, and subsequent growth in businesses, and its cafe culture, in the city.
4 PRODUCTIVITY REVIEW
With a shift towards smaller and more densely situated housing around established transport facilities and centres of economic activity, there is a growing emphasis on urban design and planning that meets the privacy, amenity, and aesthetic preferences of residents and communities.
The broader effects of planning systems are observed in indicators such as whether people consider there is reasonable access to housing in the forms and locations desired, good mobility and access to desired services, thriving businesses, and an environment that reflects appreciation for the social, environmental and aesthetic importance of urban design.
As noted in chapter 4 in the main report, many of these judgements are necessarily subjective, but indicators of good functioning are likely to show a general perception that cities have retained or improved these features while their populations and economies have continued to grow. In particular, liveable cities attract skilled labour, which is likely to grow in importance as skill-intensive service industries dominate contributions to economic growth in developed countries (Baldwin 2016).
Urban planning responsibilities
Responsibility for urban planning rests with the States and Territories, and Local Governments. States are generally responsible for:
• releasing land for new developments
• strategic plans for metropolitan areas or regional areas
• making provision for major infrastructure
• overarching planning and development policies, such as the broad objectives of and purposes for land use (whether residential, business, recreational or other), with which State or Local approval authorities must comply.
Local Governments generally have responsibility for developing and implementing land use plans at the local level, with local plans expected to be consistent with metropolitan strategic plans or regional plans and applicable State planning policies (figure 1). Local Governments process the vast majority of development proposals.
Urban planning challenges
Policy objectives with respect to planning systems vary, but common aims of all governments are to accommodate population growth, promote economic development, and preserve and/or enhance social wellbeing. Others include adaptation to environmental and other risks, including those posed by natural hazards and climate change, the preservation of biodiversity and historical heritage, or more specific aims, such as maintaining buffer zones around seaports.

SP 10 – REALISING THE PRODUCTIVE POTENTIAL OF LAND 5
Challenges in achieving these aims include, among other things, the long-lived consequences of many planning decisions in cities, with pre-existing uses of land and the path dependence they can cause for adjacent or related activity usually constraining changes in land use, especially in the short term.
Figure 1 A simplified picture of planning functions and responsibilities
Source: PC (2012).
Another is deciding whether and how much to ‘build up’ in established areas versus ‘build out’ and extend city boundaries. Increasing the supply of well-located land and providing accompanying transport infrastructure can help to reduce pressure on land and house prices (for example, Lowe 2017a). On the other hand, the better utilisation of land in established areas can realise additional agglomeration benefits, reduce the costs of public infrastructure, which is more costly to deliver the further they are from urban centres, and prevent the creation of distant, socially isolated communities.
As city centres are the places where most jobs are created and offer greater choice and competition in services, the availability of housing close to centres has implications for households’ living standards. The reality of this is being seen in some capital cities with
Minister
Planning Department/Commission• development of strategic plans• development of state planning policies• may assess specific DAs to advise the Minister• may carry out planning processes for major infrastructure
State Government Developers• specific development
responsibilities in designated areas – often difficult areas such as rezoned brownfields
• have special responsibilities (eg creation of affordable housing)
State bodies with specific planning/development responsibilities • provide planning frameworks in
defined geographic areas and may also handle the development of particular areas
Local governments• exist in all states (no LGs in ACT and NT LGs have no planning powers)• develop the local plans in accordance with regional strategic plans• process the vast majority of development assessments• initiate planning scheme amendments• create regulatory instruments including zones, overlays and specific LG planning laws
Supra-council decision-making bodies • make decisions or advise on
specific development assessments and planning scheme amendments
• DAs can be referred by LGs or ministers or have a statutory basis (eg regional and state level panels)
can ‘call in’ development and rezoning assessments
6 PRODUCTIVITY REVIEW
the segregation of high education cohorts, who have higher incomes and live near Melbourne’s centre, and low education cohorts, who live at the fringes (Daley 2016). Accommodating population growth in established areas usually requires, however, management of the subsequent new set of urban costs and benefits, which may include wider changes to maintain or enhance residents’ lifestyles and amenity.
A major factor influencing planning decisions is the preferences of local residents and businesses. A standing challenge for strategic planning is the often unequal distribution of benefits and costs associated with accommodating growth, where the cost of some land uses can be imposed on a few communities while the benefits are more dispersed (increased densification in established areas being a typical example).
As for other areas, technological advance can change how objectives can be met, which requires regulators to consider whether policy settings remain apt over time. The task of managing vehicle traffic and parking, for example, will change with the likely introduction of autonomous vehicles (SP 9), and so development regulations designating land uses, the density of development and activity. An important productivity consideration as cities grow is the impact of land uses and built structures on the ease of movement within, and into and out of, city centres.
Past studies (for example, by The CIE (2013), Deloitte (2012) and DAE (2016)) have noted avoidable costs arising from unclear plans or objectives with respect to city or local area growth, undue restrictions on the development of land, and complex processes for gaining approval to new or changed land uses. Studies show that cities with stringent land-use regulations generally experience higher growth in housing prices and have lower population growth rates (Duranton and Puga 2013; Hilber and Vermeulen 2016). Restrictions on land use or development in desirable locations can also create or increase pressure to develop land in other locations that have high social and environmental value (Nathan and Overman 2011). The need for restrictions, and the benefits and costs they create, should, as for other policy areas, be evaluated taking into account the interests of the community as a whole.
Areas of policy focus
Major Australian cities have generally been regarded well in recent global liveability surveys, which assess the attractiveness of cities from the perspective of globally mobile professionals. For example, Melbourne has been ranked the most liveable city of 140 cities surveyed since 2011 by The Economist, while Adelaide, Sydney and Perth have ranked in the top 20 cities over the same period (EIU 2016).
Self-evidently, being amongst the best in the past provides limited guidance on cities’ capacity to handle future challenges. There will be challenges in maintaining cities’ current desirable attributes as populations grow, with projections suggesting that the majority of this growth will be in Australia’s capital cities (some 10.8 million more people by 2050 (ABS 2013)).
SP 10 – REALISING THE PRODUCTIVE POTENTIAL OF LAND 7
There are clearly present areas of stress and suboptimal outcomes, most prominently in relation to housing access (box 1) and the ability of the planning system to accommodate changes in business types and formats.
In Sydney and Melbourne, the supply of new housing has not kept up with demand, which has contributed to upward pressure on dwelling prices relative to income – at the time of writing, at record highs (Lowe 2017b). High house prices can exacerbate social inequality as housing costs in metropolitan cities become unaffordable for low income households (Henry et al. 2009; SGS Economics & Planning 2015).
Access to suitable housing and increases in distances travelled to jobs is a problem in several capital cities. About 60 per cent of net employment growth between 2006 and 2011 was within 10 kilometres of the CBDs of the largest five capital cities, but net population growth located in the same area was approximately half this amount.
In Sydney, the majority of jobs that can be reached in 45 minutes by car are located in the inner city whereas on the city fringes this is the case for fewer than 20 per cent of jobs. Similarly for Melbourne, residents living in the inner city can reach more than half the jobs within a 60 minute public transport trip but residents living in outer urban areas, such as those in the western-suburbs and around Dandenong, can access fewer than one in ten of those jobs (Kelly and Donegan 2014).
There are also concerns in several jurisdictions about the extent to which States’ intentions with respect to metropolitan development are being informed by, and reflected in, local decisions — and hence whether broader strategies for managing the growth and development of cities are being realised.
Concerns about restrictions on housing supply, the complexity and prescriptiveness of zoning systems, particularly their impact on business entry and diversification, and the costs and complexity of development assessment processes, have given rise to several reviews of planning systems in recent years (including several Commission studies; PC 2011b, 2012, 2013, 2014d, 2016). Jurisdictions’ efforts to address these concerns are considered below.
8 PRODUCTIVITY REVIEW
Box 1 Housing access Access to housing is a significant indicator of city liveability. The growing importance of inner city areas as centres of employment and services means that those who live (or can afford to move) closer to the city centre are likely to be at an advantage.
The price of housing varies across States and Territories. The ratio of nationwide house prices to household income is now at record highs. New South Wales and Victoria account for the majority of this result, however, a key contributor being strong population growth in Sydney and Melbourne. House prices in inner urban areas have increased at a greater rate than outer urban fringes, making it difficult for lower income households to relocate to these areas. In the other States, the ratio of housing prices to income has been below previous peaks and remained relatively subdued. The differences between jurisdictions indicate that economic conditions other than the interest rate level are at play. Noticeably, prices for dwelling in Perth have declined, largely attributed to weak economic conditions and slowing population growth following the end of the mining investment boom.
The cost of dwelling type also varies across States and Territories. Price growth for detached houses has been stronger than apartments, particularly in capital cities where there has been an increase in the supply of apartments relative to detached houses. For example, apartment prices in Brisbane declined in the second half of 2016 while the growth in prices for detached houses increased.
Housing price pressure has been attributed to a range of factors, including low interest rates and a sluggish economic environment, which have encouraged increases in investor activity in some cities. Growth in the value of investor finance for dwellings has outpaced growth in owner-occupier finance over the past decade (investor finance for dwellings grew 4.8 per cent p.a. on average over the past decade compared with 2.8 per cent for owner occupier finance). Over the twelve month period to May 2017, the value of investor finance grew by 7.8 per cent compared with 3.1 per cent for owner occupier finance. Investor loans now account for 30 to 40 per cent of new loans.
Supply-demand dynamics have been placing upward pressure on dwelling prices in Sydney and Melbourne relative to incomes for some time. Housing demand has increased by about 40 per cent per year over the past decade, driven by population growth, but supply has not kept up with demand and it is only in recent years that residential construction has responded. For example, the NSW Government has noted that housing construction is recovering from several years of low activity, but the years of low supply production, strong population growth and pent up demand for housing means there remains significant unmet demand.
A Grattan Institute survey of homebuyers also suggests that there are large gaps between desired and available types of housing in established areas of Sydney and Melbourne. This survey found that more than 150 000 Sydney households’ preferred dwelling types (for example, apartments four storeys or higher) cannot be accommodated by the city’s existing housing stock. This reflects both the difficulty in replacing the stock given the disruption it would cause, and the long-lived nature of most detached houses, which has comprised the majority of stock over recent decades (in 1976, detached houses comprised 78 per cent of Australia’s dwelling stock; in 2011 the proportion was 74 per cent). Sources: ABS (2017); Kelly et al. (2011); Kohler and van der Merwe (2015); KPMG (2016); Lowe (2017b, 2017c); NSW Government (2016); PC (2011b); RBA (2016, 2017).
SP 10 – REALISING THE PRODUCTIVE POTENTIAL OF LAND 9
Progress on planning reform since 2011
Many State and Territory Governments have made good progress in planning reform over the past five years (box 2).
The following notable changes have been made or are being pursued at the State-specific level.
The Victorian Government reformed its residential, industrial and commercial zoning regulations in 2013 to reduce the number of restrictions and the degree of prescription on the intensity of land uses allowed in each zone type. The Victorian Government further amended its residential zone regulation in March 2017 to reduce restrictions on the height and density of developments (VDELWP 2017b).
In 2017, the Queensland Government introduced new planning legislation that includes statutory instruments to better align State objectives and regional plans administered by local councils. The Government has also replaced Queensland Planning Provisions with identified mandatory elements for local planning schemes, which focus on providing consistency of definitions, and zones with purpose statements (QDILGP 2017a).
The NSW Government has established a clearer and more integrated hierarchy of State, regional and district plans for the Greater Sydney region, with clearer links to local planning controls. In addition, the Government has simplified the planning system by reducing the number of State planning instruments and the development approval pathway for low-impact residential buildings. The Government has further established a planning database as an electronic repository for planning information and a portal that provides online access to information.
The above and other measures were instituted following failure to achieve Parliamentary approval to a package of major changes to planning legislation in 2013. The Government has since proposed further legislative reforms, including to require decision-makers to give reasons for their decisions, consolidating community consultation provisions, and further improving the assessment pathway for low impact proposals and the coherence and transparency of State and local-level planning. But this package does not include some key 2013 reforms, including on overly restrictive zoning regulations (Allens 2017).
Both the Tasmanian and South Australian Governments are embarking on broader reforms of their planning systems.
The South Australian Government is seeking to overhaul its planning system over the next five years. A key aim is to replace the 1500-plus zones and council plans with a more consistent and succinct set of development rules that, among other things, recognises different levels of regulatory risk. The Government established an independent State Planning Commission in 2017 to act as the State’s primary planning advisory and development assessment body. It is planning to streamline its development assessment pathways in 2018-19.
10 PRODUCTIVITY REVIEW
Box 2 Recent improvements in planning systems Sydney and Melbourne have provided for more efficient land release and new housing in recent years. The years of slow supply are likely to be contributing to present high housing prices, however (box 1). In addition, there has been effort by all jurisdictions to reduce the complexity of development assessment processes and improve transparency in decision making. For example, since 2011:
• standard (statutory) planning templates for local planning schemes have been introduced in all but one State, South Australia, which is in the process of transitioning Local Government plans to a standardised format. This move has provided for greater level of consistency between State and local plans
• consistent zoning conventions have been created for Local Governments within the States, with most jurisdictions prescribing a set of permitted zone types and land uses
• fast-tracked development assessment paths, including a ‘code-assess’ category, are being used in all jurisdictions. The code-assess category fast-tracks development applications by providing preset criteria against which to assess developments, and assurance that consent will always be given if all criteria are met
• capital city strategies have been developed for all jurisdictions, providing greater direction for land planning and a more conducive environment for investment
• all States have sought the greater involvement of independent experts (in architecture, urban design, heritage protection or social planning) and communities in planning decisions
• all States with the exception of Queensland now have supra council planning panels to make determinations on developments that have significant impacts beyond an individual council’s boundaries
• all States have introduced online services for submitting and tracking development applications, and local planning schemes are easily accessible online (online services are currently being rolled out in Tasmania.
Sources: QDILGP (2017c); SADPTI (2017b, 2016c); TPC (2017).
The Tasmanian Government is intending to replace its 29 interim planning schemes with a single statewide planning scheme that includes a set of planning rules (including zoning and land use codes) from which councils must choose to reflect the objectives of their community. The intention is that local variations will only be allowed to reflect unique local circumstances, but these will be treated as derogations from rather than changes to the State’s rules.
The Western Australian Government introduced standard ‘deemed provisions’ in 2015, which set uniform processes for structure plans (plans to coordinate future subdivision and zoning of land) and local development plans, as well as DAs undertaken at the local level. Prior to this, each local planning scheme included its own procedures and processes, resulting in up to 150 different variations.
The Northern Territory Government further streamlined its development approval process in 2016.
SP 10 – REALISING THE PRODUCTIVE POTENTIAL OF LAND 11
Progressing reform
The experience of New South Wales highlights the importance of perceived and actual integrity in decision-making processes as a factor in public support for reforms. The NSW Independent Commission Against Corruption, for example, noted that any laxity in process ‘ … combined with the motivation of developers to maximise profits … (would) make the proposed system an easy target for those prepared to use corrupt means to achieve a favourable result’ (NSW ICAC 2013, pp. 1–2).1
Along a similar line, studies have noted that consultation on development strategies is viewed by communities in several jurisdictions as ‘superficial window dressing’ (for example, Kelly and Donegan 2015, p. 139), contributing to resistance to their implementation.
As with many policy areas, transparency in decision-making, with processes incorporating genuine opportunities for concerns to be voiced and considered, are important to ensure the soundness of decisions and help stakeholder understanding of their rationale. Further, simply put, exposing processes to sunlight has a cleansing effect.
For the purpose of this paper, the Commission has taken as given the need for requisite skills on the part of planning system officials, and well-targeted checks and balances. These are needed for trust in reform proposals as well as to ensure that the reforms produce the benefits intended.
The Commission’s stocktake of progress on reform indicates that the following areas remain priorities across jurisdictions:
• reducing the number and complexity of restrictions on land use created by prescriptive zoning systems (section 2)
• better planning and provision for growth (section 3)
• the need to continue moves towards a risk-based approach to assessment of development proposals (section 4).
The paper also considers the impact of stamp duty on property transfers, which affect the efficient use and development of land and housing stock, and imposes constraints on mobility (section 5). From an economy-wide perspective, stamp duties are one of the most inefficient taxes nationally, estimated to cost over 70 cents for each additional dollar collected in the long run. Estimates of the net benefits of reforms discussed in this paper are set out in section 6.
1 The nature of zoning regulations affects the value of land. In Sydney land zoned for higher density
residential development can generally be valued between 10 and 25 per cent higher than land zoned for lower density residential development. Land zoned for industrial uses in Sydney has approximately half the value of similar land that is zoned for residential uses (CIE 2013).

12 PRODUCTIVITY REVIEW
2 Reducing land use restrictions The majority of development and land use activities (that is, not State-significant developments) is carried out under authority of local planning instruments that list the types of development that are allowed in each zone of a Local Government area. State legislation sets out the types of allowable zones (whether residential, business, rural, environmental protection or other), allowable categories (or purposes) of activity within those zones, and the specific types of developments that may be carried out in accordance with the purpose of those categories of activity.
A longstanding concern is the multiplicity of zone categories and specificity of allowable activities within those categories. For example, New South Wales has eight types of business zone categories, each specifying the types of developments that may be undertaken with the consent of the relevant Local Government. Local Governments use these zoning categories to develop specific plans for their areas, which usually include additional specific types of developments that require consent in accordance with their particular objectives. Local Governments may further specify development parameters, such as building height restrictions and floor to space ratios that apply to specific land uses or zoning subcategories, guided by high-level standards set by the State Government (box 3).
Even the smallest jurisdictions, Tasmania and the ACT, have five to six types of commercial zones, with each having 23 zone types in total. In South Australia, planning schemes are highly variable between councils because the State does not have a standard planning instrument for local plans. Developers must navigate over 500 residential zone types and a combination of some 2500 zones, overlays and spatial layers, which contribute to lengthy approval timeframes and excessive compliance costs (South Australian Government 2015). South Australia is currently moving to a new set of zoning rules (SADPTI 2017b).
Victoria stands apart from other jurisdictions in having fewer business zones (just two), with more broadly-stated allowable uses, as a result of reforms to its zoning system in 2013. As part of its reforms, Victoria also reduced the degree of prescription and restrictions on the intensity of land uses allowed in residential and industrial zones. Within metropolitan Melbourne, authorities may no longer impose floor space limits in commercial zones (VDELWP 2017a; VDTPLI 2013b, 2013a).
The Commission has previously noted that there are limited and identifiable impacts associated with the location decisions of most businesses (commercial, service providers and some light industrial), and few planning reasons why they could not be co-located in a business zone (PC 2011b, 2014d). It is hard to see why ‘bulky goods premises’ and ‘hardware and building supplies’ should be treated separately for planning regulation purposes, for example.

SP 10 – REALISING THE PRODUCTIVE POTENTIAL OF LAND 13
Box 3 New South Wales’ zoning system New South Wales has eight overarching zoning categories to which land must be allocated for development purposes — rural, residential, business, industrial, special purpose, recreation, environment protection and waterways. Each of these categories contain subcategories that specify particular land use purposes, or types of allowed activity. There are 35 subcategories in all. State legislation sets out for each zoning subcategory the objectives for development, the developments that may be carried out without development consent, development that may be carried out only with development consent, and development that is prohibited. Local Governments apply these in developing local plans (‘Local Environment Plans’) for their areas, and may add to the list of development that is permitted or prohibited in a zone, subject to approval by the Minister. For example, the NSW Standard Instrument — Principal Local Environmental Plan provides in respect of ‘Commercial Core’ zones, one of eight business zone subcategories: • that their objectives are to: provide a wide range of retail, business, office, entertainment,
community and other suitable land uses that serve the needs of the local and wider community; encourage appropriate employment opportunities in accessible locations; and maximise public transport patronage and encourage walking and cycling
• the following permissible developments with the consent of Local Governments: child care centres; commercial premises; community facilities; educational establishments; entertainment facilities; function centres; hotel or motel accommodation; information and education facilities; medical centres; passenger transport facilities; recreation facilities (indoor); registered clubs; respite day care centres and restricted premises.
For Commercial Core zones, the Sydney Local Environment Plan 2012 (for the city of Sydney):
• includes as a further objective the promotion of land uses with active street frontages • specifies the following additional land uses that may be permitted with its consent: Backpackers’
accommodation; Horticulture; Light industries; Sewage reticulation systems; Waste or resource transfer stations; and other development
• includes a lengthy list of prohibited land uses. The Commercial Core zone does not apply to the Sydney CBD but applies in other centres within the City of Sydney Local Government area. Local environment plans also specify parameters for development in accordance with high-level standards set by the State Government, including with respect to the height of buildings (for example, to ensure they are appropriate to the condition of the site, promote amenity and the sharing of views) and the floor-space ratio of buildings (aimed at providing sufficient floor space to meet development needs for the foreseeable future, regulating the density of development and land use intensity, controlling traffic, and ensuring that new development reflects the desired character of the locality in which it is located). Local Environment Plans may also include specific requirements desired by the Local Government. The Sydney Local Environment Plan, for example, provides that development consent must not be granted to the erection of a new building or external alterations to an existing building unless the consent authority is satisfied that the proposed development shows a high standard of architectural, urban and landscape design. Sources: Standard Instrument — Principal Local Environmental Plan (NSW); Sydney Local Environmental Plan 2012.
14 PRODUCTIVITY REVIEW
For development proponents, the prescriptiveness and differences in treatment of land uses at the local level can lead to different treatment of the same types of land use across council areas.
For example, in South Australia, the ‘light industry zone’ in the Mount Barker council areas allows ‘light industry, service industry, store and warehouse land uses with ancillary commercial land uses’ (SADPTI 2016b, p. 171), whereas in Mitcham council, the light industry zone allows ‘industries that manufacture on a small-scale and that do not create any appreciable nuisance or generate heavy traffic’ (SADPTI 2016a, p. 198). For the ‘residential’ zone type in Western Australia, the city of Fremantle permits ‘aged or dependent persons dwellings’ but ‘nursing homes’ (the most similar use) in nearby Rockingham are prohibited (WADP 2016, 2017a).
The large format retail industry, which sells bulky goods, noted the varying treatment of its type of business in local planning policies in New South Wales, and the lack of flexibility created by the prescriptiveness of allowed activity:
LFR uses generally fall under the land use definitions for ‘Bulky Goods Premises’, ‘Hardware and Building Supplies’ and ‘Garden Centres’. There is often subjective and varying treatment of these land use definitions in Local Environmental Plans, creating uncertainty as to whether particular developments would qualify as a LFR use. The existing definitions also lack sufficient flexibility to encourage innovation in the retail sector. The lack of flexibility is emphasised by the fact that the definition for ‘Bulky Goods Premises’ requires LFR operations to involve the sale of bulky goods that require large area for handling, display or storage and direct vehicle access for customer loading purposes. All other Australian jurisdictions only require either ‘arm’ of the definition to be satisfied … (LFRA 2015, pp. 11–12)
This contrasts with the experience of the industry in Victoria:
In Victoria, LFR is included within the land use definition ‘Restricted Retail Premises’ which incorporates both product-based characteristics of the merchandise sold, as well as their physical characteristics. The Victorian system also permits ‘Restricted Retail Premises’ as an ‘as-of-right’ use in its commercial zones, which provides certainty and encourages investment. (LFRA 2015, p. 12)
The current orientation of planning systems towards controlling specific types of development means that greater regulatory prescription is required to recognise new types of business or community activities, and is the only means by which Local Governments can give effect to specific objectives for their areas.
The logic of current systems is thus one of increasing regulation over time, with the potential for inconsistent or perverse outcomes inherent given the scope for fine distinctions to be made between types of developments based on particular councils’ preferences. In its 2013 attempt to reduce the number and restrictiveness of zoning categories, the NSW Government noted: ‘there is diminishing justification for retaining an extensive list of zones that separate and restrict complementary (land) uses that fall within the same broad category’ (NSW Government 2013, p. 94).
SP 10 – REALISING THE PRODUCTIVE POTENTIAL OF LAND 15
Tasmania’s and South Australia’s reforms are seeking to reduce the degree of local variations. At the time of writing, the new regimes had not yet been tested on this element.
By creating barriers to entry and diversification, zoning classes and the prescriptiveness of permitted land uses can also limit productivity improvements in, and competition between, businesses. This ultimately results in higher prices and/or poorer quality and ranges of goods and services for the community (ACCC 2014; Harper et al. 2015; Henry et al. 2009; PC 2011b, 2011a, 2014d). Restrictions on competition can particularly affect outer suburbs, where reduced accessibility to goods and services can reinforce social disadvantage (Leigh and Triggs 2016).
Policy settings that have especially egregious impacts on competition include the creation and enforcement of activity centres (PC 2011b, 2014d), and regulations that require consent authorities to consider the effects of development proposals on established businesses. Activity centre policies set out the types of activities (such as residential, retail, commercial and industrial activities) that are permitted in the core of the centres, as opposed to the periphery or outside. Both types of policies are used to protect shops and shopping centres in designated areas from competition. A typical complaint from a development proponent:
ALDI met with Blacktown City Council’s Strategic Planning Unit in February 2012 to discuss the potential for a spot rezoning of the Glendenning site … Council considers that the site is not appropriate for an ALDI store on the basis that there is potential for adverse impacts to the nearby North West Growth Centre land release precincts of Schofields and Colebee and existing nearby village centres of Woodcroft Plaza and Plumpton. (ALDI Stores 2014, p. 12)
A need to reorient zoning systems towards promoting overall community interests
The need for restrictions should be evaluated taking into account the interests of the community as a whole. This will require a reorientation of the regulatory approach in most States.
Sound regulatory design also suggests that zoning frameworks should provide as much flexibility as possible in how land is used. Fewer land use zones with broadly stated allowable uses would:
• allow new and innovative firms to enter local markets and existing firms to expand, as well as providing greater flexibility to adjust to changing business activities and community preferences
• enable genuinely incompatible land uses to remain separated, but provide scope for complementary uses to develop and compete. Such a move would likely increase options available on where to live and work
• reduce the scope for arbitrary distinctions between activity types at the Local Government level

16 PRODUCTIVITY REVIEW
• as the NSW Government has noted, minimise the need for spot rezoning, which would in turn reduce costs, delays and investment uncertainty (NSW Government 2013).
The scope for inconsistent decisions would also be reduced by a requirement that all governments transparently take into account the costs as well as benefits of proposed development restrictions from the perspective of their communities as a whole.
The Harper Review recommended governments take into account several matters to help ensure that zoning rules and development decisions reflect the interests of consumers and the broader community, including that:
• arrangements that explicitly or implicitly favour particular operators are anticompetitive
• the following are not relevant planning considerations: the impact on competition between individual businesses, the impact of proposed developments on the viability of existing businesses, proximity restrictions on particular types of retail stores, restrictions on the number of a particular type of retail store contained in any local area, and proximity restrictions on particular types of retail stores (Harper et al. 2015, p. 45).
Estimates indicate that the potential benefits of rationalising zoning systems are significant. In a 2013 report commissioned by the NSW Government, The CIE (2013) estimated the potential economic benefits from reduction in land use restrictions for Sydney alone could be in the order of $8 billion to $16 billion, which in annualised terms is equivalent to $665 million to $1.3 billion per year.2
CONCLUSION 10.1
State, Territory and Local Governments should move to fewer and more broadly-stated land use zones to allow greater diversity of land uses. Such a move is likely to make it easier for new firms to enter local markets and for existing firms to expand, reduce administrative and compliance costs, and enable planning systems to more flexibly respond to changing land use activities. Governments should apply competition policy principles to land use regulation and policies, which oblige consideration of the impacts of policies from the perspective of communities as a whole. Regulation that explicitly or implicitly favours particular operators and sets proximity restrictions is unjustifiable.
2 Annualised for a period of 30 years at a real discount rate of 7 per cent. This reflects estimates of land
value premiums and how quickly these premiums are reduced as land is rezoned.
SP 10 – REALISING THE PRODUCTIVE POTENTIAL OF LAND 17
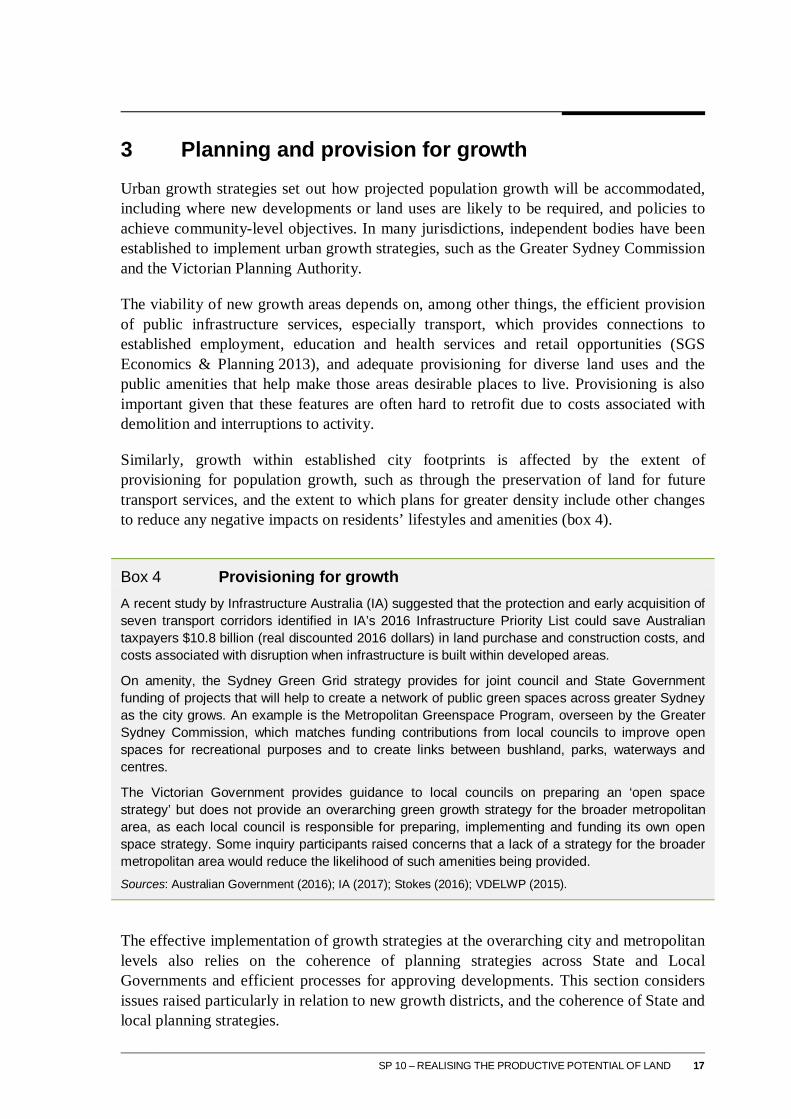
3 Planning and provision for growth Urban growth strategies set out how projected population growth will be accommodated, including where new developments or land uses are likely to be required, and policies to achieve community-level objectives. In many jurisdictions, independent bodies have been established to implement urban growth strategies, such as the Greater Sydney Commission and the Victorian Planning Authority.
The viability of new growth areas depends on, among other things, the efficient provision of public infrastructure services, especially transport, which provides connections to established employment, education and health services and retail opportunities (SGS Economics & Planning 2013), and adequate provisioning for diverse land uses and the public amenities that help make those areas desirable places to live. Provisioning is also important given that these features are often hard to retrofit due to costs associated with demolition and interruptions to activity.
Similarly, growth within established city footprints is affected by the extent of provisioning for population growth, such as through the preservation of land for future transport services, and the extent to which plans for greater density include other changes to reduce any negative impacts on residents’ lifestyles and amenities (box 4).
Box 4 Provisioning for growth A recent study by Infrastructure Australia (IA) suggested that the protection and early acquisition of seven transport corridors identified in IA’s 2016 Infrastructure Priority List could save Australian taxpayers $10.8 billion (real discounted 2016 dollars) in land purchase and construction costs, and costs associated with disruption when infrastructure is built within developed areas.
On amenity, the Sydney Green Grid strategy provides for joint council and State Government funding of projects that will help to create a network of public green spaces across greater Sydney as the city grows. An example is the Metropolitan Greenspace Program, overseen by the Greater Sydney Commission, which matches funding contributions from local councils to improve open spaces for recreational purposes and to create links between bushland, parks, waterways and centres.
The Victorian Government provides guidance to local councils on preparing an ‘open space strategy’ but does not provide an overarching green growth strategy for the broader metropolitan area, as each local council is responsible for preparing, implementing and funding its own open space strategy. Some inquiry participants raised concerns that a lack of a strategy for the broader metropolitan area would reduce the likelihood of such amenities being provided. Sources: Australian Government (2016); IA (2017); Stokes (2016); VDELWP (2015).
The effective implementation of growth strategies at the overarching city and metropolitan levels also relies on the coherence of planning strategies across State and Local Governments and efficient processes for approving developments. This section considers issues raised particularly in relation to new growth districts, and the coherence of State and local planning strategies.
18 PRODUCTIVITY REVIEW
Infrastructure for new growth areas
Infrastructure Australia has noted that State and Territory Governments have made progress in integrating transport services and corridors into long-term strategic plans, but that further action is required to translate these strategic plans into productive infrastructure (IA 2017). A common challenge has been securing required funding. There seems to be some room for improvement in one of the means by which infrastructure is funded, namely development contributions.
Development contributions are upfront contributions that property developers make to State or Local Governments or authorities for community facilities and infrastructure on land they develop. This can be in the form of land transfer (‘gifted’ to the government), work-in-kind (works constructed and transferred to public authorities), or financial payments (developer charges covering the cost of infrastructure or land provision) (PC 2014c).
There are established principles for the levying of development contributions, including that developers should only contribute to costs and structures that are clearly attributable to the properties being developed, that new residents should not be levied for the capital costs of the facility through council rates and utility charges, since the cost is passed through to them through the purchase price, and that charges should reflect only efficiently incurred costs (see, for example, PC (2004, 2014c)).
There is scope for greater use of market testing of infrastructure costs to help ensure that charges are efficient.
Most jurisdictions have developer contribution systems, where infrastructure is provided by the property developer within a budget set by the Local Government. In New South Wales, for example, the local contributions system allows local councils to set the scope and price for local infrastructure such as roads and open space embellishment without cost rates being specifically market-tested. The developer must agree to provide the infrastructure at the specified price, which provides that any savings in the work can be captured by the developer at the expense of other developers (IPART 2017). Some councils in New South Wales do test the market to inform the costing of local infrastructure requirements, for example, Blacktown Council, but this is not the norm.
Queensland imposes a cap on developer charges, and permits developers to receive a refund for the cost of trunk infrastructure when its costs exceed the council’s infrastructure charge (QDILGP 2014, 2017b; QDSDIP 2012). The Local Government Association of Queensland (2014) has raised concerns that this can lead to significant under-recovery of costs. It asserted that Queensland’s cap led to a shortfall between developer contributions and the cost of providing essential infrastructure of about $480 million annually.
Requiring the adoption of a general practice of market testing of services and costs, where cost effective, could improve the infrastructure provision, including by increasing the

SP 10 – REALISING THE PRODUCTIVE POTENTIAL OF LAND 19
potential for discovering innovative solutions and providing better assurance that value for money is being received.
In addition to developer contributions, value capture mechanisms have also been suggested as a way of helping to fund new infrastructure (for a critique of these mechanisms, see the discussion in (Terrill and Emslie 2017)). The complexity of administering value capture in practise has meant that it has not been used in Australia in recent decades. Value capture mechanisms also tend to raise only a small portion of project funding costs.
Alignment of Local and State Government development strategies
As noted, there are concerns in several jurisdictions about the consistency of State and Local planning strategies and decisions.
The scope for misalignment arises from several sources, including different visions for urban areas, particularly how they might accommodate population growth; the scope and sometimes the necessity for interpreting how State strategic plans and statutory planning requirements are to be applied at the local level; and the discretion and authority of Local Governments to determine local land uses in accordance with their particular preferences.
A review of practise suggests that: i) genuine consultation, ii) better guidance from States on their strategic objectives for cities and assumptions for growth, and iii) more mechanical linking of local and State plans would help mutual understanding and alignment of goals.
Consultation and engagement
Better practise on the development of planning strategies includes metropolitan strategic plans being developed with the input of local councils and communities, with State Governments making genuine efforts to involve residents at both the metropolitan and local levels. Equally, there is reliance on councils to actively engaging the community and higher levels of government in their own planning processes. A further good practise feature is the nature and degree of consultation being held in proportion to the scale and scope of likely impacts (CIE 2013).
As noted earlier in this paper, community consultation on planning strategies is perceived as cursory in several jurisdictions. As examples, Local Government representatives in South Australia considered that the 30 Year Plan for Greater Adelaide ‘was launched on a public that had missed the start of the conversation and was expected to take a leap of faith to board the urban renewal train.’ (Kelly and Donegan 2015, p. 139). Several parties noted considerable community concern about the discretion of Queensland councils to make amendments to local planning schemes that are considered by them to be of a minor nature without public consultation or State Government review (QEDO 2017; QDILGP 2016b, p. 7; Toowoomba Regional Council 2016).
20 PRODUCTIVITY REVIEW
An example of good practice in consultation at the local level is Western Australia’s approach of engaging the community on the nature of specific developments. For example, the State has established an advisory group representing residents, business owners and environmental groups to provide input on road extensions proposed in the State’s Scarborough Master Plan (WAMRA 2016).
On local leadership, recent work by the Commission into transitioning regional economies (2017) suggests that more successful communities are led by individuals who take an active role in identifying strategies for how to best facilitate development. Local leadership was exemplified in the case of Stawell (Victoria), where the Local Government took a lead role in seeking ways to redevelop and repurpose a gold mine for use as an underground physics laboratory. By engaging the community and working in partnership with the Victorian and Australian Governments, Stawell was able to find a new source of economic growth that built on its existing strengths and resources (PC 2017, p. 135).
Guidance from States
In some cases, councils are seeking, or may benefit from, clearer guidance from States on their planning goals and desired outcomes so as to allow these to be more closely reflected in local development plans, and to support more effective community engagement in planning processes (box 5). As a practical matter, this may be necessary to achieve objectives where there are doubts as to the capacity of Local Governments to fulfil their legislative responsibilities.
A common cause of tensions is proposals to increase the density of housing in existing urban areas close to services, transport and workplaces (notably, a survey conducted by Kelly et al. (2011) found a majority of people in capital cities would not like their neighbourhood population to increase).

SP 10 – REALISING THE PRODUCTIVE POTENTIAL OF LAND 21
Box 5 Ease of integrating State and Local plans • Pugalis and Tan reported that councils believe the Tasmanian and Western Australian planning
systems lack clear State level policy frameworks, which limits the ability for Local Governments to plan strategically. Councils in those States reported they felt like they are ‘working in a vacuum’ due to the lack of an economic development strategy or guidance on population growth patterns.
• In a report for the Property Council of Australia following a workshop involving leaders in planning and housing at all levels of government, academia, and private sectors, Deloitte Access Economics noted that: A number of participants indicated a belief that a lack of clarity and direction in State strategic plans were causing excessive assessment effort at the Local Government level as councils sought to meet their, sometimes unclear, requirements … Participants opined that strategic plans were typically light on specific details that would assist councils in understanding how particular land was to be developed. This was seen to place the risk of assessment back onto councils who were left to interpret how a development was to be assessed, for example, when subject to multiple overlays.
• The Victorian Auditor General has noted that, while ‘local planning schemes allow a clearly expressed strategic vision through their municipal strategic statements, … the state’s planning framework — the VPP [Victoria Planning Provisions] — has no strategic vision to help integrate and prioritise its nine policy themes and over 87 policy objectives or connect it to the strategic state and regional priorities, such as those identified in Plan Melbourne (2014)’.
• The Commission’s study on transitioning regional economies noted concerns by the Upper Spencer Gulf Common Purpose Group and Northern Tasmania Development Corporation about lack of coordination in strategic planning across levels of government. This was considered to lead to fragmented planning efforts and a lack of community faith in planning processes.
Sources: NTDC (2017); PC (2017); USGCPG (2017); VAG (2017, p. vii); DAE (2016, p. 21); Pugalis and Tan (2016).
The experience of successful urban renewal programs (see for example, Kelly and Donegan 2015; SGS Economics & Planning 2014) suggests potential gaps in strategy development and/or communication with respect to policy goals, which may be more usefully debated as being the management of population growth, rather than population levels per se. This approach encourages consideration of costs, benefits, and different ways that tradeoffs can be managed. A feature of urban renewal plans in areas of Canada, for example (viewed as exemplary by some), was accompaniment of increases in density with the provision of high quality amenity and public spaces (box 6 describes Vancouver’s experience).

22 PRODUCTIVITY REVIEW
Box 6 Urban renewal programs in Vancouver Vancouver took a highly inclusive approach to strategic planning, which has been noted around the world for its involvement of citizens in building a shared vision for the city.
In the 1990s, Vancouver directly engaged more than 20 000 of its residents in the development of its CityPlan. Residents were initially consulted on the direction and objectives of the city, and were provided a number of growth strategies to deliberate, with trade-offs involved in choosing the different paths made clear. Following this process, residents were engaged at the local level, and the plan progressively developed over four years. A key element of the consultation process was that city officials and planners did not provide a preferred option and consensus was not sought.
The pros and cons of different growth strategies were presented to residents. For example, each neighbourhood was told that the larger the population supported by more dwellings, the bigger the neighbourhood’s contribution to government tax revenue and the larger the distribution it would receive to improve the area with community amenities such as libraries. Working with developers and builders, residents frequently opted to get more of the amenities they valued by allowing some buildings to be even higher than required for the area’s housing targets.
The planners recognised the need for people to understand that growth could provide benefits. The city is now experiencing reduced commute times in spite of an increase in the city’s population. Source: Kelly and Donegan (2015, pp. 157–158).
Industry groups and other observers have also raised the need for clearer direction on the application of planning instruments by most States and Territories, noting that the necessity for interpretation is a source of avoidable variation in local planning rules (PCA 2015). For example:
• for development application assessments in Western Australia, councils only need ‘have due regard to’ approved State planning policies ‘to the extent that, in the opinion of the Local Government, those matters are relevant to the development’ (WADP 2017b). Some councils in Western Australia consider this does not provide sufficient guidance for them to plan strategically (Pugalis and Tan 2016)
• developers in Tasmania have found the State’s dwelling code to contain numerous exclusions, which makes it difficult to determine its application, and is subject to different interpretations by local councils (PCA 2015)
• New South Wales currently has 50 State Environmental Planning Policies (SEPPs) (including deemed SEPPs) that specify planning controls for certain areas and types of developments. It is sometimes unclear why and how SEPPs apply. For example, State Environmental Planning Policy (Mining, Petroleum Production and Extractive Industries) 2007, which has the aim of establishing an assessment process for certain mining and petroleum developments is applicable to the Ryde council area, but its relevance is unclear, with Ryde being a highly urbanised residential and commercial Sydney district. The Government is currently reviewing all SEPPs with a view to streamlining them and ensuring their relevance (NSWPE 2016)

SP 10 – REALISING THE PRODUCTIVE POTENTIAL OF LAND 23
• the Victorian Auditor General recently found that a number of Local Governments had prohibited medium-density housing development in areas that the 2013 State Planning Policy Framework had designated as permitting. Local Governments have also created 153 local variations to the new residential zones introduced in 2013, resulting in local schemes being inconsistent with the objectives of the State planning policies and adding unnecessary complexity in planning schemes. The Auditor General has suggested that the State Government needs to provide more guidance and training to Local Governments to support its reforms (VAG 2017).
Notwithstanding that development strategies and proposals are often contentious, there appear to be few consequences for Local Governments that do not ultimately seek to implement State-level policies.
For example, several councils in Victoria have not met local planning statutory review obligations, with some lagging for as long as seven years (VAG 2017). While State ministers generally can influence local planning schemes by imposing conditions when councils submit their plans or amendments to plans for approval, such as changes in height controls or rezoning, the effectiveness of this process relies on enforcement. One legal firm with expertise in urban planning processes reported that local councils in New South Wales do not always apply State conditions, and lack of enforcement is leading to complacency:
Sometimes local councils respond to ‘soft power’ by pretending to agree, but ensuring efforts are frustrated in the fine detail of plans, policies and approvals. Other times, local councils engage in overt acts of defiance that, in the past, have often gone unanswered by state authorities … Regretfully, in our experience, gateway determination obligations [State conditions or variations to council proposals to change local planning controls] are routinely breached by local councils. A local council is breaking the law if it breaches its obligations under a gateway determination, however it is difficult (if not impossible) to enforce these obligations in the courts. The (past) lack of enforcement means that gateway determination obligations are frequently not taken seriously by local councils. (Gadiel 2016)
More significant interventions by States — such as calling in developments, or substituting a State body as the planning authority — are, understandably, not often used (Gadiel 2016; PC 2011b). In the first instance, it would seem sensible for State Governments to better engage with local councils, clarify requirements under existing regulations, where needed, and enforce compliance.
Overall, the Commission considers that State planning policies should provide clear guidance on how Local Government strategies should be developed, including specification of policy priorities, preferred methods for achieving them, and that make clear the relevance of State planning policies to which local council must have regard. Guidance should include a clear hierarchy for State and local plans.
This would help to ensure that State policy goals and standards are delivered, reduce the time and the degree of contention involved in setting local plans, and provide greater regulatory certainty to development proponents. Clearer guidance to Local Governments
24 PRODUCTIVITY REVIEW
on States’ strategic plans and the application of planning policies will also help to ensure better accountability for decisions at each level of government. In turn, this will facilitate the more efficient resolution of legitimate community concerns and transparent decision making.
Linking of local plans to changes in State policies
In New South Wales, Victoria, Queensland and Western Australia, statutory review periods for local plans are not linked to major State policy changes. At best, local planning schemes are required to be reviewed every four to five years. As part of its ongoing reforms, New South Wales has proposed a legislative requirement that local councils check their local plans every five years to determine if they are still appropriate and fit for purpose (NSWDPE 2017a).
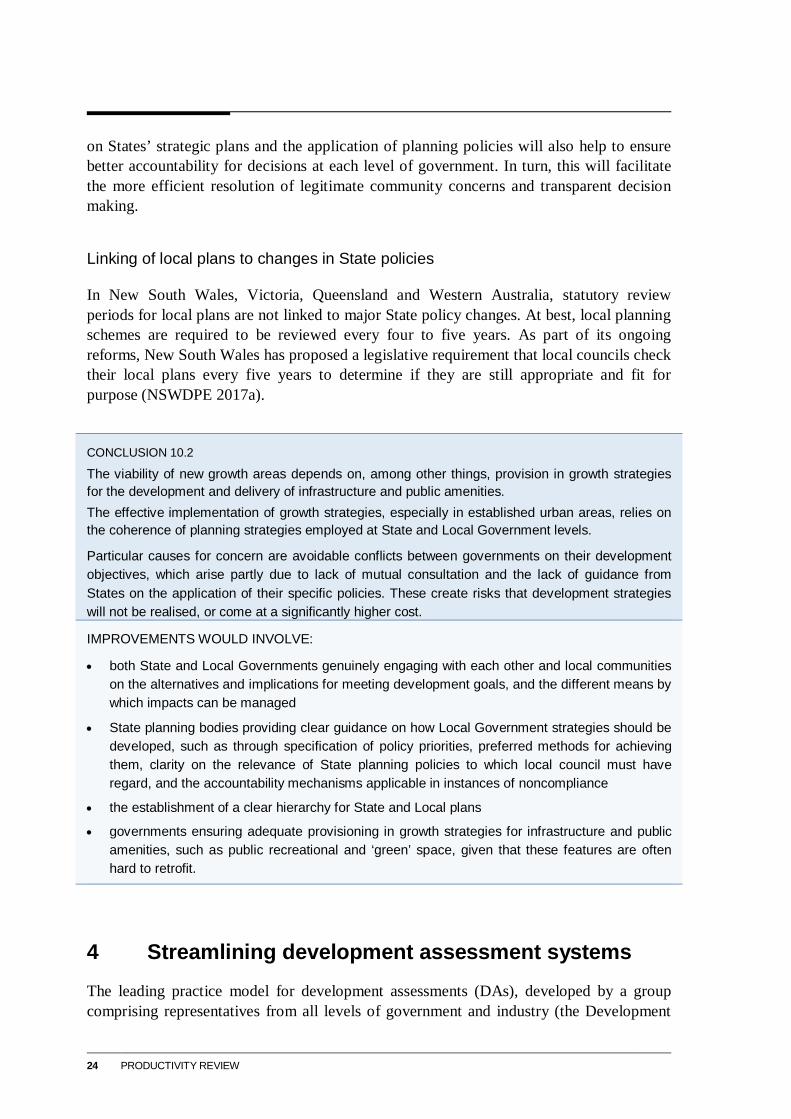
CONCLUSION 10.2
The viability of new growth areas depends on, among other things, provision in growth strategies for the development and delivery of infrastructure and public amenities. The effective implementation of growth strategies, especially in established urban areas, relies on the coherence of planning strategies employed at State and Local Government levels.
Particular causes for concern are avoidable conflicts between governments on their development objectives, which arise partly due to lack of mutual consultation and the lack of guidance from States on the application of their specific policies. These create risks that development strategies will not be realised, or come at a significantly higher cost.
IMPROVEMENTS WOULD INVOLVE:
• both State and Local Governments genuinely engaging with each other and local communities on the alternatives and implications for meeting development goals, and the different means by which impacts can be managed
• State planning bodies providing clear guidance on how Local Government strategies should be developed, such as through specification of policy priorities, preferred methods for achieving them, clarity on the relevance of State planning policies to which local council must have regard, and the accountability mechanisms applicable in instances of noncompliance
• the establishment of a clear hierarchy for State and Local plans
• governments ensuring adequate provisioning in growth strategies for infrastructure and public amenities, such as public recreational and ‘green’ space, given that these features are often hard to retrofit.
4 Streamlining development assessment systems The leading practice model for development assessments (DAs), developed by a group comprising representatives from all levels of government and industry (the Development

SP 10 – REALISING THE PRODUCTIVE POTENTIAL OF LAND 25
Assessment Forum) in 2005, is based on the notion that the degree of scrutiny of applications should reflect the level of risk the development poses.3
The model provides for categorisation of development applications into assessment ‘tracks’ that correspond to the level of impact, hence assessment required, to make an informed decision. The assessment tracks include (in order from least to highest impact): exempt, prohibited, self-assess (self-assessment by the applicant against clear quantitative criteria), code assess (where the assessor considers the proposal against objective criteria and performance standards), merit assess (expert assessment against complex criteria) and impact assessment (for proposals that may have significant impacts on surroundings) (DAF 2005; PC 2011b).
The types of developments that can be fast-tracked vary between jurisdictions. For example:
• New South Wales has a ‘complying development’ track, which is a fast track assessment process involving combined planning and building approval for proposals deemed low impact (such as property extensions up to two storeys)
• Victoria has a ‘VicSmart’ 10-day assessment track for low-risk local developments, which has recently been expanded, but no self-assessment track (PC 2012)
• in Western Australia, fast-tracking is only possible for residential dwellings. Recent reforms have introduced development approval exemptions for compliant residential dwellings
• in South Australia, ‘complying developments’ are those considered to have a low impact on the local area and an assessment authority cannot withhold approval if all criteria necessary for the development to comply are met
• Tasmania provides for a ‘no permit required’ status for single dwellings that comply with development standards in the General Residential Zone
• Tasmania, the Northern Territory and the ACT provide zone use tables, which specify the assessment tracks for different developments within any given zone.
Some jurisdictions provide flexibility for assessment authorities to require less information (for example, Victoria) and Queensland encourages pre-lodgement discussions. A 2015 report by the Property Council of Australia (PCA) (2015) ranked the Northern Territory and the ACT as particularly well-performing jurisdictions in terms of their more specific track assessment frameworks.
3 The Development Assessment Forum (DAF) was formed in 1998 to reduce the length and complexity of
DA processes. It developed a ‘Leading Practice Model’, which was endorsed by State and Territory planning ministers in 2005 (PC 2011b). The DAF was established following the Report of the Small Business Deregulation Taskforce recommendations in 1996 for governments to change its DA processes (DAF 2014).

26 PRODUCTIVITY REVIEW
Most jurisdictions have made progress in further adopting fast-track assessment systems over the past five years (box 7).
These reforms have led to efficiency improvements in DA processing across jurisdictions. The mean time taken to process the majority of DAs has reduced from an average of 282 days (for about 60 per cent of all DAs) for the period 2009–2012 (Cordell Information in PC 2014a) to between 48-76 days between in 2012–2015 (table 1). A World Bank report (2017) noted that Australia, proxied by Sydney, had made notable improvements in the time taken to process construction permits.4 Australia ranked 2nd in the world on this measure in 2017, compared with 63rd (out of 183 countries) in 2011 (World Bank 2011).
Table 1 Time taken to process development applications
Select States and Territories
Jurisdiction Average gross days taken Year
New South Walesa 71 2014-15 Victoriab 115 2014-15 Queenslandc 72 2011–2012 South Australiad 52–66 2014-15 ACT 41-57 2014-15
a Excludes complying development certificates. b Inclusive of weekends and public holidays. c This average refers to business days and pre-dates the reforms referred to in this report. d Median number of calendar days for category 3 merit assessments, which require publication of a general public notice. Sources: ACT (2017); NSWDPE (2016); QDSDIP (2013); SADPTI (2015); VDTPLI (2017).
There is nevertheless room for further progress in most jurisdictions. A common theme across jurisdictions is that, where streamlined track-assessments exist, approval times vary between local councils. For example, in Victoria, Melbourne City Council took 74 days to process DAs, whereas Frankston City took 96 days (Victorian Government 2017). These differences may reflect in part differences in the capacities of Local Governments (PC 2011b), as well as the relative complexity of different development types.
4 Measured by the procedures, time and cost to complete all formalities to build a warehouse. The reported
improvements included streamlined procedures and improved coordination among agencies involved in the process (World Bank 2017).

SP 10 – REALISING THE PRODUCTIVE POTENTIAL OF LAND 27
Box 7 Development assessment processes – recent reforms The NSW Government has made ongoing refinements to the NSW Housing Code exempt and complying development assessment pathways for local developments. These changes have increased the number of fast-tracked development applications or complying development certificates (CDC) from 23 per cent in 2011-12 to 32 per cent in 2014-15 of all development applications and CDC determinations. A new Housing Code effective from July 2017 further simplifies planning rules for complying developments, including one and two storey homes and renovations.
The Victorian Government introduced a streamlined process for low-risk local developments, such as simple sub divisions, extensions and building works called ‘VicSmart’ in September 2014. The key features of ‘VicSmart’ include a 10 day permit process, non-advertising of applications, a requirement that developments must be located in a specified zone or overlay, and the CEO of the Local Government or delegate deciding applications. The streamlined assessment process was extended in March 2017 for building and works up to $1 million in industrial areas, building and works up to $500 000 in commercial areas and a range of low impact developments in rural areas.
The Victorian Government introduced a Smart Planning program in July 2016 aimed at making the planning system easier to understand and more efficient through simpler rules and modern digital tools.
The Queensland Government created the State Assessment and Referral Agency (SARA) in 2013. SARA is a single lodgement and assessment point for State development proponents where the State has jurisdiction as assessment manager or referral agency. The Queensland Government’s new planning legislation (2016) further changed the legislative instrument governing DA processes from primary to subordinate legislation to allow the system to be more responsive to changes. Reforms reduced the categories of development from five to three, instituted new decision rules for both code and impact assessable applications, and new tools for applicants.
Western Australia and South Australia have committed to establish further track-based development assessment paths, but they are as yet to be implemented. Reforms to date have, amongst other things, focused on the role of expert panels. The Western Australian Government has established and refined the role of Development Assessment Panels to include professionals in the determination of applications for substantial projects at the local level. The South Australian Government established an independent State Planning Commission to act as the State’s planning advisory and development assessment body. Part of the Commission’s role is to oversee the new Council and Regional Assessment Panels. Similar to Western Australia, these panels mostly comprise accredited professionals.
The Northern Territory Government further streamlined its development approval process in 2016 for ‘low risk, low impact’ development, such as minor commercial additions. This amendment reduced regulatory burden and unnecessary delays as previously minor development proposals required consent through a full planning approval process. Sources: NSWDPE (2016, 2017b); Northern Territory Government (2016); QDILGP (2016a); WAPC (2014); SADPTI (2017a); VDELWP (2016, 2017c).
A 2016 study suggests that for large or high-value residential projects, where the State planning department is responsible for assessing the DA, there are more speedy response times than where councils make the decision (Shoory 2016). For example, in Victoria, the Minister for Planning is responsible for assessing large-scale projects in the City of Melbourne with a floor space exceeding 25 000 square meters, which has partly
28 PRODUCTIVITY REVIEW
contributed to strong growth in inner city apartments. In Brisbane, it is a large Local Government — the Brisbane City Council — that generally has assessment responsibilities for development within the central business district, and its application of a code-assessment framework to large developments has contributed to apartment growth. In contrast, in areas where the DA process is handled by local councils, with their own specific overlays and zoning restrictions (such as in inner and middle suburbs of Sydney and Melbourne), the approval process is often slower and housing supply takes longer to adjust.
Ideally, DA processes would allow for genuine third party interests to be factored into decisions while minimising the scope for inefficiency. The Development Assessment Forum model recommends that third-party appeals should only be provided in limited cases, and not provided where applicants are assessed against objective rules and tests (DAF 2005).
The approaches of jurisdictions on this matter differ, and are worth assessing against the model’s recommendations. For example, Victoria’s planning system is more open to third party reviews than other jurisdictions. A higher proportion of planning decisions in Victoria are thus reviewed. In 2014-15, 22 767 of 57 297 permit applications received (39 per cent) were advertised to third parties and 2292 (4 per cent) were subject to review by Victorian Civil & Administrative Tribunal (VCAT) (VDTPLI 2017). In New South Wales, third party objectors must have a ‘relevant interest’ in the development. In 2014-15, reviews and appeals accounted for 761, or less than 1 per cent, of the 106 077 permit applications received (NSWDPE 2016).
In its 2013 White Paper on planning reforms, the NSW Government proposed that 80 per cent of all DAs should be subject to the fast-tracked approval pathways of either complying developments (proposals deemed low impact that can be approved upon satisfaction of set criteria, such as property extensions up to two storeys) or code assessment (other proposals that could also be approved through set criteria) (NSW Government 2013).
Following the failure of reforms to pass the NSW Parliament, the Government has decided to not pursue code-assessment as a pathway and instead committed to ongoing improvement of the complying development track — an assessment pathway for proposals deemed low impact (such as property extensions up to two storeys). In 2011-12, the proportion of complying developments as a proportion of all DAs was 23 per cent. In 2014-15, this was 32 per cent. A report commissioned by the NSW Government estimated that the benefit of original reforms would be worth between $358 million and $550 million per year in reduced risks associated with developments and avoided costs of delay and documentation (CIE 2013).5
5 An earlier report commissioned by the NSW Government estimated that changes to New South Wales’
DA processes from the reforms in the NSW White Paper on planning reforms would be $174 million per year in avoided costs of delay and documentation (Deloitte 2012). The difference between this and the

SP 10 – REALISING THE PRODUCTIVE POTENTIAL OF LAND 29
CONCLUSION 10.3
There have been improvements in development assessment processes in all jurisdictions but there is still room for improvement in most.
5 Stamp duties Stamp duties are transaction taxes levied by States and Territories, including on the sale or transfer of land and the sale or transfer of business assets. They are levied on an ad valorem basis, such that the rate of duty imposed increases with the value of the property, and are paid by property purchasers.
Stamp duties on residential property add to the price of houses, and can discourage people from moving to locations that may be closer to preferred jobs, family networks and schools (PC 2014b). This can result in increased commuting times and costs (Henry et al. 2009) and the potential effects on mobility become more accentuated the greater are the frictions of moving between work and home. Stamp duties on commercial property further discourage businesses from investing in existing land and capital, and stamp duties on residential property can discourage people from downsizing and encourage overinvestment in upgrading property. All of these factors result in the retention of land for relatively unproductive purposes.
In Sydney, stamp duty on residential property for the median house and unit price as of May 2017 of $1 198 650 and $762 590 was $51 419 and $29 807 respectively (CoreLogic 2017).6 This represents 4.3 per cent and 3.9 per cent of the purchase price, respectively.
The impacts of these costs on community welfare are significant. One study found that a 10 per cent increase in stamp duty lowered housing turnover by 3 per cent in the first year, and by 6 per cent if sustained over a 3 year period (Davidoff and Leigh 2013). Another study in the United Kingdom found that, when stamp duty on housing transactions was suspended for 16 months on lower value transactions (in response to the global financial crisis), there was an 8 per cent increase in property transactions (Besley, Meads and Surico 2014).
Recent Australian Treasury modelling estimated that each additional dollar collected by way of stamp duties reduces the living standards of Australian households by 72 cents in
CIE report was that the earlier report did not incorporate an estimate of the costs of excessive risk arising from the NSW planning system , which CIE estimated at between $221 million and $305 million per year.
6 Stamp duty on residential property assumes the purchaser is not a first home buyer, who may be exempt, or a ‘foreign purchaser’, who faces a different rate.
30 PRODUCTIVITY REVIEW
the long-run due to the lower investment and mobility effects (Australian Government 2015).
Stamp duties on the transfer of residential and commercial property also are a relatively volatile revenue source. Stamp duties presently represent the single largest revenue source in most jurisdictions yet receipts depend on activity in property markets and are highly vulnerable to economic cycles.
Recognising the economic costs of stamp duties, South Australia recently started phasing out stamp duty for all non-residential, non-primary production land from July 2016, with the aim of completely abolishing these duties by July 2018 (Revenue SA 2016).
New South Wales abolished duty on the transfer of business assets and declarations of trust over business assets (other than land) from 1 July 2016. The Victorian Government announced the abolition of stamp duty for first-home buyers who buy a home with a dutiable value of $600 000 or less and a concessional rate of duty to $750 000 from 1 July 2017 (although this was predominantly for housing affordability reasons).7
The ACT, most notably, has moved from stamp duties to greater utilisation of its property-based taxes (discussed below).
A shift from stamp duties to taxes based on land value
Taxes based on land values avoid the imposition of penalties for moving, and the inequity of tax burdens falling disproportionately on those who choose to move, whether for work or lifestyle reasons.
In contrast to stamp duties, broad based taxes based on land value have a low economic cost because land is immobile and cannot be moved or varied to avoid tax (Australian Government 2015). Tax revenue is also more stable because it is not as exposed to the volatility of the housing market.
The Grattan Institute estimated that shifting from replacing stamp duties in all States with a broad based land tax could add $9 billion annually to GDP (Daley and Coates 2015). The majority of benefits would accrue directly to those jurisdictions from a more productive workforce and the more productive use of land.
Practical considerations
The ACT Government’s move illustrates the feasibility of the proposed shift in tax bases, although its task is somewhat more straightforward as both the rating and taxing authority 7 The dutiable value of a property is the market value or purchase price less any deductions such as the
off-the-plan concession.
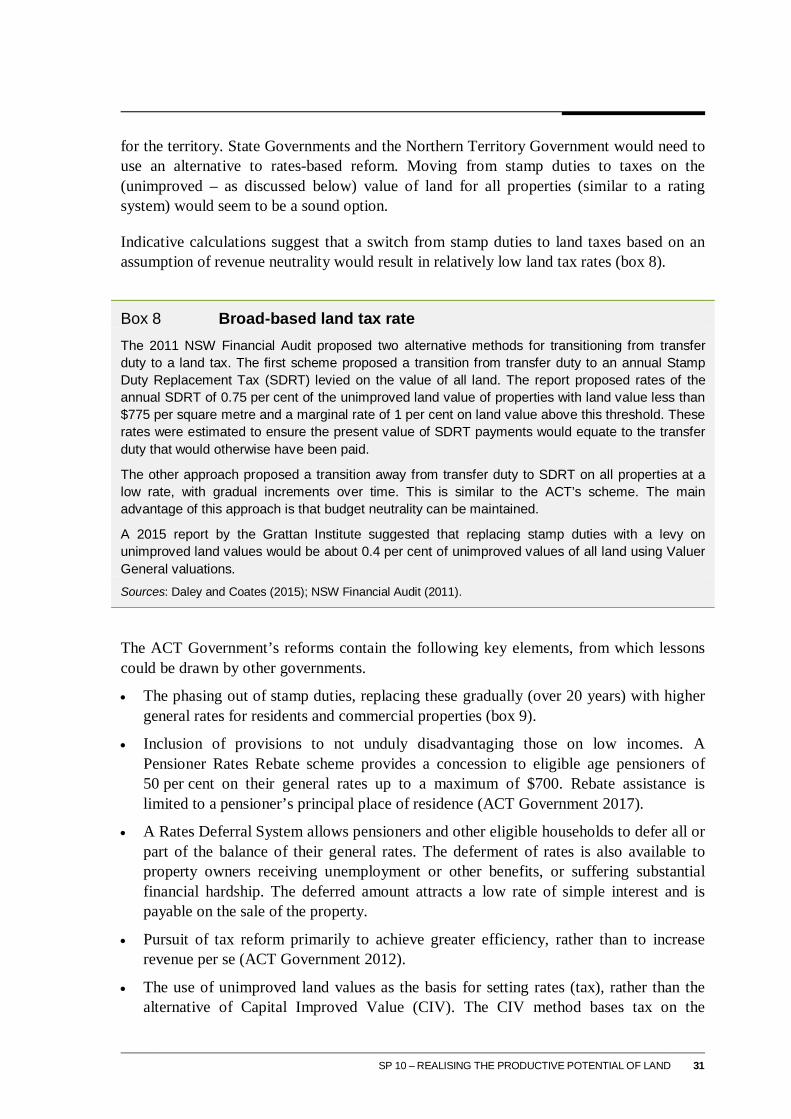
SP 10 – REALISING THE PRODUCTIVE POTENTIAL OF LAND 31
for the territory. State Governments and the Northern Territory Government would need to use an alternative to rates-based reform. Moving from stamp duties to taxes on the (unimproved – as discussed below) value of land for all properties (similar to a rating system) would seem to be a sound option.
Indicative calculations suggest that a switch from stamp duties to land taxes based on an assumption of revenue neutrality would result in relatively low land tax rates (box 8).
Box 8 Broad-based land tax rate The 2011 NSW Financial Audit proposed two alternative methods for transitioning from transfer duty to a land tax. The first scheme proposed a transition from transfer duty to an annual Stamp Duty Replacement Tax (SDRT) levied on the value of all land. The report proposed rates of the annual SDRT of 0.75 per cent of the unimproved land value of properties with land value less than $775 per square metre and a marginal rate of 1 per cent on land value above this threshold. These rates were estimated to ensure the present value of SDRT payments would equate to the transfer duty that would otherwise have been paid.
The other approach proposed a transition away from transfer duty to SDRT on all properties at a low rate, with gradual increments over time. This is similar to the ACT’s scheme. The main advantage of this approach is that budget neutrality can be maintained.
A 2015 report by the Grattan Institute suggested that replacing stamp duties with a levy on unimproved land values would be about 0.4 per cent of unimproved values of all land using Valuer General valuations. Sources: Daley and Coates (2015); NSW Financial Audit (2011).
The ACT Government’s reforms contain the following key elements, from which lessons could be drawn by other governments.
• The phasing out of stamp duties, replacing these gradually (over 20 years) with higher general rates for residents and commercial properties (box 9).
• Inclusion of provisions to not unduly disadvantaging those on low incomes. A Pensioner Rates Rebate scheme provides a concession to eligible age pensioners of 50 per cent on their general rates up to a maximum of $700. Rebate assistance is limited to a pensioner’s principal place of residence (ACT Government 2017).
• A Rates Deferral System allows pensioners and other eligible households to defer all or part of the balance of their general rates. The deferment of rates is also available to property owners receiving unemployment or other benefits, or suffering substantial financial hardship. The deferred amount attracts a low rate of simple interest and is payable on the sale of the property.
• Pursuit of tax reform primarily to achieve greater efficiency, rather than to increase revenue per se (ACT Government 2012).
• The use of unimproved land values as the basis for setting rates (tax), rather than the alternative of Capital Improved Value (CIV). The CIV method bases tax on the

32 PRODUCTIVITY REVIEW
unimproved value of land plus any capital improvements to the land, such as buildings and extensions. Studies suggest taxing capital improvements discourage asset owners from undertaking productive investments (Daley and Coates 2015; Henry et al. 2009; IPART 2016).
A key design consideration in reform, as found by the ACT, is providing for property owners with low recurrent incomes. This matter is considered below.
SP 10 – REALISING THE PRODUCTIVE POTENTIAL OF LAND 33
Box 9 Phasing out stamp duty in the ACT
Tax mix switch
Stamp duty rates on conveyances have been progressively reduced since June 2012, with the aim of phasing out the duty completely over a 20 year period. As part of the reform program, stamp duty on insurance policies were also phased out (and fully abolished in 2016-17). Since the reform program started in June 2012, duty on a $500 000 property has been cut by 34 per cent. The Territory’s 2016-17 budget estimates that, by 2020-21 (the half-way point of the tax reform program), duty on a $500 000 house will have been cut by 51 per cent.
To replace the loss of stamp duty revenue, the ACT Government increased general rates for both the residential and commercial sectors. In addition, residential land tax (on investment properties) has been made more progressive. Land tax rates were reduced for properties up to $275 000 in value (attracting, at most, 0.89 per cent), and increased from 1.4 to 1.8 per cent for all properties valued above that threshold. The ACT Government estimated that land tax rates would decrease by an average of $208 for 76 per cent of properties, while 12 per cent would incur an increase of $602.
The ACT is somewhat unique in that, as a Territory, the ACT Government can be both the land taxing and general rate levying authority. Thus it could reform the tax mix with relatively little administrative disruption.
In addition to higher general rates, the structure of rates was changed from a flat rate to a two-part marginal rate structure, consisting of a fixed charge of $555 to all households, and a progressive marginal tax rate linked to land value. Average general rates have increased by about $452 compared with what they would have in the absence of reform. Increases in the progressivity of the rates system has meant that low-value properties have been less affected by the transition.
Addressing welfare impacts
To address welfare impacts from the new system, the general rates rebate for eligible recipients was increased from $481 to $565, and the eligibility criteria for deferring general rates was expanded to include people aged over 65, and land values above $390 000. As at 2017, eligible households receive up to 50 per cent rebate on general rates up to a maximum of $700. Households who were eligible for the general rates concession rebate on 30 June 1997 are eligible for the uncapped general rates concession, up to the value of the concession received in 2015-16. The uncapped general rates scheme was frozen at 2015-16 levels from 1 July 2016.
From 1 July 2016, the eligibility criteria for general rates deferral to pensioners is based on the following criteria: aged 65 and over; and the combined income of all property owners must be below the annual average earnings of $89 300; and the unimproved value of the property must be higher than the 80th percentile value of $442 000; and property owners must have at least 75 per cent equity in their home. In addition to eligible pensioners, property owners receiving unemployment or other benefits, or suffering substantial hardship, can apply to defer payment of their rates charges.
(continued)
34 PRODUCTIVITY REVIEW
Box 9 Phasing out stamp duty in the ACT (continued)
Impact
The ACT Government estimated that the economic benefit from the reduction in stamp duty would be about $13.3 million in GSP within the first year of the reform, and provide additional benefits over the transition period.
Since the reform package was introduced in 2012-13, general rates revenue is now the largest component of the ACT’s own source tax revenue, at approximately 27 per cent of total revenues in 2016-17 compared with 18 per cent in 2011-12. Revenue from inefficient taxes such as stamp duty on conveyance and insurance policies has declined from 24 per cent of total own source tax revenue in 2011-12 to an estimated 16 per cent in 2016-17. The share is anticipated to decline further as the transition of the tax bases continues.
In general it appears the public is accepting of these changes: In 2012 the ACT government began phasing out stamp duty over 20 years, and replacing it with higher municipal rates … The ACT … opposition campaigned to freeze general rates increases, thereby halting the government’s swap of stamp duty for rates. But the (opposition) suffered a 2.6 per cent swing against them, while the vote for the incumbents remained steady. The result shows that the community can be persuaded that general property taxes are better than stamp duties for raising revenues. (Daley and Coates 2016).
Sources: ACT Government (2012); ACT Revenue Office (2017); ACT Government (sub. 41).
A key design consideration – not disadvantaging low income households
A shift to broad based land taxes may detrimentally affect owner-occupier households with low incomes, such as many retirees, who may have less flexibility to move and limited capacity to pay taxes from current income. Options for addressing welfare impacts include concessional rates for tax, the deferment of tax or help via the income support system.
Studies suggest that, on the whole, mechanisms for deferment are preferable to providing concessions as design of the latter would need to take into account the potential for inequitable outcomes arising from the existing tax and transfer systems. For example, if eligibility for concessional rates centred on age pension status, this would result in discrimination between taxpayers based on present incomes, rather than whole-of-life capacity to pay given that the principal residence is not included in the age pension assets test (Daley et al. 2013). Low-income households that do not qualify for or receive the age pension would have to pay relatively higher rates on a whole-of-life basis.
In contrast, deferment of taxes treats taxpayers equally based on land values, and is thus relatively more straightforward. State-based deferral arrangements already exist for seniors paying property based taxes (in this case Local Government rates) in South Australia and Western Australia. Other examples are set out in box 10.
By their nature, land taxes help to ensure that land is used in ways that is most valued by the community (whether this is residential or commercial, and in accordance with

SP 10 – REALISING THE PRODUCTIVE POTENTIAL OF LAND 35
preferences within these groups). It is envisaged that the accumulation of deferred debt would therefore prompt property owners to consider, or consider earlier, whether their current or a different property would best suit their needs. In some cases, however, deferment resulting in the accumulation of a large amount of debt may reduce the capacity to move as it reduces the amount available for a new purchase. This suggests that there may be merit in capping the amount of tax that may be deferred. Acknowledging that property is often used as a vehicle for intergenerational wealth transfer (Barrett et al. 2015), capping would also prevent debts accruing to a level that makes substantive differences to bequests.
On the basis of long-term trends, it is probable that rates of growth in the value of residential land would far exceed growth in debt servicing rates, so the latter in itself is unlikely to substantially affect property values.8
Debts should attract low rates of interest consistent with the policy objective of deferment, ideally reflecting the cost of revenue deferral to the equity provider (State and Territory Government). Under the ACT rates deferment scheme, the interest rate applied is the 90-day bank bill rate.
Unintended effects from deferment also need to be considered in the design of deferment policies and setting of eligibility criteria, such as restrictions on working hours, which may create labour market distortions. For example, to be eligible for the South Australian Postponement of Rates scheme, a ratepayer must be over 60 years old and work fewer than 20 hours a week in paid employment. Low-income earners working over 20 hours per week may choose to reduce their labour force participation to below the hours-worked threshold to be eligible for the deferment scheme (box 10).
In summary, key elements of reform would include:
• Replacement of stamp duties on property transfers with a broadly-based tax based on land values. The shift to a broad basis is essential to ensure that revenue is raised efficiently and the tax burden is not disproportionately imposed on a few groups.
• In the implementation phase, tax rates that seek revenue neutrality and allows transition over several years.
• Provision for tax deferral for certain low income groups, so that taxes do not force people with less capacity to move. These include people such as owner-occupier retirees, who may be attached to the family home and their community (Daley and Coates 2015).
• Deferred taxes would be paid from estate at death or on the sale of the property (whichever comes first).
8 Residential land and dwelling values have increased on average by 8.4 per cent p.a over the past 20 years
while over the same period the debt servicing ratio has increased by 1.2 percentage points. However, buyers will factor in the discounted tax liability into the purchase price of the property, which will put downward pressure on prices.
36 PRODUCTIVITY REVIEW
• Interest rates on deferment of taxes should be low, for example bond rates, consistent with the policy objective of deferment.
Depending on the sequence and pace of States undertaking reforms, the Commonwealth may need to be involved in facilitation; among other things to ensure that the Commonwealth Grants Commission’s horizontal fiscal equalisation (HFE) process does not provide disincentives to improve the efficiency of State taxes in this way. The Productivity Commission’s report into HFE, which will be produced in draft by October 2017, will look at the incentives the current system creates for undertaking such reforms.
Box 10 Examples of deferment systems • The New Zealand Local Government Act 2002 (NZ) gives local councils the authority to set
council rates postponement policies, with the debt secured against the equity in their property. For example, Auckland allows low-income rate payers to postpone a maximum of 80 per cent of available equity in the primary place of residence (different between value of the property and existing debt on the property), with postponement fee charged from when the rate was originally due. It is payable upon sale, death, or relocation. The person must use the property as the primary residence, and, in general, earn less than $24 470. Some councils restrict eligibility to people over 65 years of age.
• Ontario, Canada, has a Provincial Land Tax Deferral Program for low income seniors and people with disability to partially defer land tax, with the debt payable upon sale or death. They must be in receipt of the Guaranteed Income Supplement (welfare payment) to be eligible.
• Western Australia offers eligible seniors (holding government pensioner or senior card) 50 per cent rebate on council rates, which they may also defer upon satisfying certain criteria. It does not incur interest charges. Debts are payable upon sale, relocation or death where there is no surviving spouse. Deferred charges can be paid at any time but a rebate cannot be claimed when debts are paid. There are no limits on hours worked, but they must be a holder of government pensioner or seniors card.
• In South Australia, Local Governments can offer postponement to people who face hardship, or to seniors under the ‘Seniors Rate Postponement Scheme.’ This scheme allows rates to be deferred after the first $500 has been paid. It also requires that applicants have at least 50 per cent equity in their property, and not work more than 20 hours a week. Debts are subject to interest rates and payable on sale, relocation or death where there is no surviving spouse.
Deferment schemes can create some adverse consequences. For example, deferment may crystallise household debt and create a disincentive to move (with similar effects as stamp duty that land taxes intend to avoid). Large accumulated debts may reduce the capacity to move as it reduces the amount available for a new purchase. Where eligibility is based on hours worked or welfare status, this may distort labour market participation and compound the disincentive to work. These factors suggest that there may be benefit in capping the allowable level of accumulated debt, and income earning rules should be more flexible. Sources: Auckland Council (2017); NZDIA (2016); NZOAG (2006); NZWBPDC (2016); Ontario Ministry of Revenue (2017); Revenue SA (2016); WADF (2016).
SP 10 – REALISING THE PRODUCTIVE POTENTIAL OF LAND 37
CONCLUSION 10.4
State Governments and the Northern Territory should move from stamp duties on residential and commercial properties to a broad-based land tax on the unimproved value of land. The shift should include provision for low-income households to defer property taxes and fund them from their estate at death or on the sale of the asset (whichever comes first), similar to State-based deferral arrangements for Local Government rates.
6 The impacts of land reforms Overall, the potential net benefits from reform in these areas are estimated at about $10 billion per annum in the long term (30 years).
Replacing stamp duties with a broad-based land tax is estimated to provide a benefit of approximately $8.5 billion per annum in the long run. This estimate assumes that the broad-based land tax fully funds the removal of stamp duties. The benefits arise from people moving to residential properties that better suit their preferences, increasing labour mobility and reducing commuting costs. Benefits also arise from more productive land use and increased investment.
The estimate is based on recent analysis by Independent Economics (2014) and the Grattan Institute (2015). The estimate takes into consideration the transition to a broad-based land tax, assuming for the sake of simplicity a transition period of 20 years, as has occurred in the ACT.
The remainder of about $1.5 billion per annum arises from reforms to planning and zoning systems — specifically, lower costs associated with development delays, including the holding costs of land, documentation, and development risks. In addition, reducing the prescriptiveness of allowed land use will increase allocative efficiency by allowing land to be applied to more valued uses as preferences change over time.
The estimate is based on jurisdictional planning reform reports, particularly the estimated potential benefits of the New South Wales White Paper Reforms (CIE 2013; Deloitte 2012), and takes into account reforms that have been implemented since 2011, and possible implementation and transition costs.
There is considerable uncertainty in this estimate of planning reforms. On one hand, they are conservative because they do not consider land use restrictions imposed outside of broad zoning requirements, such as building heights. But an observation made by the Commission in its 2011 research report on planning, zoning and development assessment regulations remains relevant:

38 PRODUCTIVITY REVIEW
The state and territory planning systems have … been subject to rolling reforms, which are often not fully implemented or evaluated before being replaced with further reforms … (PC 2011b, p. XXII).
SP 10 – REALISING THE PRODUCTIVE POTENTIAL OF LAND 39
References
ABS (Australian Bureau of Statistics) 2013, Population Projections, Australia, 2012 (base) to 2101, Cat. no 3222.0.
—— (2017, Housing Finance, Australia, May 2017, Cat. no. 5609.0, July.
ACCC (Australian Competition and Consumer Commission) 2014, Reinvigorating Australia’s Competition Policy - Australian Competition & Consumer Commission Submission to the Competition Policy Review, 25 June.
ACT EPSDD (ACT Environment, Planning and Sustainable Development Directorate) 2017, Development application (DA) statistics 2014-15, www.planning.act.gov.au/development_applications/our_da_performance/development_application_da_statistics_2014–2015 (accessed 25 July 2017).
ACT Government 2012, A Fairer, Simpler and More Efficient Taxation System - 5 Year Reform Plan.
—— 2017, General Rates - Rebates and Deferments, www.assistance.act.gov.au/adult/fees_and_fines/fees/general_rates_rebates_and_deferments (accessed 29 May 2017).
ACT Revenue Office 2017, Rates assistance, www.revenue.act.gov.au/duties-and-taxes/rates/rates-assistance (accessed 19 April 2017).
ALDI Stores 2014, Submission to the Competition Policy Review, 6 October.
Allens 2017, Focus: Key planning reforms for developers, miners and major projects in NSW, www.allens.com.au/pubs/env/foenv19jan17.htm (accessed 30 July 2017).
Auckland Council 2017, Rates remission and postponement policy, Auckland, NZ.
Australian Government 2015, Re:think : Better Tax System, Better Australia Tax, Discussion Paper.
—— 2016, Planning for the future, State of the Environment Report, www.soe.environment.gov.au/theme/built-environment/topic/2016/planning-future (accessed 24 May 2017).
Baldwin, R. 2016, The Great Convergence: Information Technology and the New Globalization.
Barrett, G., Cigdem, M., Whelan, S. and Wood, G. 2015, The relationship between intergenerational transfers, housing and economic outcomes, Australian Housing and Urban Research Institute.
40 PRODUCTIVITY REVIEW
Besley, T., Meads, N. and Surico, P. 2014, ‘The incidence of transaction taxes: Evidence from a stamp duty holiday’, Journal of Public Economics, vol. 119, November, pp. 61–70.
CIE (Centre for International Economics) 2013, Reform of the NSW Planning System - Better Regulation Statement, October.
CoreLogic 2017, Corelogic Home Value Index, www.corelogic.com.au/research/monthly-indices.html (accessed 26 June 2017).
DAE (Deloitte Access Economics) 2016, A Federal Incentives Model for Housing Supply, Property Council of Australia.
DAF (Development Assessment Forum) 2005, A leading practice model for development assessment in Australia, March.
—— (2014, What is the forum?, daf.asn.au/about-the-development-assessment-forum (accessed 3 January 2017).
Daley, J. 2016, ‘Economic, social and political geography’, www.sgsep.com.au/publications/sgs-seminar-melbourne-how-pay-compact-city (accessed 17 January 2017).
—— and Coates, B. 2015, Property Taxes, Grattan Institute.
—— and —— 2016, Following the ACT land tax approach boosts growth and state budgets, www.grattan.edu.au/news/following-the-act-land-tax-approach-boosts-growth-and-state-budgets/ (accessed 5 February 2017).
——, McGannon, C., Savage, C. and Hunter, A. 2013, Balancing budgets: tough choices we need - supporting analysis, Grattan Institute.
Davidoff, I. and Leigh, A. 2013, ‘How do stamp duties affect the housing market?’, Economic Record, vol. 89, no. 286, pp. 396–410.
Deloitte 2012, Time and cost benchmarking project: a new planning system for NSW, Prepared for NSW Planning and Infrastructure.
Duranton, G. and Puga, D. 2013, ‘The growth of cities’, Centre for Economic Policy Research.
EIU (The Economist Intelligence Unit) 2016, A Summary of the Liveability Ranking and Overview, August.
Gadiel, A. 2016, Two-months of the Greater Sydney Commission – Your questions answered, Mills Oakley, www.millsoakley.com.au/two-months-of-the-greater-sydney-commission-your-questions-answered/ (accessed 17 March 2017).
Glaeser, E. 2010, Agglomeration Economics, The University of Chicago Press.
Harper, I., Anderson, P., McCluskey, S. and O’Bryan, M. 2015, Competition Policy Review, Final Report, March, Australian Government.
Henry, K., Harmer, J, Ridout, H and Smith, G 2009, Australia’s Future Tax System: Report to the Treasurer, December, Commonwealth of Australia.

SP 10 – REALISING THE PRODUCTIVE POTENTIAL OF LAND 41
Hilber, C. and Vermeulen, W. 2016, ‘The impact of supply constraints on house prices in England’, vol. 126, no. 591, pp. 358–405.
IA (Infrastructure Australia) 2017, Corridor Protection: Planning and investing for the long term, Reform Series, July.
IE (Independent Economics) 2014, Economics Impacts of Negative Gearing of Residential Property, June.
IPART (Independent Pricing and Regulatory Tribunal) 2016, Review of the Local Government Rating System, Draft Report, August.
—— 2017, Submission – draft Environmental Planning and Assessment Amendment Bill 2017.
Kelly, J. and Donegan, P. 2014, Mapping Australia’s Economy, July, Grattan Institute.
—— and —— 2015, City limits, Melbourne University Press.
——, Weidmann, B. and Walsh, M. 2011, The Housing We’d Choose, June, Grattan Institute.
Kohler, M. and van der Merwe, M. 2015, Long-run trends in housing price growth, RBA Bulletin, September, September Quarter.
KPMG (KPMG Economics) 2016, Housing affordability: what can be done about the Great Australian Dream?, October.
Leigh, A. and Triggs, A. 2016, ‘Markets, Monopolies and Moguls: The relationship between inequality and competition’, The Australian Economic Review, vol. 49, no. 4, pp. 389–412.
LFRA (Large Format Retail Australia) 2015, Investment+competition=jobs: Large format retail in NSW, February.
LGAQ (Local Government Association of Queensland) 2014, Submission to the Public Infrastructure Inquiry with reference to the Draft Reports March 2014.
Lowe, P. 2017a, Committees Hansard, 24 February, House of Representatives Standing Committee on Economics, Reserve Bank of Australia.
—— 2017b, ‘Household debt, housing prices and resilience’.
—— 2017c, ‘Remarks at Reserve Bank Board Dinner’.
Nathan, M. and Overman, H. 2011, What We Know (and Don’t Know) About the Links between Planning and Economic Performance, SERC policy paper 10, London School of Economics.
Northern Territory Government 2016, Northern Territory Planning Scheme, www.nt.gov.au/property/building-and-development/northern-territory-planning-scheme/amendments-to-the-planning-scheme (accessed 14 March 2017).
NSW Government 2013, A New Planning System for NSW - White Paper.
—— 2016, NSW Intergenerational Report 2016.

42 PRODUCTIVITY REVIEW
NSW Treasury 2011, NSW Financial Audit Report.
NSWDPE (NSW Department of Planning and Environment) 2016, Local Development Performance Monitoring Data Report 2014-15.
—— 2017a, Planning legislation updates, summary of proposals, January.
—— 2017b, Refining the planning system, www.planning.nsw.gov.au /SimplifiedHousingCode (accessed 29 June 2017).
NSWPE (NSW Planning and Environment) 2016, State Environmental Planning Policies review program: Simplifying and improving the Planning Policy Framework, www.planning.nsw.gov.au/Policy-and-Legislation/State-Environmental-Planning-Policies-Review (accessed 6 January 2017).
NTDC (Northern Tasmania Development Corporation) 2017, NTDC submission to the Productivity Commission’s transitioning regional economies study.
NZDIA (New Zealand Department of Internal Affairs) 2016, Rates rebate scheme, www.dia.govt.nz/Services-Rates-Rebate-Scheme-Index (accessed 19 April 2017).
NZOAG (New Zealand Office of the Auditor-General) 2006, Residential rates postponement, Wellington, NZ.
NZWBPDC (New Zealand Western Bay of Plenty District Council) 2016, Review of rates remission and postponement policies, New Zealand.
Ontario Ministry of Revenue 2017, Provincial Land Tax Deferral Program for low-income seniors and low-income persons with disabilities, www.fin.gov.on.ca/en/refund/plt/seniors.html (accessed 9 March 2017).
PC (Productivity Commission) 2004, First Home Ownership, June.
—— 2011a, Economic Structure and Performance of the Australian Retail Industry, Inquiry Report, December.
—— 2011b, Performance Benchmarking of Australian Business Regulation: Planning, Zoning and Development Assessments, Research Report, April, Volume 1.
—— 2012, Performance Benchmarking: The role of local government as a regulator, Research Report.
—— 2013, Major Project Development Assessment Processes, Research report.
—— 2014a, Childcare and Early Childhood Learning, Inquiry Report.
—— 2014b, Geographic Labour Mobility, Research Report.
—— 2014c, Public Infrastructure, Inquiry Report.
—— 2014d, Relative Costs of Doing Business in Australia: Retail Trade, Research Report.
—— 2016, Regulation of Australian Agriculture, Inquiry Report.
—— 2017, Transitioning Regional Economies, Initial Research Report.
PCA (Property Council of Australia) 2015, Development Assessment Report Card 2015.

SP 10 – REALISING THE PRODUCTIVE POTENTIAL OF LAND 43
Pugalis, L. and Tan, S.F. 2016, ‘Metropolitan and Regional Economic Development: Competing and Contested Local Government Roles in Australia in the 21st Century’, presented at ANZRSAI Conference 2016 refereed proceedings, 5 December.
QDILGP (Queensland Department of Infrastructure, Local Government and Planning) 2014, Local Government Infrastructure Framework Offsets and Refunds – Determining the cost of infrastructure, December.
—— 2016a, An overview of key changes to the development assessment system, July.
—— 2016b, Making and amending local planning instruments, April.
—— 2017a, Better Planning for Queensland: Fact sheet - Key changes to plan making, June.
—— 2017b, Local government infrastructure framework Infrastructure agreement principles, Fact sheet, March.
—— 2017c, Local government planning schemes, www.dilgp.qld.gov.au/planning/local-government-planning-schemes.html (accessed 3 August 2017).
QDSDIP (Queensland Department of State Development, Infrastructure and Planning) 2012, State Planning Regulatory Provision (adopted charges), July.
—— 2013, Development Assessment Performance, Report 2011–2012.
QEDO (Environmental Defenders Office Queensland) 2017, Law reform, www.edoqld.org.au/law-reform/ (accessed 29 May 2017).
RBA (Reserve Bank of Australia) 2016, Statement on Monetary Policy, August.
—— 2017, Statement on Monetary Policy, May.
Revenue SA 2016, Stamp duty on transfer of real property (land), www.revenuesa.sa.gov.au/taxes-and-duties/stamp-duties/real-property-land (accessed 19 April 2017).
SADPTI (South Australian Department of Planning, Transport and Infrastructure) 2015, Annual report on the administration of the Development Act 1993, 2014-15, Annual Report.
—— 2016a, Development plan - Mitcham (city).
—— 2016b, Development Plan - Mount Barker District Council.
—— 2016c, Proposing and Amending Designated Instruments (part 5).
—— 2017a, Factsheet: Assessment Panels - What do Councils need to do?, www.saplanningportal.sa.gov.au/our_new_system/development_assessment (accessed 29 June 2017).
—— 2017b, Planning and design code, www.saplanningportal.sa.gov.au /our_new_system/planning_and_design_code (accessed 30 March 2017).
SGS Economics & Planning 2013, ’Expanding land supply’ through transport improvements, Volume 2, Urbecon.
44 PRODUCTIVITY REVIEW
—— 2014, Best practice urban renewal: input into Bays Precinct forum, November.
—— 2015, The Rental Affordability Index: tracking Australia’s rental affordability nation-wide, Volume 4, Urbecon.
Shoory, M. 2016, The Growth of Apartment Construction in Australia, Bulletin, June Quarter, Reserve Bank of Australia.
South Australian Government 2015, Transforming our Planning System: Response of the South Australian Government to the final report and recommendations of the Expert Panel on Planning Reform, March.
Stokes, R. 2016, Linking green spaces across Sydney, Media Release, 25 July.
Terrill, M. and Emslie, O. 2017, What price value capture?, Grattan Institute.
Toowoomba Regional Council 2016, Toowoomba Regional Planning Scheme Amendment No. 14 (minor amendment), 13 December.
TPC (Tasmanian Planning Commission) 2017, iPlan, www.iplan.tas.gov.au/Pages/XC.Home/Home.aspx (accessed 30 March 2017).
USGCPG (Upper Spencer Gulf Common Purpose Group) 2017, Submission to the Productivity Commission’s Transitioning Regional Economies study.
VAG (Victorian Auditor-General) 2017, Managing Victoria’s Planning System for Land Use and Development, 2016-17:19.
VDELWP (Victorian Department of Environment, Land, Water and Planning) 2015, Open space strategies, June.
—— 2016, Smart Planning Program, www.planning.vic.gov.au/policy-and-strategy/planning-reform/smart-planning-program (accessed 2 September 2017).
—— 2017a, General information on the reformed residential zones.
—— 2017b, Reformed Residential Zones, March, Melbourne.
—— 2017c, VicSmart - a simpler planning permit process, www.dtpli.vic.gov.au/planning /planning-applications/learn-how-to-apply/vicsmart (accessed 31 July 2017).
VDTPLI (Victorian Department of Transport, Planning and Local Infrastructure) 2013a, Reformed zones for Victoria - improved industrial zones, July.
—— 2013b, Reformed zones for Victoria - new commercial zones, July.
—— 2017, Planning permit activity in Victoria 2014–2015, www.pparsreporting.dpcd.vic.gov.au/PPARSReporting/annual14-15.jsp?state=vic®ionId=&metroOrRural=&reportYear=2014 (accessed 18 April 2017).
Victorian Government 2017, Know your council, www.knowyourcouncil.vic.gov.au /comparecouncils?service_area_key=statutory_planning&primary=16793&councils=14901&councils=7061&councils=15913 (accessed 24 April 2017).
SP 10 – REALISING THE PRODUCTIVE POTENTIAL OF LAND 45
WADF (Western Australian Department of Finance) 2016, Pensioners and Seniors Concessions Scheme.
WADP (Western Australian Department of Planning) 2016, City of Rockingham Local Planning Scheme No 2.
—— 2017a, City of Fremantle local planning scheme 4.
—— 2017b, Development Assessment Panel Practice notes: Making Good Planning Decisions, February, Perth.
WAMRA (Western Australian Metropolitan Redevelopment Authority) 2016, Community group chosen for Scarborough plan, www.mra.wa.gov.au/news-and-updates/article/community-group-chosen-for-scarborough-plan (accessed 29 March 2017).
WAPC (Western Australian Planning Commission) 2014, Planning makes it happen: phase two, August.
World Bank 2011, Doing Business 2011: Making a Difference for Entrepreneurs, Washington DC.
—— 2017, Doing Business 2017: Equal Opportunity for All., Washington, DC.