land use update – 2009 - snhpc use update – 2009 for the ... previous updates, ... second, new...
TRANSCRIPT

Land Use Update – 2009
for the
Southern NH PlanningCommission Region


Land Use Update – 2009
for the
Southern NH PlanningCommission Region
September 2010


TABLE OF CONTENTS Executive Summary ...........................................................................................................iii Introduction........................................................................................................................1 Methodology......................................................................................................................5 Residential Growth ............................................................................................................8
Dwelling Unit Expansion and Trends........................................................................8 New Housing Construction Starts..........................................................................12 Areas of Significant Growth ..................................................................................13
Non-Residential Growth ....................................................................................................15 Non-Residential Expansion and Trends ....................................................................15 New Construction Starts ............................................................................................17 Areas of Significant Growth ......................................................................................19
Land Area Development ....................................................................................................21 Regional Land Use Acreage ......................................................................................21 Municipal Land Use Acreage ....................................................................................23
Conclusions and Recommendations ..................................................................................27 APPENDICES Appendix 1- SNHPC Building Permit Database Structure .........................................................29 Appendix 2- SNHPC Area Land Use Units, 2009........................................................................31 Appendix 3- Net Change in Land Use Units by Traffic Zone, 2009 .........................................32 Appendix 4- Land Use Units by Municipality and Traffic Zone, 2009 .....................................41 Appendix 5- SNHPC Land Use Acreage, 2009.............................................................................50 Appendix 6- Land Use Acreage by Municipality and Traffic Zone, 2009.................................51 LIST OF FIGURES Figure i - 2000-2009 Net Residential Housing Units Completed ...............................................iii Figure 1- Southern New Hampshire Planning Commission Area .............................................1 Figure 2- SNHPC Area Traffic Zones............................................................................................3 Figure 3- Manchester Traffic Zones ...............................................................................................4 Figure 4- SNHPC Traffic Zones with Significant Residential Growth .....................................13 Figure 5- Manchester Traffic Zones with Significant Residential Growth ...............................14 Figure 6- SNHPC Traffic Zones with Significant Non-Residential Growth............................19 Figure 7- Manchester Traffic Zones with Significant Non-Residential Growth......................20
i

LIST OF TABLES Table 1- Dwelling Unit Expansion, 1990 vs. 2009 .......................................................................8 Table 2- Net Increase in Residential Units by Types, 2009 .........................................................9 Table 3- Municipal Share of the Region's Residential Growth, 2009.........................................10 Table 4- New Residential Construction Starts, 2009 ....................................................................12 Table 5- Historical Non-Residential Development in Square Feet, 2000 to 2009 ...................15 Table 6- Net Increase in Non-Residential Gross Floor Area by Types, 2009 ..........................16 Table 7- Municipal Share of the Region's Non-Residential Growth, 2009...............................17 Table 8- New Non-Residential Construction Starts, 2009 ..........................................................18 Table 9- SNHPC Region Land Use as a Percent of Total Acreage, 1995 to 2009 ..................21 Table 10- Total Developed Area by Municipality, 2009 ..............................................................22
ii

Executive Summary An economic recession and a housing market crash that started in late 2007 and continues into 2010 have resulted in drastic decreases in the amount of residential development in the Southern New Hampshire region. The total net residential units completed in 2009 decreased by 35 percent, from 310 in 2008 to 201 in 2009. Even though the start of the recession was not officially declared until December 2007, the beginning of the housing market crash can be seen to have started to affect the region even before this when new residential units completed dropped by more than half from 1125 in 2005 to 554 in 2006. (Figure i) Figure i
2000-2009 Net Residential Housing Units Completed
771 798
11951105 1104 1125
554 520
310201
0
200
400
600
800
1000
1200
1400
2000 2001 2002 2003 2004 2005 2006 2007 2008 2009
Year
Res
iden
tial
Res Units
iii

Non-residential development has just recently shown the same effects from the economic recession that the residential side does. Decreases can be seen starting in 2007-2008 and again from 2008-2009, going from 1,198,307 SF in 2007 to 621,017 SF in 2008 and just 100,877 SF in 2009. Figure ii
2000-2009 Net Non-Residential Square Feet Completed
377,743
662,256
972,485796,622828,570
274,733
1,198,307
621,017
100,8770
200,000400,000
600,000
800,000
1,000,0001,200,000
1,400,000
2001
2002
2003
2004
2005
2006
2007
2008
2009
Year
Squa
re F
eet
NonRes SF
During 2009, the Southern New Hampshire Planning Commission region gained 201 new residential units, 100,877 square feet of non-residential development, and an additional 533 acres of land were developed1. Single-family units comprised the majority of all housing units, making up 79 percent of all new housing units. Multi-family made up the second largest category of the total housing units with 10 percent. Manchester continued to have the greatest total increase of residential units with 31 units as well as the largest proportion of the region’s residential growth (15.4 percent). Manchester also had the greatest increase in the number of single-family units with 21. Londonderry and Raymond had the second highest with 20 each. Manchester had the highest increase in multi-family units with 14. New Boston had the largest quantity of completed two-family units in 2009 at 7 units. Londonderry had the greatest increase in manufactured home units with 3 units completed in 2009. Commercial development represented 72 percent of the region's non-residential development in 2009, with a total of 72,596 new square feet completed. There were 32,694 square feet of new semi-public development during 2009, no industrial development and -4,413 square feet of public development.
1 Square footage and acreage figures were not always provided on permit data collected
iv
Overall, the Town of Bedford had the greatest share of the non-residential growth in 2009, 29,600 square feet or 29 percent of the region's non-residential growth. Bedford had 26,400 square feet of commercial development and 3,200 square feet of semi-public development. Residential development consumed the largest area of land during 2009 than any of the land use categories (317.9 acres). Commercial development consumed the second highest amount of land in the region with 152.3 acres. Public and Semi-Public development consumed another 28.4 new acres. Utilities and streets attributed 24.5 new acres and there was no new industrial development in 2009. Goffstown developed the largest total land area (96 acres) and Londonderry developed the greatest amount of non-residential development acres with 45.8 acres. Goffstown developed the greatest amount of residential acreage (55.4 acres) in the region.
v


Introduction The Metropolitan Manchester Planning Study (MMPS) was developed in 1967 to monitor traffic volume in Manchester and its five surrounding towns. In 1990 the study area (see Figure 1), was expanded to include the seven outlying communities in the Southern New Hampshire Planning Commission region. The 1996 update was the first update to combine data from the outlying communities and the metropolitan communities. As part of the transportation planning modeling process, this data is used to estimate trip generation. Using those estimates, traffic assignments for the study area's roadway network are developed. This process identifies roadway capacity overloads and areas of future possible congestion. Additionally, the data in this report is used in the many land use or housing oriented reports and publications produced by SNHPC
Updating land use data, specifically the number of dwelling units, has local significance within the regional planning process, as it is a basis for generating annual population and dwelling unit estimates. In addition to the transportation planning utilization of the current land use data, other objectives are accomplished by this update, including:
• Monitoring patterns of growth or decline in residential units, commercial, and industrial square footage and acreage;
1

• Evaluating the validity of the original assumptions used in making the land use projections; • Identifying geographical areas with significant growth or decline; and • Maintaining an inventory of records for total developed versus vacant land.
This update is part of the on-going maintenance of the Regional Transportation Plan, which was developed by the Southern New Hampshire Planning Commission (SNHPC). The latest revisions to the Plan were undertaken in 2008 when the new Regional Transportation Plan was completed. This land use update will be used to maintain the database that will serve as input for subsequent plan revisions. Data in this report are cumulative as of December 31, 2009 and are reported on both a unit basis for residential uses, square feet for non-residential uses and an acreage basis for each of the land uses as defined below. One Family Residential: Includes traditional single-family dwellings, farmhouses, seasonal cottages, manufactured homes on permanent foundations and modular homes. Two-Family Residential: Includes all two-family housing; e.g., duplexes and converted single family. Multiple Family Residential: Includes all housing with three or more units; e.g., conventional, apartments, condominiums, converted one or two-family houses, and conversions to attached structures (barns, garages, etc.). This excludes boarding houses, hotels, motels, and nursing homes. Also includes attached townhouses (sometimes under condominium ownership). Manufactured Home: Includes all manufactured homes not on permanent foundations; excludes weekend campers and tent trailers. Commercial: Any individual unit of retail, wholesale, and services excluding those using heavy machinery; e.g., barber shop, gas station, grocery store, non-public professional services (doctors, lawyers, dentists), rooming houses, hotels, and motels, convention centers and audito-riums. (Note: Every individual hotel or motel building, regardless of the number of rooms, is counted as 1 commercial unit; however, for new office buildings and shopping malls, each office or store is counted as 1 commercial unit.) Industrial: All manufacturing, warehousing, mining; e.g., auto body shop, lumber yard, active sand and gravel operations, etc. Semi-Public: All private, non-profit organizations; e.g., churches, non-public schools, fraternal organizations, cemeteries, scout facilities, boys and girls clubs, country clubs, etc. Public: All municipal, county, state, and federal buildings used for governmental purposes. Data is reported on three different levels, i.e., individual traffic zone, municipality, and study area (region). Traffic zone data is not available for some of the outlying communities since detailed studies have not been completed. This update includes the 290 traffic area zones that currently make up the SNHPC region. New traffic zones were added in 2007. The 2006 Land Use Report included 220 traffic zones and
2

previous updates, up to 1989, used only the original 95 zones (for the Metropolitan Manchester Planning Study, MMPS, communities). The first update to reflect the increased number of zones was completed in 1991, using 1990 base year data. Figures 2 and 3 depict the current regional traffic area zones.
3

4

Methodology The first MMPS update, which occurred in 1970, required extensive fieldwork that was performed by teams using planimetric maps for densely populated areas, and by conducting "windshield surveys" in the less developed parts of the City of Manchester. In the five towns surrounding Manchester, windshield surveys were conducted using tax maps and aerial photos as guides. In subsequent updates, data has been collected using building permit records, tax assessment cards, plot plans, and local expertise. Complete studies for all of the outlying communities have not been completed. Data has been collected from building permit records since 1990. For the outlying communities, total dwelling units by traffic zone was determined using the 1990 census. This information is available for all of the outlying communities. An initial study for the towns of Candia, Chester, New Boston, and Weare was based on land use surveys developed for Master Plans. For Candia, Chester, and New Boston, windshield surveys were conducted using tax maps and assessors records as guides. The land use survey in Weare was based primarily on local expertise. The total number of single-family units in each traffic zone was determined by subtracting other residential units (determined from the survey) from the total dwelling units in each zone (determined by the census). In Candia, Chester and Weare the number of two-family, multi-family and manufactured homes determined through the land use survey was significantly lower than the figures in the 1990 census. The census figures were considered to be more accurate and thus the accepted data. Initial surveys have not been completed for the towns of Deerfield, Derry, and Raymond. SNHPC staff revised the land area calculations for the City of Manchester in 2005 for two reasons. First, following 35 years of cumulative area tracking some errors have been noted and the areas presented in this report were no longer representative of the develop area recognized by the City. Second, new draft tax map and parcel GIS data was available on a single use basis from the City's Planning Department which, for the first time, allowed SNHPC staff to conduct a digital analysis of the City's developed land development. After utilizing the same report format and data presentation for nearly 10 years it was decided to entirely revise the report in the spring of 2005. Chapters have been reorganized to better represent the data presented and the changes made in recent years. Many errors continue to be researched and corrected through all sections and much of the data presented may not be consistent with previous years’ updates. Two types of information have been collected for this update: 1) building permits (new structures, conversions and demolitions); and 2) lot sizes (acreage2) associated with new, converted or demolished structures. Data is annually entered into a Microsoft Access database
2 Acreages and lot sizes were not consistently provided, therefore the cumulative figures may not be 100 percent accurate
5

that has been maintained since 1996. Appendix 1 shows the type of information collected for each building permit. Beginning with the 2003 Land Use Update, it was decided that rather than representing the non-residential uses (Commercial, Industrial, Public and Semi- Public) as individual units, the information would be displayed in square feet. This better represents any growth or change in each municipality and the region as a whole. By using just the units for the non-residential parcels a big box development and a small mom and pop store were both being represented as one unit. However, by showing any increases or decreases in square feet a clearer picture of change is shown. The methodology used to collect the data varies slightly between towns, depending on available records. The following describes the general procedure used in all municipalities for this land use update and is followed by community specific aberrations from this methodology. Units 1. Information from individual building permits at the municipal Building Inspectors' offices was entered into the SNHPC building permit Access database. This included tax map and lot number, land use type, and street addresses. 2. Permits were verified completed by either checking individual files or a summary list of certificates of occupancy, issued in the update year, at the Building Inspector’s office. 3. All building permits were traffic zone coded using the SNHPC address-coding guide and traffic zone maps. 4. All permits not completed in the update year were compiled in a carryover list to be used in the following year's update. Acreage 1. Lot sizes were obtained from individual tax parcel records maintained by the Assessors' offices, subdivision plans on file with the planning departments, or were provided by the building departments and/or the building permit. Streets and Utilities 1. New streets, their locations, and their lengths were obtained from the Highway Department or other municipal department. 2. Acreage was calculated using the lengths of streets and the 50-foot right of way standard. 3. The acreage for each street was added to the appropriate traffic zone. Auburn: The building inspector prepared a permit summary sheet that includes each permit number, the respective tax map and lot number, address, and land use for each site. New streets data was obtained from the Building Inspector. Bedford: Building permit data was obtained from an annual summary of building permits maintained in the Building Department and acreages obtained at the Assessor's office. Candia: Data was compiled from a summary of building permit information maintained in the Assessor's office. New street data was acquired from subdivision plans located in the Assessor’s Office.
6

Chester: Data on new streets, their locations, and their lengths were obtained from the Planning Department. Deerfield: No variation from the general methodology. Derry: Lot sizes for building sites were compiled from the tax maps, or individual septic, and permits files. Goffstown: Data on new streets, their locations, and their lengths were obtained from the Planning Department. Hooksett: Lot sizes for building sites were obtained from the GIS SNHPC tax maps located at the SNHPC offices. The lengths and locations of streets constructed during the study year were obtained from the Town Planner. Londonderry: The Department of Planning and Economic Development provided a map with the lengths of new town roads constructed during the study year. Manchester: No variation from the general methodology. New Boston: The Town Planning Office assisted SNHPC with completion data and provided a list of the lengths of new town roads constructed during the study year. Raymond: Street addresses were obtained from the Fire Department. Weare: No variation from the general methodology.
7

Residential Growth Tracking residential growth provides insight into the local and regional housing markets. It allows planners to understand how and where residential growth is occurring and gauge individual community growth against regional growth. Additionally, tracking the type of residential structures being added to the existing stock indicates consumer preference and shifts from one type of housing to another indicates the affordability, or lack of affordability, of each residential type. Dwelling Unit Expansion and Trends As of this update, there were 101,616 year-round dwelling units in the metropolitan area (Table 1). This is an increase of 6,196 units (or 6.5 percent) since 2000. Manchester has experienced the majority of dwelling unit growth in the region during the past 8 years, with a 1,349-unit increase, representing approximately 3.0 percent of total growth since 2000.
Table 1 Dwelling Unit Expansion SNHPC Region, 2000 vs. 2009
2000-2009
Municipality 2000 2009 Absolute Change
Percent Change
Percent of
SNHPC Region
Auburn 1,603 1,788 185 11.5% 3.0% Bedford 6,394 7,274 880 13.8% 14.2% Candia 1,379 1,496 117 8.5% 1.9% Chester 1,272 1,490 218 17.1% 3.5% Deerfield 1,471 1,721 250 17.0% 4.0% Derry 12,838 13,094 256 2.0% 4.1% Goffstown 5,483 5,902 419 7.6% 6.8% Hooksett 4,245 4,940 695 16.4% 11.2% Londonderry 7,431 7,959 528 7.1% 8.5% Manchester 45,236 46,585 1,349 3.0% 21.8% New Boston 1,395 1,713 318 22.8% 5.1% Raymond 3,811 4,312 501 13.1% 8.1% Weare 2,862 3,342 480 16.8% 7.7% SNHPC Region 95,420 101,616 6,196 6.5% 100.0%
The SNHPC region had a net increase of 201 residential units during the calendar year 2009 (Table 2). The predominant type of residential unit constructed during 2009 was single-family housing, which accounted for approximately 78.6 percent (158 units) of all dwellings constructed. This is a decrease of 24 units when compared to 2008's number of single-family homes (182).
8

Multi-family units constituted the next largest category, accounting for 10 percent of all newly completed units (20 units). This represents a decrease of 74 percent over the net increase of all multi-family units completed in 2008 (77 units). There were 17 two-family units added during 2009. This is 31 units less than the 48 two-family units added in 2008. Additionally, there were 6 manufactured homes completed in the SNHPC region during 2009, an increase of 3 units over 2008's completed manufactured homes.
Table 2 Net Increase in Residential Units by Type SNHPC Region, 2009
Municipality
One Family (units)
Two Family (units)
Multi- Family (units)
Mobile Home (units)
Residential Subtotal
% Change
from 2007
Auburn 3 0 0 0 3 -300.0% Bedford 18 1 0 0 19 15.8% Candia 1 0 0 0 1 -500.0% Chester 1 2 0 0 3 -166.7% Deerfield 10 0 0 1 11 -9.1% Derry 5 4 5 0 14 -250.0% Goffstown 16 2 1 0 19 10.5% Hooksett 12 0 0 2 14 -128.6% Londonderry 20 2 0 3 25 -32.0% Manchester 21 -4 14 0 31 -71.0% New Boston 15 7 0 0 22 0.0% Raymond 20 2 0 0 22 -40.9% Weare 16 1 0 0 17 -11.8% SNHPC Region 158 17 20 6 201 -54.2%
Manchester accounted for 15.4 percent of the region's total residential growth. The majority of the completed multi-family units were also located in Manchester, with additional units located in Derry and Goffstown. The following summaries refer to each individual municipality and its "share" of regional residential growth during 2009 (Table 3). For more specific information, on a traffic zone basis, refer to Appendices 2 through 4.
9

Table 3
Municipal Share of SNHPC Region's Residential Growth, 2009
Municipality
One Family (percentage
)
Two Family (percentage
)
Multi-Family (percentage
)
Mobile Home
(percentage)
SNHPC Region
(percentage)
Auburn 1.9% 0.0% 0.0% 0.0% 1.5% Bedford 11.4% 5.9% 0.0% 0.0% 9.5% Candia 0.6% 0.0% 0.0% 0.0% 0.5% Chester 0.6% 11.8% 0.0% 0.0% 1.5% Deerfield 6.3% 0.0% 0.0% 16.7% 5.5% Derry 3.2% 23.5% 25.0% 0.0% 7.0% Goffstown 10.1% 11.8% 5.0% 0.0% 9.5% Hooksett 7.6% 0.0% 0.0% 33.3% 7.0% Londonderry 12.7% 11.8% 0.0% 50.0% 12.4% Manchester 13.3% -23.5% 70.0% 0.0% 15.4% New Boston 9.5% 41.2% 0.0% 0.0% 10.9% Raymond 12.7% 11.8% 0.0% 0.0% 10.9% Weare 10.1% 5.9% 0.0% 0.0% 8.5% SNHPC Region 100.0% 100.0% 100.0% 100.0% 100.0%
Auburn - Auburn gained 3 new single-family homes in 2009, which is a decrease from the 6 new single family homes gained in 2008. These units accounted for 1.5 percent of the region's total residential growth. Due to its proximity to Manchester the town is likely to experience continued residential growth. However, this growth is limited by the current availability of undeveloped residential land, since approximately 4,000 acres of undeveloped residentially zoned land is owned and protected by Manchester Water Works. Bedford - Bedford grew by 19 units during 2009. Eighteen of these units were single-family residential and one was Two-family. Total they represented 11.4 percent of the region's single-family growth and 9.5 percent of the total regional residential growth. Candia - During 2009, Candia accounted for 0.5 percent of regional growth, with 1 new single-family unit. Chester – During 2009, 3 new units were completed in Chester, one was single-family and two were two-family units. Chester accounted for 1.5 percent of regional growth. Deerfield – 11 residential units were completed in Deerfield in 2009. Ten of these units were single-family homes, and one was a mobile home unit, comprising 5.5 percent the region's residential growth. Derry - Derry gained 14 residential units during 2009. Single-family homes accounted for 5 of these units, multi-family accounted for 5 and two-family homes accounted for 4 of these units. Derry accounted for 7.0 percent of the region’s residential growth in 2009.
10
Goffstown - Goffstown gained 19 residential units during 2009. Single-family units accounted for 16 units, two-family gained two units, and the remaining 1 unit was multi-family. The Town contributed 9.5 percent of the region's 2009 total residential growth. Hooksett – Hooksett has increased by 14 residential units and contributed 7.0 percent to regional totals. Single-family homes comprised 7.6 percent of the Town's residential completions. Hooksett represented 33.3 percent of the region’s new manufactured housing units in 2009 as well. Londonderry - Londonderry increased by 25 residential units, a 24.2 percent decrease from its 2008 residential growth. The Town's growth represented 12.4 percent of 2009's regional residential growth. Manchester - The City of Manchester experienced the greatest gains in overall residential units (31) for 2009, 21 single-family units, -4 two-family units and 14 multi-family units. Manchester’s residential growth represented 15.4 percent of the region’s residential growth for 2009. Multi-family residential growth accounted for 70 percent of the region’s share of multi-family units. New Boston - New Boston increased by 22 units in 2009. The Town accounted for 10.9 percent of the total regional residential growth and 9.5 percent of the region's new single-family homes. Raymond – Raymond grew by 22 residential units in 2009. There were 20additional single-family units, which constituted 12.7 percent of the region's single-family homes. Raymond also added 2 two-family units, or 11.8 percent of the region’s new two family units. There were no new manufactured homes or multi-family homes to report. Weare - Weare increased by 17 residential units and contributed 8.5 percent to the region's totals. Of these units, 16 were single-family homes and1 was two-family
11

New Housing Construction Starts In contrast to building completions, which include construction projects started in previous years, and those started and completed in the study year, building starts measure only the new activity in a given calendar year. Documentation of new construction starts over time presents a reasonable gauge of the performance of regional housing construction. There were 224 new residential construction starts during 2009, down from 382 in 2008 (Table 4). Single family units constituted a majority of new residential unit construction starts, with 182 units. This is down from 237 single family units in 2008. Multi-family units comprised 12 units in Manchester, 5 units in Derry and 1 unit in Goffstown. New Boston had the most (7) Two-family housing units in the region with units also in Raymond, Manchester, Goffstown, Derry and Chester. Two-family home starts decreasing between 2008 and 2009 from 24 units to 17 units. Two family units comprised 7.6 percent (17 units) in 2009 and 6.5 percent in 2008 (122 units). New manufactured homes comprised 3.1 percent (7 units) in 2009. Manchester had the most residential starts in 2009 with 34 starts, followed by Londonderry and Derry, both with 25 units. Londonderry had the greatest share of single-family residential starts with 22 units, while Bedford, Manchester and Raymond follow with 21, 20, and 20 units each respectively. There were 18 multifamily housing starts in 2009, down significantly from the 118 starts in 2008, and from 2007 with 147 starts. Manchester (12 units) comprised 66.7 percent of the multi-family starts.
Table 4 New Residential Unit Construction Starts SNHPC Region, 2009
Municipality
One Family (Units)
Two Family (Units)
Multi- Family (Units)
Mobile Home (Units)
Residential Subtotal (Units)
Auburn 4 0 0 0 4 Bedford 21 0 0 0 21 Candia 3 0 0 0 3 Chester 1 2 0 0 3 Deerfield 10 0 0 1 11 Derry 18 2 5 0 25 Goffstown 18 2 1 0 21 Hooksett 13 0 0 3 16 Londonderry 22 0 0 3 25 Manchester 20 2 12 0 34 New Boston 15 7 0 0 22 Raymond 20 2 0 0 22 Weare 17 0 0 0 17 SNHPC Region 182 17 18 7 224
12

Areas of Significant Growth "Significant growth" is defined here as having 20 or more residential units completed in a given year. Figure 4 identifies the traffic area zones in the metropolitan area communities outside of Manchester, which experienced significant residential completion activity in 2009. There were no traffic area zones outside of Manchester that experienced significant residential completion activity in 2009. This is most likely attributable to the downturn in the economy and the housing market crash that the US is currently experiencing.
13

Similarly, the City of Manchester also had no significant residential completion activity in 2009.
14

Non-Residential Growth Tracking non-residential growth in the region provides insight in to the area’s economic well-being. Increases in commercial and industrial developed area infer growth in a community, increases in job availability and additional revenue for municipalities to provide vital services to the community. Public and semi-public growth represents community growth and reinvestment. Non-Residential Expansion and Trends SNHPC began measuring non-residential growth in square feet built in the 2003 Land Use Report. This includes commercial, industrial, semi-public, and public development. The data for square feet has only been collected since the year 2000. Therefore, any data regarding square feet in this report will only take into account construction of buildings since then and up to and including the current year (2009). Since 2000, Hooksett, Londonderry and Manchester have led the region in non-residential development with 60.9 percent of the region’s development, as measured in square feet (Table 5). Overall, Hooksett has led the region with 1,732,691 square feet of development spread among the four non-residential classifications. Within each of those classifications (Appendix 2) Hooksett had the greatest amount of commercial and semi-public development, while Londonderry had the greatest amount of industrial and public development.
Table 5
Historical Non-Residential Development in Square Feet SNHPC Region, 2000-2009
Municipality
2000-2008 Square Feet
Percent of Region
2009 Square Feet
2000 - 2009 Total
Percent of Region
Auburn 255,970 3.7% 0 255,970 3.6% Bedford 956,898 13.8% 29,600 986,498 14.0% Candia 32,016 0.5% 8,244 40,260 0.6% Chester 11,960 0.2% 1,904 13,864 0.2% Deerfield 43,158 0.6% 4,560 47,718 0.7% Derry 836,258 12.1% 16,594 852,852 12.1% Goffstown 136,320 2.0% 15,224 151,544 2.2% Hooksett 1,732,690 25.0% 0 1,732,690 24.6% Londonderry 1,223,071 17.6% 1,083 1,224,154 17.4% Manchester 1,317,555 19.0% 9,243 1,326,798 18.9% New Boston 35,543 0.5% 5,544 41,087 0.6% Raymond 173,166 2.5% 0 173,166 2.5% Weare 179,828 2.6% 8,880 188,708 2.7% SNHPC Region 6,934,433 100.0% 100,877 7,035,310 100.0%
15

The SNHPC region recorded a net increase of 100,877 square feet of non-residential growth during the 2009 calendar year (Table 6). This is an 83.8 percent decrease over 2008, when new development of non-residential development reached 621,017 square feet. The predominant class of non-residential construction during 2009 was commercial development, which accounted for 72 percent (72,595 square feet) of all non-residential growth. Semi-Public Development uses constituted the next largest classification, accounting for 32.4 percent of all non-residential growth, with a numerical total of 32,694 square feet. There was no industrial development growth in square feet at all in any of the SNHPC region towns in 2009. Public development actually dropped in 2009 in the region, incurring a loss of -4,413 square feet, compared to growth of 23,124 square feet recorded in 2008. Candia, Goffstown, New Boston and Weare were the only communities to report growth in the region compared to their 2008 figures of non-residential development. Auburn, Bedford, Chester, Deerfield, Derry, Hooksett, Londonderry, Manchester and Raymond all recorded decreases in growth relative to their 2008 completion of non-residential development. Overall, the region experienced an 83.7 percent decrease in the amount of non-residential development as measured in square feet.
Table 6 Net Increase in Non-Residential Units by Type SNHPC Region, 2009
Municipality Commercial (Sq. Ft)
Industrial (Sq. Ft)
Semi Public
(Sq. Ft) Public
(Sq. Ft)
Non Residential Sub-total (Sq. Ft)
Percent Change
from 2008
Auburn 0 0 0 0 0 -100.0% Bedford 26,400 0 3,200 0 29,600 -20.9% Candia 8,244 0 0 0 8,244 N/A Chester 0 0 0 1,904 1,904 -84.1% Deerfield 4,512 0 0 48 4,560 -6.0% Derry 7,250 0 8,000 1,344 16,594 -37.4% Goffstown 14,124 0 1,000 100 15,224 3.7% Hooksett 0 0 0 0 0 -100.0% Londonderry 551 0 70 462 1,083 -98.6% Manchester 2,634 0 20,424 -13,815 9,243 -78.2% New Boston 0 0 0 5,544 5,544 N/A Raymond 0 0 0 0 0 -100.0% Weare 8,880 0 0 0 8,880 988% SNHPC Region 72,595 0 32,694 -4,413 100,876 -83.8%
In 2009, Bedford posted 29.3 percent of the region's non-residential growth, as measured in square feet. Derry and Goffstown recorded the next greatest shares of the region's non-residential completions at 16.4 and 15.1 percent respectively. Together these three communities constituted 60.8 percent of the region's total completions, 65.8 percent of commercial
16
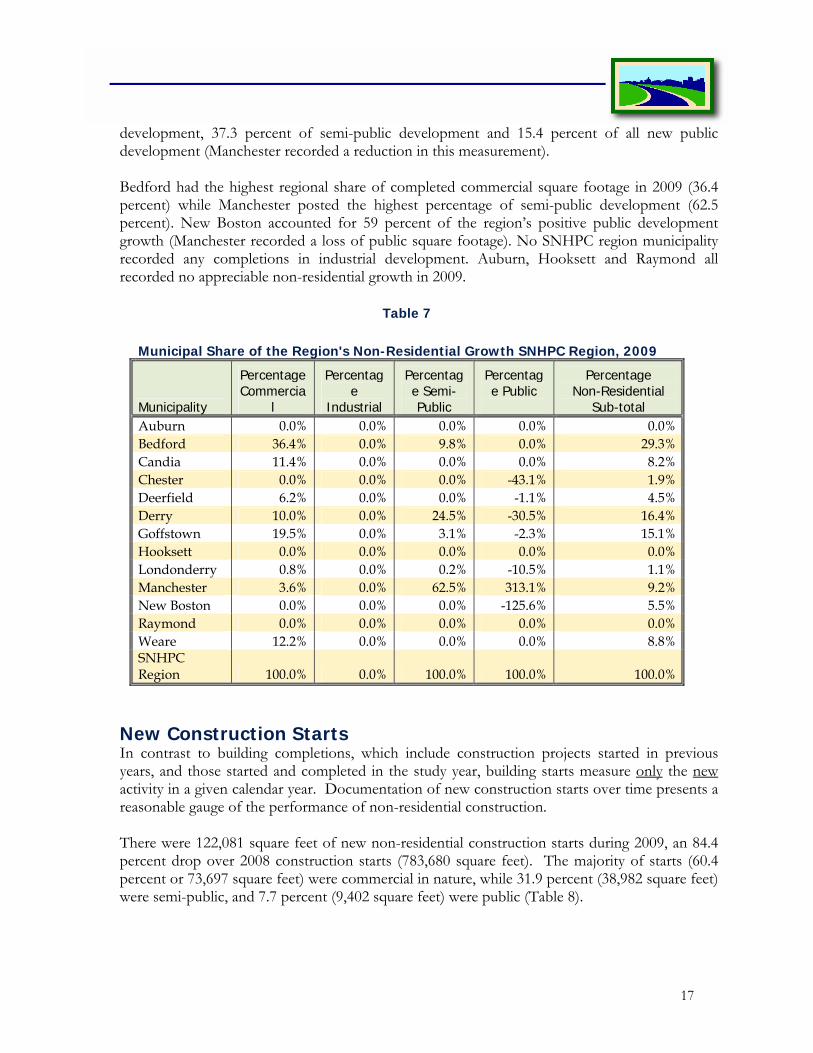
development, 37.3 percent of semi-public development and 15.4 percent of all new public development (Manchester recorded a reduction in this measurement). Bedford had the highest regional share of completed commercial square footage in 2009 (36.4 percent) while Manchester posted the highest percentage of semi-public development (62.5 percent). New Boston accounted for 59 percent of the region’s positive public development growth (Manchester recorded a loss of public square footage). No SNHPC region municipality recorded any completions in industrial development. Auburn, Hooksett and Raymond all recorded no appreciable non-residential growth in 2009.
Table 7
Municipal Share of the Region's Non-Residential Growth SNHPC Region, 2009
Municipality
Percentage Commercia
l
Percentage
Industrial
Percentage Semi-Public
Percentage Public
Percentage Non-Residential
Sub-total Auburn 0.0% 0.0% 0.0% 0.0% 0.0% Bedford 36.4% 0.0% 9.8% 0.0% 29.3% Candia 11.4% 0.0% 0.0% 0.0% 8.2% Chester 0.0% 0.0% 0.0% -43.1% 1.9% Deerfield 6.2% 0.0% 0.0% -1.1% 4.5% Derry 10.0% 0.0% 24.5% -30.5% 16.4% Goffstown 19.5% 0.0% 3.1% -2.3% 15.1% Hooksett 0.0% 0.0% 0.0% 0.0% 0.0% Londonderry 0.8% 0.0% 0.2% -10.5% 1.1% Manchester 3.6% 0.0% 62.5% 313.1% 9.2% New Boston 0.0% 0.0% 0.0% -125.6% 5.5% Raymond 0.0% 0.0% 0.0% 0.0% 0.0% Weare 12.2% 0.0% 0.0% 0.0% 8.8% SNHPC Region 100.0% 0.0% 100.0% 100.0% 100.0%
New Construction Starts In contrast to building completions, which include construction projects started in previous years, and those started and completed in the study year, building starts measure only the new activity in a given calendar year. Documentation of new construction starts over time presents a reasonable gauge of the performance of non-residential construction. There were 122,081 square feet of new non-residential construction starts during 2009, an 84.4 percent drop over 2008 construction starts (783,680 square feet). The majority of starts (60.4 percent or 73,697 square feet) were commercial in nature, while 31.9 percent (38,982 square feet) were semi-public, and 7.7 percent (9,402 square feet) were public (Table 8).
17

Table 8
New Non-Residential Unit Construction Starts SNHPC Region, 2009
Municipality Commercial
(Square Feet)
Industrial (Square Feet)
Public (Square Feet)
Semi-Public (Square Feet)
Total New Non-
Residential Units
Auburn 0 0 0 0 0 Bedford 26,400 0 0 3,200 29,600 Candia 9,500 0 0 0 9,500 Chester 0 0 1,904 0 1,904 Deerfield 4,512 0 48 0 4,560 Derry 7,250 0 1,344 8,000 16,594 Goffstown 14,124 0 100 1,000 15,224 Hooksett 0 0 0 0 0 Londonderry 551 0 462 70 1,083 Manchester 2,480 0 0 26,712 29,192 New Boston 0 0 5,544 0 5,544 Raymond 0 0 0 0 0 Weare 8,880 0 0 0 8,880 SNHPC Region 73,697 0 9,402 38,982 122,081 Bedford recorded the greatest share of commercial square footage permitted in 2009, with 26,400 square feet representing 35.8 percent of the region's commercial development initiated in 2009. Goffstown had the second greatest amount of commercial starts in 2009, with 14,124 square feet or 19.2 percent of the region’s commercial development. Candia ranked third, with 9,500 square feet permitted representing 12.9 percent or the region’s commercial development. No SNHPC region municipality recorded any starts in industrial development in 2009. New Boston recorded the greatest share of public development starts in 2009 with 5,544 square feet, representing 59 percent of all starts in the region. Chester and Derry posted the next greatest shares of public development posting 1,904 square feet (20.3 percent) and 1,344 square feet (14.3 percent) respectively. In 2009, Manchester had the majority of semi-public construction starts with 26,712 square feet, representing a 68.5 percent share of regional development. Derry recorded the next greatest share of new construction for semi-public units at 8,000 square feet or a 20.5 percent share. Bedford (3,200 square feet), Goffstown (1,000 square feet) and Londonderry (70 square feet) followed, representing a combined total of 11 percent of the remaining new construction starts.
18

Areas of Significant Growth Non-residential "significant growth" is defined as a traffic area zone that had 20,000 or more square feet completed in a given year. Figure 6 identifies the traffic zones in the metropolitan area communities outside of Manchester, which experienced significant non-residential completion activity in 2009.
Outside of Manchester, Bedford is the only municipality that experienced significant non-residential growth in 2009. Traffic zone 89 in Bedford added 21,000 SF of commercial development.
19

Manchester
In 2009, Manchester added 26,712 square feet of semi-public development to traffic zone 32. This development was an addition to a New Hampshire Institute of Art building in that traffic zone.
20
21
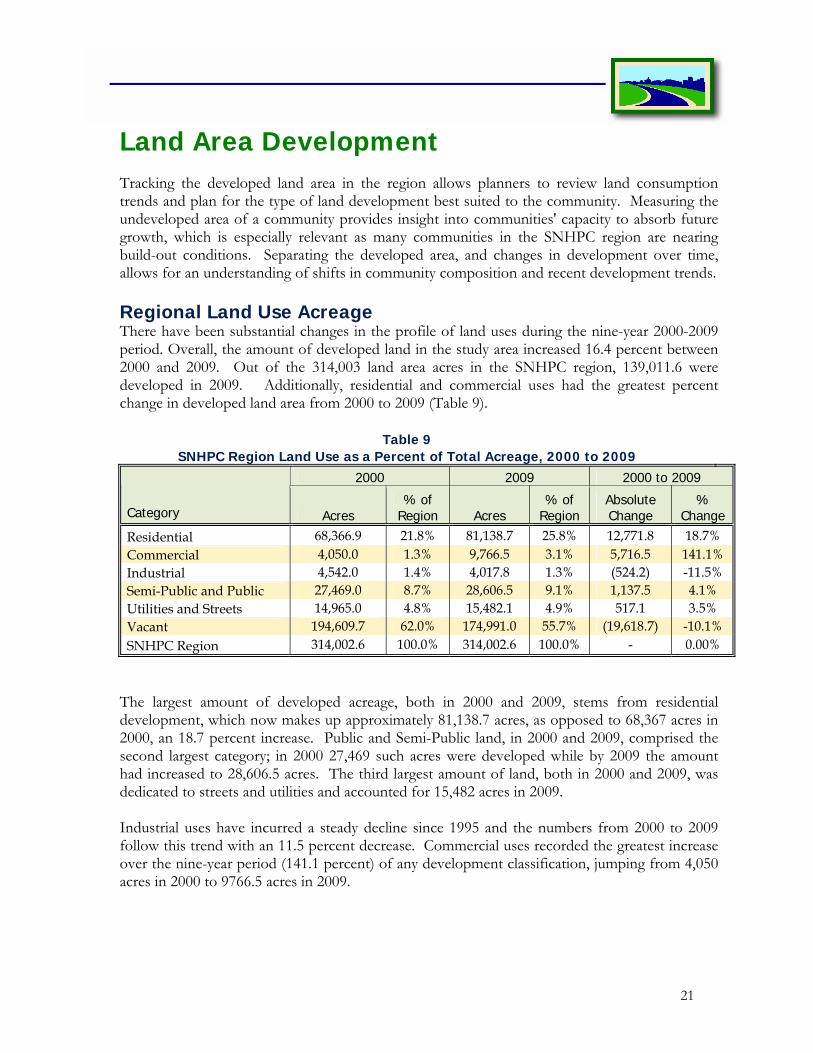
Land Area Development Tracking the developed land area in the region allows planners to review land consumption trends and plan for the type of land development best suited to the community. Measuring the undeveloped area of a community provides insight into communities' capacity to absorb future growth, which is especially relevant as many communities in the SNHPC region are nearing build-out conditions. Separating the developed area, and changes in development over time, allows for an understanding of shifts in community composition and recent development trends. Regional Land Use Acreage There have been substantial changes in the profile of land uses during the nine-year 2000-2009 period. Overall, the amount of developed land in the study area increased 16.4 percent between 2000 and 2009. Out of the 314,003 land area acres in the SNHPC region, 139,011.6 were developed in 2009. Additionally, residential and commercial uses had the greatest percent change in developed land area from 2000 to 2009 (Table 9).
Table 9 SNHPC Region Land Use as a Percent of Total Acreage, 2000 to 2009
2000 2009 2000 to 2009
Category Acres % of
Region Acres % of
Region Absolute Change
% Change
Residential 68,366.9 21.8% 81,138.7 25.8% 12,771.8 18.7% Commercial 4,050.0 1.3% 9,766.5 3.1% 5,716.5 141.1% Industrial 4,542.0 1.4% 4,017.8 1.3% (524.2) -11.5% Semi-Public and Public 27,469.0 8.7% 28,606.5 9.1% 1,137.5 4.1% Utilities and Streets 14,965.0 4.8% 15,482.1 4.9% 517.1 3.5% Vacant 194,609.7 62.0% 174,991.0 55.7% (19,618.7) -10.1% SNHPC Region 314,002.6 100.0% 314,002.6 100.0% - 0.00%
The largest amount of developed acreage, both in 2000 and 2009, stems from residential development, which now makes up approximately 81,138.7 acres, as opposed to 68,367 acres in 2000, an 18.7 percent increase. Public and Semi-Public land, in 2000 and 2009, comprised the second largest category; in 2000 27,469 such acres were developed while by 2009 the amount had increased to 28,606.5 acres. The third largest amount of land, both in 2000 and 2009, was dedicated to streets and utilities and accounted for 15,482 acres in 2009. Industrial uses have incurred a steady decline since 1995 and the numbers from 2000 to 2009 follow this trend with an 11.5 percent decrease. Commercial uses recorded the greatest increase over the nine-year period (141.1 percent) of any development classification, jumping from 4,050 acres in 2000 to 9766.5 acres in 2009.

22
Table 10 Total Developed Area SNHPC Region
2000 2009
Municipality
Total Land Area
Total Residentia
l
Total Non-Residentia
l
Total Developed
Area
Total Vacant Area
Total Residentia
l
Total Non-Residentia
l
Total Developed
Area
Total Vacant Area
2000 - 2009 % change in
Total Developed
Area
Auburn 18,437.8 3,157.8 4,722.4 7,880.2 10,557.6 3,635.3 4,819.6 8,454.9 9,983.0 7.3% Bedford 21,156.1 9,279.3 2,345.3 11,624.6 9,531.5 10,799.9 5,170.2 15,970.1 5,186.0 37.4% Candia 19,557.1 4,736.3 2,840.8 7,577.1 11,980.0 5,322.6 2,868.0 8,190.6 11,366.5 8.1% Chester 16,618.0 3,186.8 2,124.5 5,311.3 11,306.7 3,846.9 2,172.9 6,019.8 10,598.2 13.3% Deerfield 33,347.7 4,470.8 2,982.2 7,453.0 25,894.7 5,732.4 3,068.1 8,800.5 24,547.2 18.1% Derry 23,225.6 8,690.6 2,735.9 11,426.5 11,799.1 9,395.3 2,912.6 12,307.9 10,917.7 7.7% Goffstown 24,064.5 5,487.8 2,927.6 8,415.4 15,649.1 6,796.7 3,030.4 9,827.1 14,237.4 16.8% Hooksett 23,760.7 3,320.5 5,646.9 8,967.4 14,793.3 4,197.0 6,068.1 10,265.1 13,495.6 14.5% Londonderry 26,958.2 7,396.8 5,057.6 12,454.4 14,503.8 7,945.0 6,380.9 14,325.9 12,632.3 15.0% Manchester 21,815.3 6,138.9 9,258.0 15,396.9 6,418.4 7,136.5 10,320.1 17,456.6 4,358.6 13.4% New Boston 27,653.7 3,050.6 3,598.4 6,649.0 21,004.7 4,264.7 3,677.5 7,942.2 19,711.5 19.4% Raymond 18,943.5 4,966.1 1,242.7 6,208.8 12,734.7 5,866.5 1,699.2 7,565.8 11,377.7 21.9% Weare 38,464.3 4,484.6 5,543.6 10,028.2 28,436.1 6,199.8 5,685.2 11,885.0 26,579.3 18.5% SNHPC Region 314,002.6 68,366.9 51,025.9 119,392.8 194,609.8 81,138.7 57,872.9 139,011.6 174,991.0 16.4%

Municipal Land Use Acreage The following passage discusses each municipality in terms of its total acreage, current uses, and existing development trends. Please see Table 10 and Appendices 5 and 6 for individual municipal and traffic zone acreage data. Auburn - The total land area of Auburn is 18,437.8 acres. As of 2009, 8,454.9 acres, or 45.9 percent of land was developed. Of the total land area, 4,001 acres, or 21.7 percent, is public land, most of which includes lands owned by the Manchester Water Works. Lake Massabesic and its watershed area is mostly located in Auburn. The lake serves as the public water supply for Manchester and many of the surrounding towns. The next greatest amount of developed land is dedicated to residential use, accounting for 3,635.3 acres, or 43 percent of all developed land. Almost all residential acreage is in single-family use. Other residential acreage is relatively insignificant in quantity. In 2009, streets and utilities comprised 564.9 acres or 6.6 percent of developed land; industrial uses totaled 44.3 acres, or 0.5 percent of developed land; commercial land areas included 189.8 acres or 2.2 percent of developed land; and semi-public uses accounted for 19.7 acres or less than 0.3 percent of developed land. Auburn continues to be the most rural of the five towns immediately surrounding Manchester. This characteristic is largely attributable to the 4,001 acres around Lake Massabesic in Manchester Water Works ownership, the small size of Auburn Village and the lack of direct highway access from most of the town to downtown Manchester. Bedford - The total land area of Bedford is 21,156.1 acres, of which 15,970.1 acres, or 75.5 percent of the land area, is developed. Of the developed land, 10,799.9 acres, or 67.6 percent, is in residential use. Of residential land, 10,495.3 acres, or 97.2 percent of all residential land, is dedicated to single-family homes. Acreage in the other residential classifications has historically been insignificant. Within the past few years, however, condominium townhouse development has brought multi-unit housing to town. Following single-family housing, the next largest amount of acreage is devoted to commercial uses, which accounts for 3,381.1 acres and represents 21.2 percent of all developed land. The next largest category is utilities and streets, which includes 1,073.6 acres or 6.7 percent of all developed land. The public and semi-public sectors taken together make up 620 acres and account for approximately 3.9 percent of all developed land. Industrial land in Bedford makes up 138.5 acres or 0.8 percent of all developed land. Candia - The total land area of Candia is 19,557.1 acres. As of 2009, 8,190.6 acres, or 41.9 percent of land was developed. Of the developed land area, 5,322.6 acres, or 65 percent, is devoted to residential use. In 2009, streets and utilities comprised 538.5 acres or 6.6 percent, of developed land; commercial uses covered 67 acres or 0.1 percent of developed land; and industrial development consisted of 97 acres or 0.1 percent of developed land. Candia is similar to several other outlying communities in that a high percentage of land is devoted to residential use while very little is dedicated to commercial and industrial uses.
23

Chester - The total land area of Chester is 16,618 acres, of which 6,019.8 acres, or 36.2 percent is developed. Of the developed land, 3846.9 acres, or 64 percent, is in residential use. Following residential uses, the next highest share of acreage is devoted to public use, which incorporates 1,018.4 acres and represents 17 percent of all developed land. The third largest classification is streets and utilities, representing 431.7 acres or 7.2 percent of all developed land. Deerfield – Comprising 33,347.7 acres in land area, Deerfield is the second largest community in the region. As of 2009, 8,800.5 acres, or 26.4 percent of land had been developed. Approximately 73.6 percent of the town's total land area is vacant. Of the developed acreage, 65.1 percent, or 5,732.4 acres, was in residential use. The next largest share of developed acreage was dedicated to public and semi-public uses, which includes 2,301.5 acres and represents 26.3 percent of all developed land. Much of this land falls within the confines of either Bear Brook State Park or Pawtuckaway State Park. Other acreage includes 611.6 acres (7 percent) reserved for utilities and streets, and 155 acres of commercial development comprising about 1.8 percent of all developed land. Derry - Derry makes up 23,225.6 acres of land area, of which 53 percent, or 12,307.9 acres, is developed. Of these developed areas, residential uses are most prominent, comprising 9,395.3 acres, or 76.3 percent of developed land. Public and semi-public uses total 1,177.4 acres and comprise 9.6 percent of developed lands. Utilities and streets total 1,161.6 acres, comprising 9.4 percent of developed land. Other land uses include 442.5 acres (3.6 percent of developed land area) dedicated to commercial uses and 131.1 acres committed to industrial operations, or about 1.1 percent of developed land. Goffstown - Goffstown is 24,064.5 acres in land area and as of 2009, 9,827.1 acres, or 40.8 percent had been developed. Approximately 59.2 percent of the town's total area is vacant land. Of the developed acreage, 69.2 percent, or 6,796.7 acres, was in residential use in 2009. A full 6,304.8 acres or 92.8 percent of residential lands were dedicated to single-family housing. Goffstown shows some diverse housing, having 285.6 acres of two-family housing, or 4.2 percent of all residential, and 111.9 acres of multi-family housing, or 1.6 percent of the residential land. The next largest share of developed acreage was reserved for streets and utilities, which included 1,538.6 acres and comprised 15.8 percent of all developed land. Other prominent acreage included 456.2 acres of public lands, or 4.7 percent of all developed land; 404.2 acres of semi-public property, or 4.2 percent of developed land; 397.5 acres of commercial space (4 percent); and 234 acres of industrial uses (2.4 percent). The Pinardville section of Goffstown is part of the Manchester Urbanized Area, while areas to the north and west of Goffstown Village contain the greatest amounts of available vacant land of any of the five towns surrounding Manchester. Hooksett - Hooksett consists of 23,760.7 acres of land acreage, of which 43.2 percent, or 10,265.1 acres, is developed. The balance, 56.8 percent, or 13,545.2 acres, is vacant. Of the developed area, residential acreage is the most prominent, accounting for 4,197 acres representing 40.9 percent of all developed land. Land devoted to single-family dwellings accounts for 3,505.8 acres, or 83.5 percent of all residential land. Other housing classification shares include 179 acres of two-family uses (4.3 percent of residential land); 366 acres of multi-family housing (8.7 percent); and 146.3 acres of manufactured housing (3.5 percent).
24
The acreage of public land, which comprises 2,491.7 acres, or 24.4 percent of the developed acreage, consists primarily of a portion of Bear Brook State Park, and land owned by the Manchester Water Works. Land dedicated to utilities and streets totaled 1533.1 acres in 2009 and comprised approximately 14.9 percent of all developed land area. Other land use categories included; 756.2 acres of industrial lands or 7.4 percent of all developed land, 1,150 acres of commercial space or about 11.2 percent of developed land, and 137.2 acres of semi-public representing 1.3 percent of all developed land. Londonderry - The total land area of Londonderry is 26,958.2 acres. Of that, 14,325.9 acres or about 53.1 percent of land was developed and 12,632.3 acres or 46.9 percent of total land area is vacant. Of the developed land, 55.4 percent or 7,945 acres is residential. Of residential land acreage: 86.3 percent, or 6,853.1 acres, is in single family use; 4.5 percent or 354.1 acres is two-family; 6.4 percent, or 512.2 acres, is multi-family; and 2.8 percent, or 225.6 acres, is made up of manufactured homes. Of non-residential acreage, 1,135.4 acres are industrial, or approximately 8 percent of all developed land. Commercial uses comprise 1335.7 acres, or about 9.3 percent of developed land. Streets and utilities comprise 13.1 percent of developed land, or 1,870.9 acres. Public uses total 1,971.4 acres, or about 13.8 percent of developed land. The bulk of the public acreage is comprised of the Musquash Meadow (swamp) area (1,035 acres). Semi-public land amounts to 67.5 acres or less than one percent of the developed area. In summary, Londonderry provides a fairly strong mix of residential uses. With respect to non-residential uses, Londonderry has the greatest share of the region's industrial acreage, much of which is associated with the Grenier Industrial Park adjacent to Manchester Boston Regional Airport. Manchester - The City of Manchester encompasses 21,815.3 land acres, of which 17,456.6, or 80 percent, is developed. Manchester has the least amount of available vacant land of all the municipalities in the study area (4,352.4 acres, or approximately 20 percent, of total land). In terms of its total developed land, Manchester is 40.9 percent residential, 8 percent commercial, 4.9 percent industrial, 6.7 percent semi-public, 19.1 percent public with 20.4 percent dedicated to streets and utilities. Of total developed land, 7,132.2 acres are residential. Within the residential category, 72.9 percent of land, or 5,201.7 acres, is dedicated to single-family housing. The remaining residential land includes 610.2 acres or 8.6 percent devoted to two-family, 1,491.7 acres or 20.9 percent to multi-family units, and 39.6 acres or 0.6 percent to manufactured homes. Two other developed land use categories had significant amounts of acreage, including public lands (3,328.5 acres, or 19.1 percent of developed land) and streets and utilities (3,561.7 acres, or 20.4 percent of developed land). After Auburn and Weare, publicly owned land in Manchester
25

the third largest share of that land use classification in the region. Approximately 15 percent of Manchester’s entire land area is public land. Other non-residential acreage includes industrial (862.2 acres, or five percent of developed land); semi-public (1,166 acres, or 6.7 percent of developed land) and commercial (1,410.7 acres, or 80 percent, of developed land). Manchester has the second largest amount of acreage designated to industrial uses compared to the other municipalities in the region. New Boston - The total land area of New Boston is 27,653.7 acres. Of that, 7,942.2 acres, or about 28.7 percent, is developed. In terms of available vacant land, New Boston ranks third in the study area behind Weare and Deerfield, with 19,711.5 acres, or 71.3 percent of its total land area. Of the developed land area, 53.7 percent, or 4,264.7 acres is residential. Of non-residential acreage, 2,552 acres are public and semi-public, or approximately 32.1 percent of developed land. Much of this acreage is part of the U.S. Air Force Satellite Tracking Station. Streets and utilities comprise 812.9 acres, or about 10.2 percent of developed land. Both industrial and commercial uses are quite small, together representing approximately 3.9 percent of developed land. Raymond - Raymond is 18,943.5 land acres in size, and as of 2009, 7,565.8 acres, or 39.9 percent had been developed. Of the developed land area, 77.5 percent or 5,866.5 acres is residential. Street and utilities comprise 747 acres, or about 9.9 percent of developed land. Approximately five percent of developed land is public and semi-public, or 364 acres. Commercial land represents 7 percent, or 527.8 acres and industrial uses are quite small, representing less than one percent of developed land. Weare - Weare is the largest community in the region with 38,464.3 land area acres. Of that area, 11,885 acres, or about 30.9 percent, is developed. At 26,579.3 acres, Weare accommodates the most vacant land in the region, representing 69.1 percent of its total land area. Of Weare’s developed acreage, 52.2 percent, or 6,199.8 acres, is in residential use. The next largest share of developed acreage includes public and semi-public lands, comprising 4,131.4 acres and representing 34.8 percent of all developed land. Most of this land is part of the Hopkinton Everett Flood Control Area. Other significant acreage includes: 1,036.3 acres of utilities and streets, or 8.8 percent of all developed land;, 437.5 acres of commercial uses, or about 3.7 percent of all developed land;, and 80 acres of industrial space, representing less than one percent of all developed land.
26
Conclusions and Recommendations Consistent with previous SNHPC staff experience, there were some difficulties encountered when collecting the land use data. These were mostly problems of delay, since all the pertinent information is available from various sources in most of the town offices. Problems encountered during this update include:
• Failure to note lot sizes and square footages for non-residential developments on building permits or in the building permit log;
• No references to street address, or tax map and lot number on the building permits and/or in the building permit log book;
• Discrepancies between the street address and the tax map/lot numbers referenced on the building permit by the builder, and the actual street address and tax map/lot numbers as reflected on the tax map and assessment cards;
• The lack of "specifics" on the building permits concerning additions to existing structures to determine whether or not the additions constitute new "units"; and
For the mutual benefit of the towns and the SNHPC, the following recommendations are offered as means of improving the efficiency of public information storage and retrieval relative to land use changes:
• The Building Permit should be properly and completely filled out: The applicant should fill out all the required information before the town official accepts the building permit application. This should include: accurate tax map/lot numbers; street name; the lot size in acres or square feet; and finally, land use type of new structure or addition and, in the case of a conversion, previous land use and the new land use.
• A "Permit Database" should be maintained:
All permits issued should be immediately entered, listing the following: a. Permit number b. Date of issue c. street name d. Complete tax map and lot number e. Type of structure or use, i.e., residential, commercial, industrial, etc. f. If a conversion, the previous use and new use g. Lot size in acres or square feet h. Building size in square feet
• A "Certificate of Occupancy (CO) Database" should be maintained: When a new building permit is entered into the Permit Database there should be a field containing important CO information. This information could include the list of town and state inspections required to fulfill the issuance of the Certificate of Occupancy and the date the final inspection or issuance was made. A query could easily be created to generate a list of permits for which CO’s have been issued for a specific year.
27

28
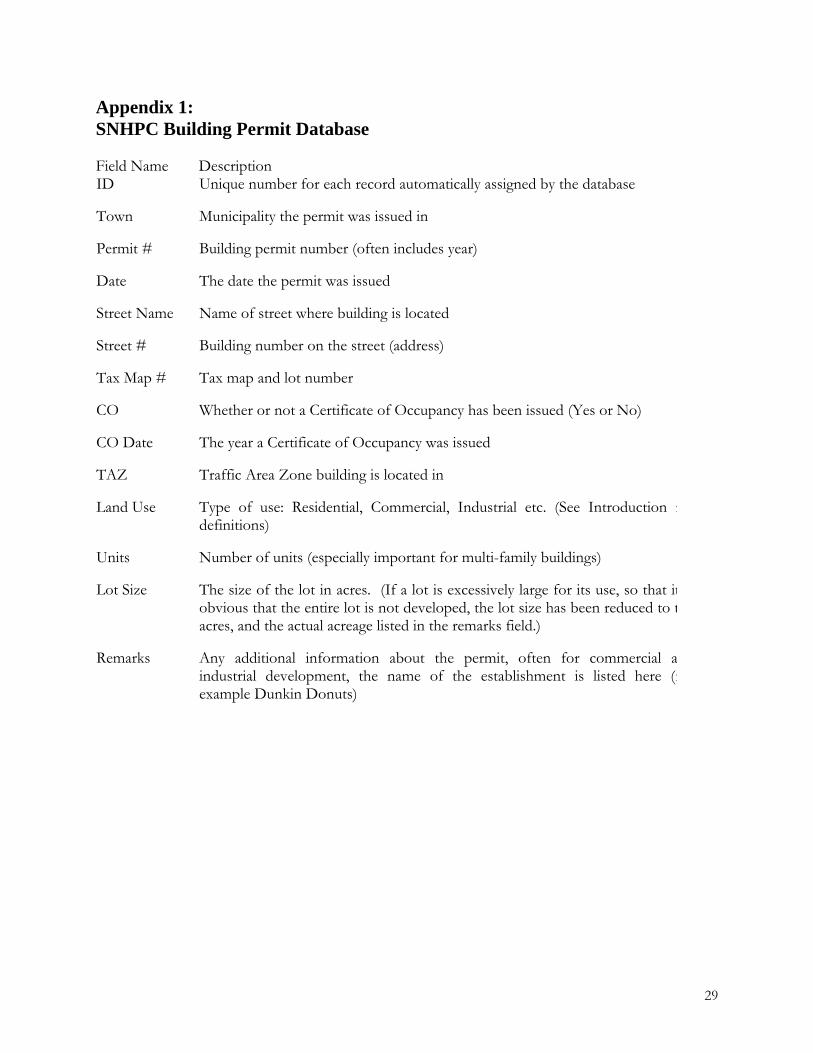
Appendix 1: SNHPC Building Permit Database Field Name Description ID Unique number for each record automatically assigned by the database
Town Municipality the permit was issued in
Permit # Building permit number (often includes year)
Date The date the permit was issued
Street Name Name of street where building is located
Street # Building number on the street (address)
Tax Map # Tax map and lot number
CO Whether or not a Certificate of Occupancy has been issued (Yes or No)
CO Date The year a Certificate of Occupancy was issued
TAZ Traffic Area Zone building is located in
Land Use Type of use: Residential, Commercial, Industrial etc. (See Introduction fdefinitions)
Units Number of units (especially important for multi-family buildings)
Lot Size The size of the lot in acres. (If a lot is excessively large for its use, so that itobvious that the entire lot is not developed, the lot size has been reduced to tacres, and the actual acreage listed in the remarks field.)
Remarks Any additional information about the permit, often for commercial aindustrial development, the name of the establishment is listed here (fexample Dunkin Donuts)
29