land value tax shift in downtowns, a tool for smart growth may 11, 2010 gary flomenhoft research...
Post on 21-Dec-2015
214 views
TRANSCRIPT

LAND VALUE TAX SHIFT
in Downtowns, a tool for SMART GROWTH
May 11, 2010
Gary Flomenhoft Research Associate/ Lecturer CDAE, Fellow, Gund InstituteUVM, Burlington, VT

“There is nothing more difficult to carry out, more doubtful of success, nor more dangerous to handle, than to initiate a new order of things. For those who would institute change have enemies in all those who profit by the old order, and they have only lukewarm defenders in all those who would profit by the new order.”
---Nicolo Machiavelli, 1490

HISTORICAL BACKGROUND

CLASSICAL ECONOMISTS ON LAND
PhysiocratsQuesnay; agricultural basis of economy: L’impot unique = land tax
David Ricardo-Law of Rent=Difference in production (return) over the worst land=RentUnearned increment=unearned profit from land rent

CLASSICAL ECONOMISTS ON LAND Adam Smith:
“Ground rents are a species of revenue which the owner, in many cases, enjoys without any care of attention of his own. Ground rents are therefore, perhaps a species of revenue which can best bear to have a peculiar tax imposed upon them.”
John Stuart Mill:“Landlords grow richer in their sleep without working,
risking, or economizing. The increase in the value of land, arising as it does from the efforts of an entire community, should belong to the community and not to the individual who might hold title.”
CLASSICAL ECONOMISTS ON LAND
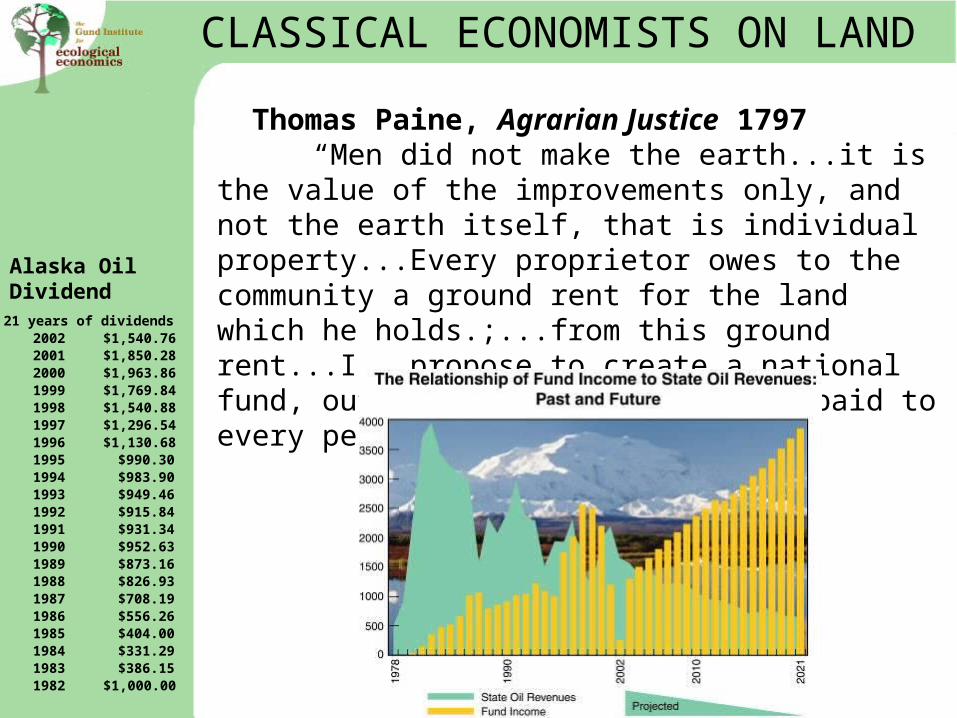
Thomas Paine, Agrarian Justice 1797“Men did not make the earth...it is the value of the
improvements only, and not the earth itself, that is individual property...Every proprietor owes to the community a ground rent for the land which he holds.;...from this ground rent...I...propose to create a national fund, out of which there shall be paid to every person...a sum.”21 years of dividends
2002 $1,540.762001 $1,850.282000 $1,963.861999 $1,769.841998 $1,540.881997 $1,296.541996 $1,130.681995 $990.301994 $983.901993 $949.461992 $915.841991 $931.341990 $952.631989 $873.161988 $826.931987 $708.191986 $556.261985 $404.001984 $331.291983 $386.151982 $1,000.00
Alaska Oil Dividend

HISTORY OF LAND VALUE TAX
Henry George: Progress and Poverty 1879.
“Poverty deepens as wealth increases, and wages are forced down while productive power grows, because land, which is the source of all wealth and the field of all labor, is monopolized.”
“To abolish all taxation save that upon land values”: The “single tax”. Forerunner to modern day Green tax shift: “tax bads, not goods.”
“The taking by the community, for the use of the community, of that value which is the creation of the community.”
Basis of modern assessments.

Modern Economists
Right: “Land tax is the least bad tax” ---Milton Friedman
Left: “Usurious rent is the cause of worldwide poverty” ---Joseph Stiglitz
Green: “Taxation of value added by labor and capital is certainly legitimate. But it is both more legitimate and less necessary after we have, as much as possible, captured natural resource rents for public revenue.” ---Herman Daly

Economics 101
A Little Economics

TAX ON BUILDINGS - production cost
S1
D
P
Q
p1
q1
CS
PS

S1
D
P
Q
p1
q1
CS
PS
tax
S2
p2
q2
tax
Deadweightloss
TAX ON BUILDINGS - production cost
Loss of PS
Loss of CS

TAX ON LAND - no production cost
D
P
Q
tax
S
P1
tax?
Q1
tax
“Buy land, they ain’t making any more.”
-Will Rogers
Q*
P*

Q: What Causes Sprawl?
One factor is land speculation. How?
A: By withholding land from the market, and holding for gain, price is driven up, and people have to move further out from center city to find available affordable land. (30% vacant land-Brookings)
“The most comfortable, but also the most unproductive way for a capitalist to increase his fortune, is to put all monies in sites and await that point in time when a society, hungering for land, has to pay his price.” ---Andrew Carnegie

LAND SPECULATION
Q: Why is speculation bad?
A:
Drives up price of land
Creates Sprawl
Withholds land from market
Creates slums
“Flipping”
VT anti-speculation tax: only applies to >25 acre industrial and forest land
PROP 13: corporations avoid through selling shares

LAND SPECULATION
Q: What good or service does a land speculator provide to the market?
A: Nothing.
“The land speculator profits in direct proportion to the damage done to society”
-Winston Churchill

ANNUAL RETURN
Annual Return = annual land inflation + annual income
= 6.65%/yr + ?
YEAR BURL MEDIAN HOME PRICE
%
increase
Annual increase
1970 $21,500
2005 $204,500 952% 6.65%
CPI Increase 1970-2005 503%
“Land is not the only monopoly, but it’s the mother of all monopolies.”
---Winston Churchill

Return on speculation

HOUSING GAP
FROM:
HOUSING&WAGES IN VERMONT
VT HOUSING COUNCIL

3 Ways to control land prices
1) Community land trust
2) Municipal leasehold
3) Tax land at high enough rate to deter speculation

Tax Increment Financing-TIF (Wikopedia)
Tax Increment Financing, or TIF, is a tool for redevelopment and community improvement projects throughout the United States for more than half a century. With federal and state sources for redevelopment generally less available, TIF has become an often-used financing mechanism for municipalities. Similar or related approaches are used elsewhere in the world. See for example, Value capture.
TIF is a tool to use future gains in taxes to finance the current improvements that will create those gains. When a public project such as a road, school, or hazardous waste cleanup is carried out, there is an increase in the value of surrounding real estate, and often new investment (new or rehabilitated buildings, for example). This increased site value and investment creates more taxable property, which increases tax revenues.

“Value Recapture” (Wikopedia)
Value capture refers to a type of innovative public financing in which increases in private land values generated by a new public investment are all or in part “captured” through a land related tax to pay for that investment or other public projects.
Value capture refers to the process by which all or a portion of increments in land value attributed to "community interventions" rather than landowner actions are programmed in advance and recouped by the public sector. These "unearned increments" may be captured indirectly through their conversion into public revenues as taxes, fees, exactions or other fiscal means, or directly through on-site improvements to benefit the community at large…
Value capture can be thought of as a fully contained sub-set of land value tax, however with a much more focused domain of application as indicated here.

“Value Recapture” of public investments
Wright Act 1889: Tulare, CA Irrigation DistrictFinanced by tax on land value. Trees, vines, structures, etc. on the land were exempt
CA Central Valley Irrigation Districts
San Joaquin Valley Agriculture
80% produce in US

“Value Recapture” of public investments
Crossrail – the London rail project now under consideration to fund by land tax.
Studies say public transit could pay for itself through capture of increase in land values around transit stops.

What makes land valuable? Publicly created
Populationdemandnatural features public improvementspublic services: fire, police, schools, wasteprivate investment in the areabusiness activitylimited supplyzoninggrowth restrictions (Santa Cruz)growth boundaries
Not due to private effort

What makes buildings valuable-Privately created
Work
Investment
Materials
Architecture
Etc.
Value created through private effort

SUMMARY OF INCENTIVES
LOCATION TAXES ARE CONSTRUCTIVEEncourage building upkeepStrong anti-blight influenceStimulate new constructionLower land pricesBring land into useDiscourage sprawlPro-labor, creativity & effort
IMPROVEMENT TAXES ARE DESTRUCTIVEPenalize buildings & improvementsReward rundown buildingsPromote slums and blightRaise land pricesEncourage sprawlSubsidize unearned land speculationAnti-labor, anti-creativity & anti-effort

LAND TAX IS PART OF GREEN TAX SHIFT
“Pay for what you take, not for what you make”
Tax “bads” not “goods”
“Tax waste not work”

HISTORICAL APPLICATIONS
Denmark: 1790’s, 1950’s, 1960’s
California: 1890’s irrigation districts
Australia: 1930’s-present, Sydney, Canberra-leasehold
New Zealand: 1930’s-present 80% site only
South Africa: Jo-berg
Hong Kong: leasehold
Singapore: rent collection
Taiwan: 1940’s-land to the tiller
NY city 1920’s: 10 yr. abatement of improvements
Pennsylvania: 1913-present

MODERN APPLICATIONS
Australia, New Zealand
Pennsylvania, date adoptedAliquippa School District 1993Aliquippa 1988Allentown 1997Altoona 2002Clairton 1989Clairton School District 2006DuBois 1991Duquesne 1985Ebensburg 2000Harrisburg 1975Lock Haven 1991McKeesport 1980New Castle 1982Oil City 1989Pittsburgh (Until 2001) 1913Pittsburgh Improvement 1997Scranton 1913Steelton 2000Titusville 1990Washington 1985

MODERN APPLICATIONS
City RatioAliquippa School District 14.8182
Aliquippa 7.0702
Allentown 4.6976
Altoona 10.1833
Clairton 22.9508
Clairton School District 24.1935
DuBois 21.1111
Duquesne 1.8890
Ebensburg 3.0075
Harrisburg 6.0000
Lock Haven 5.7036
McKeesport 3.9286
New Castle 4.8391
Oil City 3.3764
Pittsburgh (Until 2001) 6.0000
Pittsburgh Improvement N/A
Scranton 4.5981
Steelton 1.4617
Titusville 3.1137
Washington 15.0000

Harrisburg-Poster Child for LVT
1983 listed as 2nd most distressed city in US. * The number of vacant structures, over 4200 in 1982, is today less than 500 (1994) = 80% reduction in vacancy.
* With a resident population of 53,000, today there are 4,700 more city residents employed than in 1982.
* The crime rate has dropped 22.5% since 1981.
* The fire rate has dropped 51% since 1982.
* Number of businesses tripled to 3000
* 3.5B invested in projects
These results are especially noteworthy when one considers the fact that 41% of the land and buildings of Harrisburg cannot be taxed by the city because it is owned by the state or non-profit bodies.

EVIDENCE

EVIDENCE

EVIDENCE

Average Annual Value of Building PermitsDun and Bradstreet Data
(Rustbelt)
1960-1979
1980-1989
Percent Change
Akron
134,026
87,907
-34.41
Allentown
48,124
28,801
-40.15
Buffalo
93,749
82,930
-11.54
Canton
40,235
24,251
-39.73
Cincinnati
318,248
231,561
-27.24
Cleveland
329,511
224,587
-31.84
Columbus
456,580
527,026
15.43
Dayton
107,798
92,249
-14.42
Detroit
368,894
277,783
-24.70
Erie
48,353
22,761
-52.93
Pittsburgh
181,734
309,727
70.43
Rochester
118,726
82,411
-30.59
Syracuse
94,503
53,673
-43.21
Toledo
138,384
93,495
-32.44
Youngstown
33,688
11,120
-66.99
15 City Average
167,504
143,352
-14.42


Evidence for development
•45 studies prove that when towns adopt LVT, a spurt in new construction and renovation results.
•63 studies conclude that towns switching from taxing buildings to taxing land always out-constructed and out-renovated their neighbors who were subject to the same economic-growth influences.
Contact:Steven B. Cord (Professor-Emeritus)10528 Cross Fox Lane, Columbia MD 210441-410-997-1182 (phone/fax)[email protected] (e-mail)www.EconomicBoom.info

Vermont Property Tax Shift-Statewide

VT Tax Revenue 2004
VT taxes-2004
Personal Income
Estate Tax
Sales & Use
Other fees
Beverage
Captive Insurance
Telecommunications
Telephone Company
Cigarette
TOTAL PROPERTY
Meals & Rooms
Corporate Income
Telephone Property
Bank Franchise
Insurance
Tobacco Products
TOTAL WASTE
TOTAL AIR AND WATER
Other general taxes
TOTAL ENERGY
Property taxes comprising 35%Personal income 20%Sales and use 12%Energy taxes 12%

VT Tax Revenue-Property split
VT Taxes-2004
buildings-NICU24%
Other fees
Tobacco Products0% Other general
taxes
TOTAL AIR AND WATER0%
TOTAL WASTE0%
TOTAL CHEMICALS0% Speculative Gains Tax
0%current use property
land-NICU
Cigarette2%
Beverage0%Captive Insurance
1%
Sales & Use12%
Telecommunications
Telephone Company0%
Bank Franchise0%
Insurance1%
TOTAL ENERGY12%
Estate Tax1%
Personal Income20%
Property Transfer Tax2%
Meals & Rooms5%
Corporate Income3%
Telephone Property0%
Buildings 24%Personal income 20%Sales and use 12%Energy taxes 12%Land 11%

VT Tax Revenue-Existing Green Taxes
VT Taxes-2004
buildings-NICU
Other fees
Tobacco ProductsOther general taxes
TOTAL AIR AND WATER
TOTAL WASTE
TOTAL CHEMICALSSpeculative Gains Tax
current use property
land-NICU
CigaretteBeverageCaptive Insurance
Sales & Use
Telecommunications
Telephone Company
Bank Franchise
Insurance
TOTAL ENERGY
Estate Tax
Personal Income
Property Transfer Tax
Meals & Rooms
Corporate Income
Telephone Property

Recommendations:
• Apply LVT only in “growth centers.”
• Reverse current ratio to generate 2/3 of state property tax revenue from taxes on land.
• Work with established growth boundaries being
developed by the Vermont Smart Growth Collaborative.
• Maintain Revenue Neutral.

Revised State Green Tax Revenue
VT Taxes-2004 REVISED
buildings-NICU
Other fees
TOTAL AIR AND WATER
TOTAL WASTE
TOTAL CHEMICALS
Speculative Gains Tax
current use property
land-NICU
Other general taxesTobacco Products
Cigarette
Meals & Rooms
Telephone Company
Insurance
Captive Insurance
Beverage
TOTAL ENERGY
Sales & Use
Estate Tax
Property Transfer Tax
Telecommunications
Telephone Property
Bank Franchise

2004 Vermont Property Taxes:
Tax Rate 2004 Revenue
Property Transfer Tax
.5%- 1.25% $33,951,657
Speculative Gains Tax
5-80% $4,288,132
Current Use Penalty Tax
10-20% $404,155
Property Tax (State Portion)
avg 1.52% $741,600,000

Vermont Property Taxes
eee property tax (PROP68)
0%
current use property1%
land29%
Property Transfer Tax4%
Current Use Penalty Tax0%
buildings 65%
Speculative Gains Tax 1%

Proposed Property Tax Revenue
2004 REVISED VT Property taxes
eee property tax (PROP68)0%
current use property1%
land-NICU65%
Property Transfer Tax4%
Current Use Penalty Tax0%
buildings-NICU29%
Speculative Gains Tax1%

1) Revenue neutral
2) 50% or 100% shift to land value tax statewide
3) Total revenue divided by total land assessment =land value tax rate
Vermont Property Tax-shift Study Criteria

1) Single rate statewide & city by city
2) No separation of school district from municipal tax district
3) No adjustment for common level appraisal
Vermont Property Tax-shift Study Limitations

2000 BLD LAND TOTAL RATIO
State $12.2B $5.4B $17.8B 2.26%
68.8% 30.4% 100%
Burlington $1.1B $.53B 1.59$B(8.9% of state)
2.04%
67.6% 33.2% 100%-13.5%/yr
5 YR SHIFT-1 54.1% 45.9% 100%
2 40.6% 54.4% 100%
3 27.1% 72.9% 100%
4 13.6% 86.1% 100%
5 0% 100% 100%
ASSESSMENTS-2000

GrossPropertyClassNumber_of_Parcels
AvgParcelDiffFromCurrent
Agricultural 1319 $8,916
Commercial/Industrial 3082 $8,283
Not Available 5 $6,528
Residential 68916 $3,144
Total 73322 $3,464
Statewide DECREASE and INCREASE BY GPC
INCREASE
DECREASE
GrossPropertyClassNumber_of_Parcels
AvgParcelDiffFromCurrent
Agricultural 324 -$6,714
Commercial/Industrial 5794 -$10,927
Not Available 5610 -$6
Residential 87837 -$2,198
Total 99565 -$2,597

Burlington Tax Shift Analysis (2004)

Burlington INCREASE OR DECREASE BY GPC
GrossPropertyClassNumber_of_Parcels
AvgParcelDiffFromCurrent
Agricultural 4 $11,443
Commercial/Industrial 605 $11,088
Residential 6,437 $2,617
Total 7,046 $3,350
INCREASE
DECREASEGrossPropertyClass
Number_of_Parcels
AvgParcelDiffFromCurrent
Agricultural 1 -$1,256
Commercial/Industrial 525 -$14,080
Residential 2488 -$3,820
Total 3014 -$5,606

Burlington BIGGEST INCREASE
Acres Prp Cl Owner Name Street Name $ Diff
6.21 CL MCAULEY SQUARE HOUSE 123 ST PAUL STREET $534,736
16.72 RL FLYNN EST J J TRUSTEE ATTN PRISCILLA S $324,133
2.16 C DONOHOE O'BRIEN BOX 119 $237,471
4.89 C LAKE CHAMPLAIN KING STREET $200,695
2.06 CL PAM-RADISSON 60 BATTERY STREET $198,870
1.21 CL DONOHOE O'BRIEN BOX 119 $152,246
3.3 CL UNIVERSITY OF VERMONT C/O LAND $147,935
1 CL CODY CHEVROLET INC ET L C T $126,370
1.79 C HOWARD BANK N A 111 MAIN STREET $110,327
0.31 CL CHITTENDEN COUNTY OF L C T $95,316
0.85 C CHITTENDEN TRUST CO P O BOX 820 $90,503

Acres Prp Cls Owner Name Street name $ Diff
0 C RAD-BURL L L C PAM-RADISSON -$268,344.00
0 C STARR FARM C/O VENCOR INC -$241,677.00
25.93 CA NORTHGATE HOUSING P O BOX 3094 -$225,725.00
0.25 C BURLINGTON SEVEN P O BOX 119 -$206,911.00
0.91 C VERMONT SUBACURE LLC P O BOX 1103 -$194,112.00
0 CC PECOR, RAYMOND C JR KING STREET -$189,769.00
1.77 C THE MAY DEPARTMENT 611 OLIVE STREET -$156,388.00
0 C FIRST HEALTHCARE CORP 3300 AEGON CENTER -$145,538.00
0 C DONOHOE O'BRIEN BOX 119 -$140,337.00
0 C BURLINGTON SQUARE CURTIS CENTER -$130,232.00
Burlington BIGGEST DECREASE

Prop Property Bldg/
Cls Class # Building Land Total Land Total Total Diff w/ % Diff w/
Code Name Parcels Value Value Value Ratio Current 100% Land 100% Land 100%L
C Commercial 368 $184,002,513 $81,786,800 $264,356,721 2.25 $6,515,422 $6,074,324 -$441,099 -7%
CA Commercial Apartments 350 $101,175,845 $28,664,900 $129,709,145 3.53 $3,196,854 $2,128,948 -$1,067,906 -33%
CC Commercial Condo 83 $30,107,301 $804,500 $30,858,401 37.42 $760,546 $59,750 -$700,796 -92%
CL Commercial Land 57 $5,029,400 $15,577,000 $11,573,000 0.32 $285,232 $1,156,907 $871,675 306%
CR Commercial 212 $30,013,355 $17,267,200 $47,280,555 1.74 $1,165,292 $1,282,439 $117,147 10%
CRC Commercial 1 $40,600 $119,800 $160,400 0.34 $3,953 $8,898 $4,944 125%
E Education 11 $2,592,000 $504,600 $3,096,600 5.14 $76,320 $37,477 -$38,843 -51%
EU Education - Utility 1 $26,500 $43,600 $70,100 0.61 $1,728 $3,238 $1,510 87%
F Farm 2 $78,900 $237,700 $262,200 0.33 $6,462 $17,654 $11,192 173%
FL Farm Land 3 $36,000 $181,800 $145,800 0.2 $3,593 $13,502 $9,909 276%
I Industrial 14 $16,645,107 $4,429,900 $21,075,007 3.76 $519,422 $329,010 -$190,412 -37%
IL Industrial Land 4 $300,800 $1,300,500 $1,289,700 0.23 $31,786 $96,588 $64,802 204%
MH Mobile Home 124 $2,493,000 $26,200 $2,519,200 95.15 $62,089 $1,946 -$60,143 -97%
ML Mobile Home on Land 6 $146,200 $116,700 $262,900 1.25 $6,480 $8,667 $2,188 34%
R1 Residential < 6 Acres 5,098 $372,403,300 $283,223,300 $655,493,000 1.31 $16,155,495 $21,035,057 $4,879,561 30%
R2 Residential >= 6 Acres 1,114 $77,587,300 $50,129,300 $127,716,600 1.55 $3,147,745 $3,723,114 $575,369 18%
R3 Residential 344 $29,072,700 $15,466,100 $44,538,800 1.88 $1,097,718 $1,148,671 $50,953 5%
R4 Residential 239 $22,914,800 $10,950,800 $33,865,600 2.09 $834,663 $813,318 -$21,344 -3%
RC Residential Condo 1,757 $191,790,100 $931,100 $192,721,200 205.98 $4,749,870 $69,153 -$4,680,717 -99%
RL Residential Land 199 $853,800 $12,887,100 $13,191,900 0.07 $325,132 $957,128 $631,996 194%
TE Education 29 $7,503,602 $2,905,600 $10,210,602 2.58 $251,654 $215,800 -$35,854 -14%
V1 Vacation 1 44 $1,938,400 $1,282,500 $3,220,900 1.51 $79,383 $95,252 $15,868 20%
Municipal Totals 10,060 $1,076,751,523 $528,837,000 $1,593,618,331 2.04 $39,276,840 $39,276,840 0 $0
Burlington RESULTS BY PROPERTY CLASS

ESSEX JUNCTION:
LAND VALUE TAX SHIFT DETAILS (2008)

ESSEX JUNCTION RES,CONDO,COM
MERGED
LAND BLDS TOTAL BLD/
LAND RATIO
RATE REV
$309,345,011 $801,849,353 $1,111,194,364 2.59 .020563-
.021058
$23,227,393
$309,345,011 7.5086% $23,227,393
CATEGORY NUMBER AVERAGE
DECREASE 1422 -$3,223
INCREASE 1960 $2,335

ESSEX JUNCTION SEPARATED
RESIDENTIAL & CONDOS
LAND BLDS TOTAL BLD/
LAND RATIO
RATE REV
$252,071,291 $511,368,773 $763,440,064 2.029 2.1058% $16,076,521
$252,071,291 6.3778% $16,076,521
CATEGORY NUMBER AVERAGE
DECREASE 1716 -$1,170
INCREASE 1474 $1,362

ESSEX JUNCTION SEPARATED
RESIDENTIAL & CONDOS-TOP 10 DECREASETYP PARCEL TOTAL LAND SIZE /ACRE DIFF
RES 5 TIFFANY LN $615,400 $91,000 1.140 $79,825 -$7,155
RES 71 CASCADE ST $487,900 $80,800 0.780 $103,590 -$5,121
RES 40 BEECH ST $450,500 $74,600 1.030 $72,427 -$4,729
RES 24 CORDUROY RD $501,700 $95,300 0.710 $134,225 -$4,487
RES 23 MAPLE ST $476,500 $89,600 0.480 $186,667 -$4,320
RES 40 TYLER DR $414,400 $70,100 0.340 $206,176 -$4,256
RES 39 TYLER DR $408,200 $69,800 0.310 $225,161 -$4,144
RES 22 TYLER DR $406,200 $69,400 0.250 $277,600 -$4,128
RES 35 TYLER DR $405,500 $69,200 0.230 $300,870 -$4,126
RES 6 TYLER DR $405,100 $69,500 0.260 $267,308 -$4,098

ESSEX JUNCTION SEPARATED
RESIDENTIAL & CONDOS- TOP 10 INCREASETYP PARCEL TOTAL LAND SIZE /ACRE DIFF
RES 4 HIAWATHA AVE $102,700 $102,700 0.190 $540,526 $4,387
RES 3 WILLEYS CT $104,000 $104,000 3.290 $31,611 $4,443
RES 165 MAIN ST $104,400 $104,400 2.030 $51,429 $4,460
RES 10 OLD COLCHESTER RD
$104,900 $104,900 2.090 $50,191 $4,481
RES 1 NORTH HILLCREST RD
$107,100 $107,100 0.150 $714,000 $4,575
RES 60 OLD COLCHESTER RD
$111,600 $111,600 3.000 $37,200 $4,768
RES 22 JACKSON ST $117,600 $117,600 0.120 $980,000 $5,024
RES 71 BRICKYARD RD $137,900 $137,900 19.500 $7,072 $5,891
RES 76WEST ST $144,600 $144,600 7.730 $18,706 $6,177
RES 315 SOUTH ST $1,215,200 $589,000 446.66 $1,319 $11,975

ESSEX JUNCTION SEPARATED
COMMERCIAL
LAND TOTAL BLD/LAND RATIO
RATE REV IBM
$57,273,720 $347,754,300 5.07 2.0563% $7,150,872 $2,131,281
(30%)
$57,273,720 12.4854% $7,150,872 $584,820
(8.2%)
CATEGORY NUMBER AVERAGE
DECREASE 37 -$73,240
INCREASE 156 $17,371

ESSEX JUNCTION SEPARATED
COMMERCIAL-TOP 10 DECREASEPARCEL TOTAL LAND SIZE /ACRE DIFF
1000 RIVER ST $103,646,400 $4,684,020 233.150 $20,090 -$1,546,461
POWER LINES $24,862,200 $0 85.040 $0 -$511,241
3 EDUCATIONAL DR
$35,248,400 $4,406,700 97.800 $45,058 -$174,617
128 WEST ST $3,686,700 $0 7.070 $0 -$75,810
GAS LINES $3,672,000 $0 0.000 $0 -$75,507
48 PARK ST $7,583,600 $869,800 25.370 $34,285 -$47,343
136 WEST ST $2,183,500 $0 0.000 $0 -$44,899
203 PEARL ST $2,156,200 $0 1.140 $0 -$44,338
1 PEARL ST $4,197,700 $446,300 1.890 $236,138 -$30,595
34 PARK ST $2,036,800 $181,500 2.600 $69,808 -$19,222

ESSEX JUNCTION SEPARATED
COMMERCIAL-TOP 10 INCREASEPARCEL TOTAL LAND SIZE /ACRE DIFF
56 PEARL ST $390,900 $279,300 0.29 $963,103 $26,834
150 WEST ST $1,491,900 $478,600 7.25 $66,014 $29,077
102 MAPLE ST $10,216,300 $1,967,600 33.5 $58,734 $35,586
30 OLD COLCHESTER RD
$414,200 $414,200 7.93 $52,232 $43,197
30 HIAWATHA AVE
$2,622,100 $802,600 7.92 $101,338 $46,290
111 WEST ST $2,012,600 $761,000 29.46 $25,832 $53,629
75 PEARL ST $3,409,000 $996,300 5.14 $193,833 $54,293
29 CASCADE ST $1,950,600 $952,100 32.0 $29,753 $78,764
58 PEARL ST $3,232,300 $1,393,100 8.57 $162,555 $107,469
105 PEARL ST $27,444,400 $9,627,300 129.75 $74,199 $637,671

GROWTH CENTER Res, Condo, Comm Merged
LAND BLDS TOTAL BLD/LAND RATIO
RATE REV
$16,086,725 $40,324,075 $56,410,800 2.507 .020563-
.021058
$1,163,543
$16,086,725 .072329 $1,163,543
CATEGORY NUMBER AVERAGE
DECREASE 36 -$7,410.73
INCREASE 58 $4,599.76

GROWTH CENTER MERGED
TOP 10 DECREASE (ALL COM)PARCEL TOTAL LAND SIZE /ACRE DIFF
1 PEARL $4,197,700 $446,300 1.890 $243,152 -$54,037
34 PARK $2,036,800 $181,500 2.600 $68,373 -$28,755
15 LINCOLN $1,805,800 $149,900 0.550 $180,514 -$26,290
4 PARK $1,869,300 $225,300 1.400 $155,045 -$22,143
82 PEARL $1,535,300 $232,500 0.840 $276,762 -$14,754
4 PEARL $1,567,400 $243,300 0.940 $240,720 -$14,633
9 LINCOLN $1,195,800 $145,400 0.440 $340,182 -$14,073
100 PEARL $1,557,700 $256,900 1.110 $227,782 -$13,450
4 MAIN $1,053,800 $148,500 0.510 $303,685 -$10,928
20 MAIN $1,033,900 $145,100 0.430 $364,418 -$10,765

GROWTH CENTER MERGED
TOP 10 INCREASE (ALL COM)PARCEL TOTAL LAND SIZE /ACRE DIFF
110 PEARL $777,400 $317,300 0.730 $434,658 $6,964
15 PEARL $280,100 $176,600 0.210 $840,952 $7,014
106 PEARL $764,700 $316,500 0.720 $439,583 $7,168
86 PEARL $258,900 $195,800 0.200 $979,000 $8,838
92 PEARL $219,500 $202,300 0.340 $595,000 $10,119
1 MAPLE $471,700 $275,300 0.220 $1,251,364 $10,213
98 PEARL $230,900 $208,200 0.450 $462,667 $10,311
102 PEARL $204,100 $204,100 0.380 $537,105 $10,566
56 PEARL $390,900 $279,300 0.290 $963,103 $12,164
58 PEARL $3,232,300 $1,393,100 8.570 $162,555 $34,296

GROWTH CENTER SEPARATED
RESIDENTIAL AND CONDOS
LAND BLDS TOTAL BLD/LAND RATIO
RATE REV
$2,407,525 $4,800,875 $7,208,400 1.994 0.021058 $151,794
$2,407,525 0.06305 $151,794
CATEGORY NUMBER AVERAGE
DECREASE 15 -$1,296.27
INCREASE 14 $1,388.86

GROWTH CENTER SEPARATED
TOP 10 DECREASE RES&CONDOTYP PARCEL TOTAL SIZE /ACRE DIFF
RES 18 LINCOLN $491,700 0.480 $215,668 -$3,708.75
RES 15 MAPLE $409,800 0.680 $131,522 -$3,150.52
RES 7 PARK $388,300 0.200 $445,915 -$1,392.64
RES 20 LINCOLN $330,300 0.350 $256,588 -$1,381.84
RES 14 RAILROAD $311,800 0.420 $207,627 -$1,231.85
CONDO 65 PEARL $217,700 -$1,152.83
CONDO 65 PEARL $208,500 -$1,104.11
CONDO 65 PEARL $208,500 -$1,104.11
CONDO 65 PEARL $196,500 -$1,040.57
CONDO 65 PEARL $196,500 -$1,040.57

GROWTH CENTER SEPARATED
TOP 10 INCREASE RES&CONDOPARCEL TOTAL LAND SIZE /ACRE DIFF
112 PEARL $210,900 $83,000 0.250 $301,420 $792
2 PARK $277,200 $106,500 0.100 $935,637 $878
90 PEARL $200,100 $85,300 0.500 $178,721 $1,164
25 SCHOOL $239,600 $106,700 0.120 $912,059 $1,682
5 SCHOOL $238,300 $108,300 0.260 $426,112 $1,810
3 PARK $233,400 $106,800 0.130 $768,977 $1,819
29 SCHOOL $221,500 $106,500 0.100 $1,035,289 $2,050
27 SCHOOL $215,700 $107,400 0.180 $597,073 $2,229
5 SCHOOL $188,300 $106,200 0.080 $1,196,067 $2,731
5 PARK $189,400 $107,800 0.210 $698,831 $2,808

GROWTH CENTER SEPARATED
COMMERCIAL
LAND BLDS TOTAL BLD/LAND RATIO
RATE REV
$13,679,200 $35,523,200 $49,202,400 2.597 0.020563 $1,011,749
$13,679,200 0.073962 $1,011,749
CATEGORY NUMBER AVERAGE
DECREASE 24 -$10,396.76
INCREASE 43 $5,802.84

GROWTH CENTER SEPARATED
TOP 10 DECREASE COMMERCIALPARCEL TOTAL LAND SIZE /ACRE DIFF
1 PEARL $4,197,700 $446,300 1.890 $236,138 -$53,308
34 PARK $2,036,800 $181,500 2.600 $69,808 -$28,459
15 LINCOLN $1,805,800 $149,900 0.550 $272,545 -$26,046
4 PARK $1,869,300 $225,300 1.400 $160,929 -$21,775
82 PEARL $1,535,300 $232,500 0.840 $276,786 -$14,374
4 PEARL $1,567,400 $243,300 0.940 $258,830 -$14,235
9 LINCOLN $1,195,800 $145,400 0.440 $330,455 -$13,835
100 PEARL $1,557,700 $256,900 1.110 $231,441 -$13,030
4 MAIN $1,053,800 $148,500 0.510 $291,176 -$10,686
20 MAIN $1,033,900 $145,100 0.430 $337,442 -$10,528

GROWTH CENTER SEPARATED
TOP 10 INCREASE COMMERCIALPARCEL TOTAL LAND SIZE /ACRE DIFF
110 PEARL $777,400 $317,300 0.730 $434,658 $7,483
15 PEARL $280,100 $176,600 0.210 $840,952 $7,302
106 PEARL $764,700 $316,500 0.720 $439,583 $7,685
86 PEARL $258,900 $195,800 0.200 $979,000 $9,158
92 PEARL $219,500 $202,300 0.340 $595,000 $10,449
1 MAPLE $471,700 $275,300 0.220 $1,251,364 $10,662
98 PEARL $230,900 $208,200 0.450 $462,667 $10,651
102 PEARL $204,100 $204,100 0.380 $537,105 $10,899
56 PEARL $390,900 $279,300 0.290 $963,103 $12,620
58 PEARL $3,232,300 $1,393,100 8.570 $162,555 $36,571


Growth Center land value/acre
TYP LAND
VALUE
SIZE $/ACRE
RES $2,065,500 6.154 $335,620
COM $13,679,200 50.055 $273,286

Greenwich land value/acre

LESSONS FROM THE PAST
Get zoning/set-asides in place to protect environmental/agricultural assets
Get assessments right
Don’t implement at same time as reassessment (Amsterdam, NY, Pittsburgh, PA)
Implement gradually ie: over 5 years
Alaska dividend-irreversible