landfill cover layers
TRANSCRIPT

LECTURE 8
SOURCE CONTROL AND MANAGEMENT OF MIGRATION

Classes of Site Remediation
Source controlTechnologies to contain or treat sources of contamination (wastes or contaminated soil)
Management of migrationTechnologies to control the movement of contaminants away from sources (usually in ground water)

Cover systems (“caps”)
Prevent physical contact and exposure to wasteSufficient cap may be enough thickness of soil to prevent humans or animals from digging into waste
Reduce (or almost eliminate) precipitation infiltration
Reduces/prevents transport of contaminants to ground water by infiltrating water

Landfill Cover Layers
Source: Federal Remediation and Technologies Roundtable, February 12, 2003. 4.30 Landfill Cap (Soil Containment Remediation Technology).
Federal Remediation and Technologies Roundtable, February 12, 2003. 4.30 Landfill Cap (Soil Containment Remediation Technology). http://www.frtr.gov/matrix2/section4/4_30.html. Accessed February 26, 2003.

Cap layers: Vegetation
Purposes:Erosion controlInfiltration reduction by
evapotranspirationCharacteristics:
Shallow rooted plantsLow nutrient needsDrought and heat resistant
Source: Federal Remediation and Technologies Roundtable, February 12, 2003. 4.30 Landfill Cap (Soil Containment Remediation Technology).

Cap layers: soil layer
Purposes:Support vegetationProtect underlying layers
Typically 60-cm thick
Crushed stone or cobbles may substitute in arid environments
Source: Federal Remediation and Technologies Roundtable, February 12, 2003. 4.30 Landfill Cap (Soil Containment Remediation Technology).

Cap layers: Protection layer
Also called “biotic barrier”
90-cm layer of cobbles to stop burrowing animals and deep roots
Not always included
Source: Federal Remediation and Technologies Roundtable, February 12, 2003. 4.30 Landfill Cap (Soil Containment Remediation Technology).

Cap layers: Filter layer
Prevents clogging of drainage layer by fines from soil layer
May be geosynthetic filter fabric or 30-cm sand
Source: Federal Remediation and Technologies Roundtable, February 12, 2003. 4.30 Landfill Cap (Soil Containment Remediation Technology).

Cap layers: Drainage layer
Minimizes contact between infiltrated water and low K layers below
Prevents ponding of water on geomembrane liner
Drains by gravity to toe drains
At least 30 cm of sand with K = 10-2 cm/sec or equivalent geosynthetic
Source: Federal Remediation and Technologies Roundtable, February 12, 2003. 4.30 Landfill Cap (Soil Containment Remediation Technology).

Cap layers: Low K layer
“Composite liner”: both geomembrane and low-K soil (clay)
Low K prevents infiltration of water into waste: hydraulic barrier
Geomembrane: at least 0.5 mm (20-mil ) thick
Compacted clay: at least 60 cm with K ≤ 10-7 cm/s
Source: Federal Remediation and Technologies Roundtable, February 12, 2003. 4.30 Landfill Cap (Soil Containment Remediation Technology).
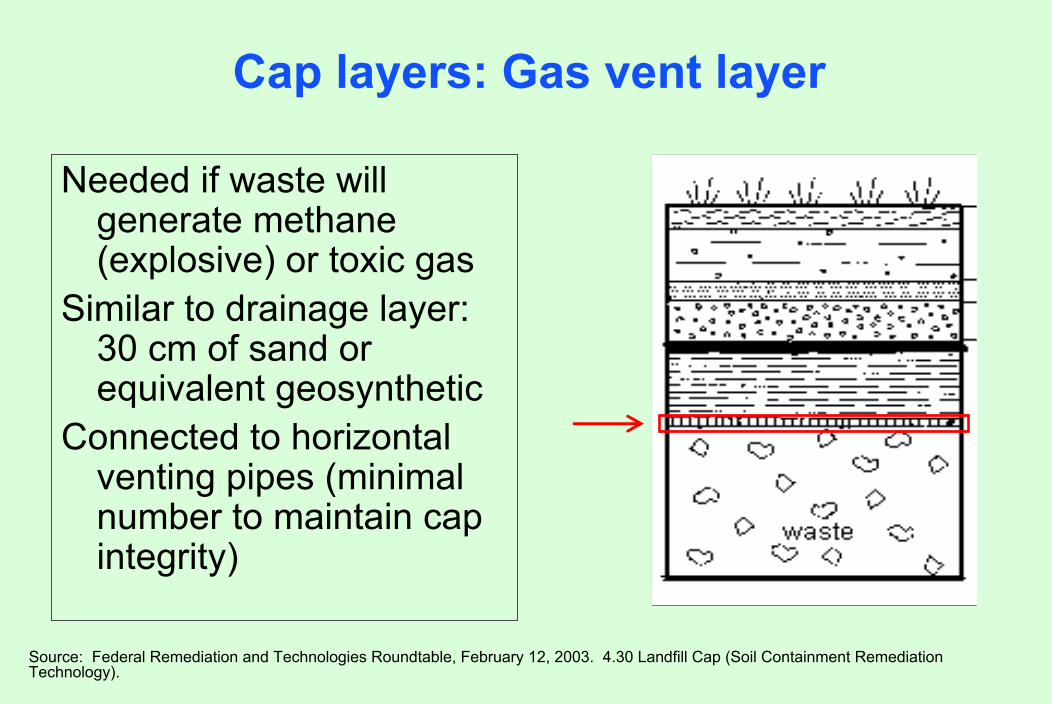
Cap layers: Gas vent layer
Needed if waste will generate methane (explosive) or toxic gas
Similar to drainage layer: 30 cm of sand or equivalent geosynthetic
Connected to horizontal venting pipes (minimal number to maintain cap integrity)
Source: Federal Remediation and Technologies Roundtable, February 12, 2003. 4.30 Landfill Cap (Soil Containment Remediation Technology).

Why a composite liner?
Geomembrane (or FML – flexible membrane liner)Impervious for practical purposes except at holes, tears, imperfectly sealed seams
With good construction QA/QC (quality assurance/ quality control), FML has one hole per acre (one hole per 0.4 hectare)

Why a composite liner?
Compacted clay linerProvides hydraulic and diffusional barrier at holes or breaks
FMLClay
Composite liner provides far more effective barrier than either FML or clay alone

What’s wrong with this picture?
FML
Clay
Drainage layer between FML and clay removes the advantage of composite liner !!!
Drainage layer

Ponded water
Clay
Flow through clay liner
If clay is saturated and water is ponded to depth h:hydraulic gradient, i, through clay is:
Kiq or,KiAQ
1D
Dhi
==
>+
= h
D
Source for this and next several slides on flow through liners: U.S. EPA, 1991. Design and Construction of RCRA/CERCLA Final Covers. Report Number EPA/625/4-91/025. U.S. Environmental Protection Agency, Cincinnati, Ohio. May 1991.
Unsaturated soil

Flow through clay liner
Liner quality K(cm/s)
Rate of flow (gal/ac/day)
Rate of flow(L/ha/day)
Poor 1 x 10⁻⁶ 1,200 11,000
Good 1 x 10⁻⁷ 120 1,100
Excellent 1 x 10⁻⁸ 12 110
Flow through 90-cm clay liner due to 30-cm head

Flow through hole in FML
Orifice equation:
( )
area holea6.0t coefficien orifice C
gh2aCQ
B
5.0B
=≈=
=
Ponded waterh
Area a
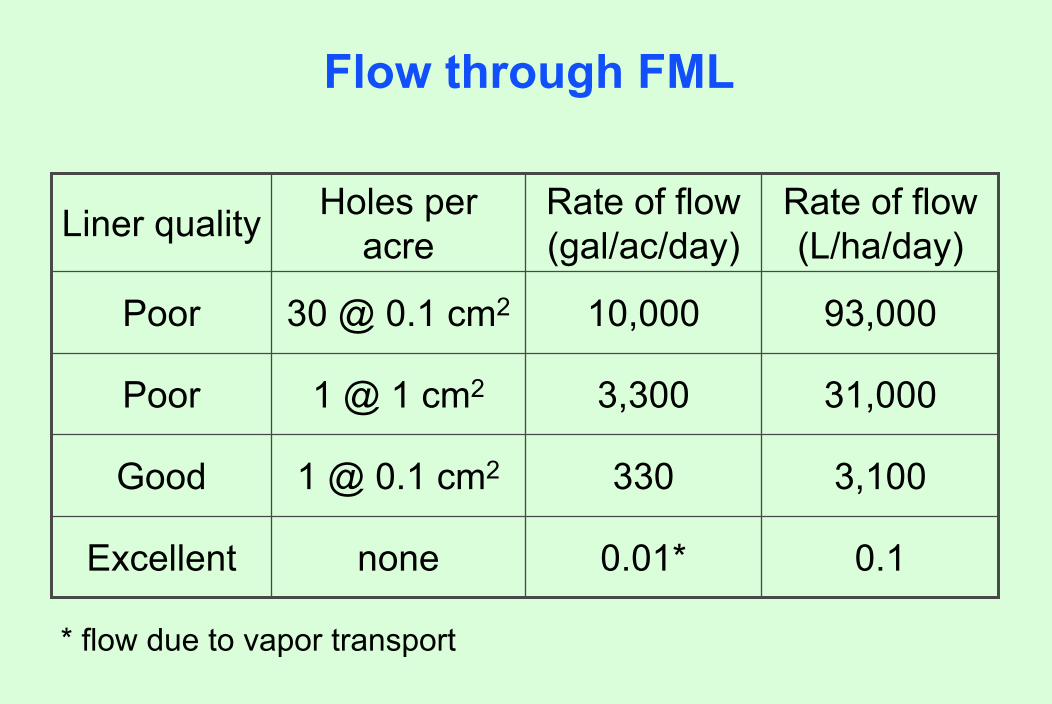
Flow through FML
Liner quality Holes per acre
Rate of flow (gal/ac/day)
Rate of flow(L/ha/day)
Poor 30 @ 0.1 cm2 10,000 93,000
Poor 1 @ 1 cm2 3,300 31,000
Good 1 @ 0.1 cm2 330 3,100
Excellent none 0.01* 0.1
* flow due to vapor transport

Ponded water
Clay
Flow through composite liner
Empirical formula byGiroud et al.:
where: C = 1.15 for poor seal between FML and clay= 0.21 for good seal
h in meters, a in m2, K in m/s, and Q in m3/sEquation assumes i = 1
74.01.09.0 KaChQ =
h
D Area a

References for liner leakage formulas:
Giroud, J. P., and R. Bonaparte, 1989. Leakage through Liners Constructed with Geomembranes--Part I. Geomembrane Liners. Geotextiles and Geomembranes. Vol. 8, No. 1, Pg. 27-67. Giroud, J. P., and R. Bonaparte, 1989. Leakage through Liners Constructed with Geomembranes--Part II. Composite Liners. Geotextiles and Geomembranes. Vol. 8, No. 2, Pg. 71-111. Giroud, J. P., and R. Bonaparte, 1989. Technical Note: Evaluation of the Rate of Leakage Through Composite Liners. Geotextiles and Geomembranes. Vol. 8, No. 4, Pg. 337-340.
See also summary in course reader:U.S. EPA, 1991. Design and Construction of RCRA/CERCLA Final Covers. Report Number EPA/625/4-91/025. U.S. Environmental Protection Agency, Cincinnati, Ohio. May 1991.

Flow through composite liner
Liner quality Holes per acre
Rate through FML liner
(gal/ac/day)
Flow through composite* (gal/ac/day)
Poor 30 @ 0.1 cm2 10,000 19
Poor 1 @ 1 cm2 3,300 0.8
Good 1 @ 0.1 cm2 330 0.6
* with 60-cm clay liner with K = 10-7 cm/sec
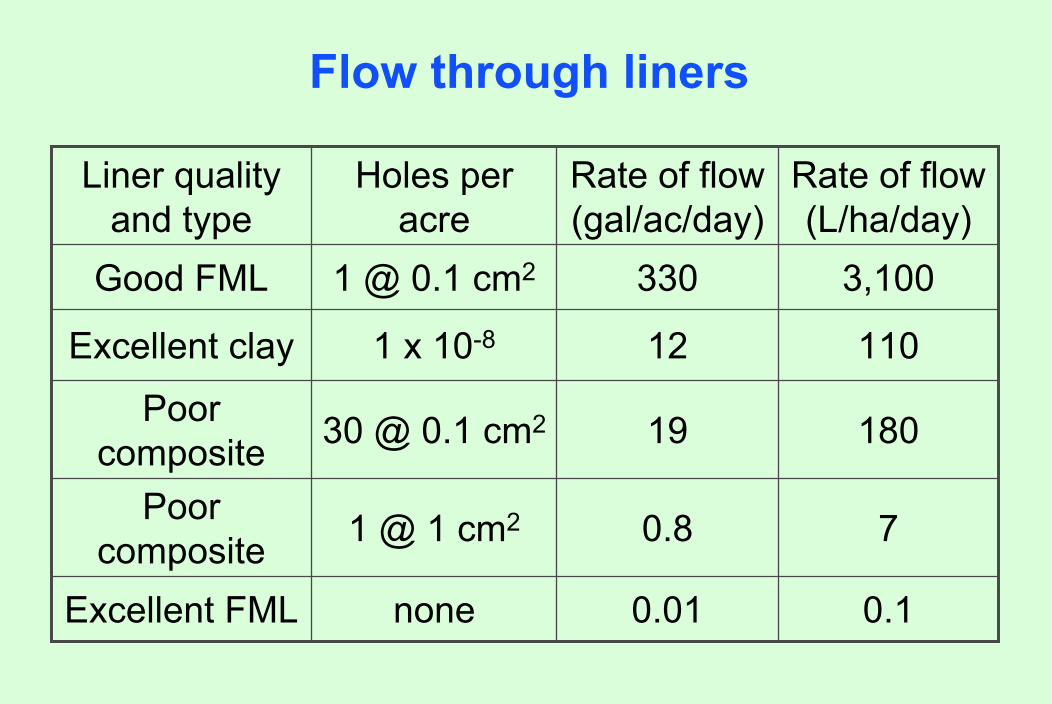
Flow through liners
Liner quality and type
Holes per acre
Rate of flow (gal/ac/day)
Rate of flow(L/ha/day)
Good FML 1 @ 0.1 cm2 330 3,100
Excellent clay 1 x 10⁻⁸ 12 110
Poor composite 30 @ 0.1 cm2 19 180
Poor composite 1 @ 1 cm2 0.8 7
Excellent FML none 0.01 0.1
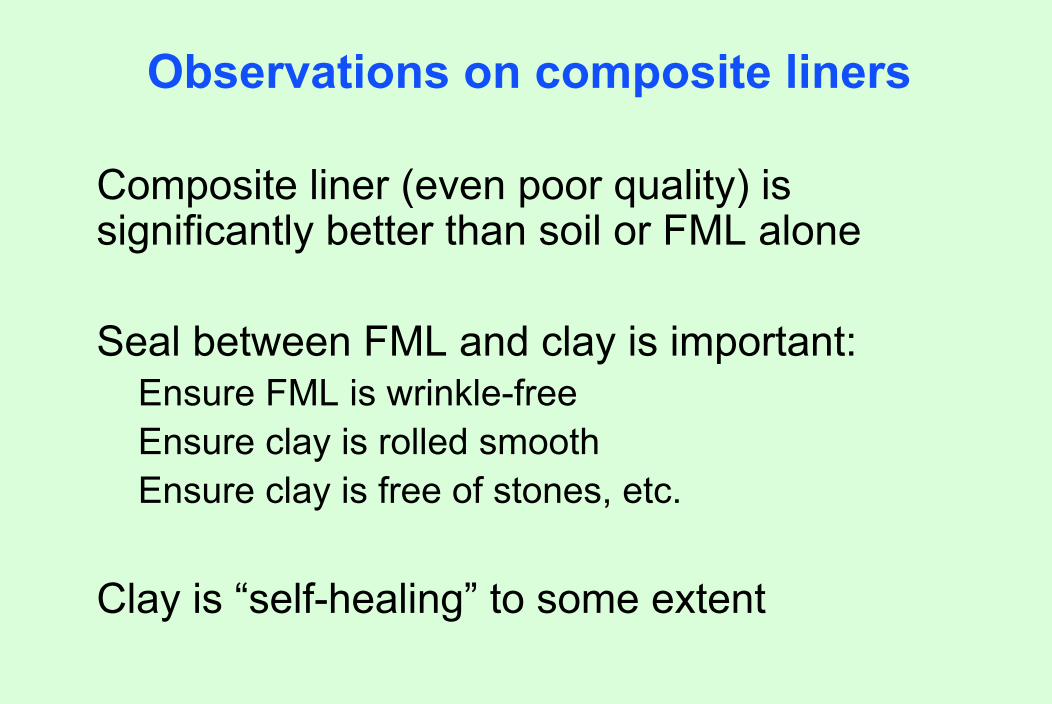
Observations on composite liners
Composite liner (even poor quality) is significantly better than soil or FML alone
Seal between FML and clay is important:Ensure FML is wrinkle-freeEnsure clay is rolled smoothEnsure clay is free of stones, etc.
Clay is “self-healing” to some extent

Capping as remedial action
Preferred remedial action for:landfills, widespread soil contaminants
Approximate costs:$175,000 per acre for non-hazardous waste$225,000 per acre for hazardous waste(per Federal Remediation Technologies Roundtable)

Geomembrane and Geosynthentic
Source: Fernald Environmental Management Project, undated. On Site Disposal Facility (OSDF), August 2002 Photo Tour. Fernald Environmental Management Project. Fernald, OH. http://www.fernald.gov/VImages/PhotoTour/2002/Aug02/pages/6319-D3684.htm. Accessed February 26, 2003.
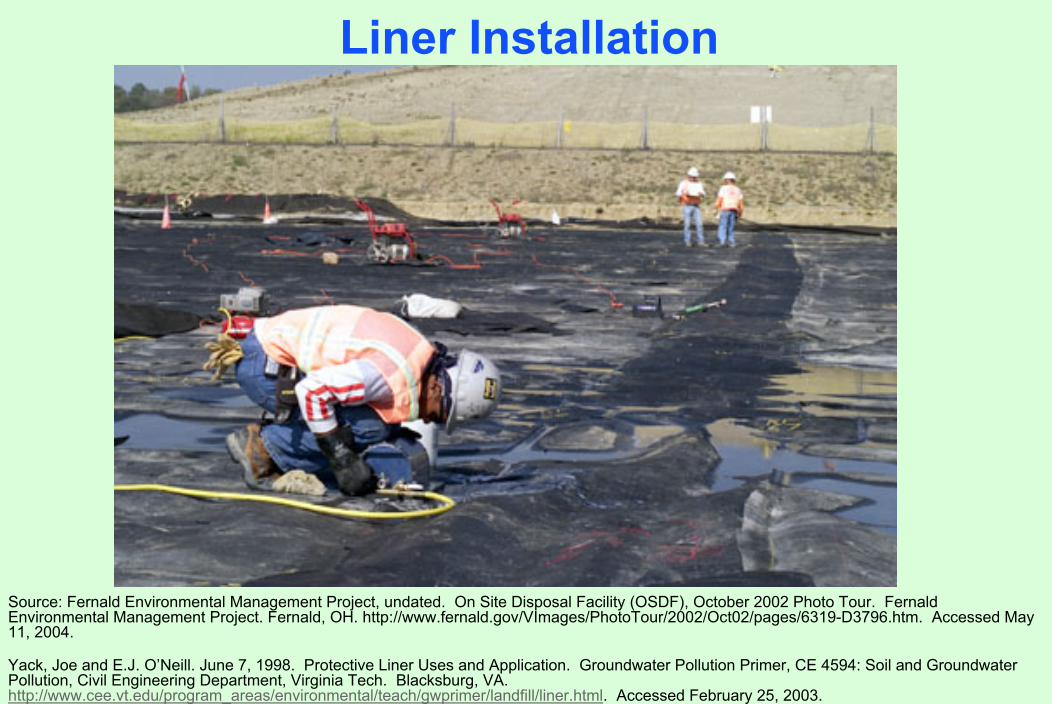
Liner Installation
Source: Fernald Environmental Management Project, undated. On Site Disposal Facility (OSDF), October 2002 Photo Tour. Fernald Environmental Management Project. Fernald, OH. http://www.fernald.gov/VImages/PhotoTour/2002/Oct02/pages/6319-D3796.htm. Accessed May 11, 2004.
Yack, Joe and E.J. O’Neill. June 7, 1998. Protective Liner Uses and Application. Groundwater Pollution Primer, CE 4594: Soil and Groundwater Pollution, Civil Engineering Department, Virginia Tech. Blacksburg, VA. http://www.cee.vt.edu/program_areas/environmental/teach/gwprimer/landfill/liner.html. Accessed February 25, 2003.

Vertical cut-off walls
Technologies include:Grout curtainsGeomembranes installed verticallyIn-situ soil mixingSheet-pile wallsSlurry walls

Slurry walls
Most common cut-off wall technologyPossible materials include:
Soil and bentonite clay (SB)Cement-bentonite (CB)Pozzolanic materials

Slurry Wall Construction
See image at the Web site of the Seattle Daily Journal, “From wood preservation to site remediation — the Cascade Pole cleanup. Environmental Outlook 2001.” http://www.djc.com/news/enviro/11123736.html.Accessed May 11, 2004.

Extended Backhoe for Slurry Walls
Source: U.S. Department of the Interior: Bureau of Reclamation, February 21, 2003. Site #8 Bradbury Dam. U.S. Department of the Interior: Bureau of Reclamation, Mid-Pacific Region. Sacramento, CA. http://www.mp.usbr.gov/mpco/showcase/bradbury.html. Accessed February 23, 2003.

Clamshell Bucket for Deep Walls
See image at the Web site of the Massachusetts Turnpike Authority, Central Artery/Tunnel Project. http://www.bigdig.com/thtml/ gw_sw.htm. Accessed May 11, 2004.

Clamshell Bucket
See image at the Web site of the Massachusetts Turnpike Authority, Central Artery/Tunnel Project. http://www.bigdig.com/thtml/gw_sw.htm. Accessed May 11, 2004.

Hydromill for Deepest Slurry Walls
See image at the Web site of the Massachusetts Turnpike Authority, Central Artery/Tunnel Project. http://www.bigdig.com/thtml/gw_sw.htm. Accessed May 11, 2004.

Slurry wall construction
G.W.L Backfill SloughsForwardBentonite Slurry
Backfill PlacedHere
Backhoe Keys Trenchinto Clay Layer
Slurry Level
Schematic of SB Slurry Wall Installation Process
Adapted from: Grubb, D. G. and N. Sitar. "Evaluation of Technologies for In-situ Cleanup of DNAPL Contaminated Sites." Report Number EPA/600/R-94/120. NTIS Number PB94-195039. R.S. Kerr Environmental Research Laboratory, U.S. Environmental
Protection Agency, Ada, Oklahoma, August 1994.

Typical vertical section for slurry wall
Confining bed or bedrock
Cap
Slurry wallkeyed into
“floor”
Waste

Alternative vertical section for “hanging” slurry wall for LNAPLS
Confining bed or bedrockat depth
LNAPL Hanging slurry wall

Alternative horizontal plans
Waste Waste
Slurry wall encirclesand isolates waste
Slurry wall delayseventual migration
Ground-waterflow

Soil mechanics of slurry wallsDuring construction, wall stability maintained by higher head in trench than in ground water:
ρwater = 1.0 g/cm3
ρslurry ≥ 1.02 g/cm3“filter cake” ontrench walls
Slurry density should be 0.25 g/cm3 lighter than emplaced backfill

Permeability of slurry walls
Source: Grubb, D. G., and N. Sitar, 1994. Evaluation of technologies for in-situ cleanup of DNAPL contaminated sites. Report Number EPA/600/R-94/120. R.S. Kerr Environmental Research Laboratory, U.S. Environmental Protection Agency, Ada, Oklahoma. August 1994.

Materials for slurry walls
SB (soil-bentonite) have lower K, are less expensiveTypical K = 10-7 cm/secReported K’s as low as 5 x 10⁻⁹ cm/sec
CB (cement-bentonite) have greater shear strength, lower compressibilityUse on slopes where strength is importantUse in areas where appropriate soils (for SB) are not
available

Materials for slurry walls
Additives to enhance CB and SB:Fly ash to increase carbon for adsorptionLiners or sheet pile installed within wall to decrease K
Other necessary material: $$$Approximate costs (from FRTR web site):$540 to $750 per m2 (1991 dollars)

Slurry wall performance
Performance has been mixed:Slurry walls leakConstruction can be difficultWaste may compromise wallRequires long-term pumping in slurry wall enclosures
Slurry walls are good barriers to advection, but not to diffusion !
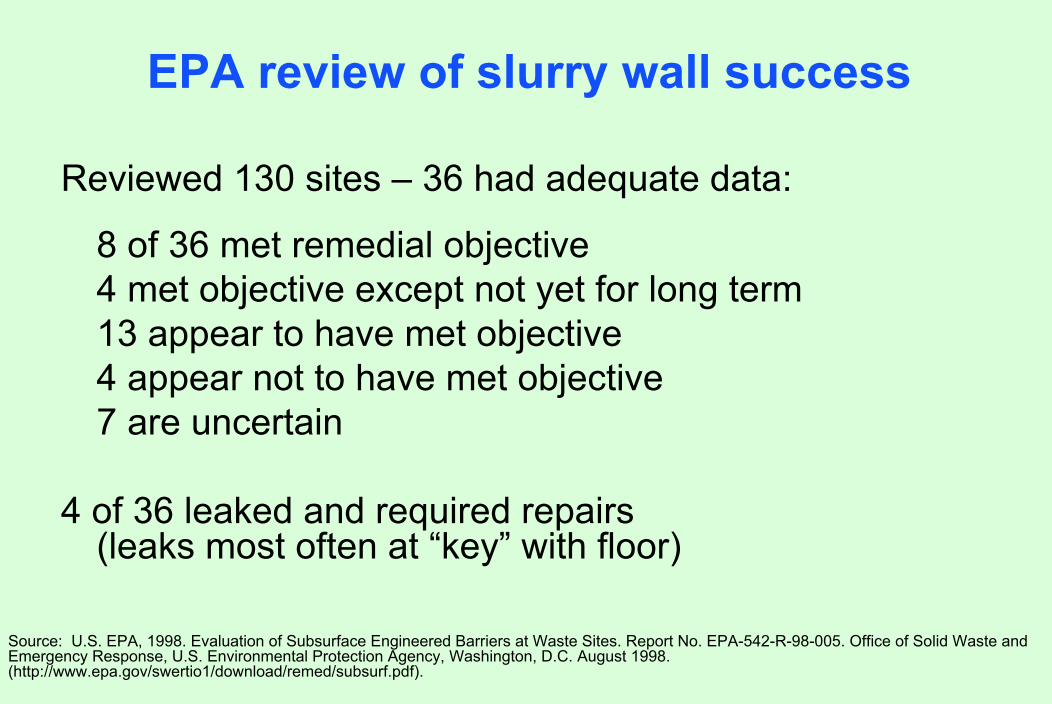
EPA review of slurry wall success
Reviewed 130 sites – 36 had adequate data:
8 of 36 met remedial objective4 met objective except not yet for long term13 appear to have met objective4 appear not to have met objective7 are uncertain
4 of 36 leaked and required repairs (leaks most often at “key” with floor)
Source: U.S. EPA, 1998. Evaluation of Subsurface Engineered Barriers at Waste Sites. Report No. EPA-542-R-98-005. Office of Solid Waste and Emergency Response, U.S. Environmental Protection Agency, Washington, D.C. August 1998. (http://www.epa.gov/swertio1/download/remed/subsurf.pdf).

Potential sources of failure (leaks)
Construction:Improperly mixed backfill (CB, SB)Sloughing or spalling of soils into trenchInadequate bottom excavation for wall key
Post-construction:Wall properties changed by freeze-thaw cyclesWet-dry cycles due to water table fluctuationDegradation due to contact with chemicals
Source: Ross, R. R., and M. S. Beljin, 1998. Evaluation of Containment Systems Using Hydraulic Head Data. Journal of Environmental Engineering, ASCE. Vol. 124, No. 6, Pg. 575. June 1998.

Interlocking Sheet Piles
See image at the Web site of Waterloo Barrier Inc., sealable joint steel sheet piling (WZ 75 profile). http://www.waterloo-barrier.com/Accessed May 11, 2004.

Sheet Pile Installation
See image at the Web site of Ontario Centre for Environmental Technology Advancement, Technology Profile Catalogue, Waterloo Barrier™ for Groundwater Containment. http://www.oceta.on.ca/profiles/wbi/barrier.htmlAccessed May 11, 2004.

Sheet Pile Grouting
See image at the Web site of Ontario Centre for Environmental Technology Advancement, Technology Profile Catalogue, Waterloo Barrier™ for Groundwater Containment. http://www.oceta.on.ca/profiles/wbi/barrier.htmlAccessed May 11, 2004.

Grout curtains
Subsurface emplacement of grout to form containment
Installation methods:Jet grouting – inject grout into soil, mixing soil and
groutPressure grouting – forces grout into fractures in rockDeep-soil mixing – grout-bentonite slurry mixed into
soils to create wall

Grouting methods

Grouting patterns
Primary and Secondary overlapping patterns for in-situ soil mixing processes[Geo-Con, Inc., 1990].
Drilling Pattern
Primary Secondary
Completed Overlapping and Complete Treatment
Adapted from: Grubb, D. G. and N. Sitar. "Evaluation of Technologies for In-Situ Cleanup of DNAPLContaminated Sites." Report Number EPA/600/R-94/120. R. S. Kerr Environmental Research Laboratory,
U.S. Environmental Protection Agency, Ada, Oklahoma, August 1994.

Grout materials
Solid suspensions:Clay, bentonite, cement, and combinations
Chemical grouts:Silica- or aluminum-based solutionsPolymers

Solidification/stabilization (S/S)
Solidification: encapsulation of waste in cement or other monolithic material
Stablization: mixing of stabilizer with waste so as to alter the chemistry of the waste and make it less toxic, less soluble, and/or less mobile(does not necessarily alter physical character of waste)
Used both in-situ and ex-situ – ex-situ is most common

S/S is second most common source-control technology at Superfund sites
Soil vapor extraction 28%
Solidification/stabilization(in-situ and ex-situ)
24%
Offsite incineration 13%
Bioremediation 11%
Thermal desorption 9%
Source: U.S. EPA, 2000. Solidification/Stabilization Use at Superfund Sites. Report No. EPA-542-R-00-010. Office of Solid Waste and Emergency Response, U.S. Environmental Protection Agency, Washington, D.C. September 2000.

Wastes treated by S/S
Metals only 56%
Organics only 6%
Metals and organics 31%
Radioactive wastes 5%
Nonmetals with and without organics
2%
Source: U.S. EPA, 2000. Solidification/Stabilization Use at Superfund Sites. Report No. EPA-542-R-00-010. Office of Solid Waste and Emergency Response, U.S. Environmental Protection Agency, Washington, D.C. September 2000. (http://www.clu-in.org/download/techdrct/tdss_sfund.pdf)

S/S agents
Organic agents:Urea formaldehyde, polyethylene, bitumen, asphalt
Inorganic agents:CementLimePozzolansProprietary mixtures and additives ($$$)
Select agents by bench-scale testing

Pozzolans
Pozzolan = alumino-silicate minerals that form cements when combined with lime and water
Reaction generates heatExamples:
Volcanic pumice (pozzolana)Kiln dustFly ash

Inorganic agents
More commonly used than organic agentsUsed on:
heavy metals, soils, sludges, radioactive wastePossible interferences from:
oil and grease, surfactants, chelating agentsNot likely to be effective with volatile organicsPCBs can be stabilized
(volatilization may be biggest removal factor)
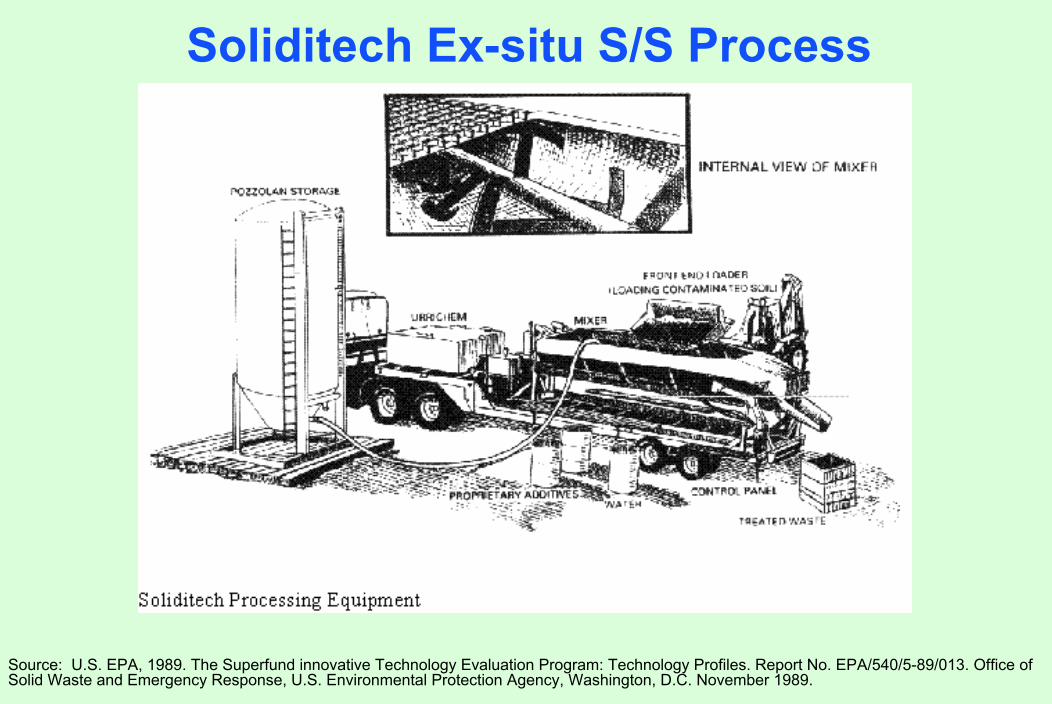
Soliditech Ex-situ S/S Process
Source: U.S. EPA, 1989. The Superfund innovative Technology Evaluation Program: Technology Profiles. Report No. EPA/540/5-89/013. Office of Solid Waste and Emergency Response, U.S. Environmental Protection Agency, Washington, D.C. November 1989.

Ex-Situ Stabilization in Pug MillScreeningsoil prior
to mixing in pug mill
Source: U.S. Environmental Protection Agency, November 14, 2001. Region 10: The Pacific Northwest, Northwest Pipe and Casing Photo Gallery. Washington D.C. http://yosemite.epa.gov/r10/cleanup.nsf/9f3c21896330b4898825687b007a0f33/3b3a728ac5f456f888256acb005f3273?OpenDocument. Accessed February 26, 2003.

Ex-Situ Stabilization in Pug Mill
See images at the Web sites of C-shops.com(http://www.roadsolutionsinc.com/photogallery.asp) and Trans World Equipment Sales, Soil Remediation Equipment (http://www.twequip.com/Equipment/soil.htm). Accessed May 11, 2004.
(1/2-left):C-shops.com, undated. Photo Gallery, Road Solutions, Inc. Indianapolis, IN. http://www.roadsolutionsinc.com/photogallery.asp. Accessed February 27, 2003. (1/2-right): Trans World Equipment Sales, February 12, 2003. Soil Remediation Equipment. Trans World Equipment Sales. Moberly, MO. http://www.twequip.com/Equipment/soil.htm. Accessed February 26, 2003.
In-situ methods
Shallow soil mixing – to about 10 meters deepCost: ~$50-80/m3 (per FRTR)Backhoes can be used for small projects, shallow soil
Deep soil mixingCost: ~$190-300/m3
Vacuum hoods may be needed to control vapor and dustVolume increase is typically about 15%

Shallow Soil MixingSee image of Lechmere Square MGP Site at the Web site of Geo-Con, Environmental Construction and Remediation, In-Situ Soil Stabilization, Shallow Soil Mixing, http://www.geocon.net/envssm4.asp. Accessed May 11, 2004.

Large Diameter Auger for Soil Mixing
See image at Web site of Cobb County Government, Little Nancy Creek Interceptor, Chattahoochee Tunnel Project, Cobb County Water System. Marietta, GA. http://www.chattahoocheetunnel.com/ln.htmAccessed May 11, 2004.

Soil Mixing Machine for Deep Soil MixingSee images at the Web site of the Department of Civil and Environmental Engineering, Virginia Tech, Center for Geotechnical Practice and Research, Deep Soil Mixing for Reinforcement & Strengthening of Soils at Port of Oakland, CA. http://cgpr.ce.vt.edu/photo_album_for_geotech/Ground%20improvement/DSM%20Port%20Oakland/DSM%20at%20Port%20-%20main.html. Accessed May 11, 2004.
Center for Geotechnical Practice and Research, February 11, 2003. Deep Soil Mixing for Reinforcement & Strengthening of Soils at Port of Oakland, CA. Center for Geotechnical Practice and Research, Geotechnical Engineering, Department of Civil and Environmental Engineering, Virginia Tech. Blacksburg, VA. http://cgpr.ce.vt.edu/photo_album_for_geotech/Ground%20improvement/DSM%20Port%20Oakland/DSM%20at%20Port%20-%20main.html. Accessed February 26, 2003.

Deep Soil Mixer
Source: Kennedy Space Center, undated. Enhanced In-Situ Zero Valent Metal Permeable Treatment Walls. Kennedy Space Center, Technology Commercialization Office. KSC, FL. http://technology.ksc.nasa.gov/WWWaccess/techreports/98report/03-ee/ee05.html. Accessed February 26, 2003.

In-situ vitrification
Formation of glass to encase waste
Rarely used – most use at radioactive waste sites
Cost at one Superfund site:$350/m3 (cost varies with cost of electricity)(Parsons Chemical/ETM Enterprises Site,
Grand Ledge, Michigan)Source: Federal Remediation and Technologies Roundtable

In-situ vitrification process
Install surface electrodesPass high electrical current through starter path of
graphite and glass fritStarter path and then soils start to melt at 1600 to
2000°CElectrodes advanced through soil as molten mass
enlargesCan melt about 1000 tons of soil per meltMelted soil hardens into monolithic, chemically inert
vitreous slag

Chemical containment
Metal containment via chemical containment with organosulfur compoundMarketed as MRC – Metals Remediation CompoundChemical first binds to metalsOrganic portion is then biodegraded leaving metal sulfide precipitate
Con
cent
ratio
n (m
g/L)
0
CopperChromium Arsenic
10 20 3005
1015202530
Adapted from: Willett, A., B. Vigue, and S. Koenigsberg. "All Locked Up." Environmental Protection 14,no. 9 (November/December 2003): 50-54.
Decreases in dissolved arsenic, chromium and copper concentrations during aquifer simulation vessel (ASV) experiments. Data are average metal concentrations over
all ports (left).
Time (days)