landgate annual report 2007 - 2008
TRANSCRIPT

LANDGATE ANNUAL REPORT2007 - 2008

2
This page intentionally left blank.

3
Landgate is the Agency responsible for Western Australia’s land and property information.
Vision
A future where the use of land information knows no bounds.
Mission
Our purpose is to provide access to land information anywhere, anytime to promote a strong and sustainable Western Australia.
Our Identity
We are a leading information provider in the knowledge economy, known for:
Integrity of our information, infrastructure, relationships and people.•
Ingenuity in unlocking the accessibility, useability and application of land information.•
Excellence in our own performance and our contribution to the outcomes of others.•
Goals
Our land information will be accessible online.•
We will provide online access to government information about rights, restrictions and interests in land.•
Our people, systems and services will be a critical link in networked government.•
Wewillbeself-sustainingandpositionedtodeliverafinancialreturntotheState.•
Throughout the journey we will excel for our customers and contribute to the community in which we live and work.•
Values
Growth and LearningExcellenceCreativityCommunityCelebrationSustainability
Outcomes
TheAgencymaintainstheState’sofficialregisteroflandownershipandsurveyinginformation,andalsomanageslandand property valuations in Western Australia. We provide: land and property information, a secure land titles system, and land valuation services.

4
Hon Brendon Grylls MLA
Minister for Regional Development; Lands; Minister Assisting the Minister for State Development; Minister Assisting the Minister for Transport
InaccordancewithSection61oftheFinancial Management Act 2006 we hereby submit for your information and presentation to Parliament, the Annual Report for the Western Australian Land Information Authority, trading as Landgate, for the year ended 30 June 2008.
The report has been prepared in accordance with the provisions of the Financial Management Act 2006.
The report is presented in four sections:
• Overviewoftheagency;
• Agencyperformance;
• Significantissuesandtrends;and
• Disclosuresandlegalcompliance.
Monty House Mike BradfordChairman Acting Chief Executive23September2008 23September2008

TABLE OF CONTENTS
1 OVERVIEW 7
1.1 Executive Summary 8
Report from Chairman 8
ChiefExecutive’sForeword 9
One Year On 10
2007/2008 Highlights 10
FinancialSummary 14
OutcomesSummary 15
1.2 Operational Structure 16
Organisational Chart 16
Legislation Administered 17
1.3 Performance Management Framework 18
OutcomeBasedManagementFramework 18
ChangestoOutcomeBasedManagementFramework 18
SharedResponsibilities 18
2.0 AGENCy PERFORMANCE 19
2.1 Operating Environment 20
2.2 Strategic Plan 21
2.3 Achievements 2007/2008 23
3.0 SIGNIFICANT ISSuES AND TRENDS 27
3.1 Outlook 28
3.2 Trends 29
3.3 Looking Forward 29
4.0 DISCLOSuRES AND LEGAL COMPLIANCE 31
Auditor General—Independent Audit Opinion 32
Certification of Financial Statements 34
4.1 Financial Statements 35
Certification of Key Performance Indicators 72
4.2 Key Performance Indicators 73
4.3 Ministerial Directives 86
4.4 Other Financial Disclosures 86
Capital Works 87
Employment and Industrial Relations 88
5

4.5 Governance Disclosures 90
4.6 Other Legal Requirements 90
Advertising 90
Disability and Inclusion Plan Outcomes 90
Equal Opportunity Outcomes 91
CompliancewithPublicSectorStandardsandEthicalCodes 92
Recordkeeping Plans 93
4.7 Information Statement 93
4.8 Government Policy Requirements 95
Corruption Prevention 95
Sustainability 95
6

SECTIONONE: OVERVIEW
1.1EXECUTIVESUMMARY
1.2OPERATIONALSTRUCTURE
1.3PERFORMANCEMANAGEMENTFRAMEWORK
7

SECTION 1 - OVERVIEW
1.1 EXECuTIVE SuMMARy
CHAIRMAN’S REPORT
Itis18monthssinceLandgatewasestablishedasastatutoryauthorityanditgivesmegreatpleasuretoreportonwhathasbeenarewardingandchallengingfirstfull-yearoftrading.LandgateisverymuchaWesternAustralianagencybutthe spatial information industry in which it operates is global and growing quickly. It is an industry that changes rapidly as technology leaps ahead.
Now,afterLandgate’sfirstfullfinancialyearhascometoaclose,Iampleasedtoreportthattheagencyhasablydemonstrated that it is a leading provider of land information and many world-class services. We have been fortunate in bringing together an inaugural Board of Management with an excellent mix of skills and competencies, who have not onlycollaboratedwellasagroup,buthaveextendedtheirindividualexpertisetospecificareasofthebusiness.Havingrecognised that Landgate has many talented and experienced staff, and an existing reputation for excellence in its core businessareas,theBoardhasaimedoverthepastyeartobuildfromthisbasetodefinetheagency’sfuturefocus.
WorkingcloselywiththeCorporateExecutive,theBoardhasrevisedLandgate’sStrategicDevelopmentPlansothatitnowincorporatesclearbusinessobjectivesandmeasures.Specificpolicieshavebeenadoptedtoguidethefinancialmanagement and investment decisions of the agency.
Greaterattentionisbeinggiventoresearchanddevelopmentandfosteringacultureofinnovation;exploringopportunitiestodevelopbusinesspartnershipsandalliances;andgeneratingmorecommercialrevenue.Landgatehasalready taken advantage of the rapidly changing technological environment to develop new and improved products and services, as well as new ways of delivering them, and will continue to build on these capabilities.
Having set the direction this year, we will work enthusiastically to achieve our longer term goals as an agency and, in so doing, to offer the best possible services and outcomes to our customers and stakeholders.
CriticaltothissuccesswillbetheongoingdedicationandcommitmentofLandgate’speople,whoarerecognisedasitsmost important asset.
Finally,IwishtothanktheChiefExecutive,theCorporateExecutiveandtheirstaff,andmyBoardmembersfortheir
great contributions to Landgate this year.
8

CHIEF EXECuTIVE’S FOREWORD
Many of Landgate’s services are world-class and the challenge is for the Agency to maintain its competitive edge in a sector where technology and applications change rapidly, and competition for skilled staff is tight.
Landgate understands the pace of life across the globe is ever increasing. The world is truly connected and more and more, people expect information services to be delivered better and faster. This constant demand also applies to the delivery of land information. At Landgate, we are committed to ‘providing access to land information anywhere, anytime’to promote a strong and sustainable Western Australia.
DuringthepastyearLandgatehasbeguntoyieldtheresultsofasignificantperiodofreformandinvestmentandIcongratulate staff on how they have helped to take the organisation to the next level. By maintaining this energetic and dynamicapproachtotheagency’scorebusinessanditsnewproductsandservices,Landgatewillbecomeanevenmore vibrant organisation than it is today.
ThismissionwassignificantlyenhancedbythelaunchoftheSharedLandInformationPlatform(SLIP)enabler.SLIPis transforming the way government cooperates in exchanging and sharing spatial information and is setting new standardsinthedeliveryofe-Government.SLIP’sinnovativetechnologyprovidesuserswiththeabilitytodiscover,viewandaccessmorethan200datasets–‘anywhere,anytime’-throughasingleon-lineenvironment.SLIPhasbecomean increasingly valuable tool for government and industry in dealing with issues such as land analysis, climate change, water management, emergency services and sustainable agriculture.
AmajorpriorityforLandgateistoexplorethepotentialofferedbySLIPtomeetthebroaderindustryandgeneralpublicneeds for spatial information.
SimilarlyadvancesinLandgate’sonlineshophaveenabledthegeneralpublictoaccessagreaterrangeofproductsonline – for example, images, titles, surveys, property reports and aerial photography.
Landgateunderstandstheneedforinnovation.Inearly2008,Landgate’sInnovationProgramwaslaunchedtocaptureand fund new ideas, build research and development capacity and support an innovation culture. The Landgate InnovationProgramisafirstforgovernmentinWesternAustralia.
Landgate’sInternationalServicescontinuedtosecurenewprojectsandprovidingconsultingservicestogovernmentsinIndonesia,Vietnam,ChinaandMauritius.InternationalServicesmaintaineditsrevenueofmorethan$1millioninthe2007/2008financialyear.
AnotherhighlightfortheyearwasthesuccessoftheWesternAustralianLandInformationSystem(WALIS)InternationalForumwhichattractedmorethan800delegatesworldwide.ThethemefortheWALISInternationalForumwas‘PublicPrivatePartnerships’.ItwastheperfectopportunityforLandgatestafftoshowcasetheirprojectsandachievementsand at the same time allowing everyone the chance to share ideas and expertise.
The year saw Landgate undertaking a comprehensive media campaign resulting in increased brand and product awarenessandacontinuousincreaseincustomersales.TheLandgateCloistersOfficewasrefurbishedtomirrortheMidlandofficefrontlinebrandingandlook.Newserviceshavebeenmadeavailable,bringingLandgatetothepublicasa one-stop-shop.
The agency recognises its people are its most important link to future success. The buoyant Western Australian labour marketcontinuestorepresentachallengeinattractingandretainingsuitablyqualifiedstaff.Landgatecontinuestoemploy innovative approaches to build its workforce that has made it an employer of choice.
Landgate’sinauguralBoard,chairedbyMrMontyHouse,hasgivensoliddirectioninprovidingtheprinciplesrequiredtodeliver the best strategy for Landgate to go forward.
9

I would like to thank the Minister for Land Information, Hon Michelle Roberts MLA for her continued support and interest.
Finally,thecommitmentandcooperationofallLandgatestaffandstakeholdershavecontributedtoanextremelypleasingfinancialyear.
OurchallengelookingaheadistofurtherpushtheboundariesofwhatispossibleforLandgateandWesternAustralia’sspatial information industry.
10

ONE yEAR ON
Landgate is integral to an industry undergoing rapid transformation due to technological developments and demand for sophisticated products and services from increasingly discerning customers. Aided by the direction of its governing body, Landgate has laid the foundations for a commercially viable future.
AclearfocusonthefutureandorganisationalflexibilityandadaptabilityisvitaltoLandgate’sfuturedirections.
LandgatecontinuestoundertaketheGovernment’slandtitling,landinformationandlandvaluationfunctions,whichare
vitaltotheState’seconomyandtheefficientoperationofthepropertymarket.
2007/2008 HIGHLIGHTSSLIP - Shared Land Information Platform
August2007markedasignificantmilestoneintherelativelyshortlifeofLandgatewiththelaunchoftheSharedLandInformationPlatform(SLIP)enablingframeworktogovernmentagencies.
SLIP’sinnovativetechnologyprovidesuserstheabilitytodiscover,viewandaccessmorethan200datasetsthroughasingleonlineenvironment.With18governmentagenciesconnected,SLIPistransformingthewaygovernmentcooperates in exchanging and sharing spatial information.
ThroughtheintroductionoftheSLIPDevelopersProgram,Landgatehassuccessfullydevelopedpartnershipswithprivate companies possessing spatial expertise. The agency is now working with a number of developers to assist end-usersinoptimisingtheiruseofSLIPEnablerservices.
Through their expertise, these developers can work with organisations to optimise products and services to meet the
needs of the Western Australian community.
Interest Enquiry
InterestEnquirywasidentifiedasoneoftheinitialfourSLIPfocusareasandfollowingapilotreleaseinDecember2007,was formally launched to all MyLandgate users in March 2008. Using the shared data capabilities delivered through the SLIPEnabler,InterestEnquiryprovidesuserswithamapviewercombinedwithaspatialsearchingcapabilitytoidentifyanddisplayinterestsrelatingtoaparticularareaofland.Aninterestisdefinedasanythingthataffectstheuseandenjoyment of land, is bound by some form of legislation, and has a recognised government agency as its custodian. Interests can also be known as rights, restrictions and obligations.
InterestEnquirywasafinalistintheInnovationcategoryattheWAInformationTechnologyandTelecommunicationsAwards in early 2008.
Landgate’s Online Shop
During 2007/2008, Landgate extended the range of products and services available to the public and account customersthroughitsLandgate’sonlineshop.
Customerscannoworder,viaLandgate’swebsite,aerialphotographyproducts,valuationandsalesreportsaswellasexistingproductssuchastitles,surveysandstrataplans.TheycanalsoaccessPropertyFinder,amapviewerapplicationtomakesearchingeveneasier.Severalfreenotificationserviceshavebeenintroducedsuchasaddressverificationandsalesalertservices.
Thishasresultedinacontinuousincreaseinsalesfromboththepublicandaccountcustomersalike.Furtherproductsare planned for release during 2008/2009.
11

Innovation Program
Recognising that innovation is a key to increasing commercial revenue, remaining competitive and sustainable, LandgatelauncheditsInnovationPrograminearly2008.AfirstforgovernmentinWesternAustralia,theProgramisbased on the research of best practice trends and information gathered from both public and private enterprises.
InitssimplestformtheProgramisthevehicletoturnourpeople’sgoodideasintocommercialpropositionsinatimelymanner and allow other ideas generated by staff to be assessed and progressed.
CORS – Continuously Operating Reference Stations
Landgateisbuildingastate-widenetworkof26continuouslyoperatingreferencestations.ThenetworkispartoftheCommonwealthGovernment’sNationalCollaborativeResearchInfrastructureStrategyforasignificantupgradetoAustralia’sgeodeticinfrastructure. Thismulti-purposeframeworkwillsupportscientificresearch,nationalandinternationalgeodesyandindustry/commercial applications.
CORSpillarshavebeenconstructedatKalgoorlieandAlbany.2008/2009willseeafurthersevensitesconstructed
includingatEsperance,BurakinandKellerberrin.
Landgate Cloisters Office
Thebeginningof2008sawthere-developmentandrenamingoftheLandgateofficeat200StGeorge’sTerrace.ThisisthesecondphaseofLandgate’sCustomerInterfaceRenewalProgramwiththenewofficemirroringtheMidlandOfficecustomer service frontline branding and look.
Thenew-lookcentralbusinesslocationisrepresentativeofthe‘new’Landgateandisinlinewithourstrategicdirection.
Therefurbishedofficewillcontinuetobethefocalpointfordocumentlodgement,receiptingandissuing.Itwillalsoprovide city customers with a one-stop-shop offering a broad range of new land and property products including sales evidence data, sales maps and off-the-shelf maps. As a result of providing a one-stop-shop at Cloisters Landgate OfficetheMountStreetpubliccounterhasbeenclosed.
Spatial Sciences Studio
InMarch2008,LandInformationMinisterMichelleRobertsopenedWesternAustralia’sneweststate-of-the-artspatialsciencesstudioatCurtinUniversity’sBentleycampus.
TheSpatialSciencesStudioisacollaborativeachievementbetweenLandgateandCurtinUniversityofTechnologyandprovides a focal point for geographic information science, surveying and cartography in WA.
Satellite Remote Sensing Services (SRSS)
Morethan500peoplelookingforanastronaut’sviewoftheworldattendedtheSatelliteRemoteSensingServices’(SRSS)annualopenday.
The day attracted everyone from school children to seniors interested in getting a behind-the-scenes glimpse into the groundbreakingworkthatSRSSdoesandhowit’sprogramsanddatahelpinallaspectsoflife–fromfightingfirestoplanting crops.
Staffspentthedaydemonstratingthe‘what,howandwhy’ofSRSSoperationsandevensetupastationtoreceivelive
data from satellites passing directly over Perth.
12

WALIS Forum
TheWALISInternationalForum2008washeldon12-14March.Morethan800participantsattendedincluding15representativesfrom10countries.Theeventalsohadarecordnumberofexhibitionbooths(36).
ThethemeforWALISInternationalForum2008was‘publicprivatepartnerships’.Itfeaturedseveralkeynotespeakerswho were able to demonstrate how this concept was applied in their respective workplaces.
AnothermajorfocuswastheSharedLandInformationPlatform(SLIP),aworld-firstpartnershipacrossgovernment,
which supported business opportunities providing ready access to land information.
Nearly 200 years of valuable land information now online
WesternAustralia’slanddevelopmentindustrynowhasonlineaccesstomorethan400,000filescontaininglandinformationdatingbacktothe1800s.
During2007/2008Landgateannouncedthatallfieldbooks,CrownPlans/diagrams,keysheetsandsurveyindexcardswerenowaccessibleonlineandwouldbeavailabletoregisteredcustomersthroughtheagency’sMyLandgatewebservice. The digitisation project involved more than 40 people throughout Australia, including Landgate staff, industry experts and consultants and took nearly two years to complete.
PreviouslysurveyorsandlanddevelopershadtovisitLandgate’sMidlandofficetoviewtheserecordsonmicrofiche.
Staff Engagement Survey
Landgatehasimplementeditsfirststaffengagementsurvey.Theresultswillbeusedtogaugethelevelofemployeemotivation and engagement and to gather feedback about key human resources programs. The results of the survey willbedisseminatedinthenextfinancalyearandinitiativestoaddresstheoutcomeswillbeincludedintheFiveYearStrategicHumanResourceManagementPlancurrentlyunderdevelopment.Landgateplanstoconductthesurveysona regular basis.
XPT Leadership Program
TheXPTLeadershipProgramisintendedforExecutiveandseniormanagers.Arangeofworkshopswereheldovertheyear,eachdesignedtoaddresskeyleadershipandmanagementskillgaps.TheXPTLeadershipProgramiscloselyaligned to support the Innovation Program and also to strengthen the strategic planning process. The workshops covered a diverse range of areas including presenting business proposals, innovation, strategic planning and strategic thinking.
Recognition of Service
InFebruary2008,LandgateinstigatedaRecognitionofServiceAwardforstaffmemberswhohaveservedtenyearsormoreattheagency.CorporateExecutivehostedtwolunchesandpresentedgiftstomorethan500employees.Therewere more then 30 people who had completed more than 40 years with the agency.
13

FINANCIAL SUMMARYOperating Result
Operatingrevenuetotalled$91.2mfortheyearended30June2008andrepresentedover79%oftotalincomewiththeremaindercomingfromStateGovernment($23.7m).Aftertakingaccountofexpensesof$113.9mtheoperatingprofitbeforeincometaxequivalentwas$1m.Thisresultwaslowerthanexpectedduetoslowingofthepropertymarketwhich had a direct impact on revenue from document lodgement and search activities.
Capital Expenditure
Capitalexpenditurefortheyearended30June2008totalled$11.2m.InvestmentcontinuedintheLandgate’se-Business initiatives and ongoing asset replacement and business infrastructure required to support both this initiative andexistingbusinessarrangements,andtoimprovethequalityoflandinformation.SignificantinvestmentincludedtheEnterpriseStorageinitiativewhichsoughttoincreasethequalityandquantityofthestoragecapacityandthesecurityofdata,ongoingreplacementofvariousinformationtechnologyassets,andtheupgradeofthePerthBusinessOffice,nowknownasLandgateCloistersOffice,toimprovethedeliveryofcustomerservices.
Financial Summary2007/2008
($’000)
6 mths ended 30/6/2007
($’000)
Income Statement
Revenue
- Operating 91,235 44,363
-StateGovernment 23,707 14,371
Total Revenue 114,942 58,734
Operating Expenditure 113,886 56,969
Operating Result 1,056 1,765
Balance Sheet
Total Assets 115,122 106,632
Total Liabilities 32,418 24,934
Total Equity (Net Assets) 82,704 81,698
14

Outcomes Summary
Quanitity MeasuresActual
2005/2006Actual
2006/2007Target
2007/2008Actual
2007/2008
Land registration actions 2,332,920 2,334,151 2,256,372 2,245,797
Land information actions 695,161 877,572 647,248 723,752
Valuations completed 1,164,481 1,552,223 1,595,655 1,631,741
WALISKeyResultAreas 6 6 6 6
unit Cost MeasuresActual
2005/2006Actual
2006/2007Target
2007/2008Actual
2007/2008
Land registration actions $25.39 $26.74 $29.03 $29.03
Land information actions $34.81 $29.05 $43.35 $36.79
Valuations completed $15.47 $12.37 $11.96 $12.40
WALISKeyResultAreas $254,167 $373,333 $294,167 $310,500
15

1.2 OPERATIONAL STRuCTuRE
TheagencycomprisessixseparatedivisionsincludingtheOfficeoftheChiefExecutive.Eachisstructuredtoberesponsible for the following functions:
Office of the Chief Executive: • TheChiefExecutivehasresponsibilityforimplementingtheagency’sstrategicdirection and for the day-to-day operational management of the agency. The division is also responsible for the International Program, and internal audit and risk management services.
Information Services:• Responsible for the creation and maintenance of registration, survey, valuation and geographic information data to ensure that government and community land information needs are met. InformationServicesensuresthatthelandinformationbaseprovidescertaintyofownershipofallinterestsinland,objectivevaluationsandqualitymapswhichsupportthestate’sadministrative,taxation,commercial,financialandsocial systems.
Information Access:• Responsibleforthedevelopment,marketinganddeliveryofLandgate’sextensiverangeofproductsandservices,distributionchannelsandSatelliteRemoteSensingServicestoensurelandinformationisaccessible to government, industry and the community. Information Access is also responsible for coordinating sharedlandinformationservicesanditsintegrationacrossgovernmentandindustrythroughSLIPandtheWesternAustralianLandInformationSystem(WALIS)Office.
Information Management: • Responsible for information management and technology through the collection, management and use of information resources. Information management is also responsible for developing and maintaining the asset infrastructure and business software used to deliver services and information to Landgate customers and stakeholders.
Strategic Planning and Development: • Responsible for strategic policy and planning, including proposals for the future of Landgate, organisational change, strategic workforce planning, business process reform, legislative review and corporate communications.
Business Services:• Responsibleforthesustainableplanningandmanagementoffinancial,workforce,legal,andinfrastructureservicessupportingLandgate’soperations.
Organisation Chart
16
BOARDOFMANAGEMENT
CHIEFEXECUTIVE
INTERNATIONAL SERVICES
INFORMATIONMANAGEMENT
INFORMATIONACCESS
INFORMATIONSERVICES
STRATEGICPLANNING &
DEVELOPMENT
BUSINESSSERVICES
AUDITANDRISKMANAGEMENT
COMMITTEE
INTERNAL AUDITANDRISKMANAGEMENT

LEGISLATION ADMINISTERED
LandgateisresponsiblefortheadministrationofanumberofActsofParliamentrelatingtoland.However,theStateAdministrative Tribunal deals with dispute resolution under the Strata Titles Act 1985 and the Valuation of Land Act 1978.
Thoseactsmostdirectlyaffectingtheagency’sdailybusinessactivitiesare:
Land Information Authority Act 2006 -establishesaStateagencytoadministerlandinformationandprovideandpromote the use of land information and related goods and services.
Transfer of Land Act 1893–establishestheTorrensSystemofregisteringfreeholdtenure,transactionsandinterestsover land.
Valuation of Land Act 1978–providesforthevaluationofpropertyforallratingandtaxingpurposeswithintheStateand to undertake other valuation consultancy for Government.
Strata Titles Act 1985 – facilitates the subdivision of land into spaces for residental and other uses and for the management of strata schemes.
Registration of Deeds Act 1856 – outlines a system of registering conveyances, wills and other deeds affecting land for whichnoCertificateofTitlehasbeenissued.
Licensed Surveyors Act 1909 – outlines the rules and guidelines for the conduct of authorised surveys.
Standard Survey Marks Act 1924 – outlines the rules and guidelines for the provision of survey marks.
17

1.3 PERFORMANCE MANAGEMENT FRAMEWORKOUTCOME BASED MANAGEMENT FRAMEWORK
Landgate’sstrategicdirectionsandbusinessprioritiesreflectitscommitmenttotheStateGovernment’s“Better Planning: Better Futures – A Framework for the Strategic Management of the Western Australian Public Sector”, a blueprint for creating a better future for all Western Australians.
Landgate directly contributes to the above framework by providing secure titling and valuation systems that underpin landandpropertymarkets,aswellasthestate’sratingandtaxingbase.OurleadroleinopeningupaccesstogovernmentdataandcontributingtothenationalCooperativeResearchCentreforSpatialInformationsupportsgrowthin small to medium-sized enterprises in the spatial information industry. This is estimated to be growing worldwide at 27 per cent per annum. Graduate and cadetship programs and a partnership with Curtin University provide improved job opportunities and career paths for young people – particularly in spatial sciences.
In addition, Landgate helps to create sustainable communities by providing government, business and the general public with reliable and independent information needed to make important decisions – such as where to build new infrastructure,plantcropsorbuyhomes.Landgate’sapplicationofsatellitetechnologyisassistingthoselivinginrural and isolated areas to become better informed about climatic and geographic indicators that impact upon their communities, environment and livelihoods.
LandgateisavitalcontributortotheGovernment’sstatedgoalsandplannedoutcomesinmanywaysthatarecoveredin the Agency Performance section and the Disclosures and Legal Compliance sections of this annual report.
CHANGES TO OUTCOME BASED MANAGEMENT FRAMEWORK
There have been no changes to the agency level desired outcomes, services and key performance indicators from the previous reporting year.
SHARED RESPONSIBILITIES
Landgate is solely responsible for the delivery of its desired outcomes and services. While Landgate does not jointly contributetothedeliveryofotheragencies’desiredoutcomesandservices,ithasbeenintegralinthedevelopmentandimplementationoftheonlineSharedLandInformationPlatform(SLIP).SLIPisacross-agencyinitiativedeliveringreal-time access to spatial information across all levels of government, business and community.
18

SECTIONTWO: AGENCYPERFORMANCE
2.1OPERATINGENVIRONMENT
2.2STRATEGICPLANNING
2.3ACHIEVEMENTS
19

SECTION 2
AGENCy PERFORMANCETherearefewaspectsofmodernlifethatdon’tdependinsomewayonlocation-basedinformation–knowingwherethings are and how they relate to each other. With functions spanning land titling, valuation, surveying, mapping and imagery, Landgate is uniquely positioned to deliver land information that supports planning and decision-making across the public and private sectors.
At Landgate we understand that in an increasingly knowledge-based economy our customers depend upon access to accurate, timely land information.
These customers include:
thegeneralpublic;•businessandindustries;•propertyindustry(developers,advisors,accountants,settlementagents,valuers,lawyersandfinancialinvestors);•researchandeducationalinstitutions;•aidagenciesandoverseasgovernments;and•State,LocalandFederalGovernment. •
2.1 OPERATING ENVIRONMENTLandgateplaysanintrinsicroleinsupportingtheeconomicdevelopmentoftheStatethroughthedeliveryoflandinformation products and services. Through both its regulated and commercial functions, Landgate continues to actively contribute toward the economic and environmental sustainability of the Western Australian land information portfolio. Aspreviouslyprojectedintheagency’sStatementofCorporateIntent,andinlinewithcontinuedstronggrowthintheWesternAustralianeconomy,Landgateexperiencedhighongoingdemandforitscoreservicesthroughout2007/2008;which included document lodgement, titles registration, valuation, land boundary and geographic services. WhiletheboomingAustralianeconomymighthavewanedincertainsectors,theconfidenceofconsumersentimentinWestern Australia remains reasonably buoyant. Landgate experienced some slowdown in land titles-related activities towards the latter part of 2007/2008. Customer satisfaction with Landgate throughout the 2007/2008 period has remained high. With the convergence of technological products and services, land information will play an integral role in the developmentoftheState.Thefuturepromisesmanynewuses,marketsandindustriesforlandinformationandLandgate is uniquely positioned as a commercial statutory authority to help government and industry optimise the opportunities for Western Australia.
20

2.2 STRATEGIC PLANNINGAidedbydirectionfromLandgate’sgoverningBoard,theagency’sfirstfullfinancialyearasacommercialstatutoryauthority has been characterised by a further maturation of commercial operations and business strategy. A greater focushasbeenplacedoninnovation,alliancesandpartnershipsandmarketdrivenproductsandservicesinLandgate’sstrategic planning.
Vision and Purpose
Landgate’svisionistocreate a future where the use of land information knows no bounds.Thisreflectsourbeliefinthesignificanceoflandinformationtothegrowinginformationeconomy–inparticularspatialinformationwhichisincreasingly being used in business and everyday decision making.
Ourpurposeistomakevitalinformationmoreaccessible,tomorepeople,moreofthetime.ThisisreflectedinLandgate’smissionstatement–to provide access to land information anywhere, anytime to promote a strong and sustainable Western Australia.
Strategic Objectives
Landgate’shigh-levelobjectivesreflectwhereweareheadingandwhatwewanttoachieve.Thesearesupportedbyspecificbusinessandoperatingplans.
Land information will be accessible online.•Our people, systems and services will be a critical link in networked government.•Wewillbeself-sustainingandpositionedtodeliverafinancialreturntotheState.•Throughout the journey we will excel for our customers and contribute to the community in which we live and work.•
21

Strategic Development Plan and Statement of Corporate Intent
LandgateoperatesinaccordwithaStrategicDevelopmentPlan(five-yearbusinessplan)andStatementofCorporateIntent(annualoperatingplan)asagreedeachyearbetweenitsBoardandtheMinisterforLandInformation.
The plans are required under the Land Information Authority Act 2006andsetoutLandgate’sstrategicobjectives,proposedachievements,financialrequirementsandbusinessstrategy.
TheStrategicDevelopmentPlanandStatementofCorporateIntentalsoprovidethefoundationformorespecificplanningandreporting(forexample,theCapitalInvestmentPlanandtheCorporateBalancedScorecard).The
relationshipbetweentheStateStrategicPlanningFrameworkandLandgate’sstrategicplanningisoutlinedbelow.
LEGISLATIONANDGOVERNMENTPOLICYLand Information Authority Act 2006•
5+YearsSTATESTRATEGICPLANNINGFRAMEWORK:“BETTERPLANNING:BETTERFUTURES”
Whole-of-government vision and goals •for WA
5Years STRATEGICDEVELOPMENTPLAN(SDP)
Fiveyearstrategicbusinessplan,•business directions and commercial priorities Keystakeholders:Minister,Treasurer•
SupportingPlans,eg:Marketing Development Plan•SkillsAcquisitionPlan•Capital Investment Plan•
1Year STATEMENTOFCORPORATEINTENT(SCI)
Annual business and operating Plan•UnderpinnedbySDP,capitalinvestment•plan and BudgetKeystakeholders:governmentandstaff•
1YearBALANCEDSCORECARD
Setsoutannualtargetsandkey•performance indicatorsUnderpinnedbySCI•Links to internal performance •management system
22
STR
ATEGIC
OP
ER
ATIO
NA
L

2.3 ACHIEVEMENTS 2007/2008Initsfirstfullfinancialyearasastatutoryauthority,Landgatecontinuedtoenhanceitsservicestothecommunitywhilelaying the groundwork for the expansion of commercial opportunities and further investment in the business. The range of products and services available online was extended and a groundbreaking new service was launched allowing accesstolandinformationheldbyanumberofgovernmentauthoritiesthroughasingleonlineinquiry(SLIP).Thelaunchoftheagency’sInnovationProgramwasespeciallysignificantinsignallingLandgate’sintentiontomaintainitsleadership role in the development of new land information products and services.
Theagency’songoingcontributiontotheachievementofthefiveGoalsforGovernmentisprovidedbelow.
Better Services Improving Online Services
Landgate’sonlineshopwasfirstlaunchedtothegeneralpublicinFebruary2007initiallyprovidingeasyonlineaccessto purchase titles, surveys, property reports and maps. Throughout 2007/2008, Landgate launched an additional 32 new products and services including a series of maps and aerial photography products, property sales and valuation reports,addressverificationandsalesalertservices.Landgate’sonlineshopalsolaunchedPropertyFinder,amapviewer application to make searching even easier.
2007/2008sawanexcellenttake-upofLandgate’sonlineshopproductsandserviceswithbothsalesandcustomergrowthexceedingannualtargets.Furtherproductsareplannedtobereleasedthroughout2008/2009.
SLIP
SharedLandInformationPlatform(SLIP)EnablerwaslaunchedtogovernmentinAugust2007.SLIP’sinnovativetechnology provides users the ability to discover, view and access over 200 datasets through a single online environment.With18governmentagenciesconnected,SLIPistransformingthewaygovernmentcooperatesinexchanging and sharing spatial information.
ThroughtheintroductionoftheSLIPDevelopersProgram,Landgateisalsoseekingtodeveloppartnershipswithcompanies possessing spatial expertise and is working with a number of developers to assist end-users in optimising theiruseofSLIPEnablerservices.ThesedevelopershaveexpertiseinthecreationofapplicationsthatuseSLIPEnabler services. They can work with organisations to optimise products and services to meet the needs of the Western Australian community.
Landgate Cloisters Office
Thebeginningof2008sawthere-developmentoftheLandgateCloistersOfficeat200StGeorge’sTerrace.Therefurbishedofficewillcontinuetobethefocalpointfordocumentacceptanceandissuing.Newservicesarealsoavailable including sales evidence data and sales maps, off-the-shelf maps and current tenure products. The Mount Streetpubliccounterhasnowclosed,bringingLandgatetothepublicasaone-stop-shopatbothLandgateCloistersand Midland.
Name Suppression Project
In providing public access to land information Landgate is aware of the need to protect people at risk of harm.
In response to community expectations regarding the need to limit access to personal details, Landgate is developing legislation to enable names to be suppressed from land title searching indexes and data extracts where a proprietor, or ownerofotherinterest,isdeemed‘atrisk’.Inthemeantime,suppressionofnameswillbeappliedadministrativelyuntilthelegislationisinplace.ThishasinvolvedsignificantinvestmentintherevisionofLandgate’ssystemsandprocesses.
Landgate believes that the above arrangements balance the need to provide additional protection to vulnerable persons while,atthesametime,providelandinformationtomeetavarietyofcommunityneeds,includingtheefficientrunningof land property markets and associated industries.
23

Jobs and Economic DevelopmentTransactions
OverthecourseofthefinancialyearLandgatepropertydocumentlodgementsslowlydecreased.However,Landgatestillprocessedatotalof388,741documentsrelatingtothebuyingandsellingofproperty.
Atotalof$69.3billionofmortgagesweresecuredbytheregistrationsystem;a10.5%increaseonthepreviousyear’sfigureof$62.7billion.Landtransferstotalled87,566.Thetotalvalueoflandtransferswas$44.7billion.
During2007/2008,stratalotactivityinWesternAustraliasawyetanotherrecordyear.Atotalof11,559stratalotswerecreated,nearly15%higherthanlastyear’stotalof10,076.Landgateisleadingthewayintraininginrelationtostratatitles, including support of local universities in providing lectures on the subject. The second half of the 2007/2008 financialyearalsosawanincreasedfocusonthedevelopmentofexternaltrainingpackagesforindustry.
Innovation
Earlyin2008,membersoftheBoardandCorporateExecutivejoinedwithspecialguest,WesternAustralia’sChiefScientistProfessorLynBeazley,tocelebratethelaunchofLandgate’sInnovationProgram.
The Program has been developed to capture and fund new ideas, research and develop capacity and support an innovativeculturethroughoutLandgate–afirstforanyStateGovernmentagency.ThemainpurposeoftheProgramistomaketheterm‘innovation’morethanjusta‘buzz’wordbytransforminggreatideasintoimprovedwaysofdoingbusiness.Onceideasaregiventhegreenlight,theyarefurtherdevelopedwiththeaimofaddingsignificantvaluetoLandgate.ItisanticipatedthatLandgatewillinvest$2millionintotheprograminthe2008/2009financalyear.
Exploring New Markets
Landgate’sMarketDevelopmentBranchhasbeenfocussingonthegeneralpublicthroughout2007/2008.Landgatehasalsofocusedonincreasingitspenetrationintoprofessionalmarkets,particularlyaccountants,financialplannersandland development. This focus will continue throughout 2008/2009.
Lifestyle and EnvironmentTsunami Warning System
LandgatehascontributedinformationtoassisttheAustralianTsunamiWarningSystembysupplyingaerialphotographyand digital elevation model data to the Australian Government to conduct impact modelling over several coastal areas in the north-west of Western Australia.
International Services and Indonesia
LandgateInternationalServicesdeliveredtheAusAIDfunded“MonitoringandManagingWildFiresinIndonesia–Phase2”project,whichfurtherpromotedLandgate’sFireWatchapplicationinIndonesia.TheFireWatchIndonesia(FWI)project,worthmorethan$1.5millionwassecuredandstartedinJune2008.TheprojectwillseeLandgatebuildandinstallasustainablefiredetectionandmonitoringsystemforIndonesia.
Topographic Data Revision
Landgate maintains a large-scale topographic dataset. It is detailed, accurate and suitable for planners and local government to undertake broad planning initiatives. Previously, the dataset was maintained on a cyclic sheet-by-sheet basis. In 2007/2008 Landgate commenced a targeted spot revision model which has allowed the overall currency of the datasettobesignificantlyimproved.TheprocessinvolvesthetargetingofurbanfringedevelopmentandinfrastructurechangessuchasthePerth-MandurahRailwayaswellaswidelydistributedlocalisedchangeslikeurbaninfill.
24

Road Centrelines
WesternAustralia’sroadnetworkisrepresentedasadigitaldatasetofroadcentrelineswithinformationattributesabout each highway and road. A project completed in June 2008 with input from the Department of Environment andConservation,Fire&EmergencyServicesAuthorityandWesternAustralianPolicehasincludedthebestoverallinformationintoamodernGeographicInformationSystem.Theprojecthassignificantlyupgradedpositionalaccuracyand improved data currency.
Digital Aerial Photography
During2007/2008,LandgatejoinedwithaconsortiumofStateagenciesandtheCSIROtoacquirehighresolutiondigitalaerial photography over the Perth metropolitan region. Building on a benchmark acquisition in the low-rainfall year of 2007, this image base provides an ongoing monitoring of the condition of the urban environment. Unlike conventional film-basedphotography,thisdigitalcaptureincludesamulti-spectralcomponentwhichisbettersuitedforbroader data analysis.
Landgate’s contribution to community
In2007/2008,Landgateraisednearly$13,000foravarietyoflocalcharitieschosenbystaff.Themoneywasraisedbypeopleparticipatinginlocaleventssuchas‘CasualDressFridays’wherebystaffcontributeagoldcoininexchangeforinformal attire.
The2007/2008financialyearsawthecontinuationofLandgate’sSchool,CommunityandIndustryLinkProgramincollaborationwiththeSwanDistrictEducationOffice.TheProgramcoversareadingVolunteerProgram,aGPSincursion model and interactive agency tours of Landgate.
Recycling
LandgatehasinitiatedaSustainabilityActionPlanrecommendationandcommencedtherecyclingofaluminium,plasticandcardboard.SecurepapershreddingcontinuesandasofMarch2008,Landgatehadrecycled35,000kgsofpaper.
Energy Smart Government Program
LandgatehaswontheSEDO-EnergySmartEnergyChampionAwardfrom2002to2007.LandgatecontinuestoachieveenergysavingsabovetheEnergySmarttargetof12%perannum.
Water
Landgate continues to improve on its use of water. This year Landgate installed waterless urinals which has resulted in watersavingsof850,000litres.
Regional DevelopmentProperty Data Verification Project
Inadditiontotheverificationactivitiesassociatedwiththegeneralvaluationprogram,thestructureddataqualityimprovementprojectwhichcommencedin2005/2006continuedthroughout2007/2008.Thequalityofpropertydatais fundamental to the integrity of gross rental values and sales information used for analysis and investment decisions. This project focussed on improving the accuracy of property records primarily in the Perth metropolitan area. It trialled newmethodsofcollecting,identifying,analysingchangesinpropertyclassificationandresultedinseveralchangestowork practices. In agricultural areas, the primary focus was to accurately identify areas of remnant vegetation.
25

Recognition of Indigenous Names
The Geographic Names Committee is appointed by the Minister for Land Information to provide advice on the naming of town sites, suburbs, localities, roads and other features. In 2007/2008 consultation in the Pilbara with local Indigenous people and the support of the Gobawarrah Minduarra Yinhawanga Aboriginal Corporation resulted in recognition of three new names, Goondoowandoo Range, Bibi Thaloo HillandGurinbiddyRange,andalsothedualnameMtElla/Gujuwanna.IntheKimberleythedualnameWeaberRange/Jemandi Winingim has also now been adopted. The Committee expects the recognition of traditional names, not previously shown on maps, will encourage more IndigenouscommunitiestoseekgreaterrecognitionofIndigenousnames,particularlyinthePerthandSouth-Westregions.
Continuously Operating Reference Stations (CORS)
LandgateispartneringwiththeCommonwealthGovernment’sNationalCollaborativeResearchInfrastructureStrategytoimplementaCORS(continuouslyoperatingreferencestation)networkinWA.The26stationswillrepresentnewinfrastructure using the latest global navigation satellite systems to generate open, high-accuracy and real-time data about position.
The network will simplify the process of collecting quality spatial data and allow greater sharing of data – with a key outcomeofsupportingindustryandresearchneeds.DatafromCORSisusedinsurveying,mapping,navigation,engineeringandscientificresearchandmonitoring.Italsohasdownstreamapplicationssuchasprecisioncontrolofearth-moving and agricultural machinery.
Governance and Public Sector ImprovementXPT Leadership Program
TheXPTLeadershipProgram,forExecutiveandseniormanagers,heldarangeofworkshopsduringthelasttwelvemonths,eachdesignedtoaddresskeyleadershipandmanagementskillgaps.TheXPTLeadershipProgramwasclosely aligned to support the Innovation Program and also strengthen the strategic planning process in line with the additional requirements as a statutory authority. Workshops have covered a diverse range of areas including presenting business proposals, innovation, strategic planning and strategic thinking.
National Electronic Conveyancing System (NECS)
TheNationalElectronicConveyancingSystem(NECS)isaninitiativeofStatesandTerritorieswhichprovidesauniqueopportunity to develop a uniform approach to electronic conveyancing across Australia.
NECSwillultimatelyprovideasimple,automatedsystemfortheelectroniclodgementofregistrationdocuments.Currently only hard-copy documents can be lodged which are then processed by Landgate staff.
Landgate has been actively engaged in reviewing and contributing to national documentation on the business model, operations,governanceandimplementationarrangementsforNECS.
26

SECTIONTHREE: SIGNIFICANTISSUESANDTRENDS
3.1OUTLOOK
3.2TRENDS
3.3LOOKINGFORWARD
27

SECTION 3
SIGNIFICANT ISSUES AND TRENDS
3.1 OutlookLandgate is very much a Western Australian agency but the spatial information industry in which it operates is global and growing quickly. It is an industry that changes rapidly as technology leaps ahead. There is constant demand for better and faster information to help governments tackle complex problems or give businesses a competitive edge.
Landgate’scommercialrevenueisexpectedtogrowconsiderablyastheagencycapitalisesonweb-baseddeliverychannelsandonlineproductsandserviceslaunchedintheprevious12to18months.
The agency will focus on the growth of markets, customers and applications for these channels, products and services in 2008/2009.
The 2008/2009 year offers some exciting opportunities and challenges in terms of:
Continuingtoyieldtheresultsofasignificantperiodofreformandinvestment,whilelayingthefoundationsfor•future growth in the next decade.
Maintainingtheagency’scompetitiveedgeinasectorwheretechnologyandapplicationschangerapidly,and•competitionforskilledstaffistight;and
Investingsignificantlyintechnologyandcontinuingtodeliverworld-classservicesinLandgate’scorebusiness•of land titling, land valuation, surveying, mapping and other geographic information, and investing further in data capture and improvement.
SomeofLandgate’smajoractivitiesin2008/2009willinclude:
FurtherharnessingthepoweranduseoftheSharedLandInformationPlatform(SLIP),byexploringthepotentialto•meetindustryandpublicneedsfor‘joined-up’spatialinformation;andworkingwithotheragenciestoexpandtheInterest Enquiry function. The next interest types to be delivered are land tax, rates, zoning, municipal heritage and a range of title and encumbrance details.
Reviewing and contributing to national documentation in regards to establishing a National Electronic •ConveyancingSystem(NECS),anationalfacilitythatwillprovideasimple,automatedsystemfortheelectroniclodgement of registration documents.
FullyimplementingourInnovationProgram,thatcommencedin2007/2008.TheProgramwillconcentrateon•developing new markets, products and services.
IlandisafarreachinginitiativetofundamentallychangeLandgate’slandinformationsystemsworkpractices.To•generategreateroperationalefficiencyandlong-termbenefitsforcustomers.Progressingtheimplementationof
theiLandstrategybycompletingthefirstphaseoftheiLandprogramin2008/2009.
ExpandingLandgate’sonlineshoptoincludethedevelopmentofweb-enableddeliveryandbusinesssolutions.•
Establishing and building strategic alliances with the spatial information industry, commercial sector and research •institutions.
Continuing to expand our relationships with regional foreign governments through our International Program.•
Improving valuation processes by completing the development of a mobile valuation and mapping tool for use by •valuersandtechnicalstaffinthefield.
28

3.2 TRENDSLandgate is working in one of the most dynamic environments in the global economy and if current trends continue, there will be both exciting challenges and opportunities ahead.
While the Western Australia economy remains buoyant, property market growth has slowed. However, Landgate has factored this trend into its Capital Works Program and Innovation Program to offset the impact and develop products and markets to grow accordingly. SpatialinformationisbecomingpartofgenerallifeandbusinessintelligenceandLandgatetechnologyandexpertisehas local and international market value.
Increasing climatic change and the requirement for global monitoring of the environment provides Landgate opportunities in continuously monitoring agricultural, water and mineral resources for individuals, governments and business.
In a world where online service delivery is the norm and convergence of technologies is increasing, Landgate is poised to respond to these demands and opportunities.
3.3 LOOKING FORWARDLandgateisWesternAustralia’sprimaryandauthoritativesourceoflandinformationandisuniquelypositionedforfuture growth within Australia and internationally. To maintain this position, Landgate will continue to increase its investment in innovation and research and development with its Innovation Program to capture new ideas and realise new business opportunities.
To meet the increasing needs of its customers for better, faster and more integrated land information, Landgate is investingsignificantlyintechnologytodelivertheworld’sbestpracticelandregistration,valuationandgeographicinformation services and to support the development of new commercial products and services.
ThesuccessofSLIPasacatalystforsharinginformationhassponsoreddiscussiononthepotentialtoexpandthefourcurrentSLIPfocusareasofEmergencyManagement,NaturalResourceManagement,LandDevelopmentProcessandInterestInquirytoincludeaMarineFocusArea.Thisistimelywiththeattentioncurrentlygiventorisingsealevels,storm surge, tsunami and coastal vulnerability.
In the emerging national carbon market, the opportunity exists for Landgate to position itself as a leading provider of carbon accounting services. The agency is seeking to capitalise on its expertise in spatial information, remote sensing and registration services by delivering services that will contribute to the national carbon accounting framework.
Landgate is also seeking to build stronger relationships with research institutions and the private sector to develop further uses for land information. These initiatives will assist Landgate to develop new markets, expand existing markets and deliver new products and services – directly and via partners.
The coming period will be characterised by a continued highly competitive labour market and strong economic conditionsinWesternAustraliacontinuingtomakerecruitingandretainingsuitablyqualifiedandskilledstaffachallenge. Landgate is responding to this challenge by implementing innovation, knowledge and professional development programs to reduce the impact of the skills shortage and to ensure that staff skills remain at the forefront of technology and industry developments.
Landgate will continue to work closely with industry stakeholders and Land Registries across Australia to ensure the deliveryofaNationalElectronicConveyancingSystem(NECS).Thissystemwillgenerategreateroperationalefficiencyandlong-termbenefitsforcustomers.
29

30
This page intentionally left blank.

SECTIONFOUR: DISCLOSURESANDLEGALCOMPLIANCE
4.1FINANCIALSTATEMENTS
4.2KEYPERFORMANCEINDICATORS
4.3MINISTERIALDIRECTIVES
4.4OTHERFINANCIALDISCLOSURES
4.5GOVERNANCEDISCLOSURES
4.6OTHERLEGALREqUIREMENTS
4.7INFORMATIONSTATEMENT
4.8GOVERNMENTPOLICYREqUIREMENTS
31

32
INDEPENDENT AuDIT OPINION
To the Parliament of Western Australia
WESTERN AuSTRALIAN LAND INFORMATION AuTHORITy FINANCIAL STATEMENTS AND
KEY PERFORMANCE INDICATORS FOR THE YEAR ENDED 30 JUNE 2008
Ihaveauditedtheaccounts,financialstatements,controlsandkeyperformanceindicatorsoftheWesternAustralianLand Information Authority.
ThefinancialstatementscomprisetheBalanceSheetasat30June2008,andtheIncomeStatement,StatementofChangesinEquityandCashFlowStatementfortheyearendedonthatdate,asummaryofsignificantaccountingpolicies and other explanatory Notes.
Thekeyperformanceindicatorsconsistofkeyindicatorsofeffectivenessandefficiency.
Board’s Responsibility for the Financial Statements and Key Performance IndicatorsTheBoardisresponsibleforkeepingproperaccounts,andthepreparationandfairpresentationofthefinancialstatementsinaccordancewithAustralianAccountingStandards(includingtheAustralianAccountingInterpretations)andtheTreasurer’sInstructions,andthekeyperformanceindicators.Thisresponsibilityincludesestablishingandmaintaininginternalcontrolsrelevanttothepreparationandfairpresentationofthefinancialstatementsandkeyperformanceindicatorsthatarefreefrommaterialmisstatement,whetherduetofraudorerror;selectingandapplyingappropriateaccountingpolicies;makingaccountingestimatesthatarereasonableinthecircumstances;andcomplyingwiththeFinancialManagementAct2006andotherrelevantwrittenlaw.
Summary of my RoleAsrequiredbytheAuditorGeneralAct2006,myresponsibilityistoexpressanopiniononthefinancialstatements,controls and key performance indicators based on my audit. This was done by testing selected samples of the audit evidence.IbelievethattheauditevidenceIhaveobtainedissufficientandappropriatetoprovideabasisformyauditopinion.Furtherinformationonmyauditapproachisprovidedinmyauditpracticestatement.Refer“http://www.audit.wa.gov.au/pubs/Audit-Practice-Statement.pdf”.
Anauditdoesnotguaranteethateveryamountanddisclosureinthefinancialstatementsandkeyperformanceindicatorsiserrorfree.Theterm“reasonableassurance”recognisesthatanauditdoesnotexamineallevidenceandeverytransaction.However,myauditproceduresshouldidentifyerrorsoromissionssignificantenoughtoadverselyaffectthedecisionsofusersofthefinancialstatementsandkeyperformanceindicators.
Auditor General
Page 1 of 2
4th Floor Dumas House 2 Havelock Street West Perth 6005 Western Australia Tel: 08 9222 7500 Fax: 08 9322 5664
INDEPENDENT AUDIT OPINION
To the Parliament of Western Australia
WESTERN AUSTRALIAN LAND INFORMATION AUTHORITY FINANCIAL STATEMENTS AND KEY PERFORMANCE INDICATORSFOR THE YEAR ENDED 30 JUNE 2008
I have audited the accounts, financial statements, controls and key performance indicators of the Western Australian Land Information Authority.
The financial statements comprise the Balance Sheet as at 30 June 2008, and the Income Statement, Statement of Changes in Equity and Cash Flow Statement for the year ended on that date, a summary of significant accounting policies and other explanatory Notes.
The key performance indicators consist of key indicators of effectiveness and efficiency.
Board’s Responsibility for the Financial Statements and Key Performance Indicators The Board is responsible for keeping proper accounts, and the preparation and fair presentation of the financial statements in accordance with Australian Accounting Standards (including the Australian Accounting Interpretations) and the Treasurer’s Instructions, and the key performance indicators. This responsibility includes establishing and maintaining internal controls relevant to the preparation and fair presentation of the financial statements and key performance indicators that are free from material misstatement, whether due to fraud or error; selecting and applying appropriate accounting policies; making accounting estimates that are reasonable in the circumstances; and complying with the Financial Management Act 2006 and other relevant written law.
Summary of my Role As required by the Auditor General Act 2006, my responsibility is to express an opinion on the financial statements, controls and key performance indicators based on my audit. This was done by testing selected samples of the audit evidence. I believe that the audit evidence I have obtained is sufficient and appropriate to provide a basis for my audit opinion. Further information on my audit approach is provided in my audit practice statement. Refer "http://www.audit.wa.gov.au/pubs/Audit-Practice-Statement.pdf".
An audit does not guarantee that every amount and disclosure in the financial statements and key performance indicators is error free. The term “reasonable assurance” recognises that an audit does not examine all evidence and every transaction. However, my audit procedures should identify errors or omissions significant enough to adversely affect the decisions of users of the financial statements and key performance indicators.

Western Australian Land Information Authority
Financial Statements and Key Performance Indicators for the year ended 30 June 2008
Audit OpinionIn my opinion,
(i)thefinancialstatementsarebasedonproperaccountsandpresentfairlythefinancialpositionofthe WesternAustralianLandInformationAuthorityat30June2008anditsfinancialperformanceandcashflows fortheyearendedonthatdate.TheyareinaccordancewithAustralianAccountingStandards(includingthe AustralianAccountingInterpretations)andtheTreasurer’sInstructions;
(ii)thecontrolsexercisedbytheAuthorityprovidereasonableassurancethatthereceipt,expenditureand investment of money, the acquisition and disposal of property, and the incurring of liabilities have been in accordancewithlegislativeprovisions;and
(iii)thekeyperformanceindicatorsoftheAuthorityarerelevantandappropriatetohelpusersassessthe Authority’sperformanceandfairlyrepresenttheindicatedperformancefortheyearended30June2008.
COLIN MURPHYAUDITOR GENERAL10September2008.
33

Certification of Financial Statements
TheaccompanyingfinancialstatementsoftheWesternAustralianLandInformationAuthorityhavebeenpreparedincompliancewiththeprovisionsoftheFinancialManagementAct2006fromproperaccountsandrecordstopresentfairlythefinancialyearended30June2008andthefinancialpositionasat30June2008.
Atthedateofsigning,wearenotawareofanycircumstancesthatwouldrendertheparticularsincludedinthefinancialstatements misleading or inaccurate.
KatrinaBurton GailCurtisMember MemberBoard of Management Board of ManagementWestern Australian Land Information Authority Western Australian Land Information Authority
9September2008 9September2008
MurraySmithChief Finance OfficerWestern Australian Land Information Authority
9September2008
34

SECTION 4
DISCLOSuRES AND LEGAL COMPLIANCE
4.1 FINANCIAL STATEMENTS
35
1
NOTE 1/7/07 to 30/6/08($’000)
1/1/07 to30/6/07($’000)
Income
Revenue
Provision of services 7 82,299 39,446
Saleofmaps,imagesandinformation 8 5,000 2,438
International services 9 1,013 602
Interest revenue 10 1,734 1,050
Other revenue 11 1,189 818
Gains
Gain on disposal of non-current assets 12 0 9
Total income 91,235 44,363
Expenses
Employeebenefitexpenses 13 64,529 30,348
Supplies&services 14 21,373 12,299
Other expenses 15 9,825 5,688
Depreciation and amortisation expense 16 8,061 3,062
Accommodation expenses 17 9,926 5,503
Cost of sales 8 156 69
Loss on disposal of non-current assets 12 16 0
Total expenses 113,886 56,969
Profi t/(loss) before grants and subsidies from State Government (22,651) (12,606)
Grants and subsidies from State Government
Serviceappropriation 18 23,322 13,711
Resources received free of charge 19 385 235
Liabilities assumed by the Treasurer 20 0 425
Total grants and subsidies from State Government 23,707 14,371
Profi t/(loss) before income tax equivalent benefi t/(expense) 1,056 1,765
Income tax equivalent benefi t/(expense) 34 (50) 3,701
Profi t/(loss) for the period 1,006 5,466
TheIncomeStatementshouldbereadinconjunctionwiththeaccompanyingnotes.
Western Australian Land Information AuthorityIncome Statement for the year ended 30 June 2008
35

2
NOTE 30/06/08($’000)
30/6/07($’000)
ASSETS
Current assets
Cash and cash equivalents 21 19,064 24,322
Inventories - maps 182 160
Receivables 23 22,136 10,893
Amounts receivable for services 24 950 1,433
Prepayments 25 925 795
Accrued interest 26 128 481
Total current assets 43,385 38,084
Non-current assets
Restricted cash and cash equivalents 22 683 413
Amounts receivable for services 24 22,948 21,295
Receivables 23 1,071 4,156
Equipment and furniture 27(a) 11,341 7,909
Intangibles 27(b) 30,351 30,013
Deferred tax assets 34 5,343 4,762
Total non-current assets 71,737 68,548
TOTAL ASSETS 115,122 106,632
LIABILITIES
Current liabilities
Payables 29 10,081 5,030
Repayable grant 30 45 148
Current tax liabilities 202 1,061
Provisions 31 12,823 11,250
Other current liabilities 32 4,291 2,955
Total current liabilities 27,442 20,444
Non-current liabilities
Repayable grant 30 44 89
Provisions 31 4,932 4,401
Total non-current liabilities 4,976 4,490
TOTAL LIABILITIES 32,418 24,934
NET ASSETS 82,704 81,698
EQuITy 33
Contributed equity 76,232 76,232
Retained earnings 6,472 5,466
TOTAL EQuITy 82,704 81,698
TheBalanceSheetshouldbereadinconjunctionwiththeaccompanyingnotes.
Western Australian Land Information AuthorityBalance Sheet as at 30 June 2008
36

3
NOTE 30/06/08($’000)
30/6/07($’000)
Balance of equity at the start of period 81,698 0
Contributed equity 33
Balance at start of period 76,232 0
Other contributions by owners 0 76,232
Balance at end of period 76,232 76,232
Retained earnings 33
Balance at start of period 5,466 0
Profit/(loss)fortheperiod 1,006 5,466
Balance at end of period 6,472 5,466
Balance of equity at the end of period 82,704 81,698
Total income and expense for the period 1,006 5,466
TheStatementofChangesinEquityshouldbereadinconjunctionwiththeaccompanyingnotes.
Western Australian Land Information AuthorityStatement of Changes in Equity for the year ended 30 June 2008
37

4
NOTE 1/7/07 to30/6/08($’000)
1/1/07 to30/6/07($’000)
Inflows Inflows
(Outflows) (Outflows)
Cash fl ows from operating activities
Receipts
Provision of services 74,557 34,543
Saleofmaps,imagesandinformation 5,217 2,196
International services 1,796 602
Interest received 2,087 569
GSTreceiptsonsales 870 388
GSTreceiptsfromtaxationauthority 3,733 2,117
Other receipts 1,204 2,203
Payments
Employeebenefits (61,944) (29,315)
Supplies&services (18,299) (11,536)
Other expenses (10,871) (7,124)
Accommodation (10,025) (5,452)
Capital user charge 0 (2,106)
GSTpaymentsonpurchases (4,258) (3,184)
Net cash provided by/(used in) operating activities 35(b) (15,933) (16,099)
Cash fl ows from investing activities
Saleofnon-currentassets 24 23
Purchase of non-current assets (9,593) (10,239)
Net cash provided by/(used in) investing activities (9,569) (10,216)
Cash fl ows from fi nancing activities
Repayable grant repayments (148) 0
Net cash provided by/(used in) fi nancing activities (148) 0
Cash fl ows from State Government
Serviceappropriations 20,719 12,281
Holding account drawdowns 1,433 690
Taxation equivalents (1,490) 0
Net cash provided by State Government 20,662 12,971
Net increase/(decrease) in cash and cash equivalents (4,988) (13,344)
Cash and cash equivalents at the beginning of the period 24,735 38,079
Cash and cash equivalents at the end of the period 35(a) 19,747 24,735
TheCashFlowStatementshouldbereadinconjunctionwiththeaccompanyingnotes.
Western Australian Land Information AuthorityCash Flow Statement for the year ended 30 June 2008
38
5
1. Australian equivalents to International Financial Reporting Standards
General
TheAuthority’sfinancialstatementsfortheyearended30June2008havebeenpreparedinaccordancewithAustralianequivalentstoInternationalFinancialReportingStandards(AIFRS),whichcompriseaFrameworkforthePreparationandPresentationofFinancialStatements(theFramework)andAustralianAccountingStandards(includingtheAustralianAccountingInterpretations).
InpreparingthesefinancialstatementstheAuthorityhasadopted,whererelevanttoitsoperations,newandrevisedStandardsandInterpretationsfromtheiroperativedatesasissuedbytheAASBandformerlytheUrgentIssuesGroup(UIG). AlthoughtheAuthorityisrequiredtooperateonprudentcommercialprinciples,Treasurer’sInstruction1101‘Application of Australian Accounting Standards and Other Pronouncements’designatestheAuthorityasanot-for-profitentityforpurposesofcompliancewiththeAustralianequivalentstoInternationalFinancialReportingStandards.
Early Adoption of standards
TheAuthoritycannotearlyadoptanAustralianAccountingStandardorInterpretationunlessspecificallypermittedbyTI1101‘Application of Australian Accounting Standards and Other Pronouncements’.NoStandardsandInterpretationsthat have been issued or amended but are not yet effective have been early adopted by the Authority for the reporting period ended 30 June 2008.
2. Summary of signifi cant accounting policies
(a) General statement
ThefinancialstatementsconstituteageneralpurposefinancialreportwhichhasbeenpreparedinaccordancewiththeAustralianAccountingStandards,theFramework,StatementofAccountingConceptsandotherauthoritativepronouncementsoftheAustralianAccountingStandardsBoardasappliedbytheTreasurer’sInstructions.SeveralofthesearemodifiedbytheTreasurer’sInstructionstovaryapplication,disclosure,formatandwording.
The Financial Management Act and the Treasurer’s Instructions are legislative provisions governing the preparation offinancialstatementsandtakeprecedenceoverAustralianAccountingStandards,theFramework,StatementofAccountingConceptsandotherauthoritativepronouncementsoftheAustralianAccountingStandardsBoard. Wheremodificationisrequiredandhasamaterialorsignificantfinancialeffectuponthereportedresults,detailsofthatmodificationandtheresultingfinancialeffectaredisclosedinthenotestothefinancialstatements.
(b) Basis of preparation
Thefinancialstatementshavebeenpreparedontheaccrualbasisofaccountingusingthehistoricalcostconvention.
Theaccountingpoliciesadoptedinthepreparationofthefinancialstatementshavebeenconsistentlyappliedthroughout all periods presented unless otherwise stated.
ThefinancialstatementsarepresentedinAustraliandollarsandallvaluesareroundedtothenearestthousanddollars($’000)unlessstatedotherwise.
ThejudgementsthathavebeenmadeintheprocessofapplyingtheAuthority’saccountingpoliciesthathavethemostsignificanteffectontheamountsrecognisedinthefinancialstatementsaredisclosedatNote3‘Judgementsmadebymanagementinapplyingaccountingpolicies’.
The key assumptions made concerning the future, and other key sources of estimation uncertainty at the reporting date thathaveasignificantriskofcausingamaterialadjustmenttothecarryingamountsofassetsandliabilitieswithinthenextfinancialyeararedisclosedatNote4‘Keysourcesofestimationuncertainty’.
Western Australian Land Information AuthorityNotes to the Financial Statements for the
year ended 30 June 2008
39

6
(c) Reporting Entity
The reporting entity comprises the Authority. There are no related bodies.
(d) Comparative fi gures
ThecomparativefiguresareforsixmonthsonlyasLandgate’sinauguralstatementswerefortheperiod1January2007to30June2007.2007-08istheAuthority’sfirstfullyearofoperation.Comparativefiguresare,whereappropriate,reclassifiedtobecomparablewiththefigurespresentedinthecurrentyear.
(e) Contributed equity
UIGInterpretation1038“Contributions by Owners Made to Wholly-Owned Public Sector Entities”requirestransfersinthenatureofequitycontributionstobedesignatedbytheGovernment(theowner)ascontributionsbyowners(atthetimeof,orpriortotransfer)beforesuchtransferscanberecognisedasequitycontributionsinthefinancialstatements.Capitalcontributions(appropriations)havebeendesignatedascontributionsbyownersbyTI955‘ContributionsbyOwnersmadetoWhollyOwnedPublicSectorEntities’andarecrediteddirectlytoContributedEquity.
Transfer of net assets to/from other agencies are designated as contributions by owners where the transfers are non-discretionary and non-reciprocal. (f) Income
Revenue Recognition
Revenue is measured at the fair value of consideration received or receivable.
Revenue is recognised for the major business activities as follows:
Sale of goods
Revenuefromthesaleofgoodsanddisposalofotherassetsisrecognisedwhenthesignificantrisksandrewardsofownership and control transfer to the purchaser and can be measured reliably.
Rendering of services
Revenue is recognised on delivery of the service to the client or by reference to the stage of completion. Where the rendering of services can not be estimated reliably, revenue is recognised only to the extent of costs incurred that are expected to be recoverable.
Service appropriations
ServiceAppropriationsarerecognisedasrevenuesintheperiodinwhichtheAuthoritygainscontroloftheappropriatedfunds.TheAuthoritygainscontrolofappropriatedfundsatthetimethosefundsaredepositedintotheAuthority’sbankaccountorcreditedtotheholdingaccountheldattheDepartmentofTreasuryandFinance.(RefertoNote18forfurthercommentaryonserviceappropriations).
Grants, gifts and other contributions
Revenue from grants, gifts and other non-reciprocal contributions are recognised at fair value when the Authority obtains control over the assets comprising the contributions, usually when cash is received.
Other non-reciprocal contributions that are not contributions by owners are recognised at their fair value. Contributions of services are only recognised when a fair value can be reliably determined and the services would be purchased if not donated.
Where contributions recognised as revenues during the reporting period were obtained on the condition that they be expended in a particular manner or used over a particular period, and those conditions were undischarged as at the balance sheet date, the nature of, and amounts pertaining to, those undischarged conditions are disclosed in the notes.
Notes to the Financial Statements for the year ended 30 June 2008
40

7
Interest
Revenue is recognised as the interest accrues.
Gains/LossesGains/losses may be realised or unrealised and are usually recognised on a net basis. These include gains/losses arising on the disposal of non-current assets.
(g) Income Tax
TheAuthorityoperateswithintheNationalTaxEquivalentRegime(“NTER”)wherebyanequivalentamountinrespectofincome tax is payable to the WA Treasury. The calculation of the liability in respect of income tax is governed by NTER guidelines and directions approved by Government.
AsaconsequenceofparticipationintheNTER,theAuthorityisrequiredtocomplywithAASB112‘IncomeTaxes’.
Theincometaxexpenseorrevenuefortheperiodisthetaxpayableonthecurrentperiod’staxableincomeadjustedbychanges in deferred tax assets and liabilities attributable to temporary differences between the tax bases of assets and liabilitiesandtheircarryingamountsinthefinancialstatements,andtounusedtaxlosses.
Deferred tax assets and liabilities are recognised for temporary differences at the tax rate expected to apply when the assets are recovered or liabilities settled, based on those tax rates which are enacted or substantively enacted. The relevant tax rates are applied to the cumulative amounts of deductible and taxable temporary differences to measure the deferred tax asset or liability. An exception is made for certain temporary differences arising from the initial recognition of an asset or liability. No deferred tax asset or liability is recognised in relation to these temporary differences if they arose in a transaction, other than a business combination, that at the time of the transaction did not affecteitheraccountingprofitortaxableprofitorloss.
Deferred tax assets are recognised for deductible temporary differences and unused tax losses only if it is probable that future taxable amounts will be available to utilise those temporary differences and losses.
Current and deferred tax balances attributable to amounts recognised directly in equity are also recognised directly in equity.
(h) Equipment and furniture
Capitalisation/Expensing of assets
Itemsofequipmentandfurniturecostingover$1,000arerecognisedasassetsandthecostofutilisingassetsisexpensed(depreciated)overtheirusefullives.Itemsofequipmentandfurniturecostinglessthan$1,000areexpensedintheyearofacquisitiondirecttotheIncomeStatement(otherthanwheretheyformpartofagroupofsimilaritemswhicharesignificantintotalorwheretheassetiscapitalisedformanagementpurposes).
Initial recognition and measurement
All items of equipment and furniture are initially recognised at cost.
Foritemsofequipmentandfurnitureacquiredatnocostorfornominalcost,costistheirfairvalueatthedateofacquisition.
Subsequent measurement
After recognition as an asset, equipment and furniture are carried at historical cost less accumulated depreciation/amortisation and accumulated impairment losses.
Depreciation/amortisation
All non-current assets having a limited useful life are systematically depreciated/amortised over their useful lives in a mannerwhichreflectstheconsumptionoftheirfutureeconomicbenefits.
Notes to the Financial Statements for the year ended 30 June 2008
41

8
Depreciation/amortisation is calculated on the straight line basis, using rates which are reviewed annually.Estimated useful lives for each class of asset are:
Furniture 11years
Equipment(includingleaseholdimprovements) 8-15years
Computerequipment 3-5years
LeaseholdImprovementsunderdevelopmentareclassifiedasWorksinProgress-LeaseholdImprovements.
(i) Intangible assets
Capitalisation/Expensing of assets
Acquiredandinternallygeneratedintangibleassetscostingover$1,000arecapitalised.Thecostofutilisingtheassetsisexpensed(amortised)overtheirusefullives.CostsincurredbelowthesethresholdsareimmediatelyexpenseddirectlytotheIncomeStatement.
Allacquiredandinternallydevelopedintangibleassetsareinitiallyrecognisedatcost.Forassetsacquiredatnocostorfor nominal consideration, the cost is their fair value at the date of acquisition.
The cost model is applied for subsequent measurement requiring the asset to be carried at cost less any accumulated amortisation and accumulated impairment losses.
Amortisationforintangibleassetswithfiniteusefullivesiscalculatedfortheperiodoftheexpectedbenefit(estimatedusefullife)onthestraightlinebasisusingrateswhicharereviewedannually.AllintangibleassetscontrolledbytheAuthorityhaveafiniteusefullifeandzeroresidualvalue.Theestimatedusefullivesforeachclassofintangibleassetis:
Servicedeliverysoftwareandrelatedprojectcosts 1-10years The value of intangible assets include:
majorcomputersoftwarepackagesacquiredpluscostsassociatedwithpreparingthesoftwareforitsintendeduse;•andmajor internally developed software plus the associated development costs.•
IntangibleassetsunderdevelopmentareclassifiedasWorksinProgress-ServiceDelivery.
Research costs are expensed as incurred. Development costs incurred for an individual project are carried forward when the future recoverability can reasonably be regarded as assured. Other development costs are expensed as incurred.
(j) Impairment of assets
Equipment and furniture and intangible assets are tested for any indication of impairment at each balance sheet date. Where there is an indication of impairment, the recoverable amount is estimated. Where the recoverable amount is less than the carrying amount, the asset is written down to the recoverable amount and an impairment loss is recognised. AstheAuthorityisanot-for-profitentity,therecoverableamountisthehigherofanasset’sfairvaluelesscoststoselland depreciated replacement cost.
Theriskofimpairmentisgenerallylimitedtocircumstanceswhereanasset’sdepreciationismateriallyunderstatedorwhere the replacement cost is falling. Each relevant class of assets is reviewed annually to verify that the accumulated depreciation/amortisationreflectsthelevelofconsumptionorexpirationofassets’futureeconomicbenefitsandtoevaluate any impairment risk from falling replacement costs.
Intangible assets not yet available for use are tested for impairment at each reporting date irrespective of whether there is any indication of impairment.
Notes to the Financial Statements for the year ended 30 June 2008
42
9
ReferNote28‘Impairmentofassets’fortheoutcomeofimpairmentreviewsandtesting.
ReferNote2(p)‘Receivables’andNote23‘Receivables’forimpairmentofreceivables.
(k) Provisions
Provisions are liabilities of uncertain timing and amount and are recognised where there is a present legal, equitable or constructiveobligationasaresultofapasteventandwhentheoutflowofeconomicbenefitsisprobableandareliableestimate can be made of the amount of the obligation. Provisions are reviewed at each balance sheet date. Seenote31‘Provisions’.
(i) Provision - Employee benefi ts
Annual and long service leave
Theliabilityforannualandlongserviceleaveexpectedtobesettledwithin12monthsaftertheendofthebalancesheet date is recognised and measured at the undiscounted amounts expected to be paid when the liabilities are settled.Annualandlongserviceleaveexpectedtobesettledmorethan12monthsaftertheendofthebalancesheetdate is measured at the present value of amounts expected to be paid when the liabilities are settled. Leave liabilities are in respect of services provided by employees up to the balance sheet date.
When assessing expected future payments consideration is given to expected future wage and salary levels including non-salary components such as employer superannuation contributions. In addition, the long service leave liability also considers the experience of employee departures and periods of service.
The expected future payments are discounted using market yields at the balance sheet date on national government bondswithtermstomaturitythatmatch,ascloselyaspossible,theestimatedfuturecashoutflows.
AllannualleaveandunconditionallongserviceleaveprovisionsareclassifiedascurrentliabilitiesastheAuthoritydoesnothaveanunconditionalrighttodefersettlementoftheliabilityforatleast12monthsafterthebalancesheetdate.
Purchased Leave
The provision for purchased leave relates to employees who have entered into an agreement to self-fund up to an additional four weeks leave per calendar year. The provision recognises the value of salary set aside for employees and is measured at the nominal amounts expected to be paid when the liabilities are settled. This liability is measured on the same basis as annual leave and is reported as part of annual leave provision.
Superannuation
TheGovernmentEmployeesSuperannuationBoard(GESB)administersthefollowingsuperannuationschemes.
EmployeesmaycontributetothePensionScheme,adefinedbenefitpensionschemenowclosedtonewmembersortheGoldStateSuperannuationScheme(GSS),adefinedbenefitlumpsumschemealsoclosedtonewmembers.TheAuthorityhasnoliabilitiesforsuperannuationchargesunderthePensionortheGSSSchemesastheliabilityhasbeenassumed by the Treasurer.
Employeescommencingemploymentpriorto16April2007whowerenotmembersofeitherthePensionortheGSSSchemesbecamenon-contributorymembersoftheWestStateSuperannuationScheme(WSS).Employeescommencingemploymentonorafter16April2007becamemembersoftheGESBSuperScheme(GESBS).Bothoftheseschemesareaccumulationschemes.TheAuthoritymakesconcurrentcontributionstoGESBonbehalfofemployeesincompliancewiththeCommonwealthGovernment’sSuperannuationGuarantee(Administration)Act1992.ThesecontributionsextinguishtheliabilityforsuperannuationchargesinrespectoftheWSSandGESBSSchemes.
TheGESBmakesallbenefitpaymentsinrespectofthePensionandGSSSchemes,andisrecoupedbytheTreasurerfortheemployer’sshare.
Seealsonote2(l)‘Superannuationexpense’.
Notes to the Financial Statements for the year ended 30 June 2008
43

10
(ii) Provisions - Other
Employment on-costs
Employmenton-costs,includingworkers’compensationinsuranceandpayrolltax,arenotemployeebenefitsandarerecognised separately as liabilities and expenses when the employment to which they relate has occurred. Employment on-costsarenotincludedaspartoftheAuthority’s‘Employeebenefitexpenses’.Theyareincludedaspartof‘Otherexpenses’andtherelatedliabilityisincludedintheEmploymenton-costsprovision.
Seenote15‘OtherExpenses’andnote31‘Provisions’.
(l) Superannuation expense
ThefollowingelementsareincludedincalculatingthesuperannuationexpenseintheIncomeStatement:
(a)Definedbenefitplans-Changeintheunfundedemployer’sliability(i.e.currentservicecostand,actuarialgainsandlosses)assumedbytheTreasurerinrespectofcurrentemployeeswhoaremembersofthePension Scheme and currentemployeeswhoaccruedabenefitontransferfromthePension Scheme to the Gold State Superannuation (GSS) Scheme;and
(b)Definedcontributionplans-employercontributionspaidtotheGSS(concurrentcontributions),theWest State Superannuation (WSS) Scheme, and the GESB Super Scheme (GESBS).
Definedbenefitplans-inordertoreflectthetruecostofservices,themovements(i.e.currentservicecostand,actuarialgainsandlosses)intheliabilitiesinrespectofthePension Scheme and the GSS SchemetransferbenefitsarerecognisedasexpensesdirectlyintheIncomeStatement.AstheseliabilitiesareassumedbytheTreasurer(refernote2(k)(i)),arevenuetitled‘LiabilitiesassumedbytheTreasurer’equivalenttotheexpenseisrecognisedunderGrantsandsubsidiesfromStateGovernmentintheIncomeStatement.Seenote20‘LiabilitiesassumedbytheTreasurer’.
The superannuation expense does not include payment of pensions to retirees, as this does not constitute part of the cost of services provided by the Authority in the current year.
Definedcontributionplans-inordertoreflecttheAuthority’struecostofservices,theAuthorityisfundedfortheequivalentofemployercontributionsinrespectoftheGSSScheme(excludingtransferbenefits).ThesecontributionswerepaidtotheGESBduringtheyearandplacedinatrustaccountadministeredbytheGESBonbehalfoftheTreasurer.TheGESBsubsequentlypaidtheseemployercontributionsinrespectoftheGSSSchemetotheConsolidated Account.
TheGSSSchemeisadefinedbenefitschemeforthepurposesofemployeesandwhole-of-governmentreporting.However,apartfromthetransferbenefit,itisadefinedcontributionplanforagencypurposesbecausetheconcurrentcontributions(definedcontributions)madebytheagencytoGESBextinguishestheagency’sobligationstotherelatedsuperannuation liability.
(m) Leases
TheAuthorityhasenteredintoanumberofoperatingleasearrangementsforbuildings,officeequipmentandvehicleswherethelessorseffectivelyretainalloftherisksandbenefitsincidentaltoownershipoftheitemsheldundertheoperatingleases.EqualinstalmentsoftheleasepaymentsarechargedtotheIncomeStatementovertheleasetermasthisisrepresentativeofthepatternofbenefitstobederivedfromtheleasedproperty.
(n) Financial instruments
Inadditiontocashandcashequivalents,theAuthorityhastwocategoriesoffinancialinstruments:Loansandreceivables;and•Financialliabilitiesmeasuredatamortisedcost•
Notes to the Financial Statements for the year ended 30 June 2008
44

11
These have been disaggregated into the following classes:
FinancialAssetsCash and cash equivalents•Restricted cash and cash equivalents•Receivables•Amounts receivable for services•
FinancialLiabilities
Payables•Repayable Grant•Other Liabilities•
Initialrecognitionandmeasurementoffinancialinstrumentsisatfairvalue.Thetransactioncostorfacevalueisequivalenttothefairvalue.Subsequentmeasurementisatamortisedcostusingtheeffectiveinterestmethod. The fair value of short-term receivables and payables is the transaction cost or the face value because there is no interest rate applicable and subsequent measurement is not required as the effect of discounting is not material. Seenote39‘FinancialInstruments’.
(o) Cash and cash equivalents
ForthepurposeoftheCashFlowStatement,cashandcashequivalentsincludecashassetsandrestrictedcashequivalents. These are comprised of cash on hand and short-term deposits that are readily convertible to a known amountofcash,andwhicharesubjecttoinsignificantriskofchangesinvalue.
(p) Receivables
Receivables are recognised and carried at original invoice amount less an allowance for uncollectible amounts (i.e.impairment).
Thecollectabilityofreceivablesisreviewedonanongoingbasisandanyreceivablesidentifiedasuncollectiblearewrittenoffagainsttheallowanceaccount.Theallowanceforuncollectibleamounts(doubtfuldebts)israisedwhenthereis objective evidence that the Authority will not be able to collect its debts. The carrying amount is equivalent to fair value as it is due for settlement within 30 days.
Seealsonote2(n)‘FinancialInstruments’andnote23‘Receivables’.
(q) Accrued salaries
Theaccruedsalariessuspenseaccount(referNote22‘Restrictedcashandcashequivalents’)consistsofamountstransferredannuallyintoasuspenseaccountoveraperiodof10financialyearstolargelymeettheadditionalcashoutflowineacheleventhyearwhen27paydaysoccurinthatyearinsteadofthenormal26.
Accruedsalaries(referNote29‘Payables’)representtheamountduetostaffbutunpaidattheendofthereportingperiod,astheendofthelastpayperiodforthatreportingperioddoesnotcoincidewiththeendofthefinancialyear.Accruedsalariesaresettledwithinafewdaysofthefinancialyearend.TheAuthorityconsidersthecarryingamountofaccrued salaries to be equivalent to the net fair value.
(r) Amounts receivable for services (Holding Account)
The Authority receives appropriation funding on an accrual basis that recognises the full annual cash and non-cash costofservices.Theappropriationsarepaidpartlyincashandpartlyasanasset(HoldingAccountreceivable)thatisaccessible on the emergence of the cash funding requirement to cover asset replacement.
Seealsonote18‘ServiceAppropriations’andNote24’Amountsreceivableforservices’.
Notes to the Financial Statements for the year ended 30 June 2008
45

12
(s) Payables
Payables are recognised when the Authority becomes obliged to make future payments as a result of a purchase of assets or services at the amount payable. The carrying amount is equivalent to fair value as they are generally settled within30days.Seealsonote2(n)for‘FinancialInstruments’andnote29‘Payables’.
(t) Resources received free of charge or for nominal cost
Resources received free of charge or for nominal cost which can be reliably measured are recognised as revenues and as assets or expenses as appropriate at fair value.
(u) Foreign currency translation
Transactions denominated in a foreign currency are translated at the rates in existence at the dates of the transactions.
(v) Inventories
Inventories are valued at the lower of cost and net realisable value. Costs are assigned by the method most appropriate to each particular class of inventory, with the majority being valued at average cost.
(w) Rounding of amounts
Amountsinthefinancialstatementshavebeenroundedtothenearestthousanddollars,orincertaincases,tothenearest whole dollar.
3. Judgements made by management in applying accounting policies
Thejudgementsmadebymanagementintheprocessofapplyingaccountingpolicieshadnosignificanteffectontheamountsrecognisedinthefinancialstatements.
4. Key sources of estimation uncertainty
There were no key assumptions made concerning the future, and no other key sources of estimation uncertainty at thereportingdatethathaveasignificantriskofcausingamaterialadjustmenttothecarryingamountsofassetsandliabilitieswithinthenextfinancialyear.
5. Disclosure of changes in accounting policy and estimates
(a) Initial application of an Australian Accounting Standard
TheAuthorityhasappliedthefollowingAustralianAccountingStandardsandAustralianAccountingInterpretationseffectiveforannualreportingperiodsbeginningonorafter1July2007thatimpactedontheAuthority: (i) AASB7‘FinancialInstruments:Disclosures’(includingconsequentialamendmentsinAASB2005-10‘AmendmentstoAustralianAccountingStandards[AASB132,AASB101,AASB114,AASB117,AASB133,AASB139,AASB1,AASB4,AASB1023&AASB1038]’).ThisStandardrequiresnewdisclosuresinrelationtofinancialinstrumentsandwhilethereisnofinancialimpact,thechangeshaveresultedinincreaseddisclosures,bothquantitativeandqualitative,oftheAuthority’sexposuretorisks,includingenhanceddisclosureregardingcomponentsoftheAuthority’sfinancialpositionandperformance,andchangestothewayofpresentingcertainitemsinthenotestothefinancialstatements.
(b) Future impact of Australian Accounting Standards not yet operative
TheAuthoritycannotearlyadoptanAustralianAccountingStandardorAustralianAccountingInterpretationunlessspecificallypermittedbyTI1101‘ApplicationofAustralianAccountingStandardsandOtherPronouncements’.Consequently,theAuthorityhasnotappliedthefollowingAustralianAccountingStandardsandAustralianAccountingInterpretations that have been issued but are not yet effective. Where applicable, the Authority plans to apply these StandardsandInterpretationsfromtheirapplicationdate:
Notes to the Financial Statements for the year ended 30 June 2008
46

13
(i)AASB101‘PresentationofFinancialStatements’(September2007).ThisStandardhasbeenrevisedandwillchangethestructureofthefinancialstatements.Thesechangeswillrequirethatownerchangesinequityarepresentedseparatelyfromnon-ownerchangesinequity.TheStandardisrequiredtobeappliedtoannualreportingperiodsbeginningonorafter1January2009.TheAuthoritydoesnotexpectanyfinancialimpactwhentheStandardisfirst applied.
(ii)ReviewofAAS27‘FinancialReportingbyLocalGovernments’,AAS29‘FinancialReportingbyGovernmentDepartments’andAAS31‘FinancialReportingbyGovernments’.TheAASBhasmadethefollowingpronouncementsfromitsshorttermreviewofAAS27,AAS29andAAS31:
AASB1004‘Contributions’(December2007).•AASB1050‘AdministeredItems’(December2007).•AASB1051’LandUnderRoads’(December2007).•AASB1052‘DisaggregatedDisclosures’(December2007).•AASB2007-9‘AmendmentstoAustralianAccountingStandardsarisingfromthereviewofAASs27,29and31•[AASB3,AASB5,AASB8,AASB101,AASB114,AASB116,AASB127&AASB137](December2007).Interpretation1038‘ContributionsbyOwnersMadetoWholly-OwnedPublicSectorEntities(December2007).•
TheaboveStandardsarerequiredtobeappliedtoannualreportingperiodsbeginningonorafter1July2008.
TheexistingrequirementsinAAS27,AAS29andAAS31havebeentransferredtotheabovenewandexistingtopic-basedStandardsandInterpretation.Theserequirementsremainsubstantivelyunchanged.AASB1050,AASB1051andAASB1052onlyapplytogovernmentdepartments.TheotherStandardsandInterpretationmakesomemodificationstodisclosuresandprovideadditionalguidance(forexample,AustralianGuidancetoAASB116‘Property,PlantandEquipment’inrelationtoheritageandculturalassetshasbeenintroduced),otherwise,therewillbenofinancialimpact.
(c) Changes in accounting estimates
There were no changes in accounting estimates that will have an effect in the current period or is expected to have an effect in future periods.
6. Services of the Authority
InformationabouttheAuthority’sservicesandtheexpensesandrevenueswhicharereliablyattributabletothoseservicesaresetoutinnote49‘ScheduleofIncomeandExpensesbyService’.
The three services of the Authority and their objectives as at 30 June 2008 were:
Service 1: Access to Land Information
Information about land ownership, land boundaries and geographic features is collected, recorded and made available for use by government, business and the community.
Service 2: Valuations
An impartial valuation and property consultancy service.
Service 3: Access to Government Geographic Information
LandorgeographicinformationfromWesternAustralianLandInformationSystem(WALIS)communitymembers(WCM)ismanagedinacoordinatedwaysothatdataheldbyWCMcanbeintegratedandreadilyaccessedtomeetgovernment, business and community needs.
Notes to the Financial Statements for the year ended 30 June 2008
47
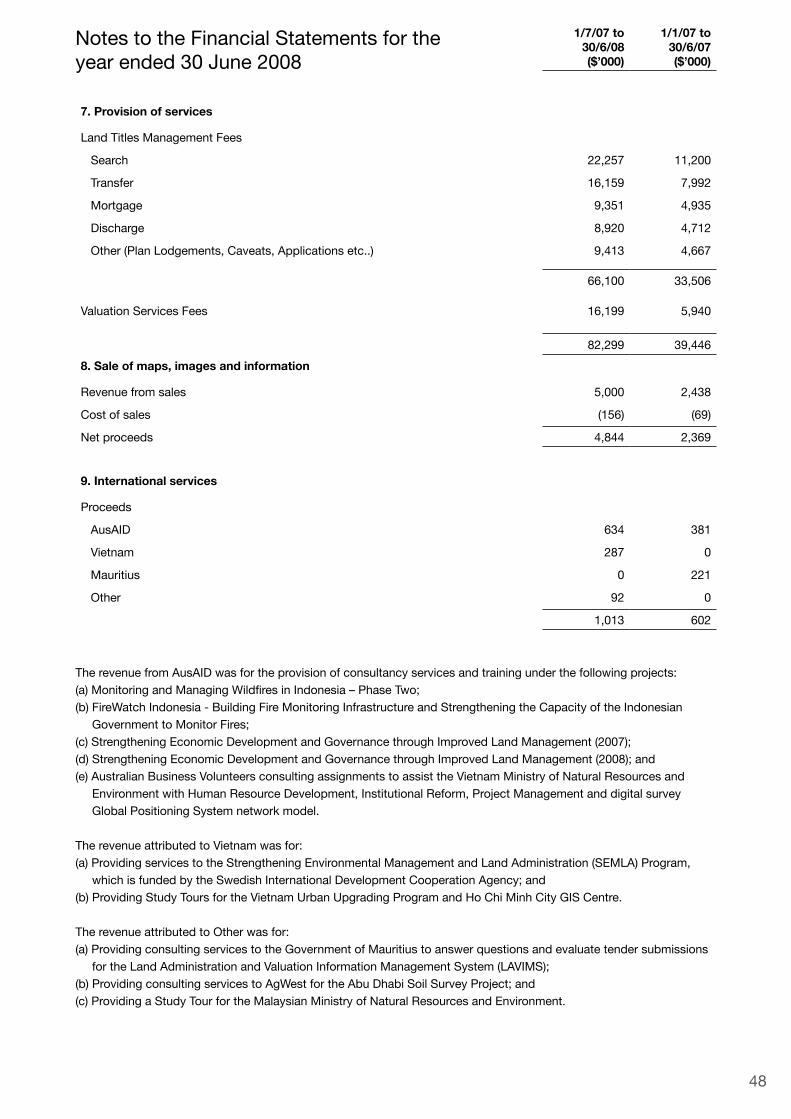
14
1/7/07 to30/6/08($’000)
1/1/07 to30/6/07($’000)
7. Provision of services
LandTitlesManagementFees
Search 22,257 11,200
Transfer 16,159 7,992
Mortgage 9,351 4,935
Discharge 8,920 4,712
Other(PlanLodgements,Caveats,Applicationsetc..) 9,413 4,667
66,100 33,506
ValuationServicesFees 16,199 5,940
82,299 39,446
8. Sale of maps, images and information
Revenue from sales 5,000 2,438
Cost of sales (156) (69)
Net proceeds 4,844 2,369
9. International services
Proceeds
AusAID 634 381
Vietnam 287 0
Mauritius 0 221
Other 92 0
1,013 602
The revenue from AusAID was for the provision of consultancy services and training under the following projects:(a)MonitoringandManagingWildfiresinIndonesia–PhaseTwo;(b)FireWatchIndonesia-BuildingFireMonitoringInfrastructureandStrengtheningtheCapacityoftheIndonesianGovernmenttoMonitorFires;(c)StrengtheningEconomicDevelopmentandGovernancethroughImprovedLandManagement(2007);(d)StrengtheningEconomicDevelopmentandGovernancethroughImprovedLandManagement(2008);and(e)AustralianBusinessVolunteersconsultingassignmentstoassisttheVietnamMinistryofNaturalResourcesand Environment with Human Resource Development, Institutional Reform, Project Management and digital survey GlobalPositioningSystemnetworkmodel.
The revenue attributed to Vietnam was for:(a)ProvidingservicestotheStrengtheningEnvironmentalManagementandLandAdministration(SEMLA)Program,whichisfundedbytheSwedishInternationalDevelopmentCooperationAgency;and(b)ProvidingStudyToursfortheVietnamUrbanUpgradingProgramandHoChiMinhCityGISCentre.
The revenue attributed to Other was for:(a)ProvidingconsultingservicestotheGovernmentofMauritiustoanswerquestionsandevaluatetendersubmissionsfortheLandAdministrationandValuationInformationManagementSystem(LAVIMS);(b)ProvidingconsultingservicestoAgWestfortheAbuDhabiSoilSurveyProject;and(c)ProvidingaStudyTourfortheMalaysianMinistryofNaturalResourcesandEnvironment.
Notes to the Financial Statements for the year ended 30 June 2008
48

15
1/7/07 to30/6/08($’000)
1/1/07 to30/6/07($’000)
10. Interest revenue
InterestonfundsinvestedbytheDepartmentofTreasuryandFinance 545 1,050
Interest on inscribed stock issued by Western Australian Treasury Corporation 1,189 0
1,734 1,050
11. Other revenue
Grants 641 405
Recovery of costs 235 282
WALISForum 185 0
GovernmentVehicleScheme 52 26
OtherServices 76 105
1,189 818
12. Net gain/(loss) on disposal of non-current assets
Furniture,OfficeandComputerEquipment
Cost 1,241 1,901
Accumulated Depreciation (1,201) (1,887)
Carrying Amount of Non Current Assets 40 14
less: Proceeds 24 23
Net gain/(loss) on disposal (16) 9
13. Employee benefi t expenses
SalariesandWagesa 50,412 24,459
Superannuation-definedcontributionplans 5,435 2,524
Superannuation-definedbenefitplansb 0 425
Annual Leavec 5,700 2,319
LongServiceLeavec 2,982 621
64,529 30,348
(a)Thisincludesthevalueofthefringebenefittotheemployeeplusthefringebenefitstaxcomponent. (b)NonotionalSuperannuationexpensehasbeenincludedinthecurrentfinancialyearasthecorrespondingliabilityinrespectofcurrentemployeesasat30June2008islessthantheliabilityasat30June2007by$1.65m.(c)Includesasuperannuationcontributioncomponent.
Employmenton-costssuchasworkers’compensationinsuranceandpayrolltaxareincludedatnote15‘OtherExpenses’.Theemploymenton-costsliabilityisincludedatnote31‘Provisions’.
Notes to the Financial Statements for the year ended 30 June 2008
49

16
1/7/07 to30/6/08($’000)
1/1/07 to30/6/07($’000)
14. Supplies & Services
Servicesandcontracts-IT 12,739 7,907
Servicesandcontracts-Others 6,837 3,478
Travel 877 386
Consumables 472 243
Communications 448 285
21,373 12,299
15. Other Expenses
Employmenton-costs(includespayrolltaxandworkers’compensationinsurance) 3,463 2,351
Otherstaffingcosts 1,292 644
Minor purchases 788 662
Advertising 565 78
Consultancy 561 345
Sponsorship/Contributions 436 8
StaffRecruitment 354 231
Insurance 296 124
Grants&Subsidies 234 335
Printing Costs 211 76
FringeBenefitTax 176 125
HireCharges-Furniture 175 53
Board and Committee fees 150 75
Books,Magazines,ActsandSubscriptions 143 72
MembershipFees 109 41
Other expenses 872 468
9,825 5,688
16. Depreciation and amortisation expense
Depreciation
Equipment 163 46
Computer Equipment 1,698 677
Furniture 5 2
1,866 725
Amortisation
ServiceDeliverySoftwareandrelatedprojectcosts 6,088 2,290
Leasehold Improvements 107 47
6,195 2,337
Total depreciation and amortisation expense 8,061 3,062
Notes to the Financial Statements for the year ended 30 June 2008
50

17
1/7/07 to30/6/08($’000)
1/1/07 to30/6/07($’000)
17. Accommodation expenses
Lease rentals 7,370 3,561
Utilities and statutory charges 758 359
Repairs and maintenance 1,099 478
Minor works and alterations 267 838
Other accommodation expenses 432 267
9,926 5,503
18. Service Appropriations
Appropriation revenue received during the reporting period 23,322 13,711
Serviceappropriationsareaccrualamounts,reflectingthefullcostofservicesdelivered. The appropriation revenue comprises a cash component and a receivable (asset).Thereceivable(holdingaccount)comprisesanallocationbasedonthedepreciation expense for the reporting period.
19. Resources received free of charge
Resources received free of charge have been determined on the basis of the following estimates provided by agencies:
DepartmentofTreasuryandFinance 305 150
Department of the Attorney General 63 75
Department for Planning & Infrastructure 17 10
385 235
Where assets or services have been received free of charge or for nominal consideration, the Authority recognises revenues equivalent to the fair value of the assets and/or the fair value of those services that can be reliably determined and which would have been purchased if not donated, and those fair values shall be recognised as assets or expenses, as applicable.
20. Liabilities assumed by the Treasurer
Superannuation 0 425
The assumption of the superannuation liability by the Treasurer is only a notional revenue to offset the notional superannuation expense reported in respect of current employees who are members of the Pension Scheme and current employees who haveatransferbenefitentitlementundertheGold State Superannuation Scheme.
NonotionalSuperannuationrevenuehasbeenincludedinthefinancialyearasthecorresponding liability in respect of current employees as at 30 June 2008 is less thantheliabilityasat30June2007by$1.65m.
(ReferNote2(l)‘Superannuationexpense’andNote13‘Employeebenefitexpenses)
21. Cash and cash equivalents
Operating bank account 19,017 24,275
Cash on hand 47 47
19,064 24,322
Notes to the Financial Statements for the year ended 30 June 2008
51

18
1/7/07 to30/6/08($’000)
1/1/07 to30/6/07($’000)
22. Restricted cash and cash equivalents
Non-current
Accruedsalariessuspense(i) 683 413
(i)Amountheldinthesuspenseaccountisonlyusedforthepurposeofmeetingthe27thpayinafinancialyearthatoccursevery11years.
23. Receivables
Current
Trade Debtors 19,782 7,584
Goods and services tax 723 952
Accrued Revenue 1,695 2,386
22,200 10,922
Less: Allowance for impairment of receivables (64) (29)
22,136 10,893
Non-current
Accrued Revenue 1,071 4,156
1,071 4,156
Reconciliation of changes in the allowance for impairment of receivables:
Balance at the start of year 29 20
Doubtful debts expense recognised in the income statement 63 9
Amounts written off during the year (28) 0
Amounts recovered during the year 0 0
Balance at end of year 64 29
Credit Risk
Ageing of receivables past due but not impaired based on the information provided to senior management, at the balance sheet date:
Not more than three months 861 202
Morethanthreemonthsbutlessthan6months 41 35
Morethan6monthsbutlessthan1year 65 37
Morethan1year 101 76
1,068 350
Seealsonote2(p)‘Receivables’andnote39‘FinancialInstruments’.
24. Amounts receivable for services
Current 950 1,433
Non-current 22,948 21,295
23,898 22,728
This asset represents the non-cash component of service appropriations. It is restricted in that it can only be used for asset replacement. (ReferNote18‘ServiceAppropriations’)
Notes to the Financial Statements for the year ended 30 June 2008
52

19
1/7/07 to30/6/08($’000)
1/1/07 to30/6/07($’000)
25. Prepayments
Data processing contracts 800 691
Other 125 104
925 795
26. Accrued Interest
InterestoncashbalancesinvestedbytheDepartmentofTreasuryandFinance 128 481
27. a) Equipment and furniture
Equipment 2,214 2,299
At cost (1,278) (1,534)
Accumulated depreciation 936 765
Computer equipment
At cost 10,666 9,108
Accumulated depreciation (6,444) (5,531)
4,222 3,577
Leasehold Improvements
At cost 1,301 1,014
Accumulated amortisation (421) (314)
Written down value 880 700
Work in progress at cost 5,247 2,837
Total Leasehold Improvements 6,127 3,537
Total equipment 11,285 7,879
Furniture
At cost 1,839 1,805
Accumulated depreciation (1,783) (1,775)
Total furniture 56 30
Total equipment and furniture 11,341 7,909
b) Intangibles
Servicedeliverysoftwareandrelatedprojectcosts
At cost 58,348 53,134
Accumulated amortisation (40,358) (34,271)
Written down value 17,990 18,863
Work in progress at cost 12,361 11,150
Total intangibles 30,351 30,013
Total equipment, furniture and intangibles 41,692 37,922
Notes to the Financial Statements for the year ended 30 June 2008
53

20
c) ReconciliationsReconciliations of the carrying amounts of equipment, furniture and intangibles at the beginning and end of the reporting period are set out below.
1/7/07 to30/6/08($’000)
1/1/07 to30/6/07($’000)
28. Impairment of assets
There were no indications of impairment of equipment, furniture and intangible assets at 30 June 2008. The Authority held no intangible assets not yet available foruseotherthaninternalsystemsunderdevelopmentandclassifiedasworksinprogress - service delivery.
29. Payables
Trade payables 4,117 832
Accrued expenses 5,082 3,893
Accrued salaries and wages 820 224
Other 62 81
10,081 5,030
1 JULY 2007 TO
30 JUNE 2008
EQuIPMENT
($’000)
COMPuTEREQuIPMENT
($’000)
LEASEHOLD IMPROVEMENTS
($’000)
WORK IN PROGRESSLEASEHOLD
IMPROVEMENTS
($’000)
FuRNITuRE
($’000)
SERVICE DELIVERy,
SOFTWARE AND
PROJECT COSTS($’000)
WORK IN PROGRESS
SERVICEDELIVERy
($’000)
TOTAL
($’000)
Carrying amount at1July2007 765 3,577 700 2,837 30 18,863 11,150 37,922
Additions 293 2,423 287 2,410 32 0 6,618 12,063
Transfers 0 0 0 0 0 5,407 (5,407) 0
Disposals 41 (80) 0 0 (1) 0 0 (40)
Depreciation/amortisation (163) (1,698) (107) 0 (5) (6,088) 0 (8,061)
Adjustments 0 0 0 0 0 (192) 0 (192)
Carrying amount at 30 June 2008 936 4,222 880 5,247 56 17,990 12,361 41,692
1 JANUARY 2007 TO
30 JUNE 2007
EQuIPMENT
($’000)
COMPuTEREQuIPMENT
($’000)
LEASEHOLD IMPROVEMENTS
($’000)
WORK IN PROGRESSLEASEHOLD
IMPROVEMENTS
($’000)
FuRNITuRE
($’000)
SERVICE DELIVERy,
SOFTWARE AND
PROJECT COSTS($’000)
WORK IN PROGRESS
SERVICEDELIVERy
($’000)
TOTAL
($’000)
Carrying amount at 1January2007 489 2,848 748 798 21 16,666 11,048 32,618
Additions 325 1,416 0 2,039 10 0 4,590 8,380
Transfers 0 0 0 0 0 4,488 (4,488) 0
Disposals (3) (10) 0 0 (1) 0 0 (14)
Depreciation/amortisation (46) (677) (48) 0 0 (2,291) 0 (3,062)
Adjustments 0 0 0 0 0 0 0 0
Carrying amount at 30 June 2007 765 3,577 700 2,837 30 18,863 11,150 37,922
Notes to the Financial Statements for the year ended 30 June 2008
54

21
1/7/07 to30/6/08($’000)
1/1/07 to30/6/07($’000)
30. Repayable grant
Current 45 148
Non-current 44 89
89 237
TheAuthorityassumedresponsibilityfor‘interestfree’grantsreceivedbyitspredecessortotalling$739,000fromtheSustainableEnergyDevelopmentOfficeunder the Energy Smart Government Capital Advance Program. The grantshavebeenprovidedtofinanceperformanceimprovementmeasuresimplementedunderstages1and2oftheagency’sEnergyPerformanceContract.
Thegrantsinrespectofstage1($516,000)arerepayableinequalinstalmentsover5years,beginning1August2003.Thegrantinrespectofstage2($223,000)isalsorepayableinequalinstalmentsover5years,beginning1August2005.The repayments are funded from savings guaranteed to be delivered by the contractor under the agreement.
31. Provisions
Current
Employee benefi ts provision (i)
Current
Annualleave(ii) 4,932 4,377
Longserviceleave(iii) 7,226 6,281
12,158 10,658
Employment on-costs provision (iv)
Current 665 592
Total current provisions 12,823 11,250
Non-current
Employee benefi ts provision (i)
Longserviceleave(iii) 4,669 4,166
4,669 4,166
Employment on-costs provision (iv)
Non-current 263 235
Total non-current provisions 4,932 4,401
Notes to the Financial Statements for the year ended 30 June 2008
55

22
1/7/07 to30/6/08($’000)
1/1/07 to30/6/07($’000)
(i)EmployeeBenefitsasat30June2008includes$1.25minrespectofemployersuperannuationcontributions.(30June2007$1.09m)
(ii)Annualleaveliabilitieshavebeenclassifiedascurrentwherethereisnounconditionalrighttodefersettlementforatleast12monthsafterbalance sheet date. Assessments indicate that actual settlement of the liabilities will occur as follows:
Within12monthsofbalancesheetdate 3,226 2,695
Morethan12monthsafterbalancesheetdate 1,706 1,682
4,932 4,377
(iii)Longserviceleaveliabilitieshavebeenclassifiedascurrentwherethereisnounconditionalrighttodefersettlementforatleast12monthsafterbalancesheet date. Assessments indicate that actual settlement of the liabilities will occur as follows:
Within12monthsofbalancesheetdate 5,165 4,169
Morethan12monthsafterbalancesheetdate 6,730 6,278
11,895 10,447
(iv)Thesettlementofannualandlongserviceleaveliabilitiesgivesrisetothe payment of employment on-costs including workers compensation premiums and payroll tax. The provision is the present value of expected future payments. TheassociatedexpenseisincludedatNote15‘OtherExpenses’.
Employment on-cost provision
Carrying amount at start of year 827 68
Additional provisions recognised 467 759
Payments/othersacrificesofeconomicbenefits (366) 0
Carrying amount at end of year 928 827
32. Other current liabilities
Unearned revenue 3,164 1,519
ElectronicAdviceofSaleAdministration 623 895
Revenue received in advance 304 338
Other liabilities 200 203
4,291 2,955
Notes to the Financial Statements for the year ended 30 June 2008
56

23
1/7/07 to30/6/08($’000)
1/1/07 to30/6/07($’000)
33. Equity
Equity represents the residual interest in the net assets of the Authority. The Government holds the equity interest in the Authority on behalf of the community.
Retained Earnings
Balance at start of period 5,466 0
Result for the period 1,006 5,466
Balance at end of period 6,472 5,466
Contributed equity
Balance at start of period 76,232 0
Othercontributionsbyowners(i) 0 76,232
Balance at end of period 76,232 76,232
Total equity 82,704 81,698
(i)ThisrepresentsthenetassetstransferredfromtheformerDepartmentofLand Information to the newly created Western Australian Land Information Authority effective1January2007.
34. Taxation Equivalent
The Western Australian Land Information Authority was included in the National Tax EquivalentsRegime(‘NTER’)forthefirsttimeon1January2007.TheNTERrequiresthe payment of income tax assuming the Authority is a non-government business.
Major components of income tax expense for the year ended 30 June 2008 are:
(a) Income tax expense
Current income tax
Current income tax charge 673 1,061
Adjustments in respect of previous current income tax (43) 0
Deferred income tax
Relating to origination and reversal of temporary differences (580) (4,762)
Incometaxexpense/(benefit)reportedinincomestatement 50 (3,701)
(b) Amounts recognised directly in equity
There were no current and deferred tax arising in the reporting period recognised directly in equity.
Notes to the Financial Statements for the year ended 30 June 2008
57

24
1/7/07 to30/6/08($’000)
1/1/07 to30/6/07($’000)
(c) Numerical reconciliation of income tax expense to prima facie tax payable
Reconciliationofincometaxexpense/(benefit)applicabletoaccountingprofitbeforeincome tax equivalents at the statutory income tax rate to income tax expense at the Authority’seffectiveincometaxratefortheperiodended30June2008and30June2007 are as follows:
Profit/(loss)beforeincometaxequivalents 1,056 1,765
Taxatthestatutoryincometaxrateof30% 317 530
Non-deductible expenses 22 35
Adjustments in respect of previous current income tax (43) 0
Adjustments in respect of previous deferred income tax (246) 0
Deferred tax asset not previously recognised, now brought to account 0 (4,266)
Incometaxexpense/(benefit) 50 (3,701)
(d) Deferred income tax
Deferred income tax assets and liabilities are attributable to the following:
There are no unrecognised deferred tax assets.
MOVEMENT IN TEMPORARy DIFFERENCES DuRING THE yEAR
BALANCE1 JULY 2007
($’000)
RECOGNISED IN INCOME
($’000)
RECOGNISEDIN EQuITy
($’000)
BALANCE 30 JUNE 2008
($’000)
Receivables (6) (13) 0 (19)
OtherFinancalAssets 0 38 0 38
Property Plant & Equipment 36 (23) 0 13
Payables (97) 55 0 (42)
Provisions (4,695) (632) 0 (5,327)
Capital raising costs 0 (6) 0 (6)
Tax (assets) liabilities (4,762) (581) 0 (5,343)
ASSETS LIABILITIES NET
30/06/08($’000)
30/06/07($’000)
30/06/08($’000)
30/06/07($’000)
30/06/08($’000)
30/06/07($’000)
Receivables (19) (6) 0 0 (19) (6)
OtherFinancialAssets 0 0 38 0 38 0
Property Plant & Equipment (494) (284) 508 320 14 36
Payables (43) (97) 0 0 (43) (97)
Provisions (5,327) (4,695) 0 0 (5,327) (4,695)
Capital raising costs (6) 0 0 0 (6) 0
Tax(assets)liabilities (5,889) (5,082) 546 320 (5,343) (4,762)
Setoffoftax 546 320 (546) (320) 0 0
Net tax (assets) liabilities (5,343) (4,762) 0 0 (5,343) (4,762)
Notes to the Financial Statements for the year ended 30 June 2008
58

25
1/7/07 to30/6/08($’000)
1/1/07 to30/6/07($’000)
35. Notes to the Cash Flow Statement
(a) Reconciliation of cash
CashattheendofthereportingperiodasshownintheCashFlowStatementisreconciledtotherelateditemsintheBalanceSheetasfollows:
Cashandcashequivalents(ReferNote21) 19,064 24,322
Restrictedcashandcashequivalents(ReferNote22) 683 413
19,747 24,735
(b) Reconciliation of profi t/(loss) after tax equivalents to net cash fl ows provided by/(used in) operating activities
Profit/(Loss)afterincometaxequivalents 1,006 5,466
Non-cash items:
Depreciation expense 8,061 3,062
Superannuationexpense 0 425
Resources received free of charge 385 235
Doubtful debts expense 36 8
Net(gain)/lossondisposalofnon-currentassets 16 9
Other non-cash adjustments 40 10
IncomeTaxEquivalentbenefit 50 (3,701)
GrantsandsubsidiesfromStateGovernment (23,707) (14,371)
(Increase)/decreaseinassets:
Inventories (22) 5
Receivables (8,506) (5,067)
Prepayments (94) (36)
Accrued revenue 353 (481)
Increase/(decrease)inliabilities:
Accounts payable 2,428 (2,565)
Provisions 2,069 894
Other liabilities 1,607 569
ChangeinGSTinreceivables/payables 345 (561)
Net cash used in operating activities (15,933) (16,099)
Notes to the Financial Statements for the year ended 30 June 2008
59

26
1/7/07 to30/6/08($’000)
1/1/07 to30/6/07($’000)
36. Resources provided free of charge
Duringthereportingperiodthefollowingresourcesinexcessof$10,000wereprovided to other agencies free of charge:
DepartmentofTreasuryandFinance 9,853 4,654
Department for Planning and Infrastructure 4,202 2,591
Public Transport Authority 2,041 27
FireandEmergencyServicesAuthorityofWesternAustralia 1,586 890
Department of Indigenous Affairs 1,336 370
Department of Industry and Resources 974 305
WesternAustraliaPoliceService 518 344
Main Roads Western Australia 451 18
Department of Housing and Works 296 132
LandCorp 284 244
OfficeofNativeTitle 266 141
DepartmentofAgricultureandFood 247 96
Department of Consumer and Employment Protection 237 55
Corruption and Crime Commission 228 1
Department of Environment and Conservation 209 75
Department of Education and Training 181 412
Department of the Attorney General 132 68
Department of Health 73 2,053
DepartmentofFisheries 40 0
WA Electoral Commission 34 29
OfficeoftheDirectorofPublicProsecutions 28 7
Department of the Premier and Cabinet 22 0
The University of Western Australia 15 82
East Perth Redevelopment Authority 14 0
Local Government Grants Commission 14 10
Rural Business Development Corporation 10 1
Department of Water 0 46
Department for Community Development 0 33
DisabilityServicesCommission 0 18
DepartmentofCorrectiveServices 0 13
DepartmentofEducationServices 0 10
23,291 12,725
Resourcesprovidedtootheragencieswhichwerelessthan$10,000peragency: 59 30
Resources provided free of charge to organisations other than departments and statutory authorities:
4,712 1,072
Total resources provided free of charge 28,062 13,827
Theabovefiguresarecostedonthebasisoffullcostrecovery.
Notes to the Financial Statements for the year ended 30 June 2008
60

27
1/7/07 to30/6/08($’000)
1/1/07 to30/6/07($’000)
37. Commitments for expenditure
(a) Capital expenditure
Capital expenditure commitments, being contracted capital expenditure additional to theamountsreportedinthefinancialstatements,arepayableasfollows:
Within1year 2,783 5,682
Laterthan1yearandnotlaterthan5years 14,508 6,327
Laterthan5years 16,093 0
33,384 12,009
(b) Operating lease expenditure
These commitments are in respect of non cancellable operating leases contracted for atthebalancesheetdatebutnotrecognisedasliabilities.Theseleasesincludeofficeaccommodation,officeequipmentandmotorvehicles.
Within1year 9,857 8,751
Laterthan1yearandnotlaterthan5years 38,287 46,812
Laterthan5years 2,676 2,106
50,820 57,669
(c) Other expenditure commitments
These expenditure commitments relate to general administration expenses including IT services, software licensing and maintenance, photographic services and building maintenance, and are payable as follows:
Within1year 23,989 16,035
Laterthan1yearandnotlaterthan5years 53,606 18,591
Laterthan5years 38,202 2,445
115,797 37,071
ThesecommitmentsareallinclusiveofGST.
38. Remuneration of members of the accountable authority and senior offi cers
Remuneration of Members of the accountable authorityThe number of members of the accountable authority, whose total fees, salaries, superannuation,non-monetarybenefitsandotherbenefitsforthefinancialyearfallwithin the following bands are:
*-IncludestheChiefExecutivewhoisaseniorofficerandamemberoftheaccountableauthority.
$ $ 1/7/07 to30/6/08
1/1/07 to30/6/07
0 - 10,000 0 4
10,001 - 20,000 3 1
20,001 - 30,000 1 0
40,001 - 50,000 1 0
120,001 - 130,000 0 1*
250,001 - 260,000 1* 0
6 6
Notes to the Financial Statements for the year ended 30 June 2008
61

28
1/7/07 to30/6/08($’000)
1/1/07 to30/6/07($’000)
The total remuneration of members of the accountable authority is: 385 181
The total remuneration includes the superannuation expense incurred by the Authority in respect of members of the accountable authority.
NomembersoftheaccountableauthorityaremembersofthePensionScheme.
RemunerationofSeniorOfficersThenumberofseniorofficers,otherthanseniorofficersreportedasmembersoftheaccountable authority, whose total fees, salaries, superannuation, non-monetary benefitsandotherbenefitsforthefinancialyear,fallwithinthefollowingbandsare:
Thetotalremunerationofseniorofficersis: 765 387
The superannuation included here represents the superannuation expense incurred by the Authority in respect of senior officersotherthanseniorofficersreportedasmembersoftheaccountableauthority.
OneseniorofficerisamemberofthePensionSchemeasat30June2008(oneseniorofficerasat30June2007).
39. Financial Instruments
(a) Financial Risk Management Objectives and Policies
FinancialinstrumentsheldbytheAuthorityarecashandcashequivalents,restrictedcashandcashequivalents,receivables,repayablegrant,payablesandotherliabilities.TheAuthorityhaslimitedexposuretofinancialrisks.TheAuthority’soverallriskmanagementprogramfocusesonmanagingtherisksidentifiedbelow.
Credit risk
CreditriskariseswhenthereisthepossibilityoftheAuthority’sreceivablesdefaultingontheircontractualobligationsresultinginfinanciallosstotheAuthority.TheAuthoritymeasurescreditriskonafairvaluebasisandmonitorsriskonaregular basis.
Themaximumexposuretocreditriskatbalancesheetdateinrelationtoeachclassofrecognisedfinancialassetsisthegrosscarryingamountofthoseassetsinclusiveofanyprovisionsforimpairment,asshowninthetableatNote39(c).
The Authority trades only with recognised, creditworthy third parties. The Authority has policies in place to ensure thatsales of products and services are made to customers with an appropriate credit history. In addition, receivable balancesaremonitoredonanongoingbasiswiththeresultthattheAuthority’sexposuretobaddebtsisminimal.Therearenosignificantconcentrationsofcreditrisk.
$ $ 1/7/07 to30/6/08
1/1/07 to30/6/07
20,001 - 30,000 0 1
30,001 - 40,000 1 0
50,001 - 60,000 0 1
60,001 - 70,000 0 2
80,001 - 90,000 0 1
90,001 - 100,000 0 1
130,001 - 140,000 3 0
140,001 - 150,000 1 0
180,001 - 190,000 1 0
6 6
Notes to the Financial Statements for the year ended 30 June 2008
62

29
The accounts of the customers overdue are regularly reviewed and the credit limit may be suspended until the account isbroughtuptodate.Whereitiseconomictodoso,theAuthorityreferslargeunpaiddebtstotheStateSolicitor’sOfficeforlegalaction.
Provisionforimpairmentoffinancialassetsiscalculatedbasedonpastexperience,andcurrentandexpectedchangesinclientcreditratings.Forfinancialassetsthatareeitherpastdueorimpaired,refertoNote23‘Receivables’.
Liquidity Risk
The Authority is exposed to liquidity risk through its trading in the normal course of business.LiquidityriskariseswhentheAuthorityisunabletomeetitsfinancialobligationsastheyfalldue.
TheAuthorityhasappropriateprocedurestomanagecashflowsincludingdrawdownsofappropriationsbymonitoringforecastcashflowstoensurethatsufficientfundsareavailabletomeetitscommitments.
Market Risk
TheAuthority’stradinginforeigncurrencyisminimal.TheAuthorityisexposedtointerestrateriskprimarilyoncashandcashequivalents.Therepayablegrantisnon-interestbearingandtherearenoborrowingsorTreasurer’sadvance. (b) Categories of Financial Instruments
Inadditiontocash,thecarryingamountsofeachofthefollowingcategoriesoffinancialassetsandfinancialliabilitiesat the balance sheet date are as follows:
2008 2007
Financial Assets
Cash and cash equivalents 19,064 24,322
Restricted cash and cash equivalents 683 413
Receivables * 22,484 14,097
Amounts receivables for services 23,898 22,728
66,129 61,560
Financial Liabilities
Payables 10,081 5,030
Repayable Grant 89 237
Other Liabilities 4,291 2,955
14,461 8,222
*TheamountofReceivablesexcludesGSTreceivablefromtheATO.
(c) Financial Instrument disclosures
Credit Risk, Liquidity Risk and Interest Risk Exposure
ThefollowingtabledetailstheAuthority’sexposuretoliquidityriskandinterestrateriskasatthebalancesheetdate.TheAuthority’smaximumexposuretocreditriskatthebalancesheetdateisthecarryingamountofthefinancialassetsas shown on the following table. The table is based on the information provided to senior management of the Authority.
TheAuthoritydoesnotholdanycollateralassecurityorothercreditenhancementsrelatingtothefinancialassetsitholds.
TheAuthoritydoesnotholdanyfinancialassetsthathadtohavetheirtermsrenegotiatedthatwouldhaveotherwiseresulted in them being past due or impaired.
Notes to the Financial Statements for the year ended 30 June 2008
63

30
*TheamountofReceivablesexcludesGSTreceivablefromtheATO.
Interest Rate Sensitivity Analysis
ThefollowingtablerepresentsasummaryoftheinterestratesensitivityoftheAuthority’sfinancialassetsandliabilitiesatthebalancesheetdateonthesurplusfortheperiodandequityfora1%changeininterestrates.Itisassumedthatthe change in interest rates is held constant throughout the reporting period.
FINANCIAL INSTRuMENTSAS AT 30/6/08
WEIGHTED AVERAGEEFFECTIVE INTEREST
RATE %
VARIABLEINTEREST RATE
($’000)
NON INTEREST BEARING
($’000)
TOTAL
($’000)
Financial assets
Cash and cash equivalents 6.906 19,017 47 19,064
Restricted cash and cash equivalents
6.906 683 - 683
Receivables * - 22,484 22,484
Amounts receivable for services - 23,898 23,898
19,700 46,429 66,129
Financial liabilities
Payables - 10,081 10,081
Repayable grant - 89 89
Other liabilities - 4,291 4,291
- 14,461 14,461
FINANCIAL INSTRuMENTSAS AT 30/6/07
WEIGHTED AVERAGEEFFECTIVE INTEREST
RATE%
VARIABLE INTEREST RATE
($’000)
NON INTEREST BEARING
($’000)
TOTAL
($’000)
Financial assets
Cash and cash equivalents 6.142 24,275 47 24,322
Restricted cash and cash equivalents
- 413 413
Receivables * - 14,097 14,097
Amounts receivable for services - 22,728 22,728
24,275 37,285 61,560
Financial liabilities
Payables - 5,030 5,030
Repayable grant - 237 237
Other liabilities - 2,955 2,955
- 8,222 8,222
Notes to the Financial Statements for the year ended 30 June 2008
64

31
Fair Values
Allfinancialassetsandliabilitiesrecognisedinthebalancesheetarerecognisedatamountsthatrepresentareasonableapproximation of fair value unless otherwise stated in the applicable notes.
40. Contingent liabilities and contingent assets
Contingent liabilities
Inadditiontotheliabilitiesincorporatedinthefinancialstatements,theAuthorityhasthefollowingcontingentliabilities:(i)TheAuthorityhaspendingorpotentiallitigationthatmayaffectthefinancialpositiontothevalueof$590,359.(ii)ThereispotentialforCopyrightAgencyLimitedand/orindividualsurveyorstoclaimagainsttheStateofWestern Australia and/or Landgate in respect of: (a)copyingsurveyors’plansforpublicuse;and (b)Landgate’suseofplanstocreateproductsandservicesfollowingthedecisionoftheFederalCourtofAustraliainCopyright Agency Limited v State of New South Wales [2007] FCAFC 80 (5 June 2007) and the decision of the High Court of Australia in Copyright Agency Limited v State of New South Wales [2008] HCA 35 (6 August 2008). Thepotentialclaimscannotbequantifiedatthispoint.TheimpactofthetwodecisionsrequiresdetailedassessmentanditislikelythatadvicewillbesoughtfromStateSolicitor’sOffice. Contingent assets
TheAuthorityhasnocontingentassetsotherthanthosereportedinthefinancialstatements.
41. Intellectual property
TheAuthority’sintellectualpropertyconsistsofsoftware;data;recordscreatedandprocessesdevelopedbytheAuthorityasaresultofitsactivityandtransactions;publications;products;trademarksandknow-how;inthecategorieslisted below. At balance sheet date the intellectual property cannot be reliably measured, and accordingly has not been recognisedasanassetinthefinancialstatements.Moreover,AASB138‘IntangibleAssets’doesnotallowinternallygenerated brands, mastheads, publishing titles, customer lists and items similar in substance to be recognised as assetsinthefinancialstatements:
-1% Change +1% Change
2007
CARRyAMOuNT
$000PROFIT
$000EQuITy
$000PROFIT
$000EQuITy
$000
Financial assets
Cash and cash equivalents 24,275 (243) (243) 243 243
TotalIncrease/(Decrease) (243) (243) 243 243
-1% Change +1% Change
2008
CARRyAMOuNT
$000PROFIT
$000EQuITy
$000PROFIT
$000EQuITy
$000
Financial assets
Cash and cash equivalents 19,017 (190) (190) 190 190
Restricted cash and cash equivalents
683 (7) (7) 7 7
TotalIncrease/(Decrease) (197) (197) 197 197
Notes to the Financial Statements for the year ended 30 June 2008
65

32
1)AirPhotographyAcollectionofsingleimagesandmosaicsofWesternAustralia.Thecollectiondatesfrom1948tothecurrenttimeandhassignificanthistoricalimportance. 2)SpatialCadastralDatabase Information about land parcel boundaries including freehold and crown lots. Also includes lodged cadastral boundaries, control marks, easements, surveyed mining tenement and administrative boundaries. 3)GeodeticSurveyMarksDatabase Information that maintains a viable reference framework infrastructure for all survey, mapping and associated land information purposes in Western Australia. 4)GEONOMADatabasePlace,featureandroadnameinformationforWesternAustralia,includingposition,origin,meaningandclassification of names. 5)VariousRegisteredTrademarks,InternetdomainnamesandBusinessnames. 6)Copyright,design,artworkand“knowhow”relatedtomappingproducts(digitalandanalogue)andpublications(includinginternetdesign). 7)Tenure*TenureSystems-systemscontainingdescriptionsofhowlandisheld,egfreeholdorreserve. * Title and Document Images and hardcopy - digital and historical hard copies of titles, surveys and documents that are held in a central location. 8)TopographicDatabase/Geodatabase Repository of all geographic land information stored in terms of relief, cultural, transport, road centreline, hydrography, coastlines and points of interest.
9)SatelliteImagery Digital datasets of satellite acquired images maintained in a catalogue archive. 10)NativeTitleDatabaseSpatialdatadepictingexternalboundariesofNativeTitleApplicationsandIndigenousLandUseAgreements(ILUAs).NativeTitleApplicationsareseparatedintothreedatasets-*ApplicationsfiledintheFederalCourt.*ApplicationsregisteredwithNationalNativeTitleTribunal(NNTT). * Determined Applications. 11)ThematicDatabasesDatafundamentallyusedinthepreparationofthematicmappingproducts,egStreetSmartTouringMaps,CityandTownSeries,StreetExpress,StreetDirectory,EmergencyServiceDirectoriesandWATravellersAtlas. 12)LandandPropertyImprovementsDatabase A repository that contains a description of the physical characteristics of land and improvements to land. 13)LandValuationsDatabase A database of current and previous values determined by the Valuer General. 14)PropertySalesandRentalsDatabase A repository of historical sales and rental information integrated with land and property descriptions. 15)ComputerAssistedValuationMethodology A suite of integrated software that assists with the mass appraisal of values.
Notes to the Financial Statements for the year ended 30 June 2008
66

33
16)WorkManagementSystemDatabase A suite of software that provides the recording and allocation of human resources across services. 17)Property/ValuationGIS Integrated spatial and textual data displayed via a customised suite of software. 18)CustomerInformationAcollectionoflistsanddatabasesthatmakeuptheAuthority’sinformation,locationdata,commercialactivityand interactions. 19)TRIMDatabase A register of hard copy records. 20)PropertyStreetAddressDatabase A database of current property street address details and geocodes of all property in Western Australia. 21)SoilGradeClassificationSketchesAnalogueSoilClassificationSketchesforagriculturallandthroughoutWesternAustraliausedforratingvaluations.
42. Events occurring after the balance sheet date
Therehavebeennosignificanteventsoccurringafter30June2008thataffectthesefinancialstatements.
1/7/07 to30/6/08($’000)
1/1/07 to30/6/07($’000)
43. Remuneration of auditor
Remuneration payable to the Auditor General for the reporting period is as follows:
Auditingtheaccounts,financialstatementsandperformanceindicators 152 84
44. Affi liated body
TheLandSurveyors’LicensingBoardisanaffiliatedbodyinthatitreceivedadministrativesupportandagrantof$10,000fromtheAuthority.TheBoardisnot subject to the operational control of the Authority and reports to Parliament separately. 10 0
1/7/07 to30/6/08
($)
1/1/07 to30/6/07
($)
45. Supplementary fi nancial information (expressed in whole dollars)
(a) Write offs
(i)Publicandotherpropertywrittenoff-
- Approved by Minister 0 140,000
- Approved by Accountable Authority 20,435 0
20,435 140,000
Amount recovered from Insurance 0 (140,000)
20,435 0
Notes to the Financial Statements for the year ended 30 June 2008
67

1/7/07 to30/6/08
($)
1/1/07 to30/6/07
($)
34
(ii)BadDebts
- Approved by Accountable Authority 28,004 0
(b) Losses through theft, defaults and other causes
Losses of public monies and public and other property through theft or default 370 371
Amount recovered 0 0
370 371
(c) Gifts of Public Property
Gifts of public property provided by the Authority 6,890 2,484
1/7/07 to30/6/08($’000)
1/1/07 to30/6/07($’000)
46. Special purpose accounts
SpecialPurposeAccountsection16(1)(c)ofFinancialManagementAct
Payroll Deductions
The purpose of the special purpose account is to hold income tax instalments and GovernmentEmployeesHousingAuthority(GEHA)rentcontributions,deductedfromsalaries and wages of employees of the Landgate Group Payroll.
Opening balance 0 0
Receipts 14,726 6,498
Payments
TheAustralianTaxationOffice (14,726) (6,498)
Closing balance 0 0
This special purpose account is reported on a cash basis.
47. Indian Ocean Territories Service Delivery Arrangement
TheprovisionofservicestotheIndianOceanTerritories(IOT)isrecoupedfromtheCommonwealth government.
Opening balance 3 7
Receipts 34 53
Payments (24) (57)
Closing balance 13 3
Notes to the Financial Statements for the year ended 30 June 2008
68

35
48. Explanatory Statement
Thisstatementprovidesdetailsofanysignificantvariationsbetweenestimatesandactualresultsfor2008andbetweentheactualresultsfor2007and2008.Significantvariationsareconsideredtobethosegreaterthan10%or$1m.
(i) Signifi cant variances between estimate and actual results for the fi nancial year.
2008Estimate
($’000)
2008Actual
($’000)Variance
($’000)
Income
Provision of services 85,317 82,299 (3,018)
Interest revenue 1,500 1,734 234
Other revenue 1,500 1,189 (311)
Expenses
Employeebenefitexpenses 62,575 64,529 (1,954)
Suppliesandservices 25,751 21,373 4,378
Grants and subsidies from Government
Resources received free of charge 429 385 (44)
Liabilities assumed by the Treasurer 2,284 0 (2,284)
Explanation of variations:
Provision or service
Provision of service revenue is less than estimate mainly due to less revenue from land registrations due to a slow down in property market activity.
Interest revenue
Interest revenue is higher than the estimate due to commercial interest rates rising higher than anticipated. Other
Other revenue is lower than the estimate mainly due to grant revenues not being realised to the levels anticipated.
Employee benefi t expenses
Employeebenefitexpensewashigherthantheestimateduetoanincreaseinstafftomaintaincurrentlevelsofservicedelivery.
Supplies and services
Suppliesandserviceswaslowerthantheestimateduetolowerthananticipatedlevelsofcontractedservices.
Resources received free of charge
Resources received free of charge is less than the estimate mainly due to lower notional legal costs.
Liabilities assumed by the Treasurer
Liabilities assumed by the Treasurer is lower than the estimate as a consequence of the assumed liability by the Treasurerbeinglessthanthelastyearsliability.HencethereisanilexpenseorrevenueforSuperannuation–definedbenefitplansinthisfinancialyear.
Notes to the Financial Statements for the year ended 30 June 2008
69

36
(ii) Signifi cant variances between actual and prior year actual.
ThisistheAuthority’sfirstfullyearofoperations.Theinauguralstatementswerefortheperiod1January2007to30June 2007. Prior period actuals for the full year are therefore not available. With the current reporting period covering twelve months and the comparatives relating to actuals for only six months, explanations of variations between the current year and prior year actuals are not provided as it is not considered practicable to do so.
Notes to the Financial Statements for the year ended 30 June 2008
70

37
SERVICEACCESS TO
LAND INFORMATIONVALuATIONS
ACCESS TO GOVERNMENTGEOGRAPHIC INFORMATION
TOTAL
1/7/07 to 30/6/08($’000)
1/1/07 to 30/6/07($’000)
1/7/07 to 30/6/08($’000)
1/1/07 to 30/6/07($’000)
1/7/07 to 30/6/08($’000)
1/1/07 to 30/6/07($’000)
1/7/07 to 30/6/08($’000)
1/1/07 to 30/6/07($’000)
Income
Revenue
Provision of services 66,100 33,506 16,199 5,940 0 0 82,299 39,446
Saleofmaps,imagesandinformation 4,995 2,438 5 0 0 0 5,000 2,438
International service 1,013 602 0 0 0 0 1,013 602
Interest revenue 1,537 931 185 112 12 7 1,734 1,050
Other revenue 980 818 12 0 197 0 1,189 818
Gains
Gain on disposal of non-current assets 0 9 0 0 0 0 0 9
Total income 74,625 38,304 16,401 6,052 209 7 91,235 44,363
Expenses
Employeebenefitexpenses 48,453 22,902 15,439 7,050 637 396 64,529 30,348
Supplies&services 19,837 11,875 985 235 551 189 21,373 12,299
Other expenses 7,778 4,136 1,566 1,067 481 485 9,825 5,688
Depreciation and amortisation expense 7,297 2,667 750 387 14 8 8,061 3,062
Accommodation expenses 8,252 4,402 1,494 1,021 180 80 9,926 5,503
Cost of sales 156 69 0 0 0 0 156 69
Loss on disposal of non-current assets 16 0 0 0 0 0 16 0
Total expenses 91,789 46,051 20,234 9,760 1,863 1,158 113,886 56,969
Profi t/(loss) before grants and subsidies from State Government (17,164) (7,747) (3,833) (3,708) (1,654) (1,151) (22,651) (12,606)
Grants and subsidies from State Government
Serviceappropriations 17,721 9,985 3,965 2,579 1,636 1,147 23.322 13,711
Resources received free of charge 320 153 47 80 18 2 385 235
Liabilities assumed by the Treasurer 0 293 0 130 0 2 0 425
Total grants and subsidies from State Government 18,041 10,431 4,012 2,789 1,654 1,151 23,707 14,371
Profi t/(loss) before income tax equivalent (expense)/benefi t 877 2,684 179 (919) 0 0 1,056 1,765
Income tax equivalent (expense)/benefi t (50) 3,701
Profi t/(loss) for the period 1,006 5,466
49. Schedule of Income and Expenses by Service
Notes to the Financial Statements for the year ended 30 June 2008
71

72
Certification of Key Performance Indicators
In the opinion of the Board of Management, Western Australian Land Information Authority, the accompanying key performance indicators:
• arebasedonproperrecords;
• arerelevantandappropriateforassistinguserstoassesstheAuthority’sperformance;and
• fairlyrepresenttheAuthority’sperformancefortheyearended30June2008.
KatrinaBurton GailCurtisMember MemberBoard of Management Board of ManagementWestern Australian Land Information Authority Western Australian Land Information Authority
9September2008 9September2008
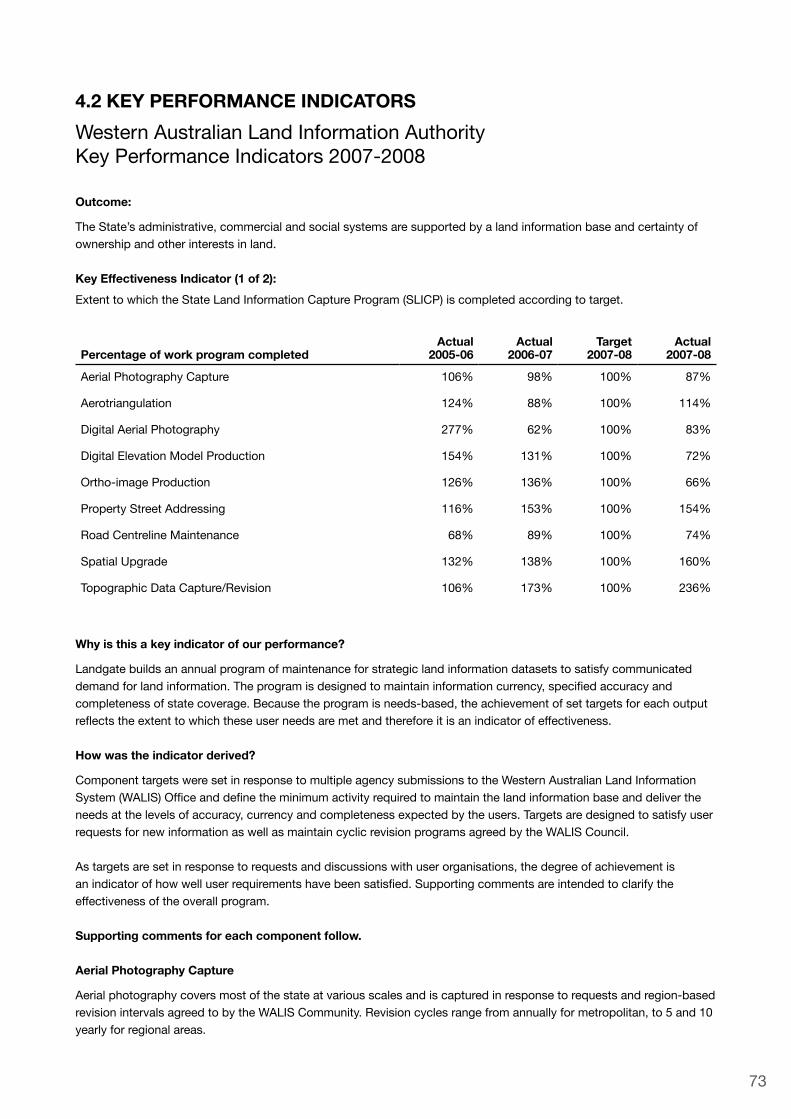
4.2 KEY PERFORMANCE INDICATORS
73
1
Western Australian Land Information AuthorityKey Performance Indicators 2007-2008
Outcome:
TheState’sadministrative,commercialandsocialsystemsaresupportedbyalandinformationbaseandcertaintyofownership and other interests in land.
Key Effectiveness Indicator (1 of 2):
ExtenttowhichtheStateLandInformationCaptureProgram(SLICP)iscompletedaccordingtotarget.
Percentage of work program completedActual
2005-06Actual
2006-07Target
2007-08Actual
2007-08
Aerial Photography Capture 106% 98% 100% 87%
Aerotriangulation 124% 88% 100% 114%
Digital Aerial Photography 277% 62% 100% 83%
Digital Elevation Model Production 154% 131% 100% 72%
Ortho-image Production 126% 136% 100% 66%
PropertyStreetAddressing 116% 153% 100% 154%
Road Centreline Maintenance 68% 89% 100% 74%
SpatialUpgrade 132% 138% 100% 160%
Topographic Data Capture/Revision 106% 173% 100% 236%
Why is this a key indicator of our performance?
Landgate builds an annual program of maintenance for strategic land information datasets to satisfy communicated demandforlandinformation.Theprogramisdesignedtomaintaininformationcurrency,specifiedaccuracyandcompleteness of state coverage. Because the program is needs-based, the achievement of set targets for each output reflectstheextenttowhichtheseuserneedsaremetandthereforeitisanindicatorofeffectiveness.
How was the indicator derived?
Component targets were set in response to multiple agency submissions to the Western Australian Land Information System(WALIS)Officeanddefinetheminimumactivityrequiredtomaintainthelandinformationbaseanddelivertheneeds at the levels of accuracy, currency and completeness expected by the users. Targets are designed to satisfy user requestsfornewinformationaswellasmaintaincyclicrevisionprogramsagreedbytheWALISCouncil.
As targets are set in response to requests and discussions with user organisations, the degree of achievement is anindicatorofhowwelluserrequirementshavebeensatisfied.Supportingcommentsareintendedtoclarifytheeffectiveness of the overall program.
Supporting comments for each component follow.
Aerial Photography Capture
Aerial photography covers most of the state at various scales and is captured in response to requests and region-based revisionintervalsagreedtobytheWALISCommunity.Revisioncyclesrangefromannuallyformetropolitan,to5and10yearly for regional areas.
73

2
Western Australian Land Information AuthorityKey Performance Indicators 2007-2008
Theamount(numberofframes)ofcapturedphotographyvarieseachyeardependingonscalerequirementsandregionallocation.In2007-08,87%oftherequiredcapturewascompleted;however,theremainderwascommittedforcapture. This year an effort was made to capture remote indigenous communities which contribute a small number of framestotheprogrambutarecurrentlyofparticularinteresttoagencies.Theremotenessanddifficultyinacquiringthese sites includes changing weather patterns which have impacted the ability to complete the program within the strict bounds of the program year.
Aerotriangulation Adjustment
Aero-triangulation is the process that relates air photography to the ground and therefore to maps and other physical information. It is fundamental to many of the downstream outputs that rely on the image to develop other products. In 2007-08, the aerotriangulation target number of processed frames was achieved. The effectiveness of this output is reflectedinitssupportofthecustomerneedforseamlessgeo-referencedimageproductsthataresuitableasabaseforGeographicInformationSystems(GIS).
Digital Aerial Photography - Increase in State Coverage
Landgate’sdigitisingofnewfilmbasedaerialphotographybothrevisesandextendsthestate’sdigitalimagecovertosatisfy the growing demand for digital access. As cover expands across the state, the proportion of digitising that adds tocoveragebecomeslower.Forinstancethearidzonesareseldomrequestedandmayneverbecoveredasadequatesatelliteimageryisavailable.In2007-08,thetargetestimatewasnotachievedforthisreason.Todate,75%ofthestate’sphotographycoveragehasbeendigitised.Thisisequivalentto60%oftheState’sarea.
Digital Elevation Model Production
DigitalElevationModels(DEMs)area3-Ddepictionofthelandsurfaceusingimagecomparisontechnology.Theyare used in the preparation of the corrected air photography images and are in demand for earth and environmental modeling. DEMs require manual editing in heavily vegetated and/or complex coastal areas. Coastal areas have been a focus of activity in 2007-08 and whilst impacting unit output, this editing effort has provided higher quality products to users.
Ortho-image/mosaic Production
Aerial photography requires correction to make it suitable as a backdrop for maps and other information. In 2007-08outputincludedcoverageofasignificantnumberofWA’stownsandremoteIndigenousCommunitiesinresponse to multiple agency requests. The remoteness and small areas involved for isolated populations requires a disproportionatelyhighprocessingeffortforeachframe.Thissatisfiedprogrammedrequestsbutresultedinfewerunitsbeing achieved against the set target.
Property Street Addressing
Enhanceddata-matchingsoftwareusedtocompareLandgate’saddressdatawithotheraddressdatasetsfromlocalgovernmentandAustraliaPostresultedinimproveddetectionandresolutionofanomalies.Thisprovidedasignificantincrease in addressing actions and overall quality.
Road Centreline Maintenance
WesternAustralia’snetworkofroadsisrepresentedasadigitaldatasetofroadcentrelineswithinformationattributesabouteachroad.AprojectcompletedinJune2008inassociationwithFESA,theDepartmentofEnvironmentandConservationandPolicehasplacedthebestoverallinformationintoamodernGeographicInformationSystem.This has upgraded the quality of the dataset to deliver higher positional accuracy, improved currency and extended attribution. Maintenance of the dataset is continuous, taking input from sources such as new surveys and road naming approvals and closures. Achievement against the estimated target is dependant on actual land development activity. In 2007-08 all incoming road maintenance was completed, however a downturn in the number of roads created and a concentration of the areas affected by lower activity into fewer tiles resulted in fewer units being achieved against the set target.
74

3
Western Australian Land Information AuthorityKey Performance Indicators 2007-2008
Spatial upgrade
TheSpatialUpgradeProgramupdatesthespatialcadastraldatabaseforspecificareasofthestateeachyear,andtheentire state will be upgraded over time. The process of spatial upgrade enhances the quality of the cadastral data to almost survey accuracy in order to better support the management and maintenance of fundamental land and property information.At30June2008,85.5%oftheentirestatehasbeenupgraded.
During2007-08,theplannedworkfortheyearwasexceededby60%.ThisincreaseinproductionwasduemainlytotheadditionofnewpointsaddedtothesystemandspatiallyupgradedaspartofongoingmaintenancewithinSpecialSurveyAreasandthecontinuingeffectsofadditionalcapitalworksfunding.
Topographic Data Capture
The large-scale topographic database provides a highly accurate and detailed map presentation of natural and man-made features and height information in urban areas. In response to user feedback indicating an optimal currency of 3years,theinformationfortheMetropolitanRegionwassignificantlyrevisedtoachievethisin2007-08.Town-sitecoverage was also expanded to meet regional growth and to achieve more up-to-date data in coastal towns where climate change factors are becoming critical to planning and mitigation decisions.
75

4
Western Australian Land Information AuthorityKey Performance Indicators 2007-2008
Outcome:
TheState’sadministrative,commercialandsocialsystemsaresupportedbyalandinformationbaseandcertaintyofownership and other interests in land.
Effectiveness Indicator (2 of 2):
Claims against registered interests, as a result of fraud, negligence or errors, settled by the Crown.
Actual2005-06
Actual2006-07
Target2007-08
Actual2007-08
Number of claims settled by Crown 1 0 0 1
Why is this a key indicator of our performance?
TheindicatorprovidesameasureoftheState’ssuccessinmaintaininganaccuratelandtitlesregister.ItshowsthesettledclaimsagainsttheStatearisingfromfraud,negligenceorerrorsinvolvingthecertaintyoflandownershipwithintheState.
How was the indicator derived?
The indicator is derived from a register that records new, current or rejected claims made for monetary compensation againsttheStateconcerningregisteredinterestsinlandundertheTransferofLandAct1893(excludesminorexgratiapayments).
Thefollowingdefinitionsapply:
“Fraud”meanstheillegalactivitiesbyapersonorpersonsotherthantheregisteredownerorownerstoeffectchangestotheexistinginterestsrecordedonaCertificateofTitleorotherlandtransactiondocument.
“Negligenceorerrors”meanstheactionsorerrorsattributedtotheRegistrarofTitlesortoconveyancers,butnotdetected,whichaffectthelandregisterorclients’abilitytosuccessfullycompletelandtransactions.
What does the indicator show?
Theverylownumberofsuccessfulclaimsindicatesthatnosignificantunderlyingtrendinvolvingfraud,negligenceorerrors is apparent.
76

5
Western Australian Land Information AuthorityKey Performance Indicators 2007-2008
Service 1:
Access to Land Information
Service description:
Information about land ownership, land boundaries and geographic features is collected, recorded and made available for use by Government, business and the community.
Key Effi ciency Indicator (1 of 2):
Actual2005-06
Actual2006-07
Target2007-08
Actual2007-08
Average cost per land registration action $25.39 $26.74 $29.03 $29.03
Why is this a key indicator of our performance?
Land registration actions include a range of activities associated with registered land transactions. The most common include document searches, examination and registration of interests on land. The last two involve incorporating changesmadetoaCertificateofTitle.Typically,changesconcernlandownershipdetailsonatitle,applicationsforanew title for subdivisional land development, caveats, leases, powers of attorney, and other minor adjustments to land titles.
The indicator provides a measure of the full cost of recording on Government guaranteed land titles the range of interests,boundariesandownershiprelevanttothatland.Thisisaclearindicatoroftheefficiencywithwhichthelandregistration system and service is maintained.
How was the indicator derived?
The number of transactions is derived from a recording and checking system that reports the number of:Documentsexaminedforregistrationagainstthetitle;•Certificatesoftitlecreated;•Documentsearchrequestsreceived;and•Number of Lots created•
The cost of registration actions includes all direct costs and an appropriate share of indirect and overhead recurrent costs. The cost of land registration actions is recovered via charges to users for each transaction. Each charge is calculated on a full cost recovery basis.
What does this indicator show?
This year, as a result of the slowing property market, Landgate saw a gradual decrease in the level of registration transactions.Althoughthenumberofregistrationactionswas0.5%lowerthantheestimate,expenditurewascontained resulting in the cost per transaction meeting target.
77

6
Western Australian Land Information AuthorityKey Performance Indicators 2007-2008
Service 1:
Access to Land Information.
Service description:
Information about land ownership, land boundaries and geographic features is collected, recorded and made available for use by Government, business and the community.
Key Effi ciency Indicator (2 of 2):
Actual2005-06
Actual2006-07
Target2007-08
Actual2007-08
Average cost per land information action $34.81 $29.05 $43.35 $36.79
Why is this a key indicator of our performance?
Land information actions include a range of activities associated with the capture, production and maintenance of physicallandandlandboundaryinformationinLandgate’sdatasets.Thesedatasetsincludeinformationabout:
Cadastre;•Geodeticmarks;•Administrativeboundaries;•Landscaperelief(iecontours);•Cultural,orbuiltenvironment,andnaturalfeatures;•Airphotography;•Satelliteimagery;•GeographicNames;•PropertyStreetAddresses;•RoadCentreline(iepositionofconstructedroads);•NativeTitleClaims;and•Baselines/territorial sea limits•
The indicator provides a measure of the full cost of maintaining an up-to-date Government land information base and thecostsinvolvedrepresentakeyindicatorofefficiency.
How was the indicator derived?
The number of actions is derived from recording systems that report the above list of items.
The cost of land information actions includes all direct costs and an appropriate share of indirect and overhead recurrent costs.
What does this indicator show?
Thenumberofactionsachievedwas11.8%higherthanthetarget,resultingintheaveragecostpertransactionbeing15.1%lowerthananticipated.Continuingtechnologyimprovements,refinementofprocessesandadditionalresourcesdealing with land boundary information actions contributed to the variance from the target.
78

7
Western Australian Land Information AuthorityKey Performance Indicators 2007-2008
Outcome:
IndependentvaluationssupportGovernments’collectionofratesandtaxes,andmanagementofpropertyassets.
Key Effectiveness Indicator (1 of 2):
International standards for accuracy and uniformity of rating and taxing values are met.
Actual2005-06
Actual2006-07
Target2007-08
Actual2007-08
Benchmark against international standards for accuracy using Median Value Price Ratio Test:
Gross Rental Value 92.93% 94.00% >92.5% 92.59%
Unimproved Value 92.38% 92.59% >92.5% 91.24%
Coefficientofdispersiontocheckuniformityofvalues:
Gross Rental Value 6.02% 4.39% <7.00% 4.69%
Unimproved Value 8.67% 11.07% <15.00% 8.13%
Why is this a key indicator of our performance?
Stateandlocalgovernmentsrelyonimpartial,uniformandaccuratepropertyvaluesasabaseforlevyingratesandtaxes. Therefore, measuring the uniformity and accuracy of valuations provides a useful indicator of our contribution to their effectiveness in meeting this outcome.
How was this indicator derived?
The uniformity and accuracy of Unimproved Values are checked against international ratio standards published by the InternationalAssociationofAssessingOfficers(IAAO)intheir‘StandardonRatioStudies’.CoefficientofDispersion(COD)andtheMedianValuePriceRatio(MPR)testsarethekeystandards.TheseareusedextensivelyinbothAustralia and New Zealand. Both were adopted as ideal indicators suited to Western Australia. Gross Rental Values are comparedagainstourownstandardsdevelopedin1998alongsimilarlinestotheIAAOlandvaluestandards.
In2005-06theMPRreplacedtheMeanRatioTest(MRT)usedbytheValuerGeneralsince1995-96.Itisnotedthatthe MPR test produces similar results to the MRT, however the Median rather than the Mean is considered to be the superiormeasure.IAAOStandardsstatethat“theoveralllevelofappraisalforajurisdiction....forvacantland....shouldbebetween90percentand110percent”,andthatthe“CoefficientofDispersion(COD)forvacantlandshouldbe20percentorless”.Inlargerurbanjurisdictionsdealingwithuniformlandreleasesandavailabilityofsales,theCODshouldbe<15%.
ForUnimprovedValuestheValuerGeneralofWesternAustraliahassetanMPRstandardof>92.5%andaCODof<15%.
While there is currently no international standard for Gross Rental Values, the Valuer General has adopted the same accuracyanduniformitymeasuresapplyingtoUnimprovedValuesbutwithatighterCODtargetof<7%.
Thequalityoftheoutcomeisreflectedintheextenttowhichtheresultsexceedtheminimumtargets.
79

8
Western Australian Land Information AuthorityKey Performance Indicators 2007-2008
What does this indicator show?
ForUnimprovedValuestheoutcomesshowthefollowing:
TheMPRof91.24%is1.26%belowthetarget>92.5%.Thisoutcomeisbelowthatachievedin2006-07and2005-06.Acontributingfactortothisyear’sresultwasthattherewasaneasinginthelandmarketandaslowdownintherateofincreaseoflandpricescomparedtothatexperiencedin2006-07.Insomeareas,pricesstartedtoeasearoundthedateofvaluationof1August2007.GiventhattheMPRisdeterminedonastatisticalanalysiscomparisonofassessedvaluestosalesoccurringbetween1Juneand31August2007,anyfallsinvalueduringthisperiodcanhavetheeffectof slightly reducing the MPR. Given the early indicators of softening market conditions, there was also the tendency by valuers to exercise a degree of caution.
TheCODof8.13%isthebestresultoverthepast3yearsandiswellinsidetheinternationalstandard.TheCODisameasure of the divergence between the assessed land values and unadjusted selling prices measured over a 3 month elapsed time wrapped around the date of valuation. With the date of valuation set almost midway within this period, it is understandable that there will be increased pressure on the COD as compared to past years, where land price movementhasbeencomparativelymuchflatter.
ForGrossRentalValuestheoutcomesshowthefollowing:
TheMPRshows92.59%againstatargetof>92.5%measuredfromasampleof7,085keyrents.Thisoutcomeisverysimilarto2006-07andiswellwithinthetargetrange.
TheCODof4.69%issimilartolastyear’sverygoodresultof4.39%,remainsconsistentwiththeresultsachievedoverthe past six years and is well inside the adopted standard.
Taken together, the results of these tests show a very satisfactory outcome.
80

9
Western Australian Land Information AuthorityKey Performance Indicators 2007-2008
Outcome:
IndependentvaluationssupportGovernments’collectionofratesandtaxes,andmanagementofpropertyassets.
Key Effectiveness Indicator (2 of 2):
Actual2005-06
Actual2006-07
Target2007-08
Actual2007-08
Adjustments to rating and taxing values as a result of Objections and Appeals as a percentage of total values in force 0.02% 0.008% <0.2% 0.012%
Why is this a key indicator of our performance?
The percentage of values amended as a consequence of owners exercising their right to challenge values is a reasonable measure of the integrity and fairness of the values contained in Valuation Rolls.
How was this indicator derived?
Thefigureisderivedbydividingthenumberofvaluesthathavebeenamendedasaresultofanobjectionorappealbythe total number of rating and taxing values in force.
What does this indicator show?
At30June2008,therewere1,856,144valuesinforceinWesternAustralia,reflectinganincreaseof19,383overthepreviousyear.Duringtheyear,only225ofthesewereamendedasaresultofformalobjectionslodgedwiththeValuerGeneralandrequestsforreviewsbeforetheStateAdministrativeTribunal.Thisindicatesthatlessthanoneinevery8,249 values was amended after formal review.
Apart from the effectiveness of the valuation process in WA, these types of results also show the stability of and acceptance of the valuation base by rate and taxpayers.
81

10
Western Australian Land Information AuthorityKey Performance Indicators 2007-2008
Service 2:
Valuations.
Service description:
An impartial valuation and property consultancy service.
Key Effi ciency Indicator:
Actual2004-05
Actual2005-06
Actual2006-07
Target2007-08
Actual2007-08
Average cost per valuation $12.82 $15.47 $12.37 $11.96 $12.40
Why is this a key indicator of our performance?
The number of valuations made and the average cost per valuation provide a reliable measure of overall performance againstforecasttargetsandpreviousyears’outcomes.SomevariationdoesoccurfromyeartoyearduetothecyclicalnatureoftheGrossRentalValuation(GRV)program,with2007-08beingoneofthetwoyearsofsignificantlyheightenedGRV based mass appraisal activity in the Perth Metropolitan Region. This results in lower costs per value than the third yearofthemetropolitantriennialrevaluationprogramwhenthereissignificantlylowerGRVrevaluationactivity.2005-06providesagoodillustrationofthiswherethecostpervaluewas$15.47.
How was this indicator derived?
Cost per value refers to the total cost per value of unimproved and gross rental values including general valuations, interimvaluations,objections,appealsandqueriesmadeduringthefinancialyear,andothervaluationsincludingstampduty, market, and asset valuations, and property related valuation consultancy services.
The total cost includes all direct costs and an appropriate share of indirect and overhead recurrent costs.
What does this indicator show?
Theaveragecostpervaluationof$12.40isonly3.7%morethanthetarget$11.96andreflectshigherinputcostsinthedeliveryofthevaluationprogram.Thisoutcomewassimilartothe2006-07resultswherethecostwas$12.37againstatargetof$12.00.Itisagoodresultcomparedto2004-05,beingthesameyearoftheprevioustriennialcycle,wherethecostwas$12.82pervaluation.
82

11
Western Australian Land Information AuthorityKey Performance Indicators 2007-2008
Outcome:
CoordinatedaccesstoWesternAustralianLandInformationSystem(WALIS)communitymembers’geographicinformationsupportsthemanagementanddevelopmentoftheState.
Key Effectiveness Indicator:
UseabilityofWALISspatialinformationisdeterminedbyuserawareness,acceptanceandreuse:
Actual2004-05
Actual2005-06
Actual2006-07
Target2007-08
Actual2007-08
AwarenessPercentageincreaseinfirsttimeparticipantsatWALISfunctions. 26% 20% 25% 25% 20%
Percentage increase in repeat participants atWALISfunctions. 32% 11% 19% 15% 20%
AcceptancePercentage increase in the number of firsttimecustomersaccessingspatialinformationfromWALIScommunitymembers. 0% 0% 442%1 2% 0%
ReusePercentage increase in the number of return customers accessing spatial informationfromWALIScommunitymembers. 0% 6% 69%1 2% 33%
(1-Theactualfiguresfor2006-07havebeenadjustedtocompensateforanerrorincalculation)
Why is this a key indicator of our performance?
TheWesternAustralianLandInformationSystem(WALIS)isanallianceofStateGovernmentagencies,localgovernment and private organisations that share and make available land-related information to the private sector andthecommunity.TheroleoftheWALISOfficeistofacilitateandcoordinatethisaccesstohighqualityspatialinformation.Effectiveaccesscanbedemonstratedbytheuseabilityofspatialinformation,andthisisreflectedbyuserawareness, acceptance and reuse.
How was the indicator derived?
AwarenessismeasuredintermsofthenumberoffirsttimeandrepeatparticipantsrecordedatWALISeducationalandinformationfunctions,includingtheWALISForumthatisheldonceevery18months.TheWALISOfficemaintainscontactinformationaboutparticipantsandisabletoreportonthenumberwhoattendforthefirsttimeandthenumberwho have attended previously.
Acceptance and ReuseismeasuredintermsofthenumberofnewandexistingcustomersofWALISspatialdataandinformationcustodians.Eachyear,selectedWALISagenciescollectandreportthenumberofnewandexistingcustomerswhoaccessspatialinformation.Themethodofdatacollectionisdoneusingoneofthreemethods;collectionon12randomdates,collectionofmonthlyfiguresorcollectionofannualfigures.ThisdataisthencollatedbytheWALISOfficetodeterminetheannualaveragepercentagesfornewandrepeatcustomers.
83

12
Western Australian Land Information AuthorityKey Performance Indicators 2007-2008
What does the indicator show?
AwarenessThisindicatorshowscontinuinginterestinWALISactivities.In2007-08,WALISForumattracted744people,includingmanyfirst-timeandrepeatattendees,whichincreasedthepercentageforbothcategories.
Acceptance and ReuseTheacceptancefigurefor2007-08declined,followingtherecordnumberofnewusersin2006-07 who were interested in the booming mining sector. Conversely, a large number of these customers have continued toseekinformationfromtheDepartmentofIndustryandResources(DoIR).Thesecustomershaveledtoasignificantincreaseinthere-usefigurefor2007-08.
84

13
Western Australian Land Information AuthorityKey Performance Indicators 2007-2008
Service 3:Access to Government Geographic Information.
Service description:
LandorgeographicinformationfromWALIScommunitymembers(WCM)ismanagedinacoordinatedwaysothatdataheld by WCM can be integrated and readily accessed to meet government, business and community needs.
Key Effi ciency Indicator:
Actual2005-06
Actual2006-07
Target2007-08
Actual2007-08
AveragecostperKeyResultArea $254,167 $373,333 $294,167 $310,500
Why is this a key indicator of our performance?
TheWALISOfficeisresponsibleformanagingandcoordinatingtheachievementofitsAnnualBusinessPlan,whichaimstomeetthestrategicoutcomessetoutintheWALISStrategy2007-2010.In2007-08,theBusinessPlanagaincomprisedsixKeyResultAreaswhichrelatetotheoutcomesfoundintheWALISstrategy2007-2010.ThesesixKeyResultsAreasaredeliveredthroughtheon-goingactivitiesthatformtheWALISOfficeProjectsfoundinthebusinessplan.ThereforetheaveragecostofdeliveringthesixKeyResultAreashasbeenadoptedasausefulmeasureofefficiency.
How was the indicator derived?
ThesixKeyResultAreasarecontainedintheWALISAnnualBusinessPlan.ThetotalcostoftheseprojectsreflectstheentirecostoftheWALISOffice,andincludesalldirectcostsandanappropriateshareofindirectandoverheadrecurrent costs. The six areas are policy, relationship management, data quality, data infrastructure and access, framework and business operations.
What does the indicator show?
For2007-08,theaveragecostperKeyResultAreawas$310,500,5.6%higherthanthisyearstargetbut16.8%lowerthan2006-07.ThemarginallyhighercostcanbeattributedtothecostofrunningtheWALISForumwhichhadarecordnumberofattendees.However,revenuefromtheForumwasalsocorrespondinglygreater.
85

4.3 MINISTERIAL DIRECTIVESUndersection65(3)oftheLand Information Authority Act 2006 (the Act), Landgate is required to include in its annual reportthetextofawrittendirectiongiventoitbytheMinister,relatingtotheperformanceofLandgate’sfunctions.There were no directions given during 2007/2008.
4.4 OTHER FINANCIAL DISCLOSuRESPRICING POLICIES OF SERVICES PROVIDED
Landgate Pricing Policies
UnderTreasurer’sInstruction903,section13(i),Landgateisrequiredtoadviseofthepoliciesunderlyingthepricingofits goods and services and, where appropriate, provide references to relevant public documents that contain pricing information.
ForthemajorcategoriesofgoodsandservicesprovidedbyLandgate,thefollowingpricingpoliciesapply:
Land Registrations
The setting of fees for land transaction document registration and survey plan lodgement is made under the process contained in the Transfer of Land Act 1893, the Strata Titles Act 1985 and the Registration of Deeds Act 1856.
The basis for determining the cost of these services is in accordance with the concepts set out in “Costing and Pricing GovernmentOutputs–GuidelinesforUsebyAgencies”producedbytheDepartmentofTreasuryandFinance.The2007/2008 schedule of fees relating to document registration and survey plan lodgement was implemented on 2 July 2007. The amendment regulations detailing this schedule of fees were published in the Government Gazetteon25June2007.
Land Searches
Similarly,thescheduleoffeesforinspectingandcopying(searching)landregistrationinformation,includingcertificatesof title, survey plans and documents, was implemented on 2 July 2007 and published in the Government Gazetteon25June 2007.
Land Valuations
Pricing of valuations and valuation consulting services are made under the powers contained within the Valuation of Land Act 1978 and the Land Information Authority Act 2006.Landgate’spricingframeworkalsoapplies.
Other Goods and Services
These goods and services include:
mapsandaerialphotography;•
remotesensingsatelliteimagery;•
nativetitlemapping;•
geospatialdatasales;•
propertyvalueandsalesinformation;•
landinformationenterprises;and•
land and property market. •
86

Prices of non-regulatory goods and services produced and delivered by Landgate are determined in accordance with a pricing framework. This framework ensures that the agency complies with the pricing principles as detailed in section 16oftheLand Information Authority Act 2006,withStateGovernmentpolicyforthepricingoflandinformationandwithgovernment requirements for the costing and pricing of goods and services.
ThepricingframeworkalsoensuresthatsufficientrevenuetomeetLandgate’sbusinessobjectivesisgenerated.Processes and procedures have been developed within the pricing framework to ensure prices are set in a transparent, systematic and defensible way.
PricesapplyingtotheseproductsandservicesareavailablefromLandgate’sMidlandoffice,theLandgateCloistersOfficeandonline.
CAPITAL WORKS
Landgate’scapitalworksconsistsoffourprograms:
Data Quality ImprovementLandgate maintains fourteen fundamental datasets that are critical to the land information requirements of government and the private sector. This program ensures the data meets the quality requirements of users.
Commercial Products and ServicesThe primary activities of this program include developing web-enabled products, improving service delivery of key business solutions and extending mapping products for the commercial, private and government sectors.
Asset ReplacementThisprogramprovidesfortheongoingreplacementandupgradeofLandgate’sfacilities,includingvariousinformationtechnology assets and accommodation and third party software systems.
Business InfrastructureThisprogramimprovesefficiencyofandincreasescapacityofthebusinesssupportsystemsthatunderpinLandgate’soperations. It includes hardware, software and networks to allow improvement to customer and staff access, greater response and better functionality through automation, security and monitoring.
Capital expenditure for the year ended 30 June 2008 was as follows:
Program
Capital Expenditure
($’000)
Estimated Cost to Complete
($’000)
DataqualityImprovement 1,048 182
CommercialProductsandServices 2,035 40
Asset Replacement 2,074 366
Business Infrastructure 6,057 300
Total 11,214 888
Minor delays were experienced across all programs causing work to be carried over for completion in the early stages of2008/2009.The$888,000iscommittedexpenditureasat30June2008.
87

EMPLOyMENT AND INDuSTRIAL RELATIONS
Staff Engagement Survey
In2008,Landgateimplementeditsfirststaffengagementsurvey.Theresultswillbeusedtogaugethelevelofemployee motivation and engagement and to gather feedback about key human resources programs. Landgate plans to conduct such surveys on a regular basis.
Skills Acquisition Plan
The2007/2008corporatetrainingbudgetwasusedtofundtheSkillsAcquisitionPlan(SAP).Thisfocusedonbuildingthe skills and knowledge needed by Landgate, particularly in the areas of its core business and training to meet compliance related requirements.
CoursesincludedBusinessSystemAnalystSkills,InnovativeRecruitment,CareerDevelopment,CoachingSkills,NegotiationSkillsandManagementDevelopment.Inadditiontothis,theSAPcoveredongoingcompliancerelatedtraining,suchasOccupationalSafetyandHealth,FirstAidandGrievanceManagement.Additionalonlinecourseswereavailableforstaffthroughoure-Learningportal.AstrongfocusoftheSAPwastosupporttheLandgateInnovationProgram, with more than 200 staff attending innovation workshops.
XPT Leadership Program
TheXPTLeadershipProgram,intendedforExecutiveandseniormanagersheldarangeofworkshopsoverthepast12months.Eachwasdesignedtoaddresskeyleadershipandmanagementskillgaps.TheXPTLeadershipProgramis closely aligned to support the Innovation Program and also strengthen the strategic planning process in line with the additional requirements of Landgate becoming a statutory authority. Workshops have covered a diverse range of areas including presenting business proposals, innovation, strategic planning and strategic thinking.
Cadetship Program
This new program offered students the opportunity to work full-time and study part-time, or vice versa. They were givenon-the-jobtrainingwhichofferedpracticalexperienceinachosenstudyfield.2007/2008sawtheprogramfocusontheareasofGISandvaluations.Inaddition,Landgateofferedstudentsfinancialsupportandtheopportunitytobeconsidered for its successful graduate program upon completion of studies.
Employee Profile
Employee Representation by Division (%)
Division
2007/2008 Percent of
Employees
BusinessServices 7.92
Information Access 16.43
Information Management 14.21
InformationServices 52.65
OfficeoftheChiefExecutive 2.18
StrategicPlanningandDevelopment 6.62
Landgate’saveragefull-timeequivalentlevelfor2007/2008was933employees.Duringtheyear,219vacantpositionswerefilledonapermanentorfixedtermbasis.
88

Employee Representation by Employment Status
2006/2007 Percent of
Employees
2007/2008 Percent of
Employees
Full-time 85.8 86.53
Part-time 13.2 12.85
Casual <1 <1
Permanent 83.4 84.82
FixedTermContract 15.6 14.37
Casual <1 <1
Employee Safety and Workers Compensation
Landgate recognises its obligation to take all reasonable precautions to provide and maintain an environment that is safeandwithouthealthriskstoitsemployees,contractorsandvisitors.Safetyandhealthstandardsareunderconstantreview. This goal is achieved through the involvement of all employees.
Landgateiscommittedtoprovidingconfidential,equitableandtimelymanagementofemployeeinjuriesandillnessesinaccordance with the guidelines for injury management set down by WorkCover WA. Accordingly, Landgate provides a WorkCover WA approved workplace-based injury management and advisory service. This service is made available to employees who suffer work-related injuries/illness in accordance with the Workers’ Compensation and Injury Management Act 1981(WA).
Landgate :
Complies with all relevant heath and safety legislation and standards.•
Provides and maintains workplaces, plant and systems of work that do not expose employees to hazards.•
Provides information, instruction, training and supervision so employees can perform their work.•
Consults and cooperates with safety and health representatives and other employees at the workplace, on •occupational safety and health matters.
Provides adequate protective clothing and equipment where hazards cannot be avoided.•
Ensures safe use, cleaning maintenance, transportation and disposal of substances and plant in the workplace• .
ProvidesanInjuryManagementSystem.•
Indicator
NumberofFatalities2007/2008 0
Losttimeinjurydiseases(LTI/D)incidentrate 0.28598
Lost time injury severity rate 33.3333
89

Wellness Program
During the year, a comprehensive Wellness Calendar was implemented. Events included cancer and drug awareness sessions,retirementandlifestyleplanning,financialplanning,foodadditiveawareness,fluvaccinations,corporatemassagesandstressmanagement.Therewerealsoactivity-basedprogramssuchastheannualLandgateFunRun,TaiChi classes and Bike to Work Week.
4.5 GOVERNANCE DISCLOSuRESAninsurancepremiumfortheperiod1January2008to1January2009,totalling$13,880.00,waspaidtoindemnifyLandgates’sDirectorsagainstaliabilityincurredundersections13or14oftheStatutory Corporations (Liability of Directors) Act 1996.
4.6 OTHER LEGAL REQuIREMENTSADVERTISING
The Electoral Act 1907–Section175ZE
Inaccordancewithsection175ZEoftheElectoral Act 1907, the Western Australian Land Information Authority incurred the following expenditure in advertising, market research, polling, direct mail and media advertising:
Totalexpenditurefor2007/08was$421,127.491.
The expenditure was incurred in the following areas:2.
Advertising Agencies $27,874.00 Vinten Browning $27,874.00
Market research organisations
ResearchSolutions $98,472.07 ResearchSolutions $98,472.07
Polling organisations nil nil nil
Direct mail organisations nil nil nil
Media advertising organisations $294,781.42
Google Adwords $10,560.00
Media Decisions $284,221.42
DISABILITy AND INCLuSION PLAN OuTCOMES
(Disability Services Act 1993 S29)
Landgatecontinuestofollowthefive-yearDisabilityAccessandInclusionPlan2007-2012.AnannualprogressreportispresentedtotheDisabilityServicesCommission.
The Plan was referred to when determining customer and staff access to the newly refurbished Landgate Cloisters •Office.
Landgate has held events in its premises with a particular emphasis on, and collaboration with, the disabilities •sector.
Landgate’swebservicescontinuetobedesignedtoWC3standardsfollowingtheOfficeofe-Government•guidelines.
Landgate provides additional facilities such as TTY telephone, interpreter services in Auslan, wheelchair and •hearing impaired services in the Midland Customer Centre.
90

People with disabilities and their families and carers have the same rights as other community members to access our service information and facilities. Landgate is working to ensure that people with disabilities are given the opportunity tobeinvolvedinanypublicconsultationthroughLandgate’sComplaintsManagementSystem,anditsfeedbackmechanism, which is accessible through all customer contact media. In 2008 Landgate contributed to a project called Mapping Time. This project linked personal and historic photographs andstoriesabouttheCityofSwan,tothegeospatialdatagatheredfromgroundsurveys,aerialphotographsandsatelliteimagerytocreatedigitalartworks.ThiswasinpartnershipwithDisabilityServicesCommissionAccommodationServiceDirectorate,DisabilityintheArts,DisadvantageintheArtsAustraliaandtheCityofSwanandaimedtohelppeople with intellectual disabilities connect to their communities.
EQuAL OPPORTuNITy OuTCOMES
Women in Management
Market research organisationsObjectives
2007Actual
2007
Distribution(EquityIndex) 50 54.9
RepresentationinSES - 22.2%
ManagementTier1 - 0
Management Tier 2 - 20%
Management Tier 3 - 45%
Management Tier 2 & 3 Combined 28% 40.7%
Landgate continues to make good progress in its representation of women at senior levels.
Objectives 2007
Actual 2007
Indigenous Australians %representation 1 0.6
Equity Index 7 30.4
Culturally Diverse Backgrounds %representation 16 14.1
Equity Index 95 125.9
People with Disabilities %representation 4 1.6
Equity Index 22 58.9
Youth %representation 8.5 7
Equity Index NA NA
Note:Theequityindexisameasureof“compression”-theextenttowhichmembersofagivendiversitygroupareprimarilytobe
foundatthelowerclassificationlevels.Anindexbelow100denotesthatmembersinthegroupare“compressed”intothelower
workinglevels;thelowertheindexthegreaterthedegreeofcompression.Conversely,anindexabove100showsthatmembersinthat
grouparewellrepresentedattheupperclassificationlevels.
91

COMPLIANCE WITH PuBLIC SECTOR STANDARDS AND ETHICAL CODES (PUBLIC SECTOR MANAGEMENT ACT 1994, S31 (1) )
Human Resource Management Standards, Public Sector Standards and Ethical Codes Compliance Statement.
Statement of compliance issues and actions during 2007/2008.
LandgateiscommittedtoupholdingthePublicSectorStandardsinHumanResourceManagement,theWesternAustralianPublicSectorCodeofEthicsandLandgate’sCodeofConduct.Westrivetoreflectourvaluesofcommunity,creativity, celebration, sustainability, growth & learning and excellence in all that we do.
Public Sector Standards
TheStandardsarereadilyaccessibleonLandgate’sintranet.•
Allrecruitmentandselectiondecisionsarereviewedbyindependentofficerstoensurecompliance.•
During 2007/2008 Landgate has reviewed its policies and procedures regarding recruitment and selection to ensure •compliancewiththeStandardsaswellasstreamliningtheprocess.
Landgate runs regular training courses in areas such as recruitment and selection and Grievance Management to •ensurethatLandgateofficersareawareoftheirobligations.
Landgate fosters an environment where staff are comfortable talking about the standards and where decisions are •fair and equitable and capable of review.
NoBreachofStandardsclaimswerelodgedduring2007/2008.•
Ethics and Landgate’s Code of Conduct
TheCodeofEthicsandCodeofConductarereadilyavailableonLandgate’sintranet.•
The Code of Ethics and Code of Conduct are made available and discussed during induction sessions for new •employees.
Staffareremindedofkeyethicalissuesonaregularbasisthroughtheintranet,inductioncoursesandworkshops.•
FivebreachesoftheCodeofEthicsorCodeofConductwerefoundduring2007/2008.•
GrahameSearle
Chief Executive
92

RECORDKEEPING PLANSThefollowinginformationisprovidedasrequiredbyStateRecordsCommissionStandard2.
Landgate’sRecordkeepingPlan2004,requiredunders19oftheState Records Act 2000, was approved for a period of fiveyearsbytheStateRecordsCommissionon7October2004.
TheefficiencyandeffectivenessofcurrentrecordkeepingsystemswereevaluatedduringthedevelopmentoftheRecordkeepingPlan2004.TherehavebeennosignificantchangestorecordkeepingsinceapprovalofthePlan.Apilotimplementation of an electronic document and records management system commenced this year and a re-evaluation of the Recordkeeping Plan is planned in 2009.
InaccordancewiththePlan,onlinetraininginrecordkeepingwasintroducedinMay2005forallemployees.1164existing and past employees have been enrolled in the training that provides awareness of recordkeeping principles and issuesandsupportscompliancewiththePlan.ThetrainingreferstoLandgate’srecordkeepingpoliciesthatdescribeemployees’recordkeepingresponsibilities.
All new employees are enrolled as part of their induction training and required to complete the course within two months of enrolment.
Morethan90%ofemployeeshavecompletedthecourse,describingitasinformative,essentialorstimulating,andavaluable tool for improving their understanding of recordkeeping.
As part of the staff induction program, training in the use of the records management system itself is also provided.
4.7 INFORMATION STATEMENTAlegalrightofaccessisprovidedtodocumentsheldbyallStateandLocalGovernmentagenciesbytheFreedom of Information Act 1992 (FOI).IncompliancewithPart5oftheFOIAct,thisAnnualReportservesthepurposeasanInformationStatement.
Inreferencetodocumentsandpublicationsthatcanbepurchasedorobtainedfreeofcharge;refertotheAgency’swebsite www.landgate.wa.gov.au
FREEDOM OF INFORMATION (FOI) APPLICATIONS FOR 2007/2008
Fourteenvalidapplicationswerereceivedseekingaccesstonon-personalinformation.StatisticsaboutthoseapplicationsareprovidedintheInformationCommissioner’sAnnualReportat
www.foi.wa.gov.au.
INFORMATION ENQuIRIES
Requestsforaccesstodocumentsshouldbemade,inthefirstinstant,totheCustomerServiceOfficersattheagency’spubliccounter.OftenmaterialmaybemadeavailablewithouttheneedtoformalisearequestunderFreedomofInformation.
AformalFOIapplicationisrequiredtoaccessdocumentsthatarenotavailableaspartofthenormalcourseofbusiness.
93

RECEIPT OF FOI APPLICATIONS
FOIapplications,payments,correspondenceandgeneralenquiriesshouldbedirectedto:
FOICoordinatorLandgatePO Box 2222 MidlandWA6936
Telephone(08)92737565Facsimile(08)92737666.
FOIapplicationformsareavailablefromtheagency’swebsiteathttp://www.landgate.wa.gov.au/orfromtheFOICoordinator.
FEES AND CHARGES
TherateoffeesandchargesaresetundertheFOIAct.
Applicationfeefornon-personalinformationis$30.00.•
There are no fees for applications for personal information about the applicant.•
Chargesfordealingwiththeapplicationaresetatastandardrateof$30.00perhour,orprorataforapartofan•hour.
Chargesforsupervisinginspectionofdocumentsaresetatastandardrateof$30.00perhour,orprorataforapart•of an hour.
Chargesforphotocopyingare$30.00perhourforstafftimeand20cpercopy.•
Charges for time taken by staff transcribing information from a tape or other device are set at a standard rate of •$30.00perhour,orprorataforapartofanhour.
Chargesforduplicatingatape,filmorcomputerinformationwillbetheactualcost.•
Charges for delivery, packaging and postage will be the actual cost.•
PROCESSING APPLICATIONS
ProcessingofFOIapplicationsiscoordinatedcentrallywhileinitialdecisionmakingisgenerallydecentralisedtothemanagers responsible for the issue in question, due to their knowledge of current action.
NOTICE OF DECISION
Applicantsareprovidedwithwrittennoticeoftheagency’sdecisionincludingthefollowinginformation:
dateofthedecision;•
nameanddesignationofthedecision-maker;•
reasonsfordeletinganymatter;•
reasonsfordeferringaccess;•
arrangementsforgivingaccess;•
reasonsforrefusingaccesstoanymatter;•
theamountandbasisforanychargeslevied;and•
the rights of review and procedures to be followed.•
94

REVIEW RIGHTS
If the applicant or third party is aggrieved with a decision made by the agency, they have the right to submit a written request for a review of that decision. This must be done within 30 days after being given notice of the decision. The review will be conducted by a person other than the person who made the original decision, is not subordinate to that person,andisusuallyamemberoftheAdvisoryServicesSection.Theagencymustrespondwithawrittennoticeofdecisionwithin15days.Thereisnolodgementfeepayableforinternalreviews.
Iftheapplicantorthirdpartyisstillaggrieved,theymaylodgeawrittencomplainttotheOfficeoftheInformationCommissionerwithin60daysfollowingtheinternalreviewdecision(30daysforthirdparties).TheCommissioner’sdecisionisfinalunlessanappealismadetotheSupremeCourtonaquestionoflaw.
AMENDMENT OF PERSONAL INFORMATION
Personal information held on the public registers maintained by the agency in accordance with statutes, such as the Titles Register, maintained under the Transfer of Land Act 1893, may be amended in accordance with procedures set out in that legislation.
OtherpersonalinformationheldonagencyrecordsmaybeamendedbyapplicationtotheFOICoordinator.Thisprovision exists to ensure the agency does not unfairly harm the person referred to, misrepresent facts about them or give a misleading impression.
Applicants must provide details and, if necessary, documentation in support of their claim to amend inaccurate, incomplete, out of date or misleading information.
4.8 GOVERNMENT POLICy REQuIREMENTSCORRuPTION PREVENTION
InlinewithPremier’sCircular2005/02,Landgateisproactivelymanagingitsrisksandmonitoringitscontrolsaspartofour commitment to a high standard of corporate awareness, governance and staff ethics.
In particular Landgate has:
A Code of Conduct which is provided to all staff on induction and available on the Intranet.•
APublicInterestDisclosure(PID)officerappointedincompliancewiththe• Public Interest Disclosure Act 2003.
Updated and monitored a Gifts and Hospitality Register.•
Established an independent branch – Audit and Risk Management – which provides expertise on controls, risks, •fraud, compliance and governance reporting direct to the Board.
Commenced reviewing our strategic and operational risks to further improve our Enterprise Risk Management •framework and continue in the development of our control environment.
Independent validation of controls through our Internal Audit process.•
SuSTAINABILITy
Landgate remains committed to supporting a sustainable Western Australia through economic, social and environmentalmanagement.CommitmenttothesegoalsisreflectedinLandgate’s2007/2008StatementofCorporateIntent(SCI).TheSCIoutlineskeyinitiativestobeundertakenduringthefinancialyearandisreviewedannually.
LandgatehasupdateditsSustainabilityActionPlanforthe2007/2012period.
95

Undertakings in 2007/2008 included:
Economic
LandgatebuysgoodsandservicesinaccordancewiththesupplypoliciesissuedbytheStateSupplyCommission.•Thepoliciesincludeoneonsustainableprocurement.Sustainabilityisconsideredgenerallythroughoutthebuyingprocess rather than as a separate exercise. Landgate will continue to increase sustainable procurement in the coming years.
Landgate will continue to embrace changes in technology that lead to improvements in sustainability. This includes •energy reduction strategies.
TheStrategicDevelopmentPlan2008/2009–2012/2013wascompletedandapprovedbytheMinisterfor•LandInformation,alongwiththeTreasurer.Theplanfocusesontheagency’sstrategicobjectives,proposed
achievements,financialrequirementsandbusinessstrategy.
Social
Provision of a nursing room and appropriate facilities for parents returning to work following parental leave.•
Piloting a new program giving Landgate staff greater access to key systems and documents while working from •home.Employeesarealsoprovidedtheoptionofworkingflexiblehoursinafamilyfriendlyenvironment.
Landgate continues to develop and maintain its Equity and Diversity Plan. This is helping to ensure that the agency •is well placed in catering for a diverse customer base, while also providing opportunities and development for a wide ranging staff base.
Landgateencouragesandsupportsitsstafftocontributetowardlocalcharities,raisingmorethan$13,000during•
2007/2008.
Environmental
Recycling-LandgateinitiatedaSustainabilityActionPlanrecommendationandcommencedrecyclingof•aluminium,plasticandcardboard.SecurepapershreddingcontinuesandasofMarch2008Landgatehadrecycled34,990kgsofpaperforthefinancialyear.Thisfigureisnearly7,500kgslessthanthepreviousyearindicatingstaffare using electronic copies of documents rather than printing hard copy.
Installationofenergyefficientscrewcompressorchillersreplacingtwoexistingreciprocalcompressorchillers.•
Landgate continues to improve on its use of water. This year Landgate installed waterless urinals and this project •hasbroughtwithitannualwatersavingsof850,000litres.
Asaresultofatravelsurveyconductedin2006/2007,Landgateidentifiedanumberofstrategiestopromotegreen•travel.Landgatehassincepurchasedasmallpoolofbicyclesthatstaffcanuseforpersonalfitness,recreationaland work-related travel.
Reconciliation Action Plan
AllStateGovernmentagenciesarerequiredtodevelopReconciliationActionPlans(RAP)incollaborationwiththeDepartment of Indigenous Affairs. RAPs are being introduced across Australia.
AsalargeorganisationlocatedintheCityofSwan,whichhasahighIndigenouspopulation,Landgatecansignificantlycontribute to addressing this gap through Indigenous development and employment initiatives.
Landgate’sdraftRAParticulatesarangeofobjectivesandstrategiestoprovideworkopportunitiesforIndigenous
Australians now and into the future.
96

97
This page intentionally left blank.