landmark buildings and diversification opportunities in the residential market lucia gibilaro,...
TRANSCRIPT

Landmark Buildings and Diversification Opportunities
in the Residential Market
Lucia Gibilaro, University of [email protected]
Gianluca Mattarocci, University of Rome “Tor Vergata” [email protected]
Edinburgh – June 13td-16th , 2012

Introduction
Literature review
Empirical analysis:
Sample
Methodology
Results
Conclusions
Index

Introduction
Landmark definition is not unique but the market normally recognizes a landmark building on the basis of the following features: design, visibility and/or relevance. The design characteristics attain features like size, shape and quality, while the visibility refers to the view point distinguishability and the relevance is related to symbolism or history (Appleyard, 1969)
Literature points out the advantages related to diversification opportunities in a real estate portfolio applying the standard MPT to this market (Pagliari, Webb and Del Casino, 1995), but there are no studies using also historical or artistic features as discrimination criteria in order to identify the residential asset class.
Introduction
Research questions:
- Are landmark buildings a special type of investment in the residential market?
- Do landmark buildings improve diversification opportunities for high risk/return profile portfolios in the residential market?
Index
Introduction
Literature review
Empirical analysis:
Sample
Methodology
Results
Conclusions
Literature review (1/2)
Landmark buildings are construtions that have significant historical, architectural, cultural features that ensure their aesthetic appeal (Moon, Lee, Min, Lee, Kim and Kim, 2010).
These type of buildings may survive no longer than undistinguished structures of similar size, age, location, and function and, due to their value as public goods, Public or quasi-public authorities define a legal protection from their alteration and destruction (Hough and Kratz, 1983).
Designation of historic properties or landmark buildings typically takes one of two forms; designation of individual properties as historically significant or designation of neighborhoods as an historic district (Coulson and Leichenko, 2001).

Literature review (2/2)
Using hedonic price models, residential buildings that are designated landmarks sell for a substantial premium over comparable properties (Noonan, 2007) and the main reasons are related to a tax advantage or the utility of the design for the owner/user.
The role of the design on the price of the residential unit could be studied considering separately the internal and the external appearance (Fruest, McAllister and Murray, 2009).
Looking at the externalities, the price of the neighborhood’s houses could be biased by the existence of a landmark building and normally the price effect is higher for lower-end properties (Zahirovic-Herbert and Chatterjee, 2012).
Index
Introduction
Literature review
Empirical analysis:
Sample
Methodology
Results
Conclusions
Empirical analysis: Sample (1/2)
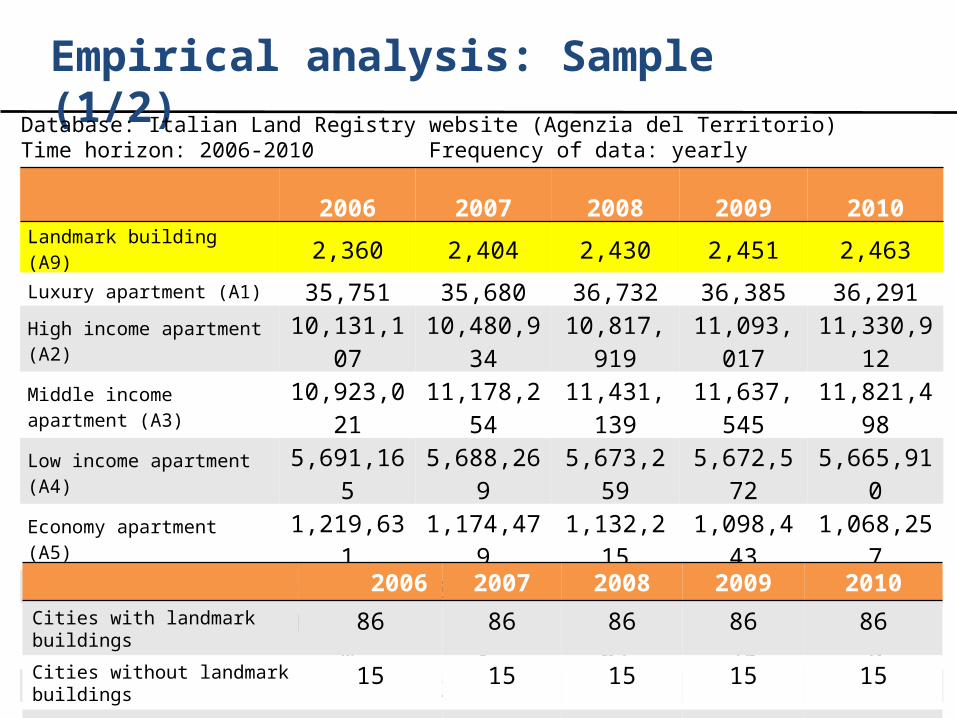
Database: Italian Land Registry website (Agenzia del Territorio) Time horizon: 2006-2010 Frequency of data: yearly
2006 2007 2008 2009 2010Landmark building (A9) 2,360 2,404 2,430 2,451 2,463Luxury apartment (A1) 35,751 35,680 36,732 36,385 36,291High income apartment (A2) 10,131,107 10,480,934 10,817,919 11,093,017 11,330,912Middle income apartment (A3) 10,923,021 11,178,254 11,431,139 11,637,545 11,821,498Low income apartment (A4) 5,691,165 5,688,269 5,673,259 5,672,572 5,665,910Economy apartment (A5) 1,219,631 1,174,479 1,132,215 1,098,443 1,068,257Rural Houses (A6) 924,773 892,253 859,111 833,421 808,526Maison (A7) 1,857,930 1,926,653 1,993,667 2,058,375 2,118,819Manor (A8) 33,870 34,227 34,288 34,427 34,628Typical accommodation (A11) 14,856 15,568 17,086 17,435 18,061
2006 2007 2008 2009 2010Cities with landmark buildings 86 86 86 86 86Cities without landmark buildings 15 15 15 15 15Mean for each city 23 24 24 24 24
Empirical analysis: Sample (2/2)
2006 2007 2008 2009 2010
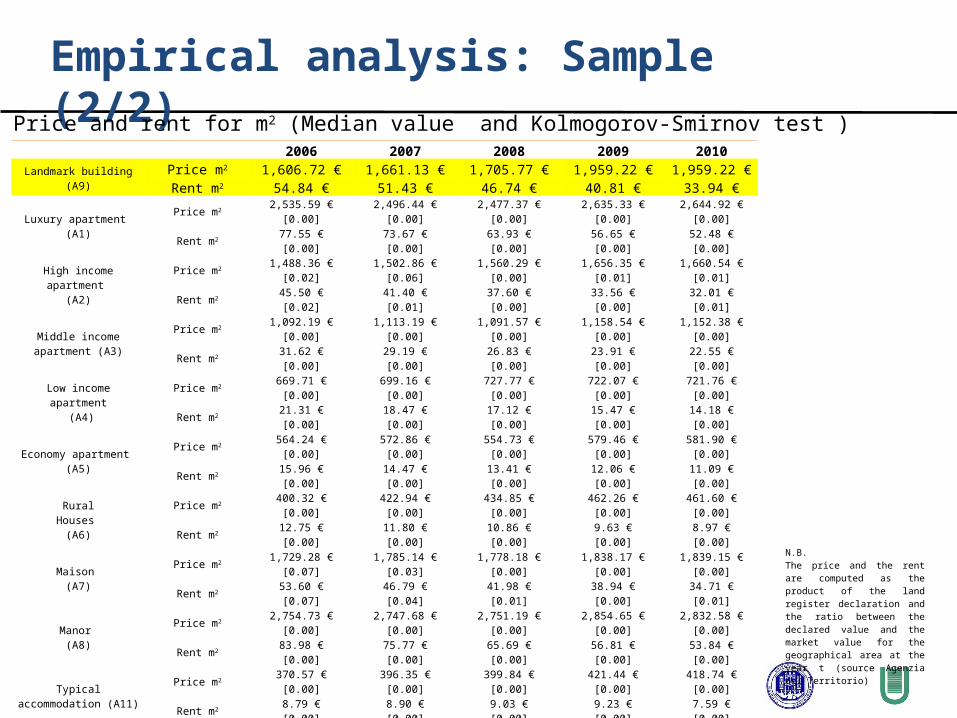
Landmark building (A9)Price m2 1,606.72 € 1,661.13 € 1,705.77 € 1,959.22 € 1,959.22 €Rent m2 54.84 € 51.43 € 46.74 € 40.81 € 33.94 €
Luxury apartment (A1)
Price m22,535.59 €
[0.00]2,496.44 €
[0.00]2,477.37 €
[0.00]2,635.33 €
[0.00]2,644.92 €
[0.00]
Rent m277.55 €[0.00]
73.67 €[0.00]
63.93 €[0.00]
56.65 €[0.00]
52.48 €[0.00]
High income apartment (A2)
Price m21,488.36 €
[0.02]1,502.86 €
[0.06]1,560.29 €
[0.00]1,656.35 €
[0.01]1,660.54 €
[0.01]
Rent m245.50 €[0.02]
41.40 €[0.01]
37.60 €[0.00]
33.56 €[0.00]
32.01 €[0.01]
Middle income apartment (A3)
Price m21,092.19 €
[0.00]1,113.19 €
[0.00]1,091.57 €
[0.00]1,158.54 €
[0.00]1,152.38 €
[0.00]
Rent m231.62 €[0.00]
29.19 €[0.00]
26.83 €[0.00]
23.91 €[0.00]
22.55 €[0.00]
Low income apartment (A4)
Price m2669.71 €
[0.00]699.16 €
[0.00]727.77 €
[0.00]722.07 €
[0.00]721.76 €
[0.00]
Rent m221.31 €[0.00]
18.47 €[0.00]
17.12 €[0.00]
15.47 €[0.00]
14.18 €[0.00]
Economy apartment (A5)
Price m2564.24 €
[0.00]572.86 €
[0.00]554.73 €
[0.00]579.46 €
[0.00]581.90 €
[0.00]
Rent m215.96 €[0.00]
14.47 €[0.00]
13.41 €[0.00]
12.06 €[0.00]
11.09 €[0.00]
RuralHouses
(A6)
Price m2400.32 €
[0.00]422.94 €
[0.00]434.85 €
[0.00]462.26 €
[0.00]461.60 €
[0.00]
Rent m212.75 €[0.00]
11.80 €[0.00]
10.86 €[0.00]
9.63 €[0.00]
8.97 €[0.00]
Maison (A7)
Price m21,729.28 €
[0.07]1,785.14 €
[0.03]1,778.18 €
[0.00]1,838.17 €
[0.00]1,839.15 €
[0.00]
Rent m253.60 €[0.07]
46.79 €[0.04]
41.98 €[0.01]
38.94 €[0.00]
34.71 €[0.01]
Manor (A8)
Price m22,754.73 €
[0.00]2,747.68 €
[0.00]2,751.19 €
[0.00]2,854.65 €
[0.00]2,832.58 €
[0.00]
Rent m283.98 €[0.00]
75.77 €[0.00]
65.69 €[0.00]
56.81 €[0.00]
53.84 €[0.00]
Typical accommodation (A11)
Price m2370.57 €
[0.00]396.35 €
[0.00]399.84 €
[0.00]421.44 €
[0.00]418.74 €
[0.00]
Rent m28.79 €[0.00]
8.90 €[0.00]
9.03 €[0.00]
9.23 €[0.00]
7.59 €[0.00]
Price and rent for m2 (Median value and Kolmogorov-Smirnov test )
N.B.The price and the rent are computed as the product of the land register declaration and the ratio between the declared value and the market value for the geographical area at the year t (source Agenzia del Territorio)
Empirical analysis: Methodology (1/3)
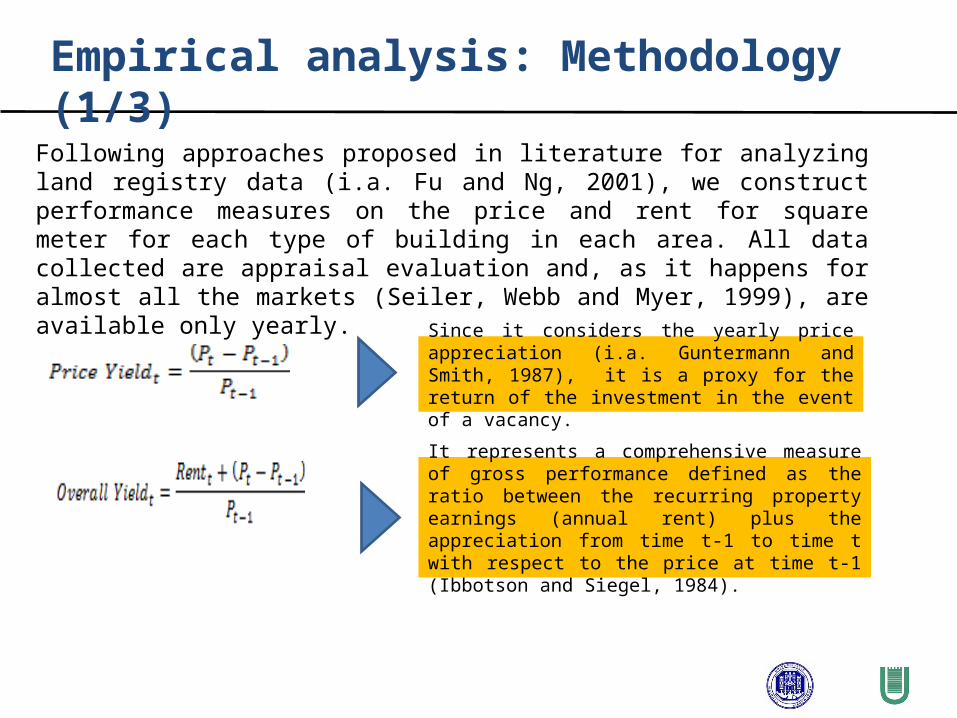
Since it considers the yearly price appreciation (i.a. Guntermann and Smith, 1987), it is a proxy for the return of the investment in the event of a vacancy.
Following approaches proposed in literature for analyzing land registry data (i.a. Fu and Ng, 2001), we construct performance measures on the price and rent for square meter for each type of building in each area. All data collected are appraisal evaluation and, as it happens for almost all the markets (Seiler, Webb and Myer, 1999), are available only yearly.
It represents a comprehensive measure of gross performance defined as the ratio between the recurring property earnings (annual rent) plus the appreciation from time t-1 to time t with respect to the price at time t-1 (Ibbotson and Siegel, 1984).
Empirical analysis: Methodology (2/3)
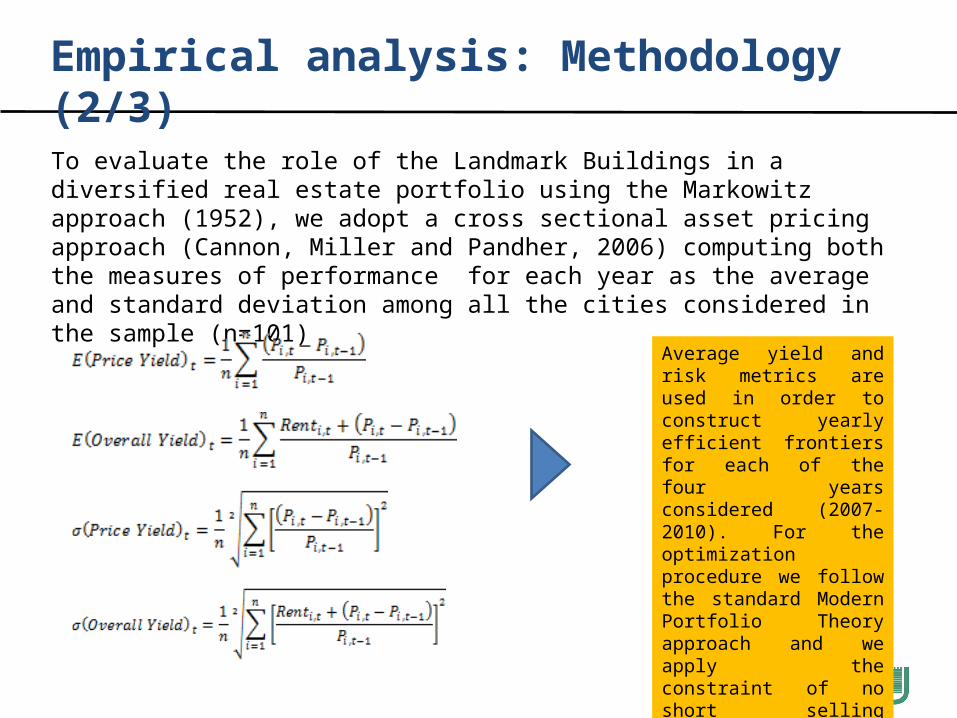
To evaluate the role of the Landmark Buildings in a diversified real estate portfolio using the Markowitz approach (1952), we adopt a cross sectional asset pricing approach (Cannon, Miller and Pandher, 2006) computing both the measures of performance for each year as the average and standard deviation among all the cities considered in the sample (n=101)
Average yield and risk metrics are used in order to construct yearly efficient frontiers for each of the four years considered (2007-2010). For the optimization procedure we follow the standard Modern Portfolio Theory approach and we apply the constraint of no short selling opportunities available
Empirical analysis: Methodology (3/3)
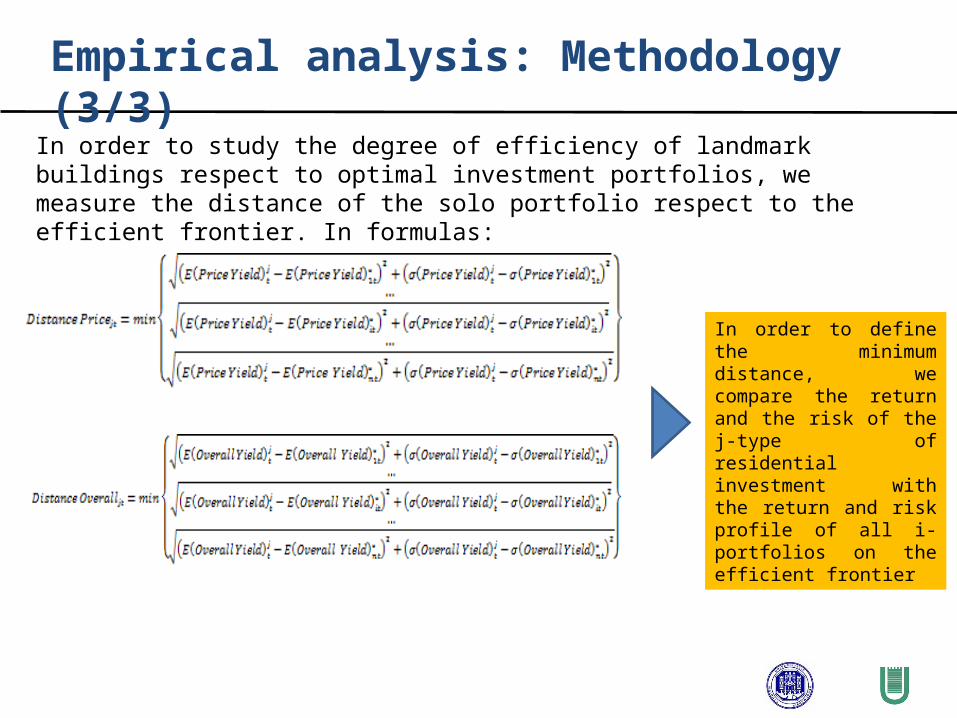
In order to study the degree of efficiency of landmark buildings respect to optimal investment portfolios, we measure the distance of the solo portfolio respect to the efficient frontier. In formulas:
In order to define the minimum distance, we compare the return and the risk of the j-type of residential investment with the return and risk profile of all i-portfolios on the efficient frontier
Empirical analysis: Results (1/5)
2007 2008 2009 2010
PriceYield
OverallYield Price
Yield
OverallYield Price
Yield
OverallYield Price
Yield
OverallYield
Landmark building(A9)
Mean 2.88% 6.52% 2.70% 5.64% 14.76% 17.23% -0.58% 1.51%
St. Dev 0.11% 0.12 0.10 0.11 0.83 0.83 0.02 0.03
Luxury apartment (A1)
Mean 1.26% 5.25% 1.59% 4.47% 5.32% 7.76% 0.12% 2.22%
St. Dev 0.10 0.12 0.10 0.11 0.26 0.27 0.01 0.01
K-S test [0.66] [0.98] [0.51] [0.87] [0.79] [0.99] [0.00] [0.01]
High income apartment(A2)
Mean 1.43% 4.94% 1.50% 4.38% 4.82% 7.26% -0.07% 2.03%
St. Dev 0.10 0.12 0.10 0.11 0.25 0.25 0.00 0.00
K-S test [0.32] [0.83] [0.36] [0.93] [0.47] [0.97] [0.00] [0.40]
Middle income apartment(A3)
Mean 1.39% 4.90% 1.39% 4.27% 4.84% 7.28% -0.12% 1.99%
St. Dev 0.10 0.12 0.10 0.11 0.25 0.26 0.01 0.00
K-S test [0.34] [0.45] [0.33] [0.63] [0.58] [0.96] [0.00] [0.50]
Low income apartment(A4)
Mean 1.45% 4.97% 1.48% 4.36% 4.97% 7.41% -0.04% 2.06%
St. Dev 0.10 0.12 0.10 0.11 0.25 0.26 0.00 0.00
K-S test [0.44] [0.67] [0.38] [0.63] [0.69] [0.89] [0.00] [0.31]
Economy apartment(A5)
Mean 1.43% 4.95% 1.46% 4.34% 4.73% 7.17% -0.06% 2.05%
St. Dev 0.10 0.11 0.10 0.11 0.25 0.25 0.00 0.00
K-S test [0.55] [0.67] [0.55] [0.63] [0.80] [0.96] [0.00] [0.83]
Rural Houses(A6)
Mean 1.38% 4.94% 1.79% 4.70% 4.41% 6.86% -0.06% 2.05%
St. Dev 0.10 0.11 0.10 0.11 0.20 0.20 0.00 0.00
K-S test [0.09] [0.42] [0.19] [0.86] [0.79] [0.97] [0.00] [0.53]
Maison(A7)
Mean 1.44% 4.96% 1.47% 4.35% 6.38% 8.72% 0.10% 2.01%
St. Dev 0.10 0.12 0.10 0.11 0.32 0.33 0.00 0.00
K-S test [0.20] [0.56] [0.28] [0.85] [0.69] [0.98] [0.00] [0.61]
Manor(A8)
Mean 1.56% 5.01% 1.63% 4.46% 5.52 7.93% -0.04 2.06%
St. Dev 0.10 0.12 0.10 0.11 0.30 0.30 0.00 0.01
K-S test [0.43] [0.60] [0.60] [0.80] [0.79] [0.96] [0.00] [0.10]
Typical accommodation(A11)
Mean 2.46% 5.99% 1.45% 4.35% 6.64 9.14% 0.11% 2.23%
St. Dev 0.10 0.12 0.10 0.10 0.18 0.18 0.02 0.02
K-S test [0.59] [0.97] [0.30] [0.93] [0.93] [0.95] [0.10] [0.97]
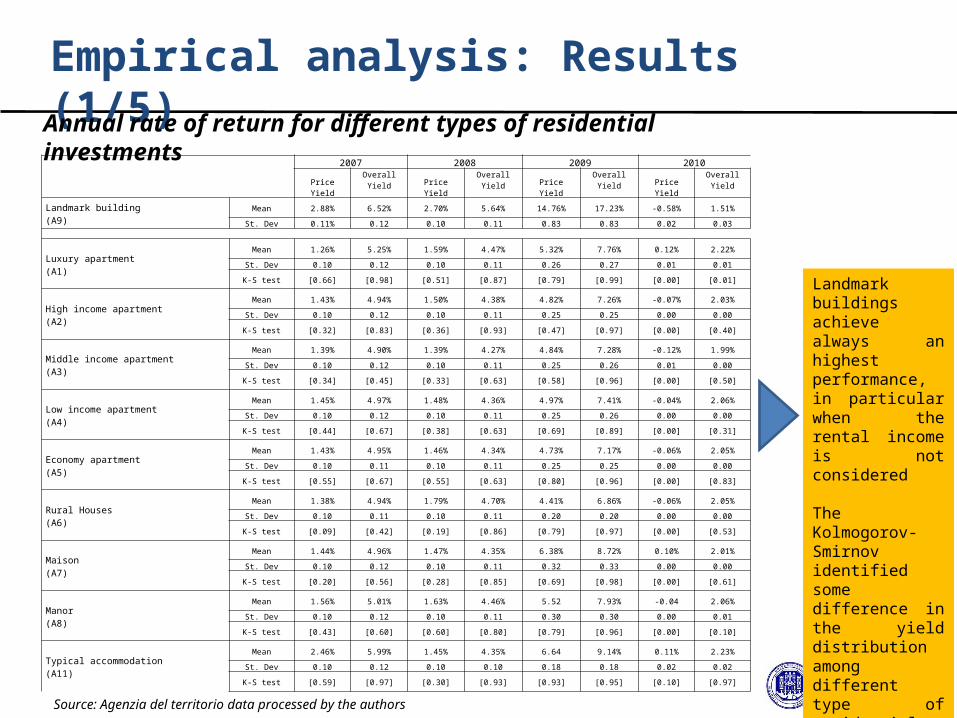
Annual rate of return for different types of residential investments
Source: Agenzia del territorio data processed by the authors
Landmark buildings achieve always an highest performance, in particular when the rental income is not considered
The Kolmogorov-Smirnov identified some difference in the yield distribution among different type of residential investment
Empirical analysis: Results (2/5)
Price Yield2007 2008 2009 2010
Overall Yield
Overall Yield2007 2008 2009 2010
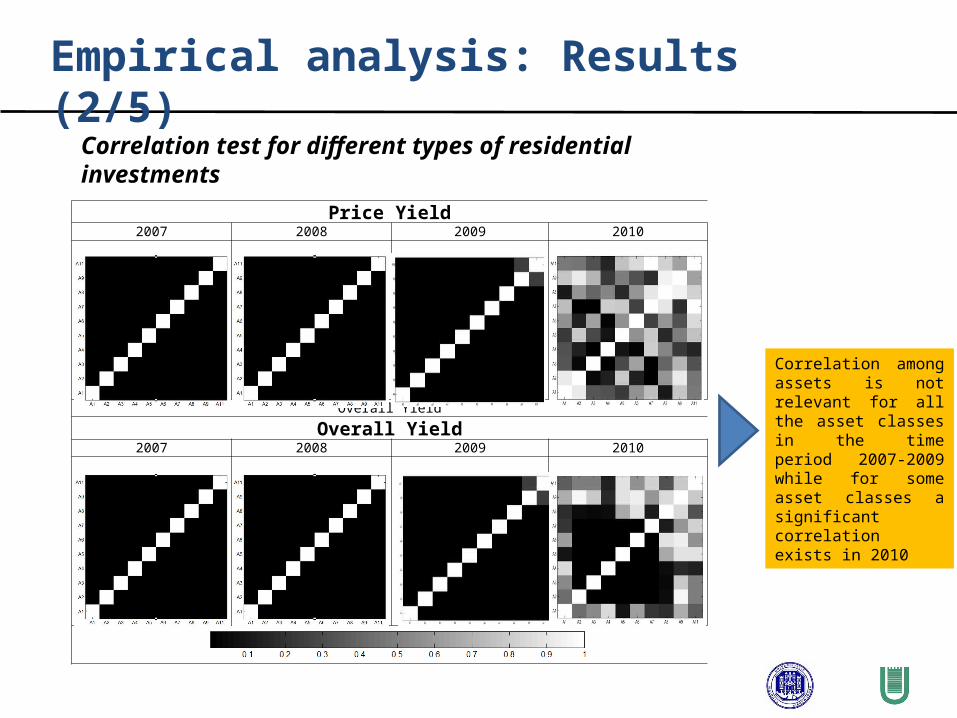
Correlation test for different types of residential investments
Correlation among assets is not relevant for all the asset classes in the time period 2007-2009 while for some asset classes a significant correlation exists in 2010
Empirical analysis: Results (3/5)
2007 2008
2009 2010
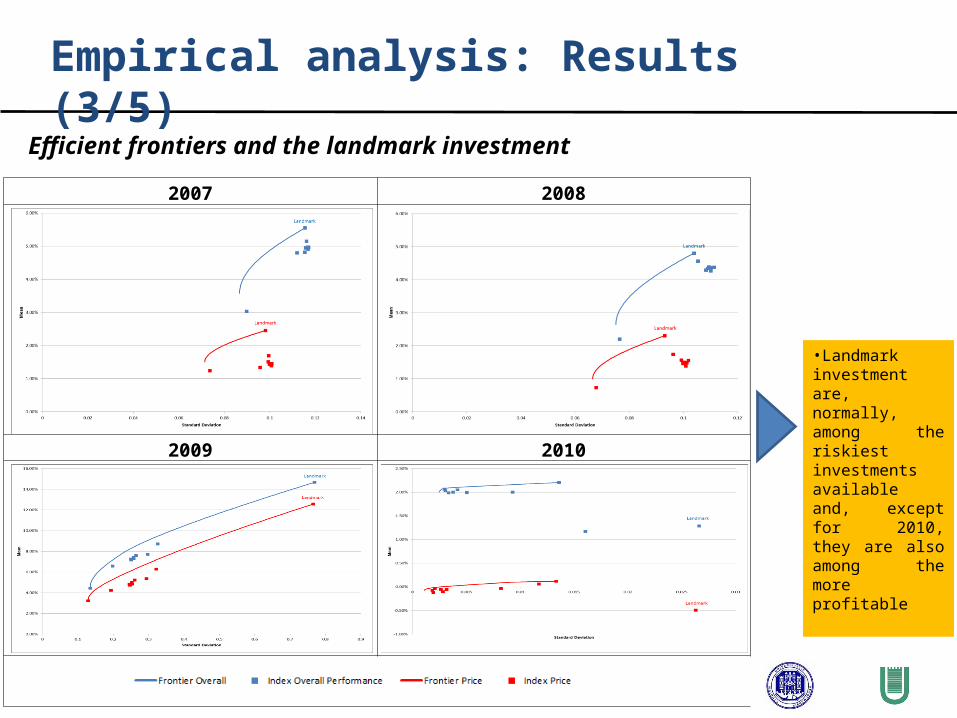
Efficient frontiers and the landmark investment
•Landmark investment are, normally, among the riskiest investments available and, except for 2010, they are also among the more profitable
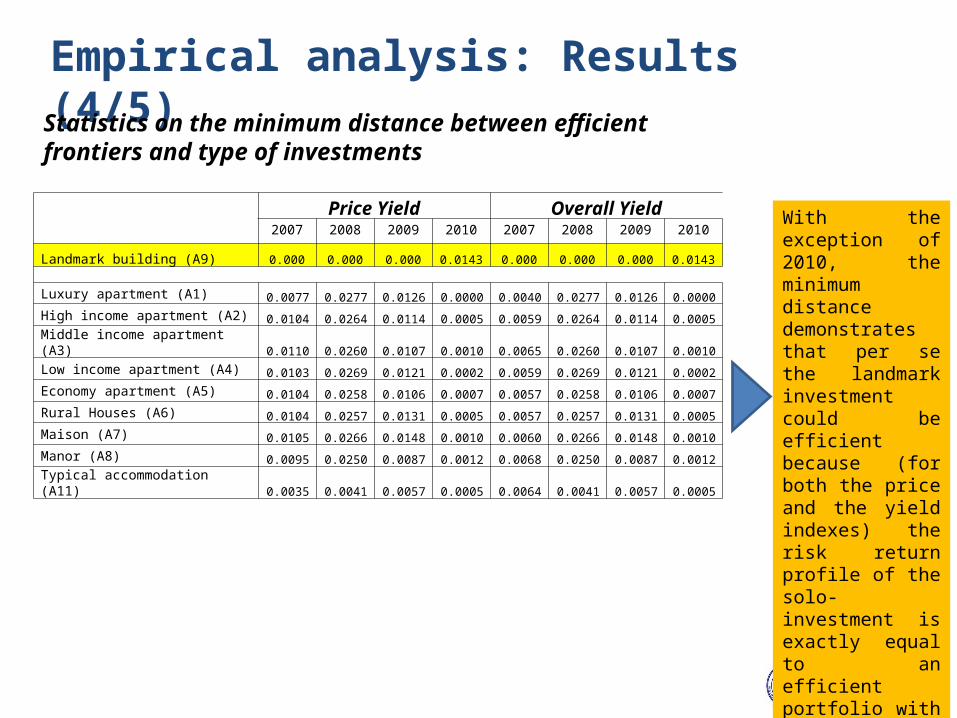
Empirical analysis: Results (4/5)
Price Yield Overall Yield2007 2008 2009 2010 2007 2008 2009 2010
Landmark building (A9) 0.000 0.000 0.000 0.0143 0.000 0.000 0.000 0.0143
Luxury apartment (A1) 0.0077 0.0277 0.0126 0.0000 0.0040 0.0277 0.0126 0.0000
High income apartment (A2) 0.0104 0.0264 0.0114 0.0005 0.0059 0.0264 0.0114 0.0005
Middle income apartment (A3) 0.0110 0.0260 0.0107 0.0010 0.0065 0.0260 0.0107 0.0010
Low income apartment (A4) 0.0103 0.0269 0.0121 0.0002 0.0059 0.0269 0.0121 0.0002
Economy apartment (A5) 0.0104 0.0258 0.0106 0.0007 0.0057 0.0258 0.0106 0.0007
Rural Houses (A6) 0.0104 0.0257 0.0131 0.0005 0.0057 0.0257 0.0131 0.0005
Maison (A7) 0.0105 0.0266 0.0148 0.0010 0.0060 0.0266 0.0148 0.0010
Manor (A8) 0.0095 0.0250 0.0087 0.0012 0.0068 0.0250 0.0087 0.0012
Typical accommodation (A11) 0.0035 0.0041 0.0057 0.0005 0.0064 0.0041 0.0057 0.0005
With the exception of 2010, the minimum distance demonstrates that per se the landmark investment could be efficient because (for both the price and the yield indexes) the risk return profile of the solo-investment is exactly equal to an efficient portfolio with the same risk.
Statistics on the minimum distance between efficient frontiers and type of investments
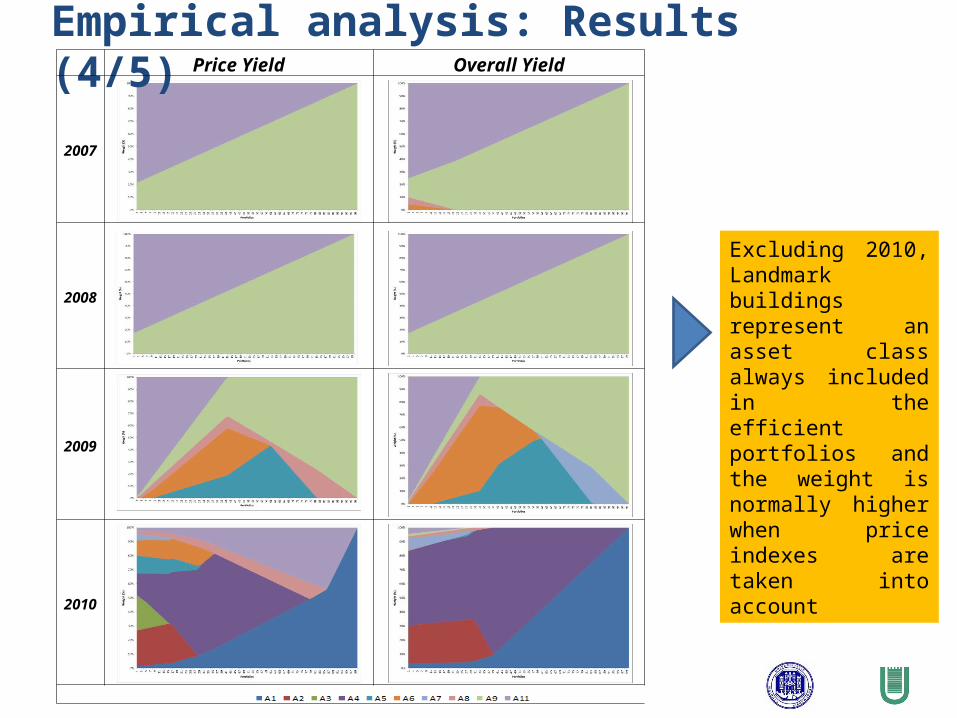
Excluding 2010, Landmark buildings represent an asset class always included in the efficient portfolios and the weight is normally higher when price indexes are taken into account
Empirical analysis: Results (4/5)Price Yield Overall Yield
2007
2008
2009
2010
Index
Introduction
Literature review
Empirical analysis:
Sample
Methodology
Results
Conclusions

• Landmark buildings present price and rent dynamics that are not comparable with other types of housing investments and the low correlation between the returns of this asset class respect to other type of residential investments could increase their usefulness in the construction of diversified portfolio•Due to the high number of specialized Residential real estate vehicles developed in the last years both in US and in Europe (i.a. Colin, 2007), portfolio managers of these type of funds have to consider the diversification benefits related to including landmark buildings as done by the other portfolio manager not specialized in the residential sector.• Once demonstrated the role of landmark building in a diversified housing portfolio, the next step is to test its usefulness in a diversified portfolio that includes other real estate asset classes (like office, industrial and commercial).
Conclusions
Lucia GibilaroUniversity of Bergamoe-mail: [email protected]
Gianluca MattarocciUniversity of Rome Tor Vergatae-mail: [email protected]
Contact information