landscape analysis and business model assessment in fecal … · 2014-08-10 · landscape analysis...
TRANSCRIPT

Landscape Analysis and Business Model Assessment in Fecal Sludge Management: Extraction and Transportation Models in Africa
KENYA REPORT
FINAL REPORT
VOLUME I OF II
MAIN REPORT
DECEMBER 2011 BMGATES-REP-S2H0-17012012
Client Bill & Melinda Gates Foundation P.O. Box 450 Webster, NY 14580 USA
Consultant Losai Management Limited Milimani Flats, Block 4 – Suite 18 Off State House Road P.O. Box 8584-00200 Nairobi, Kenya Tel: +254.20.273.3334, +254.20.263.2996 Email: [email protected]
The Bill & Melinda Gates Foundation Final Report
Landscape Analysis and Business Model Assessment in Fecal Sludge Management: Extraction and Transportation Models in Africa - Kenya
Losai Management Limited ii
Landscape Analysis and Business Model Assessment in Fecal Sludge Management: Extraction and Transportation Models in Africa - Kenya
VOLUME I OF II
Main Report Report disclaimer: This report is based on research funded by the Bill & Melinda Gates Foundation. The findings and conclusions contained within are those of the authors and do not necessarily reflect positions or policies of the Bill & Melinda Gates Foundation. Copyright notice: © 2011 Bill & Melinda Gates Foundation. All Rights Reserved. Bill & Melinda Gates Foundation is a registered trademark in the United States and other countries. Table of Contents
List of Tables.......................................................................................................................... V
Table of Figures ..................................................................................................................... X
Abbreviations and Terminology .......................................................................................... XIII
EXECUTIVE SUMMARY ........................................................................................................ XIV
E.1 Introduction ............................................................................................................ XIV
E.2 Kenyan Cities Selected for FSM Landscape Analysis ................................................ XIV
E.3 Institutional and Legal Framework of FSM .............................................................. XIV
E.4 Methodology Of The FSM Study ............................................................................... XV
E.5 Results and Analysis of Socio-Economic Aspect of Urban FSM Practice .................... XV
E.6 Fecal Sludge Management Services in Kenya .......................................................... XVI
E.7 FS Production and Market Size Calculation Method .............................................. XVIII
CHAPTER 1. THE KENYA COUNTRY FSM BACKGROUND ................................................... 1-1
1.1 Introduction ................................................................................................................ 1-1
1.2 The Context of the FSM Study Initiative in Kenya ........................................................ 1-2
1.3 Water Supply and Sanitation (WSS) Coverage in Kenya .............................................. 1-2
1.3.1 Water Supply .............................................................................................................. 1-2
1.3.2 Sanitation ................................................................................................................... 1-3
1.4 Institutional and Legal Framework – At the National Level ......................................... 1-4

The Bill & Melinda Gates Foundation Final Report
Landscape Analysis and Business Model Assessment in Fecal Sludge Management: Extraction and Transportation Models in Africa - Kenya
Losai Management Limited iii
1.5 The Objectives and Scope of the FSM Study ................................................................ 1-6
1.6 Brief Profiles of the Selected Study Cities .................................................................... 1-7
CHAPTER 2. METHODOLOGY OF THE FSM STUDY .......................................................... 2-10
2.1 Literature Review...................................................................................................... 2-10
2.2 Situational Analysis Methodology ............................................................................. 2-16
2.2.1 Household Survey Design ........................................................................................ 2-16
2.2.2 FSM Practices ........................................................................................................... 2-18
2.2.3 Methods to Validate Financial Data ........................................................................ 2-19
2.2.4 Treatment Plant/Dumping Sites Model ................................................................... 2-21
2.3 Determination of Financial Flows and Key Stakeholders ........................................... 2-22
2.4 Market Size Calculation Method ............................................................................... 2-23
2.4.1 FS Production and Collection Computation ............................................................. 2-24
2.5 Financial Analysis Methodology ................................................................................ 2-28
CHAPTER 3. RESULTS AND ANALYSIS OF URBAN FSM PRACTICE ...................................... 3-1
A 3.1 Situational Analysis of Extraction/Transportation (Kisumu) .................................... 3-1
A 3.1.1 Demographics of Kisumu City ............................................................................... 3-1
A 3.1.2 Drinking Water Supply Coverage for Kisumu City ................................................. 3-3
A 3.1.3 Sanitation Coverage for Kisumu City .................................................................... 3-4
A 3.1.4 Institutional and Legal Framework for FSM at the City Level (Kisumu) .............. 3-6
A 3.1.5 Flow of Money Chart for FSM Transactions ........................................................ 3-15
A 3.1.6 FS emptying business owners’ profile (Kisumu) .................................................. 3-17
B 3.1 Situational Analysis of Extraction/Transportation (Mombasa) .............................. 3-18
B 3.1.1. Demographics of Mombasa City .......................................................................... 3-18
B 3.1.2. Drinking Water Supply Coverage for Mombasa City ........................................... 3-21
B 3.1.3. Sanitation Coverage for Mombasa City ............................................................... 3-22
B 3.1.4. Institutional and Legal Framework for FSM at the City Level (Mombasa) .......... 3-23
B 3.1.5. Flow of Money Chart for FSM Transactions ........................................................ 3-32
B 3.1.6. FS emptying business owners’ profile (Mombasa) .............................................. 3-34
C 3.1 Situational Analysis of Extraction/Transportation (Nairobi) .................................. 3-35

The Bill & Melinda Gates Foundation Final Report
Landscape Analysis and Business Model Assessment in Fecal Sludge Management: Extraction and Transportation Models in Africa - Kenya
Losai Management Limited iv
C 3.1.1 Demographics of Nairobi City .............................................................................. 3-35
C 3.1.2 Drinking Water Supply Coverage ......................................................................... 3-38
C 3.1.3 Sanitation Coverage ............................................................................................. 3-39
C 3.1.4 Institutional and Legal Framework for FSM at the City Level .............................. 3-40
C 3.1.5 Flow of Money Chart for FSM Transactions ........................................................ 3-48
C 3.1.6 FS emptying business owners’ profile (Nairobi) .................................................. 3-50
3.1.7 Household Survey Results and Analysis for the three Cities ................................... 3-52
3.1.8 FSM Emptying Practices and Technologies Used: Manual and Mechanical ........... 3-54
3.1.9 Overview of all WWTP, FSTP or dumping sites ........................................................ 3-94
3.1.10 FS End Re-Use in the three cities Kisumu, Mombasa and Nairobi ...................... 3-99
3.2 Market Analysis per City ........................................................................................... 3-99
3.3 Service Delivery Models Review ............................................................................... 3-99
3.3.1 Overview of Existing Service Delivery Models ......................................................... 3-99
3.3.2 Comparison with Solid Waste Management Service Models................................ 3-100
3.4 Financial and Business Model Analysis .................................................................... 3-102
3.4.1 Financial and Business Model Analysis for Kisumu, Mombasa and Nairobi ......... 3-102
3.4.2 Country Level (across cities) .................................................................................. 3-143
3.5 Details and Recommendations of Business for Investment and Growth ................. 3-192
3.5.1 Current Service Levels ............................................................................................ 3-193
3.5.2 Current Profitability ............................................................................................... 3-193
3.5.3 Projected Profitability in 3-5 years ........................................................................ 3-194
3.5.4 Investment Required ............................................................................................. 3-195
3.5.5 Risk Analysis ........................................................................................................... 3-195
3.5.6 Future Service levels .............................................................................................. 3-196
CHAPTER 4. CONCLUSION ............................................................................................... 4-1
BIBLIOGRAPHY ....................................................................................................................... I
APPENDIX A: DATA COLLECTION INSTRUMENT...................................................................... II
APPENDIX B: DATA FOR FS CALCULATIONS ......................................................................... XVI

The Bill & Melinda Gates Foundation Final Report
Landscape Analysis and Business Model Assessment in Fecal Sludge Management: Extraction and Transportation Models in Africa - Kenya
Losai Management Limited v
List of Tables
Table 1-1 : Percentage Households by Main Source of Water – Kenya ................................................. 1-3
Table 1-2 : % of HH by Main Mode of Fecal Waste Disposal – Kenya .................................................... 1-4
Table 1-3 : Institutional Framework for ESH – at the National Level ...................................................... 1-5
Table 2-1 : FSM Concerns/Issues: Lunga Lunga & Korogocho Settlements .......................................... 2-13
Table 2-2 Key Findings on Small Scale Providers of Sanitation Services in Kibera ............................... 2-14
Table 2-3 : Methodology of FS Collection Computation ....................................................................... 2-24
Table 2-4 : Financial Analysis Framework ............................................................................................. 2-28
Table 3-1 : Population of Kisumu by Locality .......................................................................................... 3-1
Table 3-2 : Sample Size per Sub-Location (Kisumu) ................................................................................ 3-1
Table 3-3 : Demographics of the Sample Surveyed in Kisumu ............................................................... 3-2
Table 3-4 : Main Source of Water Supply – Kisumu City ........................................................................ 3-3
Table 3-5 : Sanitation Coverage in Kisumu ............................................................................................. 3-5
Table 3-6 : Roles of Kisumu Municipal Council ....................................................................................... 3-8
Table 3-7 : Role of the Water and Sanitation Utility – Kisumu ............................................................. 3-10
Table 3-8 : Role of NGOs ....................................................................................................................... 3-13
Table 3-9 : List of NGOs operating in Kisumu City ................................................................................ 3-13
Table 3-10 : Financial Transaction Data for FSM services ..................................................................... 3-17
Table 3-11 : FS Emptying Business Owners Profile - Kisumu ................................................................ 3-17
Table 3-12 : Fs Emptying Business Profile ............................................................................................. 3-18
Table 3-13 : Population of Mombasa by Locality .................................................................................. 3-18
Table 3-14 : Sample Size per Sub-Location – Mombasa ....................................................................... 3-19
Table 3-15 : Demographics of the Sample Surveyed in Mombasa ....................................................... 3-20
Table 3-16 : Main Source of Water Supply – Mombasa City ................................................................ 3-21
Table 3-17 : Sanitation Coverage in Mombasa ..................................................................................... 3-22
Table 3-18 : Role of Mombasa Municipal Council ................................................................................ 3-25
Table 3-19 : Role of Water and Sanitation Utility – Mombasa ............................................................. 3-26
Table 3-20 : Roles of NGOs in Mombasa .............................................................................................. 3-29
Table 3-21 : List of NGOs operating in Mombasa city .......................................................................... 3-30
Table 3-22 : Role of local CBOs in Mombasa ........................................................................................ 3-31
Table 3-23 : List of CBOs operating in Mombasa city ........................................................................... 3-31
Table 3-24 : Financial Transaction Data for FSM Services - Mombasa ................................................. 3-34
Table 3-25 : FS Emptying Business Owners’ Profile - Mombasa ........................................................... 3-34
Table 3-26 : FS Emptying Business Profile - Mombasa ......................................................................... 3-35
Table 3-27 : Population of Nairobi by Locality ...................................................................................... 3-35

The Bill & Melinda Gates Foundation Final Report
Landscape Analysis and Business Model Assessment in Fecal Sludge Management: Extraction and Transportation Models in Africa - Kenya
Losai Management Limited vi
Table 3-28 : Sample Size per Sub-Location – Nairobi ........................................................................... 3-36
Table 3-29 : Demographics of the Sample Surveyed in Nairobi ........................................................... 3-38
Table 3-30 : Main Source of Water Supply – Nairobi city ..................................................................... 3-39
Table 3-31 : Sanitation Coverage in Nairobi ......................................................................................... 3-40
Table 3-32 : Role of Nairobi City Council .............................................................................................. 3-43
Table 3-33 : Role of the Water and Sanitation Utility – Nairobi ........................................................... 3-44
Table 3-34 : Role of NGOs – Nairobi ..................................................................................................... 3-46
Table 3-35 : List of NGOs operating in Nairobi city ............................................................................... 3-48
Table 3-36 Tariffs and Fees for FSM Services - Nairobi ......................................................................... 3-50
Table 3-37 FS Emptying Business Owners’ Profile - Nairobi ................................................................. 3-51
Table 3-38 : FS Emptying Business Profile - Nairobi.............................................................................. 3-51
Table 3-39 : Summary of Socio-Economic Aspects of FSM Across the Three Cities ............................. 3-52
Table 3-40 : Methods of Emptying Fecal Sludge in Kisumu .................................................................. 3-54
Table 3-41 : Data on Mechanical Operators in Kisumu ........................................................................ 3-55
Table 3-42 : Truck Characteristics - Kisumu .......................................................................................... 3-56
Table 3-43 : Commencement and Customers of Mechanical Operators – Kisumu .............................. 3-57
Table 3-44 : Per Trip Fees for FSM Services – Kisumu .......................................................................... 3-58
Table 3-45 : Mechanical Emptiers Truck Crew – Kisumu ...................................................................... 3-58
Table 3-46 : Summary of Operations – Kisumu .................................................................................... 3-62
Table 3-47 : Challenges Faced by Mechanical Operators in Kisumu .................................................... 3-62
Table 3-48 : Methods of Emptying Fecal Sludge in Mombasa .............................................................. 3-66
Table 3-49 : Data on Mechanical Operators in Mombasa .................................................................... 3-67
Table 3-50 : Truck Characteristics - Mombasa ...................................................................................... 3-68
Table 3-51 : Commencement and Customers of Mechanical Operators - Mombasa .......................... 3-69
Table 3-52 : Per Trip Fees for FSM Services – Mombasa ...................................................................... 3-70
Table 3-53 : Per Trip Fees for Different Types of Trucks for FSM Services – Mombasa ....................... 3-70
Table 3-55 : Mechanical Emptiers Truck Crew – Mombasa .................................................................. 3-72
Table 3-54 : M-PESA Service in Kenya ................................................................................................... 3-72
Table 3-56 : Summary of Operations and Operator Challenges – Mombasa ....................................... 3-78
Table 3-57 : Methods of Emptying Fecal Sludge in Nairobi .................................................................. 3-81
Table 3-58 : Data on Mechanical Operators in Nairobi ........................................................................ 3-82
Table 3-59 : Truck Characteristics - Nairobi .......................................................................................... 3-83
Table 3-60 : Commencement and Customers of Mechanical Operators - Nairobi .............................. 3-84
Table 3-61 : Per Trip Fees for FSM Services – Nairobi .......................................................................... 3-85
Table 3-62 : Per Trip Fees for Different Types of Trucks for FSM Services – Nairobi ........................... 3-86
Table 3-63 : Mechanical Emptiers Truck Crew – Nairobi ...................................................................... 3-87

The Bill & Melinda Gates Foundation Final Report
Landscape Analysis and Business Model Assessment in Fecal Sludge Management: Extraction and Transportation Models in Africa - Kenya
Losai Management Limited vii
Table 3-64 : Summary of Operations and Operator Challenges – Nairobi ........................................... 3-93
Table 3-65 : Data on Wastewater Treatment Plant in Mombasa ......................................................... 3-97
Table 3-66 : Data on Wastewater Treatment Plant in Nairobi ............................................................. 3-98
Table 3-67 : Demand and Supply of FSM Services in Kisumu ............................................................. 3-102
Table 3-68 : Demand and Supply of FSM Services in Mombasa ......................................................... 3-102
Table 3-69 : Demand and Supply of FSM Services in Nairobi ............................................................. 3-103
Table 3-70 : Activity Profile of Manual Emptiers across the 3 Cities .................................................. 3-104
Table 3-71 : Income Statements for Manual Emptiers Across the 3 Cities ........................................ 3-104
Table 3-72 : Comparison of Mechanical Operators - Kisumu ............................................................. 3-105
Table 3-73 Comparison of Mechanical Operators -– Mombasa ........................................................ 3-106
Table 3-74 : Comparison of Mechanical Operators -– Nairobi ........................................................... 3-106
Table 3-75 : Mechanical Emptiers Condensed Income Statement - Kisumu ...................................... 3-108
Table 3-76 : Depreciation Charge on Mechanical Emptiers’ Income Statement-Kisumu ................... 3-108
Table 3-77 : Cash Flow Statements Charge of Mechanical Emptiers’-Kisumu ................................... 3-108
Table 3-78 : Mechanical Emptiers Condensed Income Statement - Mombasa .................................. 3-109
Table 3-79 : Mechanical Emptiers Condensed Income Statement – Nairobi 1 truck operators ........ 3-111
Table 3-80 : One Truck Operators Margin Analysis- Nairobi .............................................................. 3-111
Table 3-81 : Mechanical Emptiers Condensed Income Statement – Nairobi 2 trucks operators ....... 3-112
Table 3-82 : Two Trucks Operators Margin Analysis- Nairobi............................................................. 3-113
Table 3-83 : Mechanical Emptiers Condensed Income Statement – Nairobi 4 trucks operators ....... 3-114
Table 3-84 : Four Truck Operators Margin Analysis-Nairobi .............................................................. 3-115
Table 3-85 : Mechanical Operators Margin Analysis – Kisumu .......................................................... 3-116
Table 3-86 : Comparison of Mechanical Operators Kisumu for BEP Analysis ..................................... 3-117
Table 3-87 : Per unit BEP analysis-Kisumu .......................................................................................... 3-118
Table 3-88 : Mechanical Operators Margin Analysis – Mombasa ...................................................... 3-119
Table 3-89 : Per unit BEP analysis- Mombasa ..................................................................................... 3-120
Table 3-90 : One Truck Operator BEP Analysis-Nairobi ...................................................................... 3-122
Table 3-91 : Two truck Operators BEP Analysis-Nairobi ..................................................................... 3-123
Table 3-92 : Four truck Operators BEP analysis-Nairobi ..................................................................... 3-124
Table 3-93 : One truck operator’s Cash flow projection to 2016 - Kisumu ........................................ 3-125
Table 3-94 : One truck operator’s NPV,IRR - Kisumu .......................................................................... 3-126
Table 3-95 : Two truck operator’s Cash flow projection 5 years - Kisumu ......................................... 3-126
Table 3-96 : Two Truck operator’s NPV,IRR – Kisumu ........................................................................ 3-127
Table 3-97 : One Truck Operator Cash Flow Projection for 5 years - Mombasa ................................ 3-128
Table 3-98 : One Truck Operator’s NPV,IRR – Mombasa .................................................................... 3-129
Table 3-99 : Two-Truck Operator Cash flow Analysis to 2016 – Mombasa ........................................ 3-130

The Bill & Melinda Gates Foundation Final Report
Landscape Analysis and Business Model Assessment in Fecal Sludge Management: Extraction and Transportation Models in Africa - Kenya
Losai Management Limited viii
Table 3-100 : Two Truck operator’s NPV,IRR – Mombasa .................................................................. 3-131
Table 3-101 : Four Truck Operator Cash FlowProjections for 5 years – Mombasa ............................ 3-132
Table 3-102 : Four Truck operator’s NPV,IRR – Mombasa ................................................................. 3-133
Table 3-103 : One Truck Operator Cash Flow Projections for 5 years –Nairobi ................................. 3-134
Table 3-104 : One Truck operator’s NPV,IRR – Nairobi ...................................................................... 3-135
Table 3-105 : Two Truck Operator Cash Flow Projections for 5 years–Nairobi .................................. 3-136
Table 3-106 : Two Truck operator’s NPV,IRR – Nairobi ...................................................................... 3-137
Table 3-107 : Four Truck Operator Cash Flow Projections for 5 years – Nairobi................................ 3-138
Table 3-108 : Four Truck operator’s NPV,IRR – Nairobi ...................................................................... 3-139
Table 3-109 : Access to Finance - Kisumu ........................................................................................... 3-140
Table 3-110 : Condensed Income Statement - One Truck Operators ................................................. 3-145
Table 3-111 : Condensed Income Statement - Two Truck Operators ................................................ 3-145
Table 3-112 Condensed Income Statement - Four Truck Operators ................................................. 3-146
Table 3-113 : One Truck Operators Cash Flow Statement .................................................................. 3-147
Table 3-114 : Two Trucks Operators Cash Flow Statement ................................................................ 3-148
Table 3-115 : Four trucks operator cash flow statement ................................................................... 3-149
Table 3-116 : Business Ownership Structures .................................................................................... 3-151
Table 3-117 : Comparison of FSM and SWM service delivery models ............................................... 3-155
Table 3-118 : Comparison of Tariffs and Fees for FSM Services ......................................................... 3-157
Table 3-119 : Methods of Emptying Fecal Sludge in the Three Cities ................................................ 3-158
Table 3-120 : Data on Mechanical Operators in Cities ....................................................................... 3-159
Table 3-121 : Summary of Operations and Operator Challenges ....................................................... 3-167
Table 3-122 : Data on Wastewater Treatment Plant in Nairobi, Kisumu and Mombasa ................... 3-170
Table 3-123 : Statistics on Households, Sanitation Facilities and Mode of Emptying ........................ 3-172
Table 3-124 : Nairobi City FS Demand and Supply Data ..................................................................... 3-174
Table 3-125 : Mombasa City FS Demand and Supply Data ................................................................. 3-175
Table 3-126 : Kisumu City FS Demand and Supply Data ..................................................................... 3-176
Table 3-127 : Operational Analysis of One Truck Operators .............................................................. 3-177
Table 3-128 : Operational Analysis of Two Truck Operators .............................................................. 3-178
Table 3-129 : Operational Analysis of Four Truck Operators .............................................................. 3-178
Table 3-130 : Operations Data Comparison of One, Two and Four Truck Mechanical Operators ..... 3-179
Table 3-131 : Mechanical Operators BEP Analysis – Kisumu, Mombasa and Nairobi ........................ 3-180
Table 3-132 : Bio –Centre Complex Service Levels ............................................................................. 3-193
Table 3-133 : Data on Typical Bio-Centre ........................................................................................... 3-194
Table 3-134 : City Statistics on Population ......................................................................................... 3-196
Table 3-135 : Projections for Population to be Served ....................................................................... 3-197

The Bill & Melinda Gates Foundation Final Report
Landscape Analysis and Business Model Assessment in Fecal Sludge Management: Extraction and Transportation Models in Africa - Kenya
Losai Management Limited ix
Table 4-1 : HH by Main Mode of Faecal Waste Disposal – Kenya .......................................................... 4-1
Table 4-2 : HH by Main Mode of Faecal Waste Disposal-Kisumu, Mombasa and Nairobi ..................... 4-2
Table 4-3 : Methods of Emptying Fecal Sludge in the Three Cities ........................................................ 4-2
Table 4-4 : FS production per City and Method of Emptying ................................................................. 4-3
Table 4-5 : Share of FS Emptying by Manual and Mechanical Emptiers ................................................. 4-3
Table 4-6 : Data on Mechanical Operators in Cities ............................................................................... 4-4
Table 4-7 : Wastewater Treatment Plant in Nairobi, Kisumu and Mombasa ......................................... 4-5

The Bill & Melinda Gates Foundation Final Report
Landscape Analysis and Business Model Assessment in Fecal Sludge Management: Extraction and Transportation Models in Africa - Kenya
Losai Management Limited x
Table of Figures
Figure 1-1 : Location of selected Cities: Nairobi, Mombasa and Kisumu ............................................... 1-7
Figure 2-1 : FSM: Widely Observed Causes, Problems and Impacts ..................................................... 2-11
Figure 2-2 : Household Options in Kibera when Pit Larine Fills up ....................................................... 2-14
Figure 2-3 : FSM Flow of Funds Expected Financial Flows in FSM Operations ..................................... 2-22
Figure 3-1 : The Institutional Framework for FSM at the City Level (Kisumu) ........................................ 3-7
Figure 3-2 : Flow of Money Chart for FSM Transactions ...................................................................... 3-16
Figure 3-3 : The Institutional Framework for FSM at City Level (Mombasa) ........................................ 3-24
Figure 3-4 : Financial Transaction Opportunities for FSM Services in Mombasa ................................. 3-33
Figure 3-5 : The Institutional Framework for FSM at City Level (Nairobi) ............................................ 3-42
Figure 3-6 : Financial Transaction Opportunities for FSM Services - Nairobi ....................................... 3-49
Figure 3-7 : Trucks in Kisumu for FS Services ........................................................................................ 3-56
Figure 3-8 : FS Disposal at the inlet of Nyalenda TP (left) and access to the plant (right) ................... 3-60
Figure 3-9 : Location of Pumps in Trucks - Kisumu ............................................................................... 3-60
Figure 3-10 : Typical Mombasa FS Servces Truck ................................................................................. 3-68
Figure 3-11 : Kipevu WWTP (TL), Access (TR), disposal point (BL), Truck emptying ............................. 3-74
Figure 3-12 : Fuel Efficient Trucks in Mombasa .................................................................................... 3-75
Figure 3-13 : Fuel Efficient Pump System of an Imported Vehicle - Mombasa .................................... 3-76
Figure 3-14 : Pump System coupled to Shaft of Truck - Mombasa ....................................................... 3-77
Figure 3-15 : Marketing FSM Services - Mombasa ............................................................................... 3-79
Figure 3-16 : Drum Truck Operators and Mannual Emptiers ............................................................... 3-80
Figure 3-17 : Typical Nairobi Trucks ...................................................................................................... 3-83
Figure 3-18 : Njiru Tipping Point in Nairobi .......................................................................................... 3-88
Figure 3-19 : Some of the Trucks Operating in Nairobi. ....................................................................... 3-89
Figure 3-20 : Pump System of an Imported Vehicle ............................................................................. 3-90
Figure 3-21 : Different Pump Positions for Locally Assembled Trucks ................................................. 3-91
Figure 3-22 : Using Trucks to Market FSM Services .............................................................................. 3-92
Figure 3-23 Sedimentation Tanks at the Kisat Wastewater Treatment Plant ...................................... 3-95
Figure 3-24 : FS Drying Beds (left) and dried FS (right) at the Kisat WWTP .......................................... 3-95
Figure 3-25 : FS Drying Beds - Kariobangi WWTP Nairobi .................................................................... 3-98
Figure 3-26 : Flow of Money Chart for FSM Transactions .................................................................. 3-156
Figure 3-27 Trucks used by Mechanical Operators ............................................................................ 3-160
Figure 3-28 : Nairobi FS Tipping Point ................................................................................................. 3-163
Figure 3-29 : One of the Largest Trucks in Mombasa -22,000 litres ................................................... 3-165
Figure 3-30 : Pump Technology for Exhauster Trucks ........................................................................ 3-166
The Bill & Melinda Gates Foundation Final Report
Landscape Analysis and Business Model Assessment in Fecal Sludge Management: Extraction and Transportation Models in Africa - Kenya
Losai Management Limited xi
Figure 3-31 : Alternative Pump Technology for Exhauster Trucks ...................................................... 3-166
Figure 3-32 : Drum Truck in Mombasa ............................................................................................... 3-169
Figure 3-33 : Construction of Bio- center; Kisumu (left); Stara Bio-centre; Nairobi ........................... 3-171
Figure 3-34 : Bio Centre Construction ................................................................................................. 3-186
Figure 3-35 : Excavation and Laying of Foundation for Bio-Centre .................................................... 3-186
Figure 3-36 : The dome and super structure of a Bio-centre ............................................................. 3-187
Figure 3-37 : Complete Bio-Centre ..................................................................................................... 3-187
Figure 3-38 : Schematic of Feacal Sludge Digester ............................................................................. 3-188
Figure 3-39: First sludge drying bed at Kariobangi Treatment Plant .................................................. 3-190
Figure 3-40: Second sludge drying bed at Kariobangi Treatment Plant ............................................. 3-191

The Bill & Melinda Gates Foundation Final Report
Landscape Analysis and Business Model Assessment in Fecal Sludge Management: Extraction and Transportation Models in Africa - Kenya
Losai Management Limited xii
VOLUME II OF II Nairobi City Households’ Survey Report Mombasa City households’ Survey Report Kisumu City households’ Survey Report

The Bill & Melinda Gates Foundation Final Report
Landscape Analysis and Business Model Assessment in Fecal Sludge Management: Extraction and Transportation Models in Africa - Kenya
Losai Management Limited xiii
ABBREVIATIONS AND TERMINOLOGY
AFD - French Development Agency BMGF - Bill and Melinda Gates Foundation ESH - Environmental Sanitation and Hygiene FS - Fecal Sludge – Human Bio-Waste FSM - Fecal Sludge Management FSTP - Fecal Sludge Treatment Plant GOK - Government of Kenya
HH - Household - A person or a group of persons who reside in the same homestead/compound but necessarily the same dwelling unit, have the same cooking arrangement, same sanitary facilities
KIHBS - Kenya Integrated Household Budget Survey, 2005 KNBS - Kenya National Bureau of Statistics KIWASCO - Kisumu Water and Sewerage Company LGA - Local Government Authority MOWASCO - Mombasa Water and Sewerage Company MCK - Municipal Council of Kisumu MDGs - Millennium Development Goals NCWSC - Nairobi City Water and Sewerage Company NCC - Nairobi City Council NGO - Non-Governmental Organization NWSS - National Water Services Strategy OSS - On-Site Sanitation Systems WASH - Water, Sanitation and Hygiene WSB - Water Service Board WSP - Water Service Provider WSPA - Water Service Providers Association WSS - Water and Sanitation Services

The Bill & Melinda Gates Foundation EXECUTIVE SUMMARY
Landscape Analysis and Business Model Assessment in Fecal Sludge Management: Extraction and Transportation Models in Africa - Kenya
Losai Management Limited xiv
EXECUTIVE SUMMARY
E.1 Introduction
As part of Bill and Melinda Gates Foundation global initiative for the promotion of “Sanitation
that Works for the Poor,” Kenya (among other 4 countries in Africa), was selected to participate
in the exploratory research to better understand the fecal sludge emptying as a service in the
country’s cities sanitation provision. The aim of the study is to inform the sanitation sector on
the dynamics of the fecal sludge management (FSM) and linkages to future investments in the
sector – by the governments, donors and other development partners.
The Kenya Study was carried out by Losai Management Ltd in collaboration with the Water
Service Providers Association (WASPA). The output of the Study is this Report – which highlights
the current FSM situation in Kenya and explores possibilities that exist for up-scaling the FS
service provision “for the benefit of the low income segment of the participating cities
population.”
E.2 Kenyan Cities Selected for FSM Landscape Analysis
As per the BMGates criteria for selection of the 3 local case study sites (cities), the Kenya Study
Team selected Nairobi – the capital and the largest city - in the center; Mombasa and the
second largest city - at the coast, in the east; and Kisumu – the third largest city - by the
lakeside, in the west. The 3 cities each have sludge treatment plants and official dumping sites.
E.3 Institutional and Legal Framework of FSM
The current main institutional context for the effective delivery of FSM in Kenya is outlined in
the National Environmental Sanitation and Hygiene (ESH) Policy 2007. The document outlines
the roles and responsibilities of all the ESH actors, including: Government Departments e.g.: the
Ministry of Public Health and Sanitation (the lead agency); Ministry of Water; Ministry of Local
Government – and the associated Municipal Councils; and the National Environment
Management Authority (NEMA).
The ESH document also outlines the critical roles of Non-Governmental Organizations (NGOs),
private sector, and above all the communities – in partnership with all the other actors: “to
create and enhance an enabling environment in which Kenyans will be motivated to improve
their hygiene behavior and environmental sanitation”. The Report highlights some of the active
NGOs in the sector – and a social enterprise firm also involved.
The Bill & Melinda Gates Foundation EXECUTIVE SUMMARY
Landscape Analysis and Business Model Assessment in Fecal Sludge Management: Extraction and Transportation Models in Africa - Kenya
Losai Management Limited xv
E.4 Methodology of the FSM Study
The Study used a combination of quantitative and qualitative methods to obtain the required
data, on the various aspects of FSM situation in the 3 selected Study cities. These methods
were:
• Literature review – or secondary data sources. This involved in-depth analysis of
previous studies reports; official Government of Kenya documents; and operational
documents of relevant agencies.
• Key Informant Interviews – with Key officials of agencies in the water and sanitation
sector.
• Household Survey – involving 1,200 sample households in the 3 Study Cities.
A Questionnaire instrument was used – to generate primary data on the FSM situation in each
of the cities.
E.5 Results and Analysis of Socio-Economic Aspect of Urban FSM Practice
From the secondary data sources and the Household Survey, the Study made the following
findings (stated very briefly):
(a) Demographics
According to the latest (2009) National Census, Nairobi – the capital city had a population of
3,138,369; Mombasa 938,131 and Kisumu 409,928. The population sample studied indicated
very high literacy levels in the 3 cities: with over two-thirds having attained secondary level
education and above – and minimal (less than 1%) being non-literate.
The average number of people per household was about 5 across the cities, whilst majority of
household heads were in self-employment occupations.
(b) Drinking Water Supply Coverage
From the Household Survey, 69% of Kisumu households may be said to have access to drinking
water supply from safe sources: viz, individual connections, water kiosks and boreholes. For
Mombasa, this is 80%, whilst in Nairobi it is 71% (although Nairobi has the highest rate of
access to individual connections: 69%). This is much higher than the national average for urban
areas: 52.6% - according to the 2009 National Census.
Both Kisumu and Mombasa are currently under a vigorous water supply improvement program
– with funding from AFD: French Development Agency. Nairobi too is implementing a World

The Bill & Melinda Gates Foundation EXECUTIVE SUMMARY
Landscape Analysis and Business Model Assessment in Fecal Sludge Management: Extraction and Transportation Models in Africa - Kenya
Losai Management Limited xvi
Bank funded improvement program. What this good news means for the 3 cities FSM initiative
is that, the improved availability of water supply will significantly increase greater access by the
residents to sewer connections.
(c) Sanitation Coverage
An encouraging 88% of households in Kisumu have access to sanitation facilities of one type or
another, within their compound. In Mombasa, this is 91% whilst Nairobi has the lowest rate:
85%. Of this, 43% in Kisumu, an encouraging 62% in Mombasa and 56% in Nairobi – use
facilities that may be categorized as consisting safe or hygienic management of human waste
(VIP latrine, Septic tank, cess pool, and sewerage). The average number of users per toilet in
Kisumu is 8, Mombasa 4 and Nairobi a high of 12.
For those without access to a sanitation facility at home, a worrying 40% in Kisumu and 50% in
Mombasa and a lower 20% in Nairobi – dispose human waste in open spaces, drainage
channels and other unsafe sites – this posing great danger to human health in the respective
cities.
E.6 Fecal Sludge Management Services in Kenya
Fecal sludge management services are classified under two broad categories, which are manual
and mechanical operations.
There are two main types of trucks available in Kenya, one, locally fabricated and two, second
hand imports of specialized trucks.
FSM offers numerous forward and backward linkages. There are financial transaction
opportunities to the FSM service providers in this case manual and mechanical emptiers. These
transactions arise from the supply of goods and services including credit. Other opportunities
arise from the payment for emptying services by service provider clients.
Many service providers in the FSM sub-sector are informal Small and Medium Sized Enterprises
and micro sized enterprises. These have limited access to formal credit and alternative sources
are likely to be expensive, including borrowing from microfinance institutions may be
untenable. This is because interest rates in Kenya have remained well above 10% per annum for
more than 20 years. High interest rates inhibit adequate lump sum borrowing which may the
needed amount to assist in business transformation and take off.

The Bill & Melinda Gates Foundation EXECUTIVE SUMMARY
Landscape Analysis and Business Model Assessment in Fecal Sludge Management: Extraction and Transportation Models in Africa - Kenya
Losai Management Limited xvii
The broad framework of emptiers in the 3 cities is identical. Trucks are licensed on a unit basis
by the national environmental agency. Each city has 2 treatment plants, one conventional type
and another stabilization pond type. Dumping in the 3 cities is centralized and as such there is
only one designated tipping point in each of the 3 cities. There are more similarities than
differences amongst the operators and in some instances some are branch outlets, therefore
operating in more than one city. In addition, in all the cities the FSM sub sector policy
framework is under developed and in urgent need of formulation. Mechanical emptying
services are 100% provided by the private sector with the public sector playing varied
regulatory and oversight role. The degree of oversight across the cities is generally licensing and
less of enforcement.
In most instances, financial and business accounts were not accessible as operators were
unwilling to share. Under these circumstances, financial data in the three towns was obtained
through interviewing the operators. The estimates then received were validated through
further interviews with employees of the operators and cross checked with data obtained from
competitors.
The analysis of the results obtained indicates operating consistency between the operators
operating in the three cities surveyed; and there are no noticeable outlier estimates. For the
case of Kisumu and Mombasa, only one operator was interviewed for each category of trucks
owned and operated. In Nairobi 16 operators were interviewed. However, for purposes of the
analysis, the best performing operator in Nairobi was selected and marked against comparable
operators in Kisumu and Mombasa in the corresponding category of number of trucks owned.
When depreciation is included in the financial estimates, most of the operators are found to be
unprofitable. However on a cash basis most of the mechanical operators remain profitable
Under these circumstances, the existing business models may on a short term basis be self-
sustaining but they may not be self-sustaining in the medium and long term. Periodic cash
surpluses are consumed by intermittent but high cost of repairs as shown by the impact of
depreciation on the bottom line. Alternatively, probably all businesses are profitable, but the
reported number of trips per truck is understated to give the impression of low profitability.

The Bill & Melinda Gates Foundation EXECUTIVE SUMMARY
Landscape Analysis and Business Model Assessment in Fecal Sludge Management: Extraction and Transportation Models in Africa - Kenya
Losai Management Limited xviii
E.7 FS Production and Market Size Calculation Method
Market size calculation is based on Household Survey results and population data provided
from reliable sources. The population data is obtained from the national population census
report conducted by the national institution responsible for the same task.
The population data provides for the census estimates for the city. The Household Survey offers
the variables necessary for inference which include distribution of sanitation services- pit
latrines, septic tanks, sewer connections- the frequencies of emptying for onsite sanitation and
others. The variables estimated through the survey are used as inputs to estimate the
parameters of the units under study. It is the combination of both Household survey variable
estimates and population census that forms the input to the computation of the market size.
There are 74 trucks operating in the 3 cities while there are 43 registered operators. Unlike in
Kisumu and Nairobi there are more operators in Mombasa than the number of trucks. This is
because some of the operators are “brokers” who hire the trucks periodically from the
mainstream operators-truck owners- to service clients.
Across the three cities the capacity of trucks varies from 6,000 litres to 22,000 litres. The drum
combination trucks found in Mombasa have a lower capacity of 5,600 litres and 7,200 litres.
However, all trucks across the cities charge on a per trip basis and sometimes the fee is higher
depending on the distance to the dumping site. The longest distance is in Nairobi which is 50
km comprising of from client to dumpsite to parking bay, while the shortest distance is in
Mombasa which is 4 kilometers. Most trips have an average distance of 8 km in Kisumu and
Mombasa
Across the cities the number of trips per day varies. In the case of Nairobi there are at least 4
trips for every three days, which translates to 8 trips for a week of six days and in Mombasa 3
trips for every three days, that is 6 trips per week and at least one trip per day for the operators
in Kisumu where two of the 3 operators reported at least 1 trip per day every day on a 22
working day cycle while the other reported a trip every two days. There are reports of manual
emptying taking place and illegal dumping and connection of septic tanks to the storm drain in
Nairobi and Mombasa. The operators using drum-trucks-in Mombasa work closely with manual
emptiers. Manual emptiers in Mombasa reported that only 50% of their emptying is
transported by trucks. The total dumping by drum trucks in a year is estimated at 180. This

The Bill & Melinda Gates Foundation EXECUTIVE SUMMARY
Landscape Analysis and Business Model Assessment in Fecal Sludge Management: Extraction and Transportation Models in Africa - Kenya
Losai Management Limited xix
means that every 2 days there is manual emptying taking place in Mombasa with the FS being
either dumped into the storm drain or being buried into the ground.
In Nairobi the annual demand for FS management services is estimated at 4,604,701 m3 and the
mechanical supply for those services is estimated to cater for only 299,520 m3 at present
representing 10% service delivery rate. On the other hand, the manual supply has an annual
demand of approximately 1,808,010 m 3 which represents about 35% service delivery rate.
The capacity to cater for more demand exists in the current operating environment both for
mechanical and manual operators, however due to the hazardous nature of manual FS
extraction; mechanical extraction if well developed as a service may experience the needed
growth to meet the excess demand.
In Mombasa the annual demand for FS management services is estimated at 853,341 m3 and
the mechanical supply for those services is estimated to cater for 28,142 m3 representing 3%
service delivery rate and 261,766 m3 in manual extraction supply, representing 30% service
delivery rate. From the study it was established that a substantial number of households do not
use the mechanical services but opt for manual services. These households was estimated to
produce a total of 50,930 m3 annually in FS, however the mechanical supply was estimated at
28,142 m3,. This implies that the operators operated with underemployed capacity and in some
cases had to make trips to the dumping site with half-filled tanks. On the other hand, the
manual supply has an annual demand of approximately 802,411 m3 and a corresponding
261,766 m3 annual supply from manual operators which represents about 33% service delivery
rate.
Kisumu has three mechanical operators operating a total of four trucks among them. It has an
estimated annual demand for FS management services of 691,903 m3 and the mechanical
supply for those services is estimated to cater for only 6,240 m3 at present representing a 1%
service delivery rate. On the other hand, the manual supply has an annual demand of
approximately 508,431 m3 and a corresponding 266,549 m3 annual supply from manual
operators which represents about 35% service delivery rate. The capacity to cater for more
demand exists in the current operating environment both for mechanical and manual
operators.
The trucks in use have an average age of 25 years meaning they are inefficient and use old
technology which is expensive. Some operators have trucks with smaller capacity and they have

The Bill & Melinda Gates Foundation EXECUTIVE SUMMARY
Landscape Analysis and Business Model Assessment in Fecal Sludge Management: Extraction and Transportation Models in Africa - Kenya
Losai Management Limited xx
better chance of increasing their revenues especially when they are dealing with large
institutions since they can make numerous trips and billings is made against trips as opposed to
truck capacity.
The truck owner in many cases has no way of validating the number of trips made since clients
are not issued with receipts. The dumping sites are not properly controlled and largely truck
drivers do not record the trips they make. The truck owners incur more cost trying to monitor
the business.
For both Mombasa and Kisumu one truck operators, their businesses have negative
contribution margins which imply that they are making losses. In each case, to break even,
operators have two options; they can either increase the number of trips one makes per year to
396 from 288 or increase the tariff charge per trip to $ 70.77 for the same number of trips they
make per year. While for the second operator in Mombasa, he needs to increase his number of
trips to 395 per year from 142 he makes currently or double the tariff charge per trip to USD
345 for the same number of trips. The price variance in order to break even and become
profitable is 37% and 178% respectively. Due to the price sensitivity nature of this kind of
business and the high level of competition increasing the tariff may be difficult due to clientele
flight to cheaper service providers. It is also very likely that the number of trips reported is far
below the actual trips by the operators.
In the case of two truck operators only Mombasa operator yields a negative contribution
margin. For this operator to break even he needs to increase the number of trips per truck to
161 per year from the current 129 trips or increase the charges to USD 134 from 108 charged
currently.
For the four truck operators only found in Nairobi and Mombasa there is a consistency on the
capacities of their trucks-large capacities, both are profitable on a cash basis and even after
charging depreciation. The four truck operators enjoy a mix of size and tariff that has resultant
economies of scale in the operations of mechanical emptying services.
Access to finance is limited and remains a big challenge on three fronts.
Rate of Interest: The rates of interest on lending have remained very high in the economy over
the last 20 years. This has deterred borrowing as the business would experience challenges in
making payments.
The Bill & Melinda Gates Foundation EXECUTIVE SUMMARY
Landscape Analysis and Business Model Assessment in Fecal Sludge Management: Extraction and Transportation Models in Africa - Kenya
Losai Management Limited xxi
Credit limits: Access to credit at micro finance institutions falls well below what is required to
acquire the key asset in mechanical emptying services, namely the truck. MFI would have to
raise their credit limit but even then the MFI’s would have to lend at lower interest rates than
they have been in the past.
Lack of Lease finance financial services for the sector: Lease finance tends to be at lower rates
of interest; however, since there is not equipment supplier in Kenya for specialized mechanical
emptying trucks, this has not developed. Thus whereas a new truck chassis would be lease
financed, the value for money of the locally fabricated mechanical emptying truck falls below
the value for money of an imported specialized reconditioned emptying truck. As a
consequence it may be more beneficial to offer lease finance for services for reconditioned
imported trucks.
Across the three cities FSM policy is generally lacking and as a consequence, the present
framework of guiding private sector stakeholders does not lend itself to developing a
sustainable industry. A number of areas are in need of public policy intervention
i. Regulation : This has to be centralized and formulated
ii. Licensing: This is not coherent, the licensing regime and the whole system lacks
structure
iii. Industry Incentives: These are non-existent and therefore private sector operators have
to pay to provide public infrastructure. For example the lack of sufficient tipping points
causes long distance travel, which reduces the overall service rate of the industry.
iv. Taxation: Fiscal incentives lack for this industry even which may be deserved since the
service often qualifies as an essential service
Three business models proposed which would improve the value chain in the industry. These
are
i. Bio-centers as social enterprises: On the whole the Bio-centers have proven to be self-
sustaining once capitalized and have demonstrated positive health externalities
particularly at the low income household levels.
ii. Microfinance targeted at Sanitation services: A microfinance model and fund targeted at
sanitation services would enhance the access to credit to the sub-sector.
iii. Treatment plants enhancement for product drying, packaging and distribution. Treated
FS is more affordable that commercial fertilizers. The acceptability of treated FS re-use

The Bill & Melinda Gates Foundation EXECUTIVE SUMMARY
Landscape Analysis and Business Model Assessment in Fecal Sludge Management: Extraction and Transportation Models in Africa - Kenya
Losai Management Limited xxii
would be raised by increased public education, though already there is FR-re-use
acceptability. Investing in modernizing FSTP to rely less on weather for the drying
process would increase annual output. Kenya has wet conditions for 8 months of the
year. In addition, because of the bulky nature of treated FS packaging would ease
transportation and distribution to market. The large share of agriculture in the economy
at 24% of GDP would offer a market for the use of treated FS.
The immediate business opportunity in FSM identified during this study is investing in Bio-
centres. The bio-centre service has been noted to be self sustaining entities able to achieve cost
recovery and payback the initial capital outlay.

The Bill & Melinda Gates Foundation CHAPTER 1 : THE KENYA COUNTRY FSM BACKGROUND
Landscape Analysis and Business Model Assessment in Fecal Sludge Management: Extraction and Transportation Models in Africa - Kenya
Losai Management Limited 1-1
CHAPTER 1. THE KENYA COUNTRY FSM BACKGROUND
1.1 Introduction
The International FSM Study Initiative
Kenya – like many other developing countries elsewhere in the world, is currently faced with
the twin challenges of urban poverty and inadequate sanitation infrastructure in urban slums
and other low income areas. Globally, the WHO/UNICEF Joint Monitoring Program on line data
base indicates that in Developing Countries, over 1 billion urban dwellers lack provision
arrangements for the collection, emptying, haulage, safe disposal and treatment of fecal sludge
(FS) produced by on-site sanitation infrastructure – in their “latrine based cities.”
The Bill and Melinda Gates Foundation (BMGF) of USA, which is spearheading initiatives for the
promotion of “Sanitation that Works for the Poor,” observes that, in most of low income areas
of cities in the Developing Countries, the main method of emptying latrines when full is manual
based. And most worrying of such practices is that, sludge from latrines is usually “deposited
into nearby lanes, drains or open spaces.” Such unhygienic modes of fecal sludge disposal
obviously represent a significant risk to public health and more particularly, to the vulnerable
populations.
Notwithstanding the pervasiveness of this worrying situation in the “latrine based cities” of the
Developing Countries, BMGF notes that, “very limited or little research has been carried out to
understand the fecal sludge emptying as a service, and its effectiveness as a component, or an
integrated part of the cities’ sanitation provision.”
Accordingly, BMGF has rolled out an initiative for conducting exploratory research in 5 African
countries (and others in Asia) including Kenya and Ethiopia in East Africa, Senegal, Burkina Faso
and Nigeria in West Africa. This exploratory research initiative is aimed at informing the
sanitation sector on the dynamics of FSM and linkages to future investments in the sector by
governments, donors and other development partners.
This Report highlights the current FSM situation in Kenya and explores possibilities that exist for
up scaling the FS service provision “for the benefit of the low income segment of the
participating cities population.”
The Bill & Melinda Gates Foundation CHAPTER 1 : THE KENYA COUNTRY FSM BACKGROUND
Landscape Analysis and Business Model Assessment in Fecal Sludge Management: Extraction and Transportation Models in Africa - Kenya
Losai Management Limited 1-2
1.2 The Context of the FSM Study Initiative in Kenya
According to the recent (2009) national census, Kenya had a total population of 38.6 million –
occupying an area of 581,313 km2. This gives it an average density of only 66 persons per
square kilometre.
Kenya’s population has been rapidly growing over the past few decades: 3% between 1999-
2009; 2.9% 1989-1999; 3.4% 1979-1989; 3.8% 1969-79 (2009 National Census)
Alongside the general rapid population growth, Kenya has equally witnessed a fairly high rate of
urban population growth. The 2009 Census indicated, of the country’s total population, nearly a
third (32.3%) lived in cities and towns. This was up by 8% in the previous census. The Kenya
Vision 2030 (2007) forecasts that, if this trend continues unchecked, Kenya’s urban population
is expected to rise to 60% by the year 2030.
Of the total Kenyan urban population, 25% live in Nairobi alone, whilst in combination with
Mombasa and Kisumu – the 3 largest towns, between them they account for 36% of the total
urban population.
The rapid urbanization in Kenya has brought into its wake serious social and economic
problems, including: increased overcrowding; unemployment; environmental degradation;
poor infrastructure services, and above all, the pervasive proliferation of informal settlements –
characterized by extremely poor living conditions.
The earlier cited poor management of fecal sludge in Kenya’s urban areas therefore falls neatly
under these challenges, and it is in this context that, this situation will be appropriately
analyzed in this Report.
1.3 Water Supply and Sanitation (WSS) Coverage in Kenya
1.3.1 Water Supply
The Government of Kenya (GOK) has put a lot of effort in the recent past, to support the
development of sources of clean and safe water supplies to its citizens, in both the urban and
rural areas. In 2007, the National Water Services Strategy (NWSS) Paper reported that
sustainable access to safe water was estimated at 60% in urban areas and only 40% in rural
areas. The current situation – as derived from the 2009 Census shows that while 38.4% of urban

The Bill & Melinda Gates Foundation CHAPTER 1 : THE KENYA COUNTRY FSM BACKGROUND
Landscape Analysis and Business Model Assessment in Fecal Sludge Management: Extraction and Transportation Models in Africa - Kenya
Losai Management Limited 1-3
households in Kenya have access to piped water only 14.2% have access to piped water
supplies in their dwellings as shown in Table 1-1.
Table 1-1 : Percentage Households by Main Source of Water – Kenya
Water Source % Urban % Rural
1. Piped 38.4 13.4
2. Piped into Dwelling 14.2 2.2
3. Water Vendor 13.2 2.3
4. Spring /Well /Borehole 24.2 42.6
5. Rain Harvesting 0.7 1.3
Source: 2009 Kenya Population Census
Access to piped water in dwelling is a significant indicator, in that, piped water determines
usage of water borne sanitation facilities, and conversely, that the bulk of the others will
perforce resort to on-site modes of sanitation – with implications on FSM initiatives.
1.3.2 Sanitation
The National Water Services Strategy (2007) estimates that improved sanitation coverage in
Kenya in 2006 was 55% in urban areas and 45% in the countryside. The main modes of human
waste disposal according to the 2007 national census are Main Sewer, Septic Tank, Cess Pool,
VIP Pit Latrine and Pit Latrine (Table 1-2). Septic tanks refer to waterproof chambers (usually
rectangular) installed below ground to receive sewage. Septic tanks separate solid components
(sludge) and liquid components. After separation, the liquid components leave the septic tank
and are filtered through soakage pits or drainage fields and discharged to the soil. The solid
components remain in the septic tank where anaerobic decomposing and fermentation
processes reduce the sludge volume. The residual sludge has to be emptied at regular intervals
depending on the size of the tank. A Cesspool is a below ground chamber/pit to receive
sewage. The walls of the chamber/pit are lined with stone/concrete blocks or other materials
while the bottom of the chamber is not. Sewage solids settle to the bottom, floating grease and

The Bill & Melinda Gates Foundation CHAPTER 1 : THE KENYA COUNTRY FSM BACKGROUND
Landscape Analysis and Business Model Assessment in Fecal Sludge Management: Extraction and Transportation Models in Africa - Kenya
Losai Management Limited 1-4
scum collect at the top and liquid seeps into the ground, initially through the bottom and most
of the time through the side of the cesspool.
Table 1-2 : % of HH by Main Mode of Fecal Waste Disposal – Kenya
Mode of disposal % Urban % Rural
1. Main Sewer 19.5 0.2
2. Septic Tank 8.0 0.5
3. Cess Pool 0.7 0.1
4. VIP Pit Latrine 5.9 4.3
5. Pit Latrine (Covered/Uncovered 62.5 74.1
Source: 2009 Kenya Population Census
Significantly, only 19.5% of Kenyan households are connected to the sewerage system in all the
cities and towns in the country. The remainder uses on-site sanitation facilities – with the
simple pit latrine accounting for whopping 74.1% in the rural areas and 62.5% in towns. A point
to note here however, is that the construction and usage of the simple (or ordinary) pit latrine
varies considerably from place to place and in varied socio-economic situations – in regard to
safety, hygiene and privacy parameters, this variation is so much so that, some could not
qualify to be regarded as being “safe and hygienic mode of excreta disposal.”
The National Water Services Strategy aims at improving access to these two basic services by
2015, by attaining 80% access to safe and reliable water for urban areas and 75% for rural
areas. For sanitation, the aim is to increase access to 70% and 65% for urban and rural
households, respectively. And with regard to sewerage, the aim is to attain 40% and 10% access
for urban and rural areas, respectively.
1.4 Institutional and Legal Framework – At the National Level
The main institutional context for the effective delivery of the FSM in Kenya is outlined in the
National Environmental Sanitation and Hygiene (ESH) Policy, 2007 – which still provides the
primary policy framework for the Sector. To a limited extent, the NWSS Paper does provide

The Bill & Melinda Gates Foundation CHAPTER 1 : THE KENYA COUNTRY FSM BACKGROUND
Landscape Analysis and Business Model Assessment in Fecal Sludge Management: Extraction and Transportation Models in Africa - Kenya
Losai Management Limited 1-5
institutional responsibilities – but only within the Ministry of Water context – “for the
provision of water and sanitation services.”
The ESH document outlines the policies and strategies which could be implemented by the
Government of Kenya: “to create and enhance an enabling environment in which Kenyans will
be motivated to improve their hygiene behavior and environmental sanitation.”
More relevantly here, the ESH Policy outlines the roles and responsibilities of all the ESH actors.
Table 1-3 below shows a simplified framework for the institutional relationships in the ESH
network at the national level.
Table 1-3 : Institutional Framework for ESH – at the National Level
No. Name of Document Executing Agency Parent Ministry Institutional Role
1. Public Health Act, Cap 242
Division of Environmental Health
Ministry of Public Health and Sanitation (MPHS)
Ensuring conformity to national norms and standards, and making regulatory interventions to improve compliance
2. Local Government Act, Cap 265
Local Government Authorities (LGAs): City/Municipal Councils
Ministry of Local Government (MOLG)
Oversight responsibility over LGAs for ensuring compliance with the provisions of the Public Health Act and protection of the environment from pollution
3.
Environment Management Coordination Act, 1999
National Environment Management Authority (NEMA)
Ministry of Environment and Mineral Resources (MEMR)
Enforcement of the law for the protection and conservation of the environment, and gazettement of regulations to control operations regarding various environmental protection concerns
4. Water Act, 2002
Water Service Boards (WSBs) Water Service Providers (WSPs)
Ministry of Water and Irrigation (MOWI)
Responsible for developing water and sewer facilities, and provision of water and sanitation services – to complement ESH activities
5.
Non-Governmental Organizations Coordination Act, 1990
Non-Governmental Organizations (NGOs)
Various Line Ministries
To be encouraged by GoK to participate in ESH activities – with their own funds, or as agents for others, to scale up the ESH target achievement
6. Relevant Companies Acts
Various Private Sector Actors
Various Line Ministries
To be encouraged by GoK, to invest in ESH services and to provide consulting services
7. Relevant Laws Households and Communities
Relevant Service Providers
Responsible for improving ESH services in their properties – including proper use and care of the installed facilities

The Bill & Melinda Gates Foundation CHAPTER 1 : THE KENYA COUNTRY FSM BACKGROUND
Landscape Analysis and Business Model Assessment in Fecal Sludge Management: Extraction and Transportation Models in Africa - Kenya
Losai Management Limited 1-6
NB: The Ministry of Housing, which is currently implementing the Kenya Informal Settlements
Improvement Project (with World Bank financing) in various towns in Kenya – including Nairobi,
Mombasa and Kisumu, is also a significant stakeholder in the FSM issues.
1.5 The Objectives and Scope of the FSM Study
As part of its global initiative in the broad area of Water, Sanitation and Hygiene (WASH) sector,
BMGF has commissioned Losai Management Ltd of Nairobi, to conduct an exploratory research
on the FSM situation in 3 selected Kenyan cities. In doing so, Losai is working in collaboration
with the Kenya Water Service Providers Association (WASPA) – a lobby group for all the water
and sewerage providers in the country.
The main objectives of the Study are to understand fecal sludge emptying/transportation in the
country and to identify opportunities for business model and product innovation. More
specifically the Study has the following fivefold objectives, viz:
a. To assess the current situation as regards the level of and practices related to, the
sludge extraction and transportation business – including that of the existing products
and technologies used.
b. To carry out market analysis on the current and potential size and scope of fecal sludge
extraction and transportation operations, including outlining the roles of public sector
actors in the sector.
c. To review the current service delivery models for pit/septic tank emptying and
transportation in the selected cities.
d. To carry out business model analysis – to quantitatively determine the cost and revenue
levels and barriers to profitability of the extraction and transportation supply chain
models.
e. To make appropriate recommendations for the improvement of the quality and
sustainability of urban sanitation chain – on issues of institutional, governance, financing
models, product technology and business models – at both the local and global levels.
BMGF criteria for the selection of the local case study sites in each participating country are
that:
• 3 cities should be covered – in order to understand the full spectrum of urban sanitation
delivery models for the country.

The Bill & Melinda Gates Foundation CHAPTER 1 : THE KENYA COUNTRY FSM BACKGROUND
Landscape Analysis and Business Model Assessment in Fecal Sludge Management: Extraction and Transportation Models in Africa - Kenya
Losai Management Limited 1-7
• The selected cities should include the capital city, a secondary large city and a mid-sized
city.
• All the 3 cities selected must be ones which have sludge treatment plants and official
dumping sites.
The Kenya Study Team selected the 3 largest cities in the country which meet all the above
criteria as follows (in order of their relative importance and size): Nairobi (the capital), in the
center; Mombasa – the port city in the east – at the coast; and Kisumu in the west – by the
lakeside. Evident here is that, the 3 cities are geographically dispersed; have varying climatic
and topographical characteristics; and represent diverse cultures and socio-economic mix.
1.6 Brief Profiles of the Selected Study Cities
Kenya is bordered by Somalia to the northeast, Ethiopia to the north, South Sudan to the
northwest, Uganda to the west, Tanzania to the south and Indian Ocean to its southeast. The
scope of work requires the research to be carried out in three cities in order to better
understand the full spectrum of urban sanitation service delivery models in the country. The
research for the Kenyan component was undertaken in Nairobi, Mombasa and Kisumu (Figure
1-1).
Figure 1-1 : Location of selected Cities: Nairobi, Mombasa and Kisumu

The Bill & Melinda Gates Foundation CHAPTER 1 : THE KENYA COUNTRY FSM BACKGROUND
Landscape Analysis and Business Model Assessment in Fecal Sludge Management: Extraction and Transportation Models in Africa - Kenya
Losai Management Limited 1-8
Nairobi
Nairobi is the capital and largest city of Kenya. The city and its surrounding area also form the
Nairobi County. Founded in 1899 as a simple rail depot on the railway linking Mombasa to
Uganda, the town quickly grew to become the capital of British East Africa in 1907 and
eventually the capital of the independent Kenyan republic in 1963. The city lies on the Nairobi
River and has an elevation of 1795 m above sea-level. According to the 2009 Census, Nairobi is
the most populous city in East Africa with 3,138,295 inhabitants living within 696 km2. It is
estimated that Nairobi's population will reach 5 million in 2015. There is a wide variety of
standards of living in Nairobi. Most wealthy Kenyans live in Nairobi but the majority of
Nairobians are average and poor. Half of the population has been estimated to live in slums
which cover approximately 5% of the city area. Kibera is one of the largest slums in Africa, and
is situated to the west of Nairobi. The slums cover approximately two square kilometres and
are on government land. Other notable slums include Mathare and Korogocho. Altogether, 66
areas are categorized as slums within Nairobi. The Nairobi City Council manages the affairs of
the City of Nairobi.
Mombasa
Mombasa is the second-largest city in Kenya. Lying next to the Indian Ocean, it has a major port
and an international airport. The city also serves as the centre of the coastal tourism industry.
The town is also the headquarters of Mombasa District.
The city has a population of 939,370, as per the 2009 census, and is located on Mombasa
Island, which is separated from the mainland by two creeks: Tudor Creek and Kilindini Harbour.
The island is connected to the mainland to the north by the Nyali Bridge, to the south by the
Likoni Ferry and to the west by the Makupa Causeway, alongside which runs the Kenya-Uganda
Railway. The port serves both Kenya and countries of the interior, linking them to the Ocean.
Being a coastal town, Mombasa is characterized by a flat topography. The town of Mombasa is
centered on Mombasa Island, but extends to the mainland. Mombasa has a warm, tropical
climate. The amount of rainfall depends essentially on season. The rainiest months are April
and May, while in January to February the rainfall is minimal.
Mombasa is managed by a municipal authority, the Mombasa Municipal Council. Mombasa is
the main city in the Coast Province, and one of such administrative regions in Kenya. The
district boundaries are coterminous with those of the municipal authority.

The Bill & Melinda Gates Foundation CHAPTER 1 : THE KENYA COUNTRY FSM BACKGROUND
Landscape Analysis and Business Model Assessment in Fecal Sludge Management: Extraction and Transportation Models in Africa - Kenya
Losai Management Limited 1-9
An estimate from the Kenya Integrated Household and Budget Survey (2005/6) shows that
37.6% of Mombasa's Households fall below the poverty line hardly an improvement over the
38.2% recorded in the Welfare monitoring survey of 1997. Virtually all the urban poor, well over
a third of Mombasa's total population, live in more than 55 slums across the City. The poor face
stark living conditions in these settlements, paying exorbitant prices for water, over 58% using
pit latrines and 54% dumping rubbish in open areas and drains.
Although there is diversity of land ownership patterns in slum areas, tenure is often insecure,
leaving residents with little incentives to invest in their dwellings.
Kisumu
Kisumu is the third largest city in Kenya with an estimated population of 409,928. It is situated
in the West of Kenya and is bordered by Lake Victoria to the southwest, and the sugar belt and
Kano irrigation scheme to the east. It has an area of 417 km2 (157 km2 of water and 260 km2 of
land). Kisumu has an elevation of 1131 m above sea level.
The city lacks adequate shelter, with approximately 60 percent of the urban population that
reside in the peri-urban and informal settlements lacking basic services. Approximately 75
percent of peri-urban inhabitants live in temporary and semi-permanent structures.
According to a UN-Habitat study (2004) the city experiences a high unemployment rate of
about 30%, and the bulk of the population, particularly in the informal and slum settlements,
works in the informal sector: 52% of the working population is engaged in informal activities.
Low income and job insecurity are the biggest challenges that the poor of Kisumu face. 48% of
the urban population lives within the absolute poverty bracket.
Kisumu experiences the highest average urban poverty levels at 48% against a national average
of 29%.
The Bill & Melinda Gates Foundation CHAPTER 2 : METHODOLOGY OF THE FSM STUDY Landscape Analysis and Business Model Assessment in Fecal Sludge Management: Extraction and Transportation Models in
Africa - Kenya
Losai Management Limited 2-10
CHAPTER 2. METHODOLOGY OF THE FSM STUDY
2.1 Literature Review
The data used in the preparation of this report were collected in the month of August 2011
from a variety of sources. Information on water and sanitation was obtained mainly from
secondary sources – especially GOK policy, strategy and planning documents and reports. These
secondary sources supplemented the main primary data stocks which were derived from 3
collection processes, viz (a) the household survey, (b) in depth interviews with the key
stakeholders and (c) Observation of FSM phenomena. The data collection instruments used in
this regard are included as Appendix A and also in Volume II of II of this report.
In order to fully understand and internalize the full range and dynamics relating to the FSM
activities in the country and elsewhere in the developing countries, the Study Team delved into
the various sources of relevant secondary information, including: past studies ; official policy
and planning documents and websites; and reports of the relevant GOK line agencies. Such
sources are listed in the references section of the report and the main ones are reviewed here
below – highlighting how they relate to the FSM issues.
1. Bill and Melinda Gates Foundation, 2011: Water, Sanitation and Hygiene: Grand
Challenges Exploration
This has already been quoted earlier in Section 1.1 of this report.
The document has references to the global fecal sludge situation, including: the
magnitude of the problem and the glaring lack of knowledge on the non-piped
sanitation services in the developing countries. The document cites such authorities as
WHO – UNICEF Joint Monitoring on-line database, to powerfully drive home the
message of the huge challenges confronting FS management in particular and
sanitation services in general.
2. Straus M. et al, 2000, 2003: On-Site Sanitation: When the Pits are Full: Planning for
Resource Protection in Fecal Sludge Management
Observes the predominance of on-site sanitation systems (OSS) over sewered
sanitation in developing countries. He notes that in Sub-Sahara Africa, “more than 75%
of householders in large cities and up to 100% in towns are served by on-site sanitation
facilities.” He therefore proposes that governments should put in place adequate
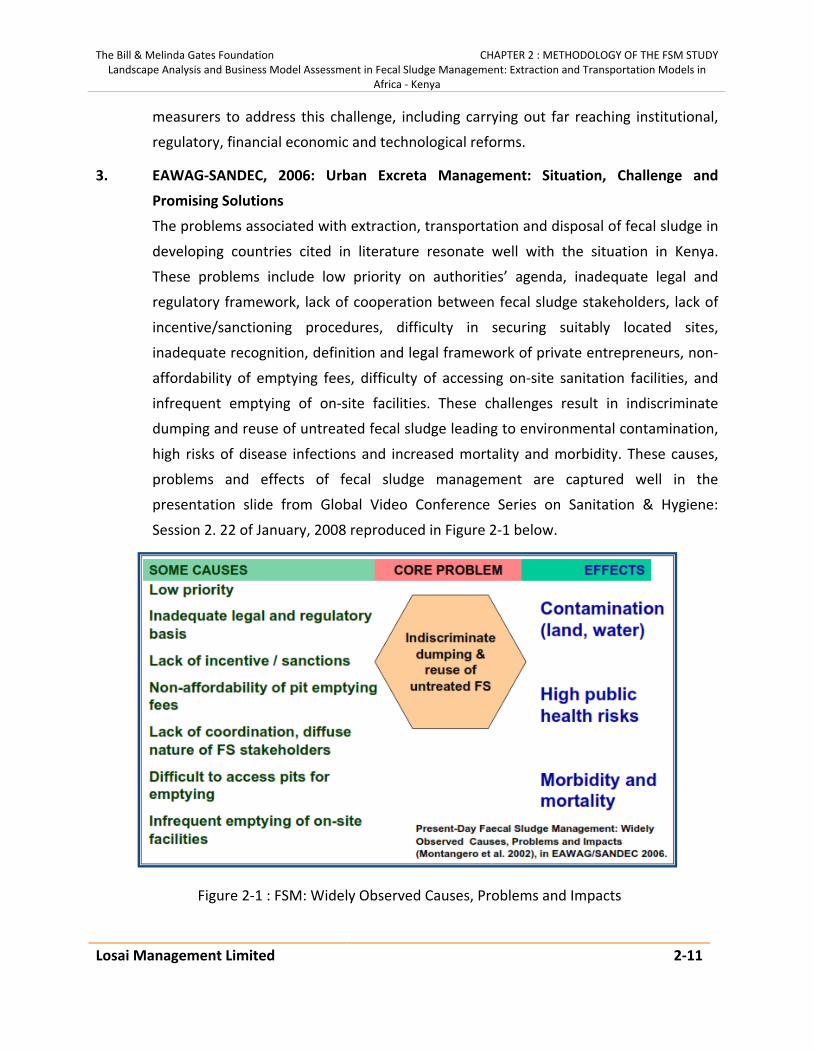
The Bill & Melinda Gates Foundation CHAPTER 2 : METHODOLOGY OF THE FSM STUDY Landscape Analysis and Business Model Assessment in Fecal Sludge Management: Extraction and Transportation Models in
Africa - Kenya
Losai Management Limited 2-11
measurers to address this challenge, including carrying out far reaching institutional,
regulatory, financial economic and technological reforms.
3. EAWAG-SANDEC, 2006: Urban Excreta Management: Situation, Challenge and
Promising Solutions
The problems associated with extraction, transportation and disposal of fecal sludge in
developing countries cited in literature resonate well with the situation in Kenya.
These problems include low priority on authorities’ agenda, inadequate legal and
regulatory framework, lack of cooperation between fecal sludge stakeholders, lack of
incentive/sanctioning procedures, difficulty in securing suitably located sites,
inadequate recognition, definition and legal framework of private entrepreneurs, non-
affordability of emptying fees, difficulty of accessing on-site sanitation facilities, and
infrequent emptying of on-site facilities. These challenges result in indiscriminate
dumping and reuse of untreated fecal sludge leading to environmental contamination,
high risks of disease infections and increased mortality and morbidity. These causes,
problems and effects of fecal sludge management are captured well in the
presentation slide from Global Video Conference Series on Sanitation & Hygiene:
Session 2. 22 of January, 2008 reproduced in Figure 2-1 below.
Figure 2-1 : FSM: Widely Observed Causes, Problems and Impacts

The Bill & Melinda Gates Foundation CHAPTER 2 : METHODOLOGY OF THE FSM STUDY Landscape Analysis and Business Model Assessment in Fecal Sludge Management: Extraction and Transportation Models in
Africa - Kenya
Losai Management Limited 2-12
4. Water and Sanitation Program (2011): Economic impacts of poor sanitation in Africa
Notes that the current sanitation investment in Kenya is much lower that the
recommended minimum of 0.5% of GDP. The publication further observes that,
“increased investments in sanitation and hygiene promotion are required not only to
realize health and welfare benefits, but also to avert large economic losses.
5. Water and Sanitation Program (2004): Sanitation is a Business, Approaches for
demand-oriented policies
Prepared for the Swiss Agency for Development and Cooperation the publication
prescribes how governments should be seriously involved in FSM by: initiating and
implementing effective sector plans; building FS disposal sites; treating sludge
adequately; licensing of private entrepreneurs; guaranteeing competition between
service providers; creating incentives; and applying sanctions to offenders.
6. Rose Osinde, 2006: Fecal Sludge Management and On-Site Sanitation in Lunga Lunga
and Korogocho Informal Settlements in Nairobi
The study on Fecal Sludge Management & Sanitation in Informal Settlements (Rose
Osinde, 2006) provides data on fecal sludge management in two informal settlements
in Nairobi: Lunga Lunga and Korogocho. The objective of the study was to identify
institutional policy gaps, develop strategies for addressing community-level constraints
for better sanitation service provision, facilitate coordination and partnership between
stakeholders (including conflict management) and identify areas of assistance from
external support agencies. The study identified 15 toilets in the settlement, majority
either connected to the sewerage system or discharging directly to Ngong River. In
Korogocho, the study identified manual exhausters who use 200 litre drums, transport
in handcarts and discharge into the polluted Nairobi River at a cost of Kshs 300 (USD
4.15) per load. The study also identified concerns/issues affecting fecal sludge
management at the national, utility/Regulator, SSIP, Community and
Donor/Development agencies levels. The identified concerns/issues are summarized in
Table 2-1.

The Bill & Melinda Gates Foundation CHAPTER 2 : METHODOLOGY OF THE FSM STUDY Landscape Analysis and Business Model Assessment in Fecal Sludge Management: Extraction and Transportation Models in
Africa - Kenya
Losai Management Limited 2-13
Table 2-1 : FSM Concerns/Issues: Lunga Lunga & Korogocho Settlements
National Level: • Inadequate investment and budget allocation
for sanitation sector. • Practical and sustainable delivery mechanisms
for sanitation services in informal settlements not yet developed.
• Inter-sectoral coordination and collaboration lacking
Utility/Regulator level: • Lack of institutional and innovative technological know- how
on the best practices for sanitation services in the informal settlements.
• Un-defined link between utility/regulator and the SSIPs – roles and responsibilities not regularized & no existing governance structure.
• Lack of systematic ground-level coordination and collaboration with other interventions
• No control over activities of existing SSIPs SSIP Level: • Lack of proper emptying facilities – health
and security risks • No designated desludging points – no access
to Municipal sewers, even where available • Lack of formal recognition of service – affects
time of work; social stigma • Unregulated tariffs – lack of accountability. • Lack of emphasis on link with SSIPs for water • Lack of governance structure/regulatory
framework
Community Level: • No consumer voice – exploitation by SSIPs - no
accountability – unregulated tariffs • Compromised water quality (through cross- contamination) • Communities pay for sanitation on water bills but don’t
receive services • Security issues for women and children • Lack of focus on hygiene promotion • Impracticality of individual basic sanitation facilities • space limitation and tenure issues
Donor & development agencies Level: • Uncoordinated interventions – too many interventions with little overall impact • Differing approaches for urban/rural/peri-urban • Linkages between sanitation interventions & Land/Shelter policy
Source: Rose Osinde, 2006: Fecal Sludge Management and On-Site Sanitation in Lunga Lunga and Korogocho Informal Settlements in Nairobi
7. Water and Sanitation Program & Maji na Ufanisi: 2004: Understanding Small Scale
Providers of Sanitation Services: A Case Study of Kibera (Nairobi)
Limited data is available on fecal sludge management in the Kibera informal
settlements from field surveys carried in 2005 by World Banks Water and Sanitation
program and Maji na Ufanisi, a local Non-Governmental Organization. The study
interviewed 51 service providers (manual pit emptiers, truck emptier employees,
public toilet employees etc.) and other stakeholders. The purpose of the study was to
provide a better understanding of who the Small Scale Providers of Sanitation Services
(SSPSS) are, and the range of services they offer, with a view to identifying and
recommending improvements to the environment, within which they operate, and the
quality and efficiency of the services they offer. The services offered by these providers
included latrine management; latrine construction; and latrine emptying.

The Bill & Melinda Gates Foundation CHAPTER 2 : METHODOLOGY OF THE FSM STUDY Landscape Analysis and Business Model Assessment in Fecal Sludge Management: Extraction and Transportation Models in
Africa - Kenya
Losai Management Limited 2-14
The study found that sludge emptying was a key activity for SSPSS since pits needed to
be emptied every 10 months. The findings are represented in the Table 2-2 and Figure
2-2.
Table 2-2 Key Findings on Small Scale Providers of Sanitation Services in Kibera
A summary of the key findings from this study are as follows: • The three main emptying techniques employed in Kibera are
manual, mechanical, and gravitational. • Few manual emptiers can afford basic protective gear such as
gloves and boots for their work. • Manual emptiers are ignored by public authorities, despite the
role they play in the domestic pit emptying market. • Manual emptying will remain as a necessary method for
exhausting pit latrines for as long as vehicle access is limited in Kibera.
• Heavy sludge and solid waste in the pit and accessibility hampers mechanical emptying
• Accessibility is the greatest deterrent to real competition in mechanical emptying in Kibera.
• The average pit capacity is 2-3 m3
• Gravitational emptying is generally only possible when the pit is next to a river or a drain as the contents flow directly into the water.
• Investment for manual emptying equipment is from personal savings
• The SSPs are poorly organized, have no formal service associations and very little contact with other stakeholders. Better coordination would increase their bargaining power. Coordination through formal associations would help transform them into real partners in the sanitation sector. Regulating mechanisms need to be developed to avoid the formation of cartels.
• There is need to improve the working environment of SSPs, the most critical of which is to enable better use of existing sewers for sludge disposal.
• There is need to promote dialogue between various stakeholders to clarify issues and obstacles, to better articulate activities of the various actors, and to make better use of the skills and know-how of the local private sector.
• Create an enabling framework for SSPSS Start discussion between public sanitation authorities and SSPSS to develop agreements, and good professional practices especially with regard to sludge disposal. This framework should not restrain SSPSS, but rather take advantage of their flexibility.
• There is need to develop and implement a sludge disposal policy.
Source: Water and Sanitation Program & Maji na Ufanisi: 2004: Understanding Small Scale Providers of Sanitation Services: A Case Study of Kibera (Nairobi)
Figure 2-2 : Household Options in Kibera when Pit Larine Fills up

The Bill & Melinda Gates Foundation CHAPTER 2 : METHODOLOGY OF THE FSM STUDY Landscape Analysis and Business Model Assessment in Fecal Sludge Management: Extraction and Transportation Models in
Africa - Kenya
Losai Management Limited 2-15
8. Ministry of Health, Kenya, 2007: The National Environmental Sanitation and Hygiene
(ESH) Policy
This was briefly alluded to earlier in Section 1.4. The document analyses the general
ESH situation in the country in general and identifies the main challenges that must be
addressed in the short and long term; proposes practical approaches for effective
hygiene promotion and sanitation marketing; choice of appropriate technologies; and
financing mechanisms for ESH interventions.
Specifically with regard to FSM, the ESH policy identifies 2 main concerns:
a. That although in cities and towns water-borne sanitation is the desired mode of
human waste disposal; the installed treatment plants are often non-functional due
to poor operation and maintenance. This has resulted in discharge of raw sewage
into the watercourses – posing grave danger to public health.
b. That due to inadequate basic sanitation services, residents of urban slums
discharge fecal sludge in streams running through the settlements – this again
posing serious danger to those residents health and to that of the downstream e.g.
“population”.
9. Ministry of Water and Irrigation, Kenya, 2007: The National Water Services Strategy
(NWSS): 2007 to 2015
Like the ESH policy, the NWSS (also cited earlier in sections 1.3 and 1.4), equally:
identifies the main challenges encountered in the provision of adequate water and
sewerage services and proposes workable strategies to address such challenges.
In sections specifically focusing on FSM issues, NWSS equally notes that “on-site
sanitation facilities in urban slums dispose their sludge at nearby streams – thus
contaminating ground and surface water.” The document further observes that funds
for rehabilitation, upgrading and expansion of existing dilapidated facilities. “are
insufficient to meet the huge demand for sustainable access”. To address these
challenges - in line with its set goals, NWSS proposes to substantially increase access to
waterborne sewage collection, treatment and disposal, both in the urban and rural
areas of the country. (See also section 1.3).

The Bill & Melinda Gates Foundation CHAPTER 2 : METHODOLOGY OF THE FSM STUDY Landscape Analysis and Business Model Assessment in Fecal Sludge Management: Extraction and Transportation Models in
Africa - Kenya
Losai Management Limited 2-16
10. Government of the Republic of Kenya, 2007: Kenya Vision 2030 A Globally
Competitive and Prosperous Kenya
This document constitutes the blueprint for the country’s current development policy
within the framework of the country’s long term development strategy.
Vision 2030 aims at accelerating growth in GDP up to 10% p.a, so as to transform Kenya
into a middle income country by 2030. The Vision is based on 3 pillars: economic, social
and political development, which will depend on micro economic stability, increased
investments in transport and energy infrastructure, education and governance reforms.
It is envisaged that the implementation of these strategies will in the short and long
term, enhance equity and wealth creation opportunities for the poor and enable the
country to achieve the Millennium Development Goals (MDGs) and reduce poverty to
minimum levels.
The goals of the ESH policy and NWSS are firmly factored into the Vision 2030’s Social
Pillar: “to ensure water and improved sanitation availability and access to all Kenyans.”
To achieve this, Vision 2030 emphasizes, “Water and sewerage infrastructure will have
to rise in order to meet the standards associated with middle income countries.”
2.2 Situational Analysis Methodology
2.2.1 Household Survey Design
National Sample Size
As provided for in the Scope of Work for the Study, a total of at least 1000 households for the
country were sampled. This was distributed in the 3 Study cities as follows: Nairobi – 400;
Mombasa – 400; Kisumu – 400. The main instrument used was the Household Survey
Questionnaire (Annex 1) – which had already been pre-designed by BMGF. However, the Study
Team made a few modifications (without altering the substance and format), to ensure
nestedness in the Kenyan context.
Population and Sampling
The survey targeted residents of Kisumu City, Mombasa City and Nairobi City. The standard
sampling procedures for the household survey were used – where the sampling points, i.e. the
lowest unit of data analysis was the lowest Kenyan administrative unit: the sub-location. The
main criterion for the selection of where the household survey could be conducted within the
The Bill & Melinda Gates Foundation CHAPTER 2 : METHODOLOGY OF THE FSM STUDY Landscape Analysis and Business Model Assessment in Fecal Sludge Management: Extraction and Transportation Models in
Africa - Kenya
Losai Management Limited 2-17
sub-location was that, that particular area was not sewered. Another consideration for
selection of a sub-location for the survey was its relative socio-economic standing in the city –
falling under each of the following categories: high income (HI), middle income (MI) and low
income (LI) areas.
Based on the above criteria, a sample of 400 households per city was used in the survey. The
sample size for each sampled sub-location was proportionately allocated depending on the
number of households in the sub-location based on figures obtained from the 2009 National
Population Census. Although the survey was essentially urban core focused, special
consideration was given to the relatively large peri-urban settlements in the city, which were
accordingly allocated a few households from the sample frame to participate in the survey. This
was aimed at enabling the Study Team “get a feel” of the FSM situation in areas of the city
outside the core urban zone.
In determining the sample size, the following statistical formula was applied.
n=N/ (1+ (N*e2))
Where: n is Sample Size
N is Total Population
e is the precision level (taken as 5% at 95% confidence level)
A detailed methodology of the survey including breakdown of the distribution of the sample
sizes to the various locations is presented in Volume II of II of this report.
Training to Conduct Household Survey
In July 2011, a team of 4 supervisors were extensively trained – to in turn be the trainers of
enumerators, in the approaches, methods and procedures, of conducting the household survey.
The supervisors were centrally trained in Nairobi, who then proceeded to train the Enumerators
for the respective cities.
Fieldwork
Field work constituted the most substantive phase of the survey, which involved interviewing
household respondents – using the Questionnaire instrument, to collect primary data on FSM in
the 3 cities. Household interviews were conducted in each city during the following times:
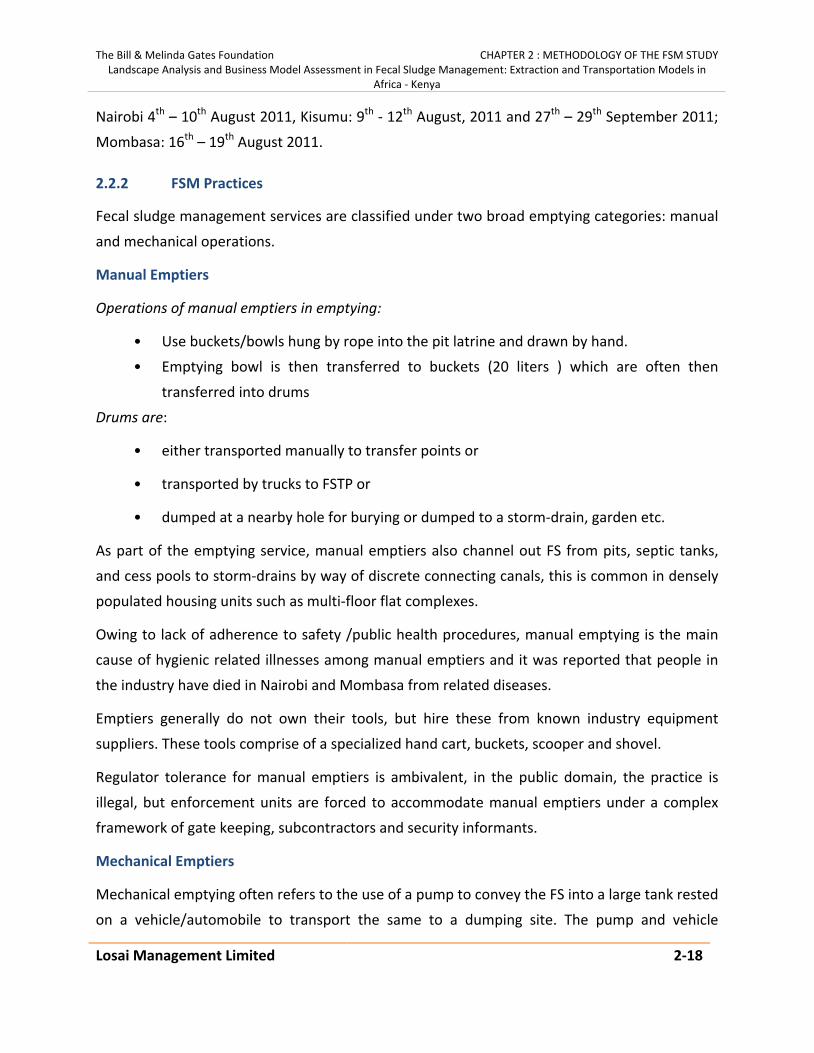
The Bill & Melinda Gates Foundation CHAPTER 2 : METHODOLOGY OF THE FSM STUDY Landscape Analysis and Business Model Assessment in Fecal Sludge Management: Extraction and Transportation Models in
Africa - Kenya
Losai Management Limited 2-18
Nairobi 4th – 10th August 2011, Kisumu: 9th - 12th August, 2011 and 27th – 29th September 2011;
Mombasa: 16th – 19th August 2011.
2.2.2 FSM Practices
Fecal sludge management services are classified under two broad emptying categories: manual
and mechanical operations.
Manual Emptiers
Operations of manual emptiers in emptying:
• Use buckets/bowls hung by rope into the pit latrine and drawn by hand.
• Emptying bowl is then transferred to buckets (20 liters ) which are often then
transferred into drums
Drums are:
• either transported manually to transfer points or
• transported by trucks to FSTP or
• dumped at a nearby hole for burying or dumped to a storm-drain, garden etc.
As part of the emptying service, manual emptiers also channel out FS from pits, septic tanks,
and cess pools to storm-drains by way of discrete connecting canals, this is common in densely
populated housing units such as multi-floor flat complexes.
Owing to lack of adherence to safety /public health procedures, manual emptying is the main
cause of hygienic related illnesses among manual emptiers and it was reported that people in
the industry have died in Nairobi and Mombasa from related diseases.
Emptiers generally do not own their tools, but hire these from known industry equipment
suppliers. These tools comprise of a specialized hand cart, buckets, scooper and shovel.
Regulator tolerance for manual emptiers is ambivalent, in the public domain, the practice is
illegal, but enforcement units are forced to accommodate manual emptiers under a complex
framework of gate keeping, subcontractors and security informants.
Mechanical Emptiers
Mechanical emptying often refers to the use of a pump to convey the FS into a large tank rested
on a vehicle/automobile to transport the same to a dumping site. The pump and vehicle

The Bill & Melinda Gates Foundation CHAPTER 2 : METHODOLOGY OF THE FSM STUDY Landscape Analysis and Business Model Assessment in Fecal Sludge Management: Extraction and Transportation Models in
Africa - Kenya
Losai Management Limited 2-19
mechanism are generally standard but capacities of tanks differ and therefore the load capacity
of trucks varies from 6 cubic metres to as high as 22 cubic metres.
In mechanical empting the vehicle is positioned next to the FS reservoir which may be a septic
tank, cesspool or a pit latrine. The pump hose is then directed at the pool and pumping begins
with emptying taking place. The key determinant of amount to be emptied is the size of the
transportation tank. A number of local names are used to describe the ME trucks including –
“exhauster truck, honey sucker truck or simply exhauster”.
There are two main types of trucks available in Kenya, one, locally fabricated and two, second
hand imports of specialized trucks. The fabrication service is available in the country and was
the main mode of mechanical truck production. In this model, the vehicle chassis is obtained
separately and the fabricator builds the tank and installs the pump.
In the case of the second hand (used) imported trucks these come as complete units and there
is no local customization to the vehicle. The second hand imported trucks are now more
preferred over the fabricated units. This is due to a number of reasons which include:
1. New or reliable truck chassis are expensive
2. The cost of a second hand imported truck –in its complete form- is lower than the
cost of a new chassis and installation of devices
3. Installation and fabrication work takes a much longer time to complete, than the
entire process of importing a truck
4. There is no down time with an imported truck and therefore these have an early cash flow incidence than the fabricated units.
2.2.3 Methods to Validate Financial Data
There are three sources of financial data.
1. Financial accounts prepared for purposes of tax returns where applicable.
These can only be given voluntarily to third parties by the tax payer. For
operators with books of accounts they were unwilling to give their
financial reports.
2. Financial and business accounts prepared for stakeholders such as board
of directors, lenders and other shareholders. These may be obtained from
the stakeholders except that commercial banks would not be in a position
The Bill & Melinda Gates Foundation CHAPTER 2 : METHODOLOGY OF THE FSM STUDY Landscape Analysis and Business Model Assessment in Fecal Sludge Management: Extraction and Transportation Models in
Africa - Kenya
Losai Management Limited 2-20
to share such confidential information. None of the operators asked was
willing to share such documents.
3. Financial estimates obtained from operators based on oral interviews.
This was the method used to obtain financial records. It was validated by
way of interviews of stakeholders such as employees of the operator and
by reviewing data maintained at the tipping point. Moreover, financial
information released by the finance department of the utility correlated
the frequency of dumping by operators at the tipping point.
In the three cities of Kisumu, Mombasa and Nairobi under study operators can be classified as
formal and informal. The informal have no office premises and largely have no full time
employees. The formal operators on the other hand have office premises and full time
employees. In both instances however, financial and business accounts were not accessible as
operators were unwilling to share formal financial reports. The formal operators maintain
books of accounts given that they have corporate tax registration, established offices, have full
time employees and their operations have been corporatized. For the informal operators these
businesses do not keep any accounting information applicable for tax purposes and this may be
explained by (a) they are sole proprietorships and as such the tax accounts would not
differentiate the income from the business with income for the same individual from other
sources. (b) the business income is not subject to any other tax outside of income tax and
therefore records are not necessary. For instance, since the sanitation services are –sales tax or
VAT tax exempt- there is no compliance requirement for record keeping. (c) the business
owners maintain a sole proprietorship status because the same is not obliged under local laws
to undertake financial accounting on an annual basis.
Under these circumstances, for the three cities, financial data was obtained through
interviewing the operators. The estimates then received were validated through further
interviews with employees of the operators and cross checked with data obtained from
competition. Printed financial data is difficult to obtain especially from informal businesses. This
presents challenges not only to tax policy but also to financiers who are unable to estimate the
financial health of these organizations.

The Bill & Melinda Gates Foundation CHAPTER 2 : METHODOLOGY OF THE FSM STUDY Landscape Analysis and Business Model Assessment in Fecal Sludge Management: Extraction and Transportation Models in
Africa - Kenya
Losai Management Limited 2-21
2.2.4 Treatment Plant/Dumping Sites Model
One of the earliest Wastewater Treatment Plants (WTP) in Kenya is found in Mombasa. The
Kipevu WST was first commissioned in 1952 and last expanded in 2003. It is located in west
Mainland of Mombasa and is a conventional type of treatment plant. Mombasa has a second
Wastewater Treatment Plant (WTP) Kizingo Wastewater Treatment Works which was
commissioned in 1962. This plant is designed for preliminary treatment (screening and grit
removal) and primary treatment (sedimentation).
Across the three cities two broad types of treatment plants/dumping sites are known to exist,
one-conventional type and two stabilization pond type. The conventional type includes
Kariobangi Treatment Plant, Kisumu Central Wastewater Treatment District (CWTD), while the
stabilization pond include Nyalenda stabilization pond in Kisumu and Dandora estate sewerage
treatment plant which is located at Ruai, 30 Km east of the Nairobi city centre along Kangundo
Road. It uses stabilization ponds and has a dry weather capacity of 80,000 m3/d. Both industrial
and domestic sewage are discharged at the plant.
The stabilization pond model tends to only have a filtration tank and drying beds. It employs the
use of ultra violets rays from sunlight to kill micro organisms in the fecal sludge.
In the conventional type, there is use of mechanical aeration, filtration and discharge in
treatment of fecal sludge. At the inlet the fecal sludge is filtered for solids and metals before
being released into a tank where it is stirred for effective concentration. The fecal sludge is then
moved to filtration tank and then to sedimentation tank which has a filter of rocks and sands
for separation of solid and liquid. Wastewater treatment standards are included in the design
such as a BOD of 560 mg/l or a design of BOD/SS effluent standard of 20/30. The processed
fecal sludge which is transforming to organic fertilizer is left to dry naturally in the drying beds.
FS sludge collected by emptiers whether mechanically or manually is disposed to the dumping
site via a tipping point. Tipping points are characteristically man-holes located at a point on the
trunk sewer line and designated by the Utility operator as the disposal point. In all the three
cities there is a single designated operational tipping point serving all emptiers.
In order to understand the treatment plant processes, visits will be made to these facilities and
technical staff working at these locations will be interviewed. The actual visits and discussions
will entail full descriptions of the treatment process from delivery of FS to post treatment.

The Bill & Melinda Gates Foundation CHAPTER 2 : METHODOLOGY OF THE FSM STUDY Landscape Analysis and Business Model Assessment in Fecal Sludge Management: Extraction and Transportation Models in
Africa - Kenya
Losai Management Limited 2-22
2.3 Determination of Financial Flows and Key Stakeholders
There are 6 key stakeholders in Fecal Sludge Management:
1. Fecal Sludge (FS) extraction operators (private entities and public entities where
they exist)
2. Utility companies who issue permits for use of the dumping sites
3. Fecal Sludge Treatment Plants (FSTP) who manage the disposal of the sludge
4. Local authorities who issue business permits
5. Environmental authorities who vet the equipment used for these services
6. Customers who form the demand component of the service
Each of these stakeholders has an economic incentive under the present framework to support
the proper functioning of FS management services.
The flow of funds (Figure 2-3) begins with clients and should terminate with the end user of the
fecal sludge (product/byproduct).
Figure 2-3 : FSM Flow of Funds Expected Financial Flows in FSM Operations
Emptiers earn an income from the clients. There is therefore a strong business case for
emptiers to offer competitively priced services. Pricing is important because of the general
income levels of households and the substitution effect noted when prices are out of reach of
households.
FSTP and Utility companies earn an income from the emptiers in the form of licensing fees. The
FSTP also earns an income from the sale of treated FS.
Commercial Premises
Individual Households
End User e.g. Farmer
Fecal Sludge
Treatment Plant
Emptiers

The Bill & Melinda Gates Foundation CHAPTER 2 : METHODOLOGY OF THE FSM STUDY Landscape Analysis and Business Model Assessment in Fecal Sludge Management: Extraction and Transportation Models in
Africa - Kenya
Losai Management Limited 2-23
Utility companies generally obtain investment capital from 3 sources. (a) the national
exchequer through the national budget or devolved funding under the various fiscal programs
of the state. (b) from donors as financial assistance-aid or grants and (c) from Multilateral and
bilateral lenders such as the World bank, African Development Bank, French Agency for
Development under guarantee programme of the national exchequer. Funding to the FSTP also
even when specific is directed through the utility company. The utility company does earn
revenues from water services and sanitation services from those households it supplies water
and those connected to its sewerage infrastructure.
Local authorities earn from FS through business licensing fees. The same applies to the
environmental authorities. However, the local authorities do not require a FS specific business
license. On the other hand, the environmental services have a specific fee for FS equipment in
particular applicable to the FS extraction trucks. This fee is on a truck basis, is not transferable
and works as a certification of fitness for use for the truck. Each and every truck providing FS
extraction is classified broadly as a sanitation truck and is required to meet design and fitting
requirements.
2.4 Market Size Calculation Method
Market size calculation is based on Household Survey results and population data provided
from reliable sources. The population data is obtained from the national population census
report conducted by the national institution responsible for the same task.
The population data provides for the census estimates for the city. The Household Survey offers
the variables necessary for inference which include distribution of sanitation services- pit
latrines, septic tanks, sewer connections- the frequencies of emptying for onsite sanitation and
others. The variables estimated through the survey are used as inputs to estimate the
parameters under study. It is the combination of both Household survey variable estimates and
population census that forms the input to the computation of the market size.
For purposes of computation of market size, the following is used.

The Bill & Melinda Gates Foundation CHAPTER 2 : METHODOLOGY OF THE FSM STUDY Landscape Analysis and Business Model Assessment in Fecal Sludge Management: Extraction and Transportation Models in
Africa - Kenya
Losai Management Limited 2-24
P1 Market Size = Total VOLUME of sludge TO BE emptied / year in m3
(A x PV) + ( B x SV) +(C x CV) m3
This is the FS produced in the city based on ACTUAL survey data
P2 Theoretical Market Size =
Total VOLUME of sludge TO BE emptied / year in m3
(PITS x Number of users x (0.3 to 0.6) + (ST x number of users x (0.7 to 1.0)
m3 This is the THEORETICAL FS produced in the city
Where A, B and C in P1 (market size are defined as outputs of estimation) A= TOTAL Pits TO BE emptied per year B= TOTAL Septic tanks To BE emptied/ year C= TOTAL cesspools To BE emptied/ year PV =Average Volume of Pit
SV= Average Volume of Septic Tank CV= Average Volume of Cess Pool Where in P2 (theoretical market size) PITS= assumed to be equal to the number of HH with PITS ST = assumed to be equal to the number of HH with septic tanks Number of users is assumed to be the household size The ratios on P2 are based on assumptions that dry pits get 0.3 liters per day per person and multi chamber septic tanks get up to 1.0 liter per day per person.
2.4.1 FS Production and Collection Computation
The computation for FS market size is identical to the estimate for FS produced within a city.
Therefore FS production is identical to the estimate to be derived from the formula set out in
the calculation of FS Market size.
The FS collection computation is based on the distribution of usage of Mechanical emptiers and
Manual emptiers as derived from the household survey and inferred from the population data
obtained from the national census. The inference uses the following computational
formulations (Table 2-3).
Table 2-3 : Methodology of FS Collection Computation
FS Collection Calculations Source
Number of households in the city National Census Data
% of the city HH with On-site sanitation National Census Data
Number of the city HH with On-site sanitation National Census Data
% of the HH with on-site sanitation having pits in the city HH survey % of the HH with on-site sanitation having septic tanks in the city HH Survey
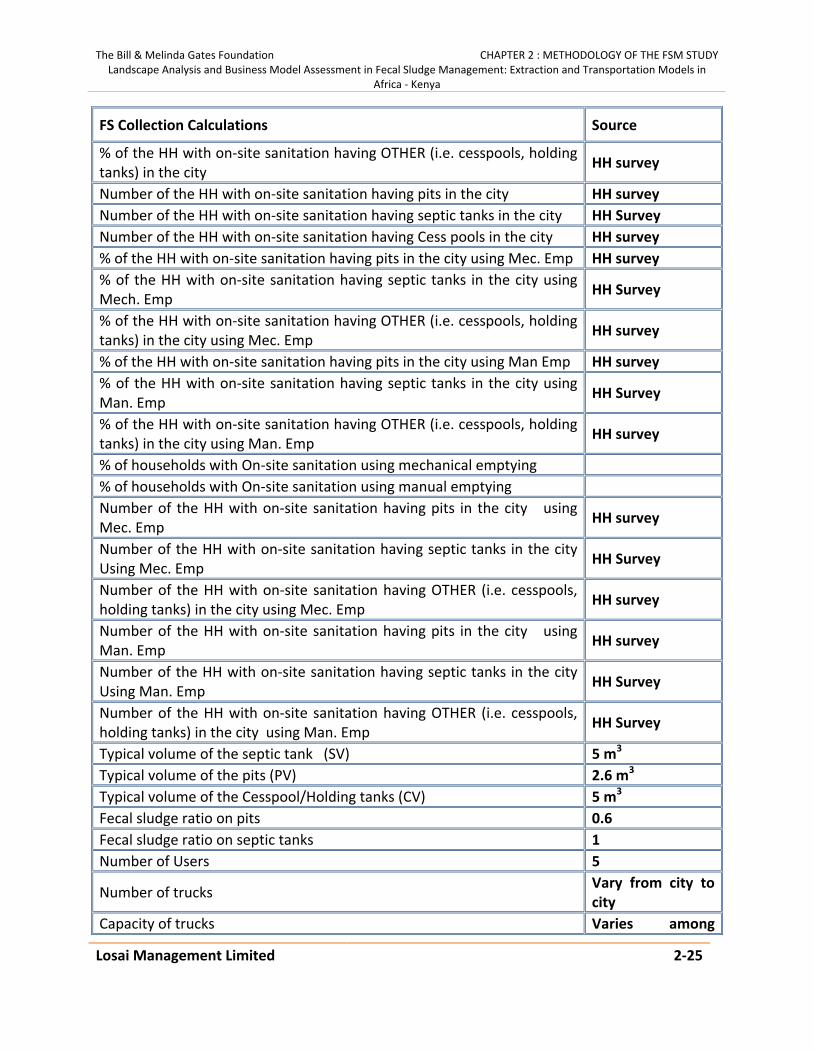
The Bill & Melinda Gates Foundation CHAPTER 2 : METHODOLOGY OF THE FSM STUDY Landscape Analysis and Business Model Assessment in Fecal Sludge Management: Extraction and Transportation Models in
Africa - Kenya
Losai Management Limited 2-25
FS Collection Calculations Source
% of the HH with on-site sanitation having OTHER (i.e. cesspools, holding tanks) in the city HH survey
Number of the HH with on-site sanitation having pits in the city HH survey Number of the HH with on-site sanitation having septic tanks in the city HH Survey Number of the HH with on-site sanitation having Cess pools in the city HH survey % of the HH with on-site sanitation having pits in the city using Mec. Emp HH survey % of the HH with on-site sanitation having septic tanks in the city using Mech. Emp HH Survey
% of the HH with on-site sanitation having OTHER (i.e. cesspools, holding tanks) in the city using Mec. Emp HH survey
% of the HH with on-site sanitation having pits in the city using Man Emp HH survey % of the HH with on-site sanitation having septic tanks in the city using Man. Emp HH Survey
% of the HH with on-site sanitation having OTHER (i.e. cesspools, holding tanks) in the city using Man. Emp HH survey
% of households with On-site sanitation using mechanical emptying % of households with On-site sanitation using manual emptying Number of the HH with on-site sanitation having pits in the city using Mec. Emp HH survey
Number of the HH with on-site sanitation having septic tanks in the city Using Mec. Emp HH Survey
Number of the HH with on-site sanitation having OTHER (i.e. cesspools, holding tanks) in the city using Mec. Emp HH survey
Number of the HH with on-site sanitation having pits in the city using Man. Emp HH survey
Number of the HH with on-site sanitation having septic tanks in the city Using Man. Emp HH Survey
Number of the HH with on-site sanitation having OTHER (i.e. cesspools, holding tanks) in the city using Man. Emp HH Survey
Typical volume of the septic tank (SV) 5 m3 Typical volume of the pits (PV) 2.6 m3 Typical volume of the Cesspool/Holding tanks (CV) 5 m3 Fecal sludge ratio on pits 0.6 Fecal sludge ratio on septic tanks 1 Number of Users 5
Number of trucks Vary from city to city
Capacity of trucks Varies among

The Bill & Melinda Gates Foundation CHAPTER 2 : METHODOLOGY OF THE FSM STUDY Landscape Analysis and Business Model Assessment in Fecal Sludge Management: Extraction and Transportation Models in
Africa - Kenya
Losai Management Limited 2-26
FS Collection Calculations Source
operators Number of trips per truck per year ( Assume 4 trips for every 3 days in 6 days of week for 52 weeks) From the Survey
The Household survey data against the national population data in the methodology is then
used to infer the actual estimates of sanitation facilities available at Households.
Data on Mechanical and Manual emptying frequencies, type of facility and volume emptied per year is obtained from the HH survey. The HH Survey data is used to populate the table below.
Emptying Frequency (Survey Data)
% of pits =100%
# pits to be Emptied/yr
% of septic tanks =100%
# Septic tanks to be Emptied/yr
% of Cesspools =100%
# cesspools to be Emptied/yr
2 times/yr % %
% Once/yr % %
%
Once/2 yrs %
%
% Once/3yrs %
%
%
2-4 yrs %
%
% Once/4 yrs %
%
%
Over 10 yrs %
%
% Other(once
every 3 months) %
%
%
100 %
100 %
100 %
Fecal Sludge Collection Computation
Market Size Computation
This formulation aggregates the volume sludge obtained from the various sanitation facilities namely pit latrines, septic tanks and cess pools.
Market Size = Total VOLUME of sludge TO BE emptied / year
( A x PV) + ( B x SV) +(C x CV)
Mechanical Fecal Sludge Collection Formula
This formula computes the volume of FS ferried by trucks.
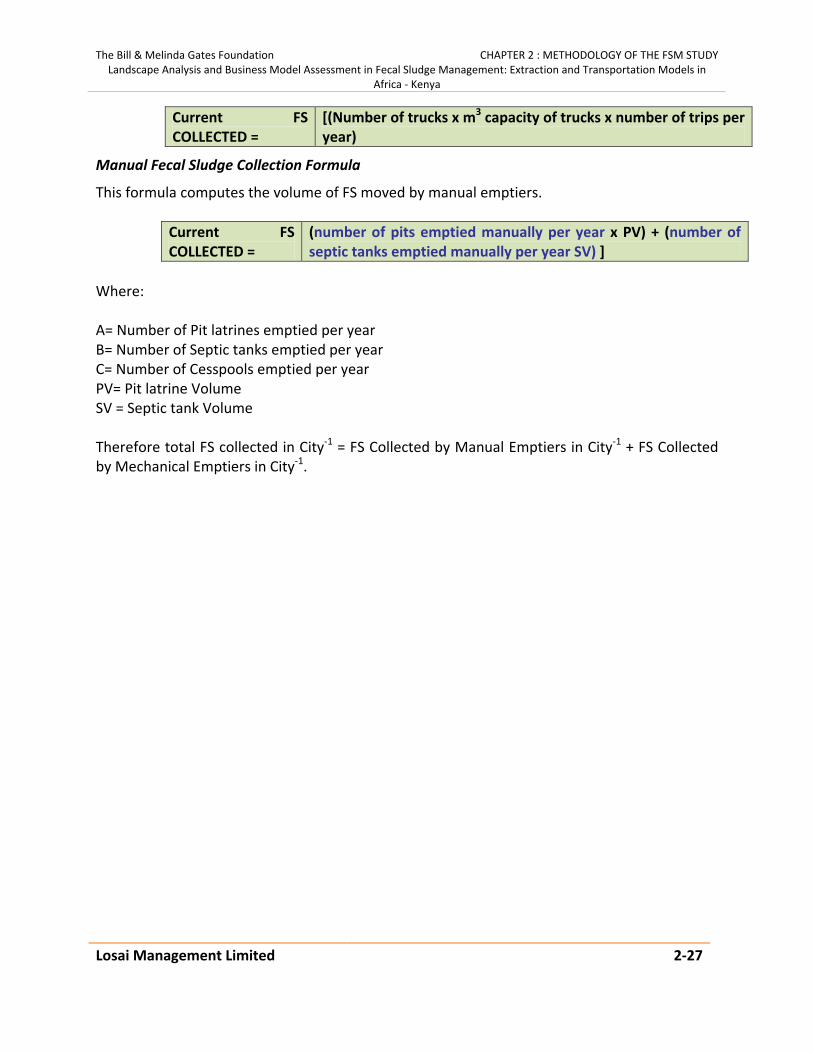
The Bill & Melinda Gates Foundation CHAPTER 2 : METHODOLOGY OF THE FSM STUDY Landscape Analysis and Business Model Assessment in Fecal Sludge Management: Extraction and Transportation Models in
Africa - Kenya
Losai Management Limited 2-27
Current FS COLLECTED =
[(Number of trucks x m3 capacity of trucks x number of trips per year)
Manual Fecal Sludge Collection Formula
This formula computes the volume of FS moved by manual emptiers.
Current FS COLLECTED =
(number of pits emptied manually per year x PV) + (number of septic tanks emptied manually per year SV) ]
Where: A= Number of Pit latrines emptied per year B= Number of Septic tanks emptied per year C= Number of Cesspools emptied per year PV= Pit latrine Volume SV = Septic tank Volume Therefore total FS collected in City-1 = FS Collected by Manual Emptiers in City-1 + FS Collected by Mechanical Emptiers in City-1.
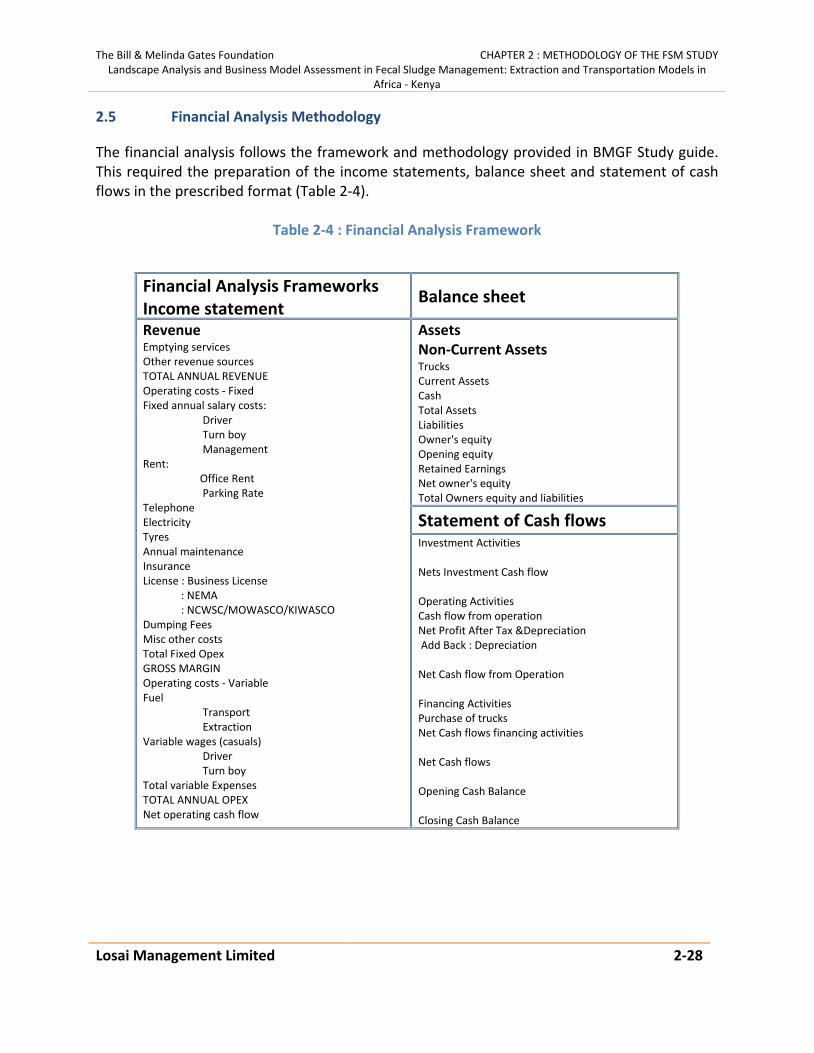
The Bill & Melinda Gates Foundation CHAPTER 2 : METHODOLOGY OF THE FSM STUDY Landscape Analysis and Business Model Assessment in Fecal Sludge Management: Extraction and Transportation Models in
Africa - Kenya
Losai Management Limited 2-28
2.5 Financial Analysis Methodology
The financial analysis follows the framework and methodology provided in BMGF Study guide. This required the preparation of the income statements, balance sheet and statement of cash flows in the prescribed format (Table 2-4).
Table 2-4 : Financial Analysis Framework
Financial Analysis Frameworks Income statement
Balance sheet
Revenue Emptying services Other revenue sources TOTAL ANNUAL REVENUE Operating costs - Fixed Fixed annual salary costs: Driver Turn boy Management Rent: Office Rent Parking Rate Telephone Electricity Tyres Annual maintenance Insurance License : Business License : NEMA : NCWSC/MOWASCO/KIWASCO Dumping Fees Misc other costs Total Fixed Opex GROSS MARGIN Operating costs - Variable Fuel Transport Extraction Variable wages (casuals) Driver Turn boy Total variable Expenses TOTAL ANNUAL OPEX Net operating cash flow
Assets Non-Current Assets Trucks Current Assets Cash Total Assets Liabilities Owner's equity Opening equity Retained Earnings Net owner's equity Total Owners equity and liabilities
Statement of Cash flows Investment Activities Nets Investment Cash flow Operating Activities Cash flow from operation Net Profit After Tax &Depreciation Add Back : Depreciation Net Cash flow from Operation Financing Activities Purchase of trucks Net Cash flows financing activities Net Cash flows Opening Cash Balance Closing Cash Balance

The Bill & Melinda Gates Foundation CHAPTER 3 : RESULTS AND ANALYSIS OF URBAN FSM PRACTICE Landscape Analysis and Business Model Assessment in Fecal Sludge Management: Extraction and Transportation Models in
Africa - Kenya
LOSAI MANAGEMENT LIMITED 3-1
CHAPTER 3. RESULTS AND ANALYSIS OF URBAN FSM PRACTICE
A 3.1 Situational Analysis of Extraction/Transportation (Kisumu)
A 3.1.1 Demographics of Kisumu City
According to the 2009 National Census, the population of Kisumu is spread in 32 Sub-Locations
and the population by locality is shown in Table 3-1.
Table 3-1 : Population of Kisumu by Locality
For the purposes of the Household Survey, 18 of the 32 sub-locations (56%) were selected for
the FSM study – with a combined total population of 82,961 households – i.e. over 80% of the
total City households.
With regard to the socio-economic categorization of the sampled sub-locations, 2 were
classified as falling under the high income category; 7 in medium income; and 9 in low income
category. The sample sizes (Table 3-2) were proportionately calculated from the number of
households in each income category.
Table 3-2 : Sample Size per Sub-Location (Kisumu)
Name of Sub-Location Income category No. of households Sample size
1. Town – Southern High 2,476 12
2. Town – Northern High 2,107 10
3. Kaloleni Medium 3,658 18
4. Migosi Medium 4,795 23
5. Nyalenda ‘B’ Medium 8,561 41
6. Manyatta ‘B’ Medium 7,808 38
Locality Population Percent
Core Urban 259,258 63.2
Peri Urban 129,053 31.4
Rural Area 21,617 5.3
Total 409,928 100.0
Total No. of Households 102,508

The Bill & Melinda Gates Foundation CHAPTER 3 : RESULTS AND ANALYSIS OF URBAN FSM PRACTICE Landscape Analysis and Business Model Assessment in Fecal Sludge Management: Extraction and Transportation Models in
Africa - Kenya
LOSAI MANAGEMENT LIMITED 3-2
Name of Sub-Location Income category No. of households Sample size
7. Kogony Medium 5,164 25
8. Bandari Low 1,921 9
9. Manyatta ‘A’ Low 12,525 60
10. Nyawita Low 4,099 20
11. Kasule Low 4,880 24
12. Nyalunya Low 2,731 13
13. Nyalenda ‘A’ Low 8,070 39
14. Korando Low 3,773 18
15. Kanyakwar Low 3,553 17
PERI-URBAN AREAS
16. Wathorego Low 2,849 14
17. Chiga Medium 2,168 10
18. Ojolla Medium 1,823 9
Total 82,961 400
Table 3-3 below shows the demographics of the sample investigated in the 18 sub-locations
Table 3-3 : Demographics of the Sample Surveyed in Kisumu
No. Demographic Characteristics % Observations
1. Sex of the Respondent Female Male
52.0 48.0
Majority of the respondents were female
2. Household Headship Head Yes Not Head
65.0 35.0
Nearly two-thirds of the respondents were heads of households
3.
Educational Level Secondary Primary Tertiary (College, University) Non Formal/Adult None
38.0 32.0 28.0 1.0 1.0
The Kisumu adult population is relatively highly literate – with over two-thirds (68%) having attained secondary level education and above. Only less than 1% was non-literate
4. Status of Household Head Tenant
62.8
Most of the household heads were tenants – with owners constituting only

The Bill & Melinda Gates Foundation CHAPTER 3 : RESULTS AND ANALYSIS OF URBAN FSM PRACTICE Landscape Analysis and Business Model Assessment in Fecal Sludge Management: Extraction and Transportation Models in
Africa - Kenya
LOSAI MANAGEMENT LIMITED 3-3
No. Demographic Characteristics % Observations Owner Other
36.7 5
about over 37% of the sample
5. Average No. of Persons Living in Household 6
6.
Main Occupation of Household Head Salaried Self-Employed Trader Artisan Farmer Other None
38.0 34.0 16.0 3.0 3.0 3.0 1.0
Majority of the household heads were in self-employment occupations – 66%, whilst those in salaried occupations accounted for nearly 40% of the total surveyed
A 3.1.2 Drinking Water Supply Coverage for Kisumu City
The survey sought to find out the proportion of the sampled Kisumu households which have
access to safe water supplies (“potable water”). To assess the coverage, the answers to the
question of: source of water supply was posed. The pattern of response was as indicated in the
Table 3-4.
Table 3-4 : Main Source of Water Supply – Kisumu City
Main Source % of Households
1. Individual Connection – KIWASCO 21.0
2. Individual Connection – Private 6.0
3. Water Kiosk 26.0
4. Water Vendors 11.0
5. Borehole 18.0
6. Well 7.0
7. Surface Water 9.0
8. Others 2.0
Over 53% of Kisumu households derive their water supplies from piped systems: with a
significant 21% obtaining it from the city utility: Kisumu Water and Sewerage Company
(KIWASCO). Private sources supply some 6% of the households. Water Kiosks (or piped system
to public taps), account for a significant 26% of the City households, whilst the level of access

The Bill & Melinda Gates Foundation CHAPTER 3 : RESULTS AND ANALYSIS OF URBAN FSM PRACTICE Landscape Analysis and Business Model Assessment in Fecal Sludge Management: Extraction and Transportation Models in
Africa - Kenya
LOSAI MANAGEMENT LIMITED 3-4
from boreholes and wells is 25%. Eleven percent of households obtain their drinking from
unsafe surface water sources.
Compared to the national urban figures (Table 1-1), Kisumu has a higher coverage from piped
sources and also from boreholes and wells. From this study however, Kisumu emerges with a
higher percentage of households using unsafe surface water sources (11.0%) than the national
average of 9.2%.
Data obtained from KIWASCO during field discussions with officials from the Commercial
Department, indicate that, through a recent water supply improvement program – with funding
from AFD (French Development Agency), KIWASCO increased its water supply capacity from
about 17 m3 per day, to today’s 44 m3 per day. However, with only 27% of the current potential
capacity of the water supply system being utilized, it means that, the supply side in Kisumu now
surprisingly, far exceeds the current demand.
A 3.1.3 Sanitation Coverage for Kisumu City
In order to find out the level of sanitation coverage in the City, 3 specific questions were posed
to the respondents:
a. Access to a sanitation facility within the household premises,
b. Where respondents without access to sanitation facility at home, go to answer a call
of nature; and
c. The kind of sanitation facility installed.
In terms of “safe or hygienic management of human waste” in non-sewered urban areas of the
City, Kisumu scores fairly well - compared to the national urban patterns. For instance, whereas
only about 6% nationally use the VIP Latrine, this is about 20% in Kisumu. For the septic tank
and cess pool, Kisumu’s coverage is 19.0% whilst nationally, this is only 8.7%.
With the now much improved availability of water supply, Kisumu’s sewer connection coverage
is bound to rise significantly in the near future. Discussions with the officials of the Commercial
Department at KIWASCO indicated that, of the 11,921 water consumers, only 4,530 or 38% are
on sewer. Table 3-5 shows the level of access to and coverage of sanitation systems in Kisumu
City.

The Bill & Melinda Gates Foundation CHAPTER 3 : RESULTS AND ANALYSIS OF URBAN FSM PRACTICE Landscape Analysis and Business Model Assessment in Fecal Sludge Management: Extraction and Transportation Models in
Africa - Kenya
LOSAI MANAGEMENT LIMITED 3-5
Table 3-5 : Sanitation Coverage in Kisumu
No. Coverage Indicator % Observations
1. Access to a Sanitation Facility within Household Premises
Yes 88.0 An encouraging 88% of the households have access to a sanitation facility of one type or another, within their compound No 12.0
2. Average No. of Households Sharing Sanitation Facility
This high number households sharing a facility – mainly on-site, means that it fills up fast – hence requiring frequent (unaffordable) emptying
3. Place of Excreta Disposal (For the Disadvantaged 14% of Households)
Neighbor 51.0 A worrying 19% of these without access to a sanitation facility dispose human waste in open spaces and drainage channels. Another 21% are assumed to use other unsafe methods. This certainly contributes greatly to environmental pollution – thus posing danger to human health in the respective areas of the City
Public Toilet 9.0
Open Space 15.0
Drainage Channel
4.0
Other 21.0
4. Type of Sanitation Facility Installed (For the 86% who Have Access)
Ordinary Pit Latrine
51.0 The ordinary pit latrine predominates but majority are really of questionable standards of construction. Nevertheless, an encouraging 43% use facilities that may be categorized as constituting safe or hygienic management of human waste
VIP Latrine 20.0
Septic Tank 17.0
Cess Pool 2.0
Sewerage Connection
4.0
KIWASCO previously had an exhauster truck to serve the un-sewered areas of the City. It is
however no longer functional (since 2009) – leaving the void to be filled by private mechanical
and manual operators.
The only currently functional FS treatment plant in Kisumu – Kisat, is currently undergoing
complete rehabilitation and modernization – with funding from AFD. The French financier is
equally supporting the revival of the City’s second long collapsed treatment plant – at
Nyalenda. (Nyalenda Treatment Plant which is a stabilization pond type).

The Bill & Melinda Gates Foundation CHAPTER 3 : RESULTS AND ANALYSIS OF URBAN FSM PRACTICE Landscape Analysis and Business Model Assessment in Fecal Sludge Management: Extraction and Transportation Models in
Africa - Kenya
LOSAI MANAGEMENT LIMITED 3-6
A 3.1.4 Institutional and Legal Framework for FSM at the City Level (Kisumu)
Interrelationship in the FSM System
There are 5 main actors in the FSM system at the city level. These are: the National
Environmental Management Authority (NEMA); the City/Municipal Council; the Water and
Sewerage Service Provider (WSP) for the city; the various companies and informal Emptying
Operators; and to certain extent, NGOs (Figure 3-1). These collectively may be referred to as
the City FSM Service Providers (CFSPS). The roles of the main actors in fecal sludge service
delivery are summarized below.
a. The National Environmental Management Authority (NEMA)
NEMA is the supreme authority in the country for enforcing the law for the protection and
conservation of the environment – under the Environmental Management and Coordination
Act (EMCA) 1999. EMCA also provides for the gazettement of regulations to control operations
regarding various environmental protection concerns.
For instance, for fecal sludge management, the relevant Environmental Protection Order is the
Environment and Coordination (Waste Management) Regulations 2006. These regulations are
meant to streamline the handling, transportation and disposal of various types of waste. This is
intended to protect human health and the environment.
Under these Regulations also, NEMA licenses operators who use waste transport vehicles, e.g.
for fecal sludge management, “to prevent occurrence of odor or health hazard and to ensure
that transported waste is disposed off at sites designated by the Authority.”

The Bill & Melinda Gates Foundation CHAPTER 3 : RESULTS AND ANALYSIS OF URBAN FSM PRACTICE Landscape Analysis and Business Model Assessment in Fecal Sludge Management: Extraction and Transportation Models in
Africa - Kenya
LOSAI MANAGEMENT LIMITED 3-7
Figure 3-1 : The Institutional Framework for FSM at the City Level (Kisumu)
FSM SERVICE DELIVERY Industrial Customers Commercial Institutional Domestic Public Toilets
KISUMU MUNICIPAL COUNCIL
Business Permits Public Health Law
KISUMU WATER & SEWERAGE COMPANY
FSM Operator FS Disposal Sites
NGOs Domestic Sanitation Public
NEMA Licensing FS Operators
EMPTYING OPERATORS Private Companies Informal Operators

The Bill & Melinda Gates Foundation CHAPTER 3 : RESULTS AND ANALYSIS OF URBAN FSM PRACTICE Landscape Analysis and Business Model Assessment in Fecal Sludge Management: Extraction and Transportation Models in
Africa - Kenya
LOSAI MANAGEMENT LIMITED 3-8
The Municipal Council of Kisumu
These local government authorities (LGAs) are mandated by the Public Health Act, Cap 242, “to
take all lawful necessary and reasonably practicable measures, to maintain in their jurisdiction,
clean and sanitary condition and, to prevent occurrence of conditions liable to be injurious or
dangerous to human health.”
The city/municipal councils may also undertake the construction and operation of public toilets
– either by themselves, or by appropriate concessioning to private sector actors – under the
Public Private Partnership (PPP) arrangement.
Two line departments of the Municipal Council of Kisumu (MCK) have a close relationship with
the FSM issue, viz, the Department of the Environment and the Public Health Department. We
held discussions with Deputy Director of Environment, and the Chief Public Health Officer.
Whereas the Department of the Environment is involved in the development of physical
infrastructure and the protection and conservation of the environment, the Public Health
Department enforces the relevant laws and regulations.
In the sanitation sector for example, the Department of the Environment undertook the
construction of 6 public toilets in the various parts of the city – which were later handed over to
self-help groups to operate. On its part the Public Health Department ensures that they are well
maintained to the required hygienic condition.
Another department of MCK – the Revenue Department, is involved in issuing business permits
to exhauster operators – to allow them to operate as legal business enterprises within the city.
The amount payable in this regard is Kshs 21,800 (US$ 232) p.a, per truck operated.
Role of Kisumu Municipal Council
The roles of the municipal council as indicated by the respondents were as shown in Table 3-6.
Table 3-6 : Roles of Kisumu Municipal Council
Advocacy for access to sanitation facilities for all Ensure proper drainage is kept
Arrest those who go against good waste management and disposal Establish and maintain sanitation facilities
Bring mechanical emptying services Extend the sewer lines
Channel the sewer lines in the right places Facilitates management of sludge

The Bill & Melinda Gates Foundation CHAPTER 3 : RESULTS AND ANALYSIS OF URBAN FSM PRACTICE Landscape Analysis and Business Model Assessment in Fecal Sludge Management: Extraction and Transportation Models in
Africa - Kenya
LOSAI MANAGEMENT LIMITED 3-9
Collect and dispose garbage Making and implementing by laws
Control pollution by companies and factories Provide clean water and good sewer system
Create awareness on hygiene practices Provide disinfectant to spray in the latrines
Employ more garbage collectors Repair and maintain sewer systems
Enforce the legal requirement and introduce litter bins to slums Specify dumping areas for garbage
Ensure each household has a sanitation facility Take action on unethical fecal sludge management
b. The Kisumu Water and Sewerage Company (KIWASCO)
Established under the provisions of the Water Act 2002, KIWASCO is a public utility owned by
the Local Government Authority – Municipal Council of Kisumu, but managed under
arrangement by the Ministry of Water. Under the Act, KIWASCO as a Water and Sewerage
Services Service Provider (WSSP) is charged with the responsibility of providing water and
sewerage services to the residents of Kisumu City. The utility’s sewerage treatment plants
provide disposal sites for sludge from the private operators.
Water Supply
Through a recent water supply improvement program – with funding from AFD (French
Development Agency), KIWASCO increased its water supply capacity from about 17,000 m3 per
day, to today’s 44,000 m3 per day. However, data available at the Commercial Department (–
Dep. Commercial Manager), indicate that so far, only a total of 11,921 consumers have been
connected. This translates to only 27% of the potential water supply capacity in the city is
currently being utilized – meaning supply far exceeds the current demand!
Sewerage Services
Of the total 11,921 water consumers connected to KIWASCO, only 4,530 are on sewer i.e. 38%.
This indicates that most of the customers use other methods of fecal sludge disposal from their
premises – most certainly, mechanical or manual emptying services.
KIWASCO previously had an exhauster truck to serve the un-sewered areas of the City. It is
however no longer functional (since 2009) – leaving the void to be filled by private operators.

The Bill & Melinda Gates Foundation CHAPTER 3 : RESULTS AND ANALYSIS OF URBAN FSM PRACTICE Landscape Analysis and Business Model Assessment in Fecal Sludge Management: Extraction and Transportation Models in
Africa - Kenya
LOSAI MANAGEMENT LIMITED 3-10
KIWASCO operates a sewerage treatment plant at Kisat – which uses the conventional
treatment methods. Currently only 3 sections of the installed capacity of 6 are functional.
However, through the AFD funding, the facility is currently undergoing complete rehabilitation
and modernization.
Another KIWASCO sewerage facility is at Nyalenda – which has long since been non-
operational. It is currently however being used as the designated disposal site for exhauster
trucks operating in the City. Plans are underway with financing obtained from AFD to revive the
Nyalenda facility.
With the modernization of the Kisat treatment plant and the revival of the Nyalenda facility, in
addition to the availability of sufficient water supplies, Kisumu is poised to increase the
sewerage coverage tremendously. Nonetheless, the demand for exhauster services will still
continue to exist – until this level is reached – estimated to be in the long term.
Role of the Water and Sanitation Utility
The role of the Water and Sanitation Utilities as indicated by the respondents are as shown in
Table 3-7.
Table 3-7 : Role of the Water and Sanitation Utility – Kisumu
Educate on importance of better sanitation Extending sewer lines
Engage in sludge recycling logistics Fund sanitation projects
Ensure by laws are observed Manage water and sewer lines
Ensure proper drainage and sanitation Offer exhauster services
Ensure proper sewerage systems are put up Regular supply of clean safe water
Establish more sanitation facilities Repair burst sewer pipes
c. The Fecal Sludge Emptying Operators
The WSSPs are supposed to provide all residents of their cities with efficient and effective water
borne sewerage services. However, currently, Kisumu can provide only 10%.
Hence, there is a huge gap in the provision and demand for water borne sewerage services.
Consequently, private sector players – both formal and informal, have stepped in to fill the

The Bill & Melinda Gates Foundation CHAPTER 3 : RESULTS AND ANALYSIS OF URBAN FSM PRACTICE Landscape Analysis and Business Model Assessment in Fecal Sludge Management: Extraction and Transportation Models in
Africa - Kenya
LOSAI MANAGEMENT LIMITED 3-11
wide gap – particularly for providing emptying services in the un-sewered parts of the
respective cities.

The Bill & Melinda Gates Foundation CHAPTER 3 : RESULTS AND ANALYSIS OF URBAN FSM PRACTICE Landscape Analysis and Business Model Assessment in Fecal Sludge Management: Extraction and Transportation Models in
Africa - Kenya
LOSAI MANAGEMENT LIMITED 3-12
Licensed Exhauster Service Providers
There are only 4 licensed exhauster trucks in operation in Kisumu – owned by 3 operators.
KIWASCO is not currently involved in this line of sanitation service provision.
The 3 Kisumu exhauster service providers are small businesses with the “largest” owning only 2
old trucks. This service level is really not adequate for the City. And given the low sewerage
coverage, potential for investment in the sector is great: demand for the service far outstrips
the current supply.
Informal Fecal Sludge Emptiers
Informal fecal sludge emptiers carry out their trade illegally, i.e. they are not licensed to do so;
have not been granted business permits; and do not comply with the provisions of the Public
Health Act. Consequently, they conduct their operations mainly in slum areas, at night – to
avoid being arrested by NEMA and KMC law enforcers. Their tools of trade are rather crude and
extraction and disposal methods characteristically unhygienic.
For this reason, it is pretty difficult to penetrate their world of clandestine operation: they
suspect anybody trying to obtain information from them as being agents of NEMA or the
Council! Through an acceptable contact however, we were able to interview one leading
manual operator in the City and valuable insights were made on the various aspects of their
operations.
One undeniable fact stands out from the discussions with these informal operators: that they
are an indispensable component of the FSM system in Kisumu, particularly in the slums and
other low income areas. The authorities can continue to disregard them as non-existent and
illegal. But to the residents of low income areas of the City, they are essential “service
providers.” So, how could this “essential service” be regularized and mainstreamed into the
FSM service delivery framework? The Study Team proposes organized community groups as
entry points.
d. Non-Governmental Organizations (NGOs) in the Sanitation Sector
The roles of the NGOs operating in the city as indicated by the respondents were as captured in
Table 3-8.

The Bill & Melinda Gates Foundation CHAPTER 3 : RESULTS AND ANALYSIS OF URBAN FSM PRACTICE Landscape Analysis and Business Model Assessment in Fecal Sludge Management: Extraction and Transportation Models in
Africa - Kenya
LOSAI MANAGEMENT LIMITED 3-13
Table 3-8 : Role of NGOs
Assist in recycling of sludge Fund and monitor development projects
Assist the needy Harmonize resource for sanitation improvement
Build toilets Help in eradication of poverty through educating people
Champion campaigns on environmental conservation Offer support to projects and groups on FSM
Develop sanitation facilities in slums Partner with water providers
Educate people on proper waste management and disposal Provide employment opportunities to people
Education on cleanliness of the environment Provide health services to slum dweller
Engage in community development Provide mobile toilets
Ensure good sanitation in slums and reduce disease outbreak Support CBOs and projects towards FSM
Extend health services to slums Support orphans and widows and vulnerable children
Finance mechanical emptying service
A list of identified NGOs operating in the city is as captured in Table 3-9.
Table 3-9 : List of NGOs operating in Kisumu City
1 APEX ACHIEVERS 14 NIPPON 2 CARE KENYA 15 OGRA FOUNDATION 3 CCF 16 OHPS 4 CDC, 17 PLAN INTERNATIONAL 5 CDS 18 SANA INTERNATIONAL 6 COLEP 19 STIPA(ECOSAN TOILET) 7 CONCERN WORLDWIDE 20 TEMAK 8 EAD 21 UMANDE-KENYA 9 GDI 22 UNDUGU SOCIETY 10 HAPPY VILLAGES 23 WAENET 11 IPA 24 WESTERN CHILDHOOD LABOUR 12 KMET 25 WORLD CARE 13 KWAP 26 WORLD VISION

The Bill & Melinda Gates Foundation CHAPTER 3 : RESULTS AND ANALYSIS OF URBAN FSM PRACTICE Landscape Analysis and Business Model Assessment in Fecal Sludge Management: Extraction and Transportation Models in
Africa - Kenya
LOSAI MANAGEMENT LIMITED 3-14
Of this number two are noticeably the most prominent in the Kisumu City sanitation scene.
These are Sustainable Aid in Africa International (SANA) and Umande Trust. The two NGOs are
supporting sanitation projects in the slums of Kisumu – the latter bio-toilets in the Nyalenda
slums.
Umande Trust
Umande is a rights-based agency supporting community-based initiatives in Kenya. It currently
has operations in Nairobi (where its head office is located), Kisumu and Embu town. It is main
focus area of operation is water and sanitation: financing investment and eco-friendly
technologies.
In Kisumu, it has operations in 4 slums of Bandani, Obunga, Manyatta and Nyalenda – where it
has financed community members’ sanitation facilities through its Sanitation Development
Fund (SANDEF). Umande’s flagship initiative however is the Bio-Sanitation Center of which
there are currently 4 in operation: one in each settlement and 2 under construction.
A Bio-sanitation center is a facility installed by the Trust using anaerobic digestion technology,
which transforms human waste into bio-gas and liquid fertilizer. At the bio-center community
managed toilets and showers are provided at a fee; and a community resource and meeting
center established.
Sustainable Aid in Africa International
SANA is a specialist water and sanitation sector NGO, implementing projects in Nyanza – in both
urban and rural areas of the province. Through its commercial arm – SANA Holdings Ltd, the
NGO is currently offering credit to 7 water and sanitation associations in Nyanza, enabling
some 35,000 people to access safe water supplies and sanitation.
The Study Team found the SANA Credit for Water and Sanitation model quite an interesting
initiative – which could fittingly be replicated in the FSM system. Here below is highlighted the
main features of the SANA Model.
1. Previous sanitation initiatives – mainly through donor grants, have failed to improve
access to sanitation by the majority of the population, mainly because of high jacking by
the rich and unsustainability of installed facilities.
2. Sanitation has in the past been accorded a rather low priority – vis-à-vis water –
resulting in sanitation being denied access to adequate investment finance.

The Bill & Melinda Gates Foundation CHAPTER 3 : RESULTS AND ANALYSIS OF URBAN FSM PRACTICE Landscape Analysis and Business Model Assessment in Fecal Sludge Management: Extraction and Transportation Models in
Africa - Kenya
LOSAI MANAGEMENT LIMITED 3-15
3. Hence, the main objective of sanitation loans is to enable for the establishment of a
revolving loan fund pool – exclusively dedicated to sanitation development: at the
household level and public places – in low income areas.
4. The target beneficiaries are women groups and self-help groups (50% must be women)
– with a membership of 10-30 people. Whilst the group acts as the main security for the
loans disbursed, individual members are expected to save monthly into the collective
pool and service disbursed loans.
5. After servicing sanitation loans, members can venture into other related income
generating activities, e.g. solid waste management (and hence possibility exists here for
FSM?)
A 3.1.5 Flow of Money Chart for FSM Transactions
The service channels in FSM showed different financial transaction opportunities. The more
immediate being clients (Institutional/individuals) paying for FS management services to
emptiers (Figure 3-2). However, underlying this is the indirect payment to the FSTP/WWTP
through licensing by the utility company which manages the FSTP/WWTP. More directly the
FSTP/WWTP receives payments for the sale of treated FS to end users.

The Bill & Melinda Gates Foundation CHAPTER 3 : RESULTS AND ANALYSIS OF URBAN FSM PRACTICE Landscape Analysis and Business Model Assessment in Fecal Sludge Management: Extraction and Transportation Models in
Africa - Kenya
LOSAI MANAGEMENT LIMITED 3-16
Fecal Sludge management value chain
Therefore an expanded value chain of FS management value shows multiple flow of funds
among stakeholders as was noted in Kisumu. Improvements to this value chain are likely to
increase the demand for the services particularly by sealing leakages through unauthorized
burying of FS which occurs during manual empting. In addition the Kisumu FSTP may be willing
to pay to receive the FS for onward processing to sell the final product to end users in a biogas-
generation process.
In Kisumu the FS evacuation is undertaken by private entities. There is no public body providing
FS evacuation services. The private operators invest in their enterprises to provide these
services. Their key sources of finance are:
1. Personal savings and savings from friends and relatives
2. Pension savings
3. Loans from financial institutions
The Utility Company and the WWTP receive funds from two broad sources. The first source is
sales and service revenues from water sales- as a water utility and sewer connection fees plus
FS management licensing fees. The second source of funds is from the national exchequer as
part of budget allocation, grant and multilateral loan guarantees. There are formulations of
private-public partnerships that are being considered as a way of generating revenues. In
Kisumu the mechanical emptiers pay a dumping fee of USD 434 per truck per annum, and this is
Client
Cheque
Cash
M-Pesa Individual
Households
Institutional
Emptier
Figure 3-2 : Flow of Money Chart for FSM Transactions

The Bill & Melinda Gates Foundation CHAPTER 3 : RESULTS AND ANALYSIS OF URBAN FSM PRACTICE Landscape Analysis and Business Model Assessment in Fecal Sludge Management: Extraction and Transportation Models in
Africa - Kenya
LOSAI MANAGEMENT LIMITED 3-17
charged in advance of tipping by the truck. The fee is payable to the Utility company which
operates the dumping site.
Table 3-10 below summarizes financial transaction data for FSM services in Kisumu. In Kisumu
the average tariff is not comparable as the trucks operating are of different capacities. There is
no dumping fee charged by KIWASCO. Kisumu has two WTP, namely Kisat Treatment Works
with a design capacity of 6,800 m3/day initially completed in 1957 and once rehabilitated in
1987. This WTW produces treated FS through a conventional system with the sludge
conditioned in cold digestion tanks and dried in sludge drying beds before disposal to the land
for sale. The treated sludge re-sale price is fixed by the utility company which operates the
treatment plant. However at present there is no sale of sludge. The second WTP is Nyalenda
Sewerage Treatment Works which comprises of stabilization tanks. This is the WTP designated
as the dumping site for FS emptying by mechanical and manual emptiers.
Table 3-10 : Financial Transaction Data for FSM services
A 3.1.6 FS emptying business owners’ profile (Kisumu)
Following a landscape review of the operators, it was decided to interview a number of the mechanical truck operators operating in Kisumu City. Information from one operator per every operating capacity was used to develop the emptier profile for purposes of comparison between cities (Table 3-11 and Table 3-12).
Table 3-11 : FS Emptying Business Owners Profile - Kisumu
Operator Business Premises Business Type
Age of business owner
Business Plan
1 None Sole proprietorship 65 None
2 None Sole proprietorship 60 None
3 None Sole proprietorship 60 None
Client Category Emptiers Tariffs Dumping fee (KIWASCO) End User Re-sale
Price Individual
Households
Operator I
$ 52 per trip
$ 434 per truck per annum
Households (Farm)
$ 1,120 per tonne Commercial
premises Operator II
Households ( Electricity)

The Bill & Melinda Gates Foundation CHAPTER 3 : RESULTS AND ANALYSIS OF URBAN FSM PRACTICE Landscape Analysis and Business Model Assessment in Fecal Sludge Management: Extraction and Transportation Models in
Africa - Kenya
LOSAI MANAGEMENT LIMITED 3-18
Table 3-12 : Fs Emptying Business Profile
Operator Form of Business
No of Trucks
Started Operation in
Number of Customers per year
Mode of Operation
1 Sole proprietor 2 2004 528
• Within town • No formal offices • Three employees per truck • Permanent Employment
2 Sole proprietor 1 2008 46
• Within town • No formal offices • Two employees per truck • Casual Employment
3 Sole proprietor 1 2011 288
• Within town • No formal offices • Two employees per truck • Casual Employment
B 3.1 Situational Analysis of Extraction/Transportation (Mombasa)
B 3.1.1. Demographics of Mombasa City
According to the 2009 National Census, the population of Mombasa is spread in 32 Sub-
Locations and the population by locality is shown in Table 3-13.
Table 3-13 : Population of Mombasa by Locality
Locality Population Percent
Core Urban 915,101 97.5
Peri Urban 23,030 2.5
Total 938,131 100.0
Total No. of Households 268,700
For the purposes of the Household Survey, 30 of the 34 sub-locations (88%) were selected for
the FSM study – with a combined total of 256,658 households – i.e. over 95.5% of the total City
population.
With regard to the socio-economic categorization of the sampled sub-locations, 5 were
classified as falling under the high income category; 9 in medium income; 10 low income; and

The Bill & Melinda Gates Foundation CHAPTER 3 : RESULTS AND ANALYSIS OF URBAN FSM PRACTICE Landscape Analysis and Business Model Assessment in Fecal Sludge Management: Extraction and Transportation Models in
Africa - Kenya
LOSAI MANAGEMENT LIMITED 3-19
15 informal settlements. The sample sizes (Table 3-14) were proportionately calculated from
the number of households in each income category.
Table 3-14 : Sample Size per Sub-Location – Mombasa
Sub-Location Households No Status Samples
Bamburi 4,831 HI 6
Maunguja 236 MI 8
Mwakirunge 1267 IS 11
Mwembelengeza 8006 MI 8
Shanzu 2458 MI 8
Ganjoni 2583 HI 6
Kizingo 1543 HI 6
Mwembe Tayari 1806 MI 8
Railway 2110 MI 8
Tononoka 3849 LI 24
Tudor 4 3436 HI 6
Tudor Estate 5791 HI 6
Junda 11,845 IS 11
Kisauni 22762 LI 24
Magogoni 23,896 LI 24
Kongowea 19332 LI 24
Maweni 12,742 IS 11
Chaani 19,492 LI 24
Changamwe 2,914 MI 8
Portreitz 19,863 LI 24
Miritini 8,159 MI 8

The Bill & Melinda Gates Foundation CHAPTER 3 : RESULTS AND ANALYSIS OF URBAN FSM PRACTICE Landscape Analysis and Business Model Assessment in Fecal Sludge Management: Extraction and Transportation Models in
Africa - Kenya
LOSAI MANAGEMENT LIMITED 3-20
Sub-Location Households No Status Samples
Jomvu Kuu 10,294 LI 24
Kwashee 10,642 MI 8
Birikani 5,937 LI 24
Mtongwe 7,951 IS 11
Vyemani 3,980 IS 11
Vijiweni 3,243 IS 11
Bofu 9,450 LI 16
Likoni 6,879 MI 8
Timbwani 19,361 LI 24
Total 256,658
400
Table 3-15 shows the demographics of the sample investigated in the 18 sub-locations.
Table 3-15 : Demographics of the Sample Surveyed in Mombasa
No. Demographic Characteristics % Observations 1. Sex of the Respondent
Female Male
46.0 54.0
Majority of the respondents were male
2. Household Headship Head Yes Not Head
65.0 35.0
Nearly two-thirds of the respondents were heads of households
3. Educational Level Secondary Primary Tertiary (College, University) Non Formal/Adult None
35.0 24.0 36.0 3.0 2.0
The Mombasa adult population is relatively highly literate – with over 71% having attained secondary level education and above. Only less than 2% was non-literate
4. Status of Household Head Tenant Owner Other
59.0 38.0 3.0
Most of the household heads were tenants – with owners constituting only 38% of the sample
5. Average No. of Persons Living in Household 5 6. Main Occupation of Household Head
Salaried Self-Employed Trader Artisan
52.0 33.0 4.0 1.0
Majority of the household heads were in salaried occupations – 52%, whilst those in self-employment occupations accounted for nearly 40% of the total surveyed

The Bill & Melinda Gates Foundation CHAPTER 3 : RESULTS AND ANALYSIS OF URBAN FSM PRACTICE Landscape Analysis and Business Model Assessment in Fecal Sludge Management: Extraction and Transportation Models in
Africa - Kenya
LOSAI MANAGEMENT LIMITED 3-21
Farmer Other None
1.0 1.0 8.0
B 3.1.2. Drinking Water Supply Coverage for Mombasa City
The survey sought to find out the proportion of the sampled Mombasa households which have
access to safe water supplies (“potable water”). To assess the coverage, the answers to the
question of: source of water supply was posed. The pattern of response was as indicated in
Table 3-16.
Table 3-16 : Main Source of Water Supply – Mombasa City
No. Main Source % of Households
1. Individual Connection – MOWASCO 29.0
2. Individual Connection – Private 2.0
3. Water Kiosk 28.0
4. Water Vendors 11.0
5. Borehole 21.0
6. Well 9.0
7. Surface Water -
8. Others -
Over 59% of Mombasa households derive their water supplies from piped systems: with a
significant 29% obtaining it from the city utility: Mombasa Water Supply and Sewerage
Company (MOWASCO). Private sources supply only 2% of the households. Water Kiosks (or
piped system to public taps), account for a significant 8% of the City households, whilst the level
of access from boreholes and wells is 30%.
Compared to the national urban figures (Table 1-1), Mombasa has a higher coverage from
piped sources and also from boreholes and wells.
Like in the case of Kisumu City, the French Development Agency (AFD) is in the process of
financing a water and sewerage project for MOWASCO – to substantially increase coverage in

The Bill & Melinda Gates Foundation CHAPTER 3 : RESULTS AND ANALYSIS OF URBAN FSM PRACTICE Landscape Analysis and Business Model Assessment in Fecal Sludge Management: Extraction and Transportation Models in
Africa - Kenya
LOSAI MANAGEMENT LIMITED 3-22
the City. The household Survey above indicates that 59% of Mombasa households are
connected to piped water supply. This clearly confirms the 2009 National Census findings –
which then showed Mombasa had 56.6% piped system coverage.
B 3.1.3. Sanitation Coverage for Mombasa City
In order to find out the level of sanitation coverage in the City, 3 specific questions were posed
to the respondents:
a. Access to a sanitation facility within the household premises,
b. Where respondents without access to sanitation facility at home, go to answer a call of
nature; and
c. The kind of sanitation facility installed.
In terms of “safe or hygienic management of human waste” in non-sewered urban areas of the
City, Mombasa scores fairly well - compared to the national urban patterns. For instance,
whereas only about 6% nationally use the VIP Latrine, this is about 10% in Mombasa. For the
septic tank and cess pool, Mombasa’s coverage is 41% whilst nationally, this is only 8.7%.
With a project to improve availability of water supply underway, Mombasa’s sewer connection
coverage is bound to rise significantly in the near future.
Table 3-17 shows the level of access to and coverage of sanitation systems in Mombasa City.
Table 3-17 : Sanitation Coverage in Mombasa
No. Coverage Indicator % Observations
1. Access to a Sanitation Facility within Household Premises
Yes 91.0
A relatively high proportion of the households (91%) have access to a sanitation facility of one type or another, within their compound
No 9 2. Average No. of
Households Sharing Sanitation Facility
4
Compared to the other 2 Study cities, Mombasa has a much lower (and manageable) number of households sharing a sanitation facility
3. Place of Excreta Disposal (For the Disadvantaged 14% of Households)
Neighbor 44.0 A worrying 47% of those without access to a sanitation facility dispose human waste in open spaces and drainage channels. Another 6% are assumed to use other unsafe methods. This certainly contributes greatly to environmental
Public Toilet 6.0 Open Space 41.0 Drainage Channel
3.0

The Bill & Melinda Gates Foundation CHAPTER 3 : RESULTS AND ANALYSIS OF URBAN FSM PRACTICE Landscape Analysis and Business Model Assessment in Fecal Sludge Management: Extraction and Transportation Models in
Africa - Kenya
LOSAI MANAGEMENT LIMITED 3-23
Other 6.0 pollution – thus posing danger to human health in the respective areas of the City
4. Type of Sanitation Facility Installed (For the 86% who Have Access)
Ordinary Pit Latrine
38.0 The ordinary pit latrine predominates but majority are really of questionable standards of construction. Nevertheless, an encouraging 62% use facilities that may be categorized as constituting safe or hygienic management of human waste
VIP Latrine 10.0 Septic Tank 19.0 Cess Pool 22.0
Sewerage Connection
11.0
MOWASCO previously had an exhauster truck to serve the un-sewered areas of the City. It is
however no longer functional (since 2009) – leaving the void to be filled by private mechanical
and manual operators.
B 3.1.4. Institutional and Legal Framework for FSM at the City Level (Mombasa)
Interrelationship in the FSM System
There are 5 main actors in the FSM system at the city level. These are: the National
Environmental Management Authority (NEMA); the City/Municipal Council; the Water and
Sewerage Service Provider (WSP) for the city; the various companies and informal Emptying
Operators; and to certain extent, NGOs (Figure 3-3). These collectively may be referred to as
the City FSM Service Providers (CFSPS). The roles of the main actors in fecal sludge service
delivery are summarized below.
a. The National Environmental Management Authority (NEMA)
NEMA is the supreme authority in the country for enforcing the law for the protection and
conservation of the environment – under the Environmental Management and Coordination
Act (EMCA) 1999. EMCA also provides for the gazettement of regulations to control operations
regarding various environmental protection concerns.
For instance, for fecal sludge management, the relevant Environmental Protection Order is the
Environment and Coordination (Waste Management) Regulations 2006. These regulations are
meant to streamline the handling, transportation and disposal of various types of waste. This is
intended to protect human health and the environment.

The Bill & Melinda Gates Foundation CHAPTER 3 : RESULTS AND ANALYSIS OF URBAN FSM PRACTICE Landscape Analysis and Business Model Assessment in Fecal Sludge Management: Extraction and Transportation Models in
Africa - Kenya
LOSAI MANAGEMENT LIMITED 3-24
Under these Regulations also, NEMA licenses operators who use waste transport vehicles, e.g.
for fecal sludge management, “to prevent occurrence of odor or health hazard and to ensure
that transported waste is disposed off at sites designated by the Authority.”
b. The Municipal Council of Mombasa (MCM)
Figure 3-3 : The Institutional Framework for FSM at City Level (Mombasa)
MOMBASA MUNICIPAL COUNCIL
Business Permits Public Health Law
FSM SERVICE DELIVERY Industrial Customers Commercial Institutional Domestic Public Toilets
EMPTYING OPERATORS Private Companies Informal Operators
MOMBASA WATER & SEWERAGE COMPANY
FSM Operator FS Disposal Sites
NGOs Domestic Sanitation Public
NEMA Licensing FS Operators

The Bill & Melinda Gates Foundation CHAPTER 3 : RESULTS AND ANALYSIS OF URBAN FSM PRACTICE Landscape Analysis and Business Model Assessment in Fecal Sludge Management: Extraction and Transportation Models in
Africa - Kenya
LOSAI MANAGEMENT LIMITED 3-25
Like all the other LGAs, MCM is empowered by the law to enforce the provisions of the Public
Health Act and protection of the environment from pollution.
Specifically in the sanitation area, MCM through the Department of the Environment has
entered into a 10 year concession arrangement (Public/Private Partnership) with a private firm;
Excloosive Ltd, to establish and operate 8 public toilets in the City: 6 septic tanks and 2 sewer
connections.
The other organ of the Council – the Public Health Department, is active in ensuring that fecal
sludge is transported and disposed off, in ways that do not compromise health of the residents
of the city.
Residents Perception of the Role of the Mombasa Municipal Council
During the HH Survey process, respondents were asked to give their opinions on: “What should
be the role of the Municipal Council?” The answers preferred were varied – but quite relevant
to the broad issue of sanitation and the environment. Here below is a summary of the answers
given as contained in the Mombasa HH Survey Report:
Role of City/Municipal Councils
The roles of the municipal council as indicated by the respondents were as shown in Table 3-18.
Table 3-18 : Role of Mombasa Municipal Council
Build adequate sanitation facilities Inspect buildings to ensure they have sanitation facility
Provide washing detergents Collect tax and clean the environment
Provide emptying services within the city Provide free exhausting services
Provide vehicle to collect waste Arrest those who dump waste in wrong places
Connect residents to sewer lines Have weekly inspections
Repair broken sewer lines Offer services to all
Recycle the sludge Clean the garbage site
Improve the drainage system Improve living standard
Treat sewage Inspect their workers
Treat stagnant water Provide dustbins for dumping waste

The Bill & Melinda Gates Foundation CHAPTER 3 : RESULTS AND ANALYSIS OF URBAN FSM PRACTICE Landscape Analysis and Business Model Assessment in Fecal Sludge Management: Extraction and Transportation Models in
Africa - Kenya
LOSAI MANAGEMENT LIMITED 3-26
Maintain sewerage system Sensitize people on hygiene issues
Create defined dumping sites Implement by-laws on FSM
Clean the environment Implement by-laws on FSM
Provide municipal workers with necessary equipment and uniforms
Provide a conducive environment for the people
Build public toilets in slums Check on pollution
Timely waste collection Provide water tanks
c. The Mombasa Water and Sanitation Company (MOWASCO)
Established under the provisions of the Water Act 2002, MOWASCO is a public utility owned by
the Local Government Authority – Municipal Council of Mombasa, but managed under
arrangement by the Ministry of Water. Under the Act, MOWASCO as a Water and Sewerage
Services Service Provider (WSSP) is charged with the responsibility of providing water and
sewerage services to the residents of Mombasa City. The utility’s sewerage treatment plants
provide disposal sites for sludge from the private operators.
Water Supply
MOWASCO is the water and sewerage service provider for the Mombasa city. According to the
2009 Kenya Census, 56.6% of households in Mombasa are connected to piped water supply, but
only 14% of households have direct connection to sewer.
Like in the Kisumu case cited earlier, the French financing agency – AFD is equally funding a
water and sewerage Project for MOWASCO – to increase coverage in the City.
Sewerage Services
Role of the Water and Sanitation Utility
The role of the Water and Sanitation Utilities as indicated by the respondents are as shown in
Table 3-19.
Table 3-19 : Role of Water and Sanitation Utility – Mombasa
Provide water and sanitation facilities Check on illegal connections
Extend the sewer lines Provide quality services
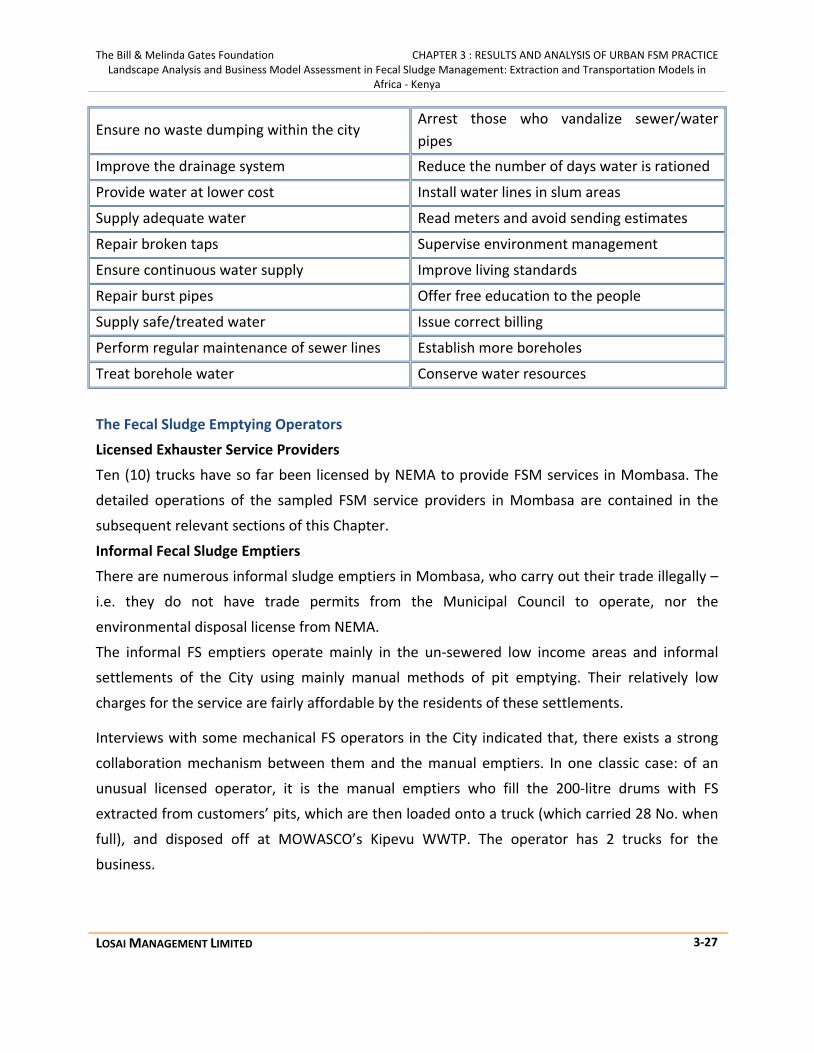
The Bill & Melinda Gates Foundation CHAPTER 3 : RESULTS AND ANALYSIS OF URBAN FSM PRACTICE Landscape Analysis and Business Model Assessment in Fecal Sludge Management: Extraction and Transportation Models in
Africa - Kenya
LOSAI MANAGEMENT LIMITED 3-27
Ensure no waste dumping within the city Arrest those who vandalize sewer/water pipes
Improve the drainage system Reduce the number of days water is rationed
Provide water at lower cost Install water lines in slum areas
Supply adequate water Read meters and avoid sending estimates
Repair broken taps Supervise environment management
Ensure continuous water supply Improve living standards
Repair burst pipes Offer free education to the people
Supply safe/treated water Issue correct billing
Perform regular maintenance of sewer lines Establish more boreholes
Treat borehole water Conserve water resources
The Fecal Sludge Emptying Operators
Licensed Exhauster Service Providers
Ten (10) trucks have so far been licensed by NEMA to provide FSM services in Mombasa. The
detailed operations of the sampled FSM service providers in Mombasa are contained in the
subsequent relevant sections of this Chapter.
Informal Fecal Sludge Emptiers
There are numerous informal sludge emptiers in Mombasa, who carry out their trade illegally –
i.e. they do not have trade permits from the Municipal Council to operate, nor the
environmental disposal license from NEMA.
The informal FS emptiers operate mainly in the un-sewered low income areas and informal
settlements of the City using mainly manual methods of pit emptying. Their relatively low
charges for the service are fairly affordable by the residents of these settlements.
Interviews with some mechanical FS operators in the City indicated that, there exists a strong
collaboration mechanism between them and the manual emptiers. In one classic case: of an
unusual licensed operator, it is the manual emptiers who fill the 200-litre drums with FS
extracted from customers’ pits, which are then loaded onto a truck (which carried 28 No. when
full), and disposed off at MOWASCO’s Kipevu WWTP. The operator has 2 trucks for the
business.

The Bill & Melinda Gates Foundation CHAPTER 3 : RESULTS AND ANALYSIS OF URBAN FSM PRACTICE Landscape Analysis and Business Model Assessment in Fecal Sludge Management: Extraction and Transportation Models in
Africa - Kenya
LOSAI MANAGEMENT LIMITED 3-28
Nevertheless, even in their own right, the manual emptying activity represent some potential
for commercial undertaking – in that they do provide basic services which the public sector or
the formal licensed mechanical operators, are unable – or unwilling to provide.
d. Non-Governmental Organizations (NGOs) in the Sanitation Sector
The roles of the NGOs operating in the city as indicated by the respondents were as captured in
Table 3-20.
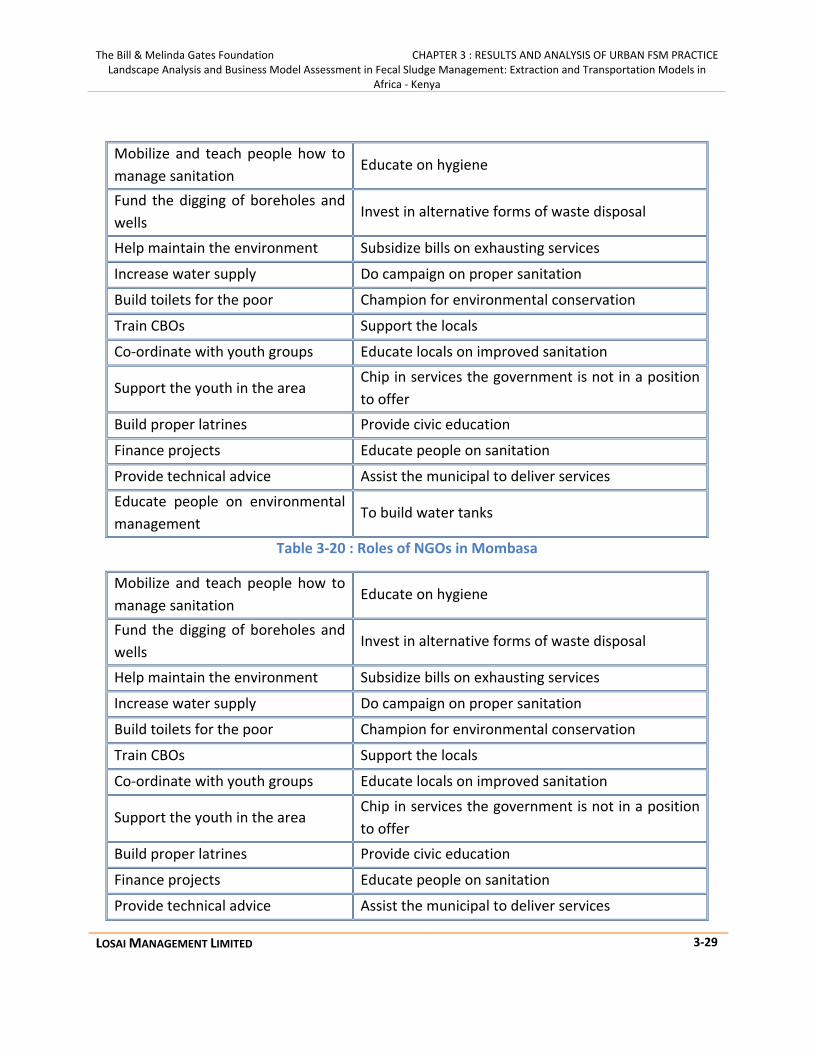
The Bill & Melinda Gates Foundation CHAPTER 3 : RESULTS AND ANALYSIS OF URBAN FSM PRACTICE Landscape Analysis and Business Model Assessment in Fecal Sludge Management: Extraction and Transportation Models in
Africa - Kenya
LOSAI MANAGEMENT LIMITED 3-29
Mobilize and teach people how to manage sanitation
Educate on hygiene
Fund the digging of boreholes and wells
Invest in alternative forms of waste disposal
Help maintain the environment Subsidize bills on exhausting services
Increase water supply Do campaign on proper sanitation
Build toilets for the poor Champion for environmental conservation
Train CBOs Support the locals
Co-ordinate with youth groups Educate locals on improved sanitation
Support the youth in the area Chip in services the government is not in a position to offer
Build proper latrines Provide civic education
Finance projects Educate people on sanitation
Provide technical advice Assist the municipal to deliver services Educate people on environmental management
To build water tanks
Table 3-20 : Roles of NGOs in Mombasa
Mobilize and teach people how to manage sanitation
Educate on hygiene
Fund the digging of boreholes and wells
Invest in alternative forms of waste disposal
Help maintain the environment Subsidize bills on exhausting services
Increase water supply Do campaign on proper sanitation
Build toilets for the poor Champion for environmental conservation
Train CBOs Support the locals
Co-ordinate with youth groups Educate locals on improved sanitation
Support the youth in the area Chip in services the government is not in a position to offer
Build proper latrines Provide civic education
Finance projects Educate people on sanitation
Provide technical advice Assist the municipal to deliver services

The Bill & Melinda Gates Foundation CHAPTER 3 : RESULTS AND ANALYSIS OF URBAN FSM PRACTICE Landscape Analysis and Business Model Assessment in Fecal Sludge Management: Extraction and Transportation Models in
Africa - Kenya
LOSAI MANAGEMENT LIMITED 3-30
Educate people on environmental management
To build water tanks
A list of identified NGOs operating in the city is as captured in Table 3-21.
Table 3-21 : List of NGOs operating in Mombasa city
1 ACTION AID 6 JAFER FOUNDATION
2 AFRICAN MUSLIM AGENCY(AMA) 7 LICODEP
3 AMREF 8 PLAN INTERNATIONAL
4 CARE INTERNATIONAL 9 RED CROSS
5 CARE KENYA 10 WORLD VISION
The roles of the CBOs operating in the city as indicated by the respondents are as captured in
Table 3-22.

The Bill & Melinda Gates Foundation CHAPTER 3 : RESULTS AND ANALYSIS OF URBAN FSM PRACTICE Landscape Analysis and Business Model Assessment in Fecal Sludge Management: Extraction and Transportation Models in
Africa - Kenya
LOSAI MANAGEMENT LIMITED 3-31
Table 3-22 : Role of local CBOs in Mombasa
Keep the area clean Support environmental cleaning
Repair burst pipes Coordinate with city council
Educate people on health issues Environment conservation
Educate people on FS end re-use Ensure good living standards to the people
Educate people on sanitation Prevent illegal dumping
Drill boreholes Provide dumping areas
Provide toilet cleaning materials Find ways to improve the environment
Provide cleaning service to the community Seek donor funding
Identify problems affecting the community Clean drainages
Link the community to NGO'S Collect and dispose garbage properly
Assist NGO's where they need help Unblock drains
Co-ordinate with NGO Coordinate clean up exercises
Educate people on health issues Enhance their involvement in community developments
Build proper latrines Maintain environmental cleanliness
Collect garbage on time Keep the residential area clean at reasonable prices
Ensure security Manage community utilities
A list of identified CBOs operating in the city is as captured in Table 3-23.
Table 3-23 : List of CBOs operating in Mombasa city
1. ACTION CENTER, AFAIM 34 KWACHIFU YOUTH GROUP
2. AFRICAN MUSLIM GROUP 35 KWETU TRAINING
3. ALAZHAR WATER PROJECT 36 KWFT
4. ALHAZAR MOSQUE FOUNDATION 37 LAMKENI YOUTH GRP
5. AMA (AFRICAN MUSLIM AGENCY) 38 LICODEP YOUTH
6. AMAN PROJECT ORGANIZATION 39 LONGO YOUTH GROUP
7. AZARI ARTS TROOP 40 MAENDELEO KWA VIJANA YOUTH GROUP
8. BAMAKO YOUTH GROUP 41 MAJI SAFI YOUTH GRP

The Bill & Melinda Gates Foundation CHAPTER 3 : RESULTS AND ANALYSIS OF URBAN FSM PRACTICE Landscape Analysis and Business Model Assessment in Fecal Sludge Management: Extraction and Transportation Models in
Africa - Kenya
LOSAI MANAGEMENT LIMITED 3-32
9. BIRIKANI YOUTH GROUP 42 MAWENI YOUTH GROUP
10 43 MBUYUNI SELF HELP GROUP
11 BOFU YOUTH GROUP 44 MENDE YOUTH GROUP
12 BOMBOLULU DIRT ORG 45 MEWA,AMA
13 CHAANI UNITED 46 MINEZA YOUTH GROUP
14 CHANGAMWE MUSLIM ASSOCIATION 47 MUUNGANO YOUTH GROUP
15 CHANGAMWE MUSLIM ASSOCIATION 48 MWAOMWE YOUTH GROUP
16 CLTS,SOG 49 MWATSALAFU YOUTH GRP
17 COAST YOUTH 50 PUMZIKA YOUTH GROUP
18 DONOLINDA YOUTH ORGANIZATION 51 SAFI YOUTH GROUP
19 EDUCATE PEOPLE ON SANITATION 52 SHELLY YOUTH GRP
20 53 SUNGUSUNGU SECURITY GROUP
21 JAMII AND KIZIWI YOUTH GROUPS 54 TALENT PARTNERS
22 JESHI YA MAZINGIRA 55 TIMBNANI YOUTH GRP
23 JOHO WOMEN FOUNDATION ORG 56 TONONOKA YOUTH GROUP
24 KENYA WOMEN 57 TULIZA COMMUNITY RESOURCE
25 KHADIJA DIRT SELF HELP GROUP 58 UJAMAA
26 KINGORANI YOUTH GROUP 59 VIJIWENI YOUTH GROUP
27 KIPEVU HELP GROUP 60 WAME,AMA
28 KISAUNI YOUTH GROUP 61 YOUTH COAST
29 KISIMANI DIRT ORG 62 YOUTH DEVELOPMENT
30 KIZIWI GROUP
B 3.1.5. Flow of Money Chart for FSM Transactions
The service channels in FS showed different financial transaction opportunities. The more
immediate being clients paying for FS management services to emptiers (Figure 3-4). However,
underlying this is the indirect payment to the FSTP through licensing by the Utility company
(MOWASCO) which manages the FSTP. More directly the FSTP receives payments for the sale of
treated FS to end users.

The Bill & Melinda Gates Foundation CHAPTER 3 : RESULTS AND ANALYSIS OF URBAN FSM PRACTICE Landscape Analysis and Business Model Assessment in Fecal Sludge Management: Extraction and Transportation Models in
Africa - Kenya
LOSAI MANAGEMENT LIMITED 3-33
Fecal Sludge management value chain
Therefore an expanded value chain of FS management value shows multiple flow of funds
among stakeholders as was noted in Mombasa. Improvements to this value chain are likely to
increase the demand for the services particularly by sealing leakages through unauthorized
burying of FS which occurs during manual empting.
In Mombasa the FS evacuation is undertaken by private entities. There is no public body
providing FS evacuation services. The private operators invest in their enterprises to provide
these services. Their key sources of finance are:
1. Personal savings and savings from friends and relatives
2. Loans from financial institutions
The Utility Company and the FSTP receive funding from two broad sources. The first source is
sales and service revenues from water sales- as a water utility and sewer connection fees plus
FS management licensing fees. The second source of funds is from the national exchequer as
part of budget allocation, grant and multilateral loan guarantees. There are formulations of
private-public partnerships that are being considered as a way of generating revenues. In
Mombasa the mechanical emptiers pay a dumping fee of USD10.87 per trip, and this is charged
in advance of tipping by the truck. The fee is payable to the Utility company which operates the
dumping site.
Client
Cheque
Cash
M-Pesa Individual Househol
Institutional
Emptier
Figure 3-4 : Financial Transaction Opportunities for FSM Services in Mombasa

The Bill & Melinda Gates Foundation CHAPTER 3 : RESULTS AND ANALYSIS OF URBAN FSM PRACTICE Landscape Analysis and Business Model Assessment in Fecal Sludge Management: Extraction and Transportation Models in
Africa - Kenya
LOSAI MANAGEMENT LIMITED 3-34
Table 3-24 summarizes financial transaction data for FSM services. In Mombasa the average
tariff is not comparable as the trucks operating are of different capacities. The dumping fee of
USD 10.87 charged by MOWASCO is similar for the trucks regardless of the capacity. The
treated sludge re-sale price is fixed by the utility company which operates the treatment plant.
Mombasa has two main sewerage treatment plants, the Kizingo Wastewater Treatment Works
located in Mombasa Island and Kipevu Wastewater Treatment Works in West Mainland. The
Kizingo WTW is not in operation. The Kipevu Wastewater Treatment Works in West Mainland
receives FS by mechanical operators and processes any FS for resale. However at present there
is no sale of treated sludge.
Table 3-24 : Financial Transaction Data for FSM Services - Mombasa
Client Category Emptiers Tariffs Per Truck Licensing fee (MOWASCO) End User Re-sale
Price Individual
Households Operator I
$ 124
$ 10.87 per truck
Households (Farm)
Commercial premises
Operator II
$ 108 Households
(Electricity)
Operator III $ 205
B 3.1.6. FS emptying business owners’ profile (Mombasa)
Following a landscape review of the operators in Mombasa, it was decided to interview at least one mechanical truck operator in each category of truck owners. Data (Table 3-25 and Table 3-26) from these operators was validated by a process of interviewing their employees.
Table 3-25 : FS Emptying Business Owners’ Profile - Mombasa
Operator Business Premises Business Type Age Business
Plan
1 Yes-office block Partnership (family business)
More than 20 years in business
Yes
2 None Sole proprietorship More than 10 years None
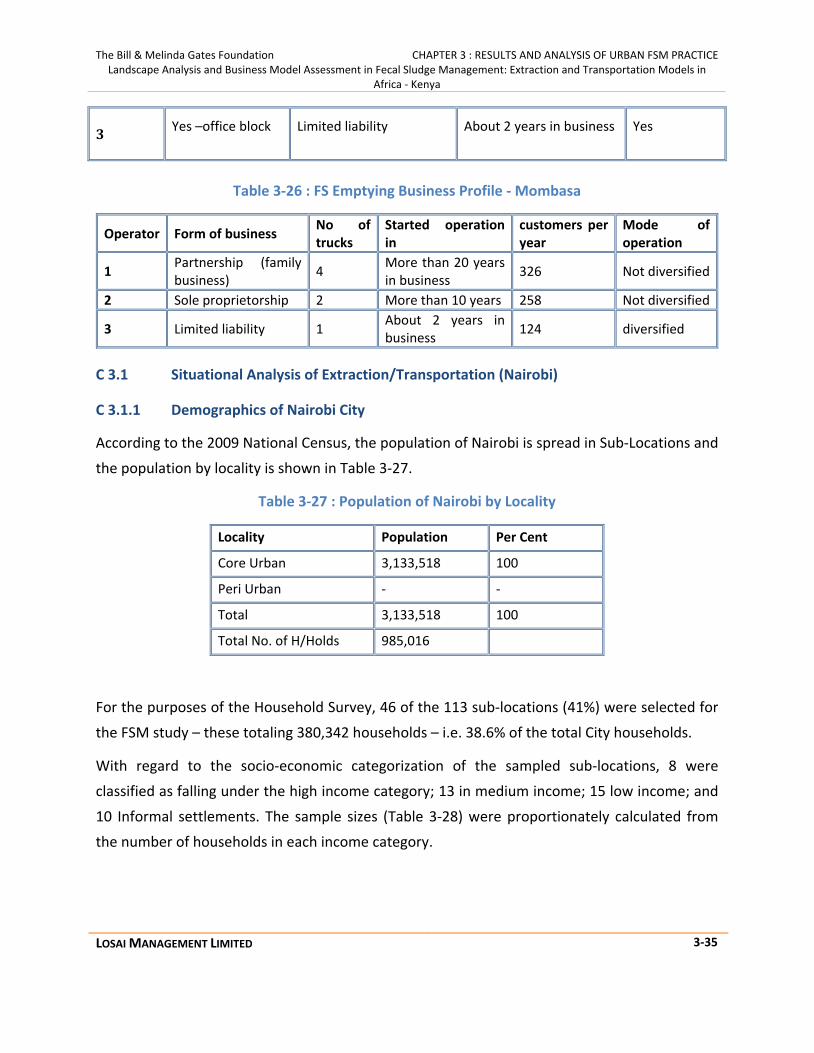
The Bill & Melinda Gates Foundation CHAPTER 3 : RESULTS AND ANALYSIS OF URBAN FSM PRACTICE Landscape Analysis and Business Model Assessment in Fecal Sludge Management: Extraction and Transportation Models in
Africa - Kenya
LOSAI MANAGEMENT LIMITED 3-35
3 Yes –office block Limited liability About 2 years in business Yes
Table 3-26 : FS Emptying Business Profile - Mombasa
Operator Form of business No of trucks
Started operation in
customers per year
Mode of operation
1 Partnership (family business) 4 More than 20 years
in business 326 Not diversified
2 Sole proprietorship 2 More than 10 years 258 Not diversified
3 Limited liability 1 About 2 years in business 124 diversified
C 3.1 Situational Analysis of Extraction/Transportation (Nairobi)
C 3.1.1 Demographics of Nairobi City
According to the 2009 National Census, the population of Nairobi is spread in Sub-Locations and
the population by locality is shown in Table 3-27.
Table 3-27 : Population of Nairobi by Locality
Locality Population Per Cent
Core Urban 3,133,518 100
Peri Urban - -
Total 3,133,518 100
Total No. of H/Holds 985,016
For the purposes of the Household Survey, 46 of the 113 sub-locations (41%) were selected for
the FSM study – these totaling 380,342 households – i.e. 38.6% of the total City households.
With regard to the socio-economic categorization of the sampled sub-locations, 8 were
classified as falling under the high income category; 13 in medium income; 15 low income; and
10 Informal settlements. The sample sizes (Table 3-28) were proportionately calculated from
the number of households in each income category.

The Bill & Melinda Gates Foundation CHAPTER 3 : RESULTS AND ANALYSIS OF URBAN FSM PRACTICE Landscape Analysis and Business Model Assessment in Fecal Sludge Management: Extraction and Transportation Models in
Africa - Kenya
LOSAI MANAGEMENT LIMITED 3-36
Table 3-28 : Sample Size per Sub-Location – Nairobi
Sub-Location Income
Category
Household
Population Sample size
Gatina LI 15,987 17
Kirigu LI 3,694 4
Mutuini LI 1,760 2
Ruthimitu MI 4,434 5
Uthiru MI 5,434 6
Kabiria LI 2,948 3
Waithaka LI 6,491 7
Ng'ando LI 11,162 12
Riruta LI 20,245 21
Karen HI 2,861 3
Kibera IS 3,237 3
Lindi LI 1,151 1
Makina LI 7,926 8
Siranga LI 6,164 6
Gatwikira/Olympic IS 15,597 16
Laini Saba IS 9,927 10
Mugumo-ini MI 8,478 9
Hardy MI 2,568 3
Embakasi MI 19,815 21
Mihango MI 6,167 6
Mukuru kwa Njenga IS 49,198 52
Njiru MI 7,496 8
Saika MI 7,945 8

The Bill & Melinda Gates Foundation CHAPTER 3 : RESULTS AND ANALYSIS OF URBAN FSM PRACTICE Landscape Analysis and Business Model Assessment in Fecal Sludge Management: Extraction and Transportation Models in
Africa - Kenya
LOSAI MANAGEMENT LIMITED 3-37
Sub-Location Income
Category
Household
Population Sample size
Ngundu MI 2,532 3
Ruai MI 7,316 8
Githurai LI 17,966 19
Kamuthi LI 1,190 1
Zimmerman MI 10,309 11
Gitathuru IS 6,480 7
Korogocho IS 3,129 3
Nyayo IS 1,300 1
Mabatini IS 9,809 10
Mathare IS 6,617 7
Huruma IS 23,800 25
Kiamaiko LI 10,217 11
Muthaiga HI 3,225 3
Karura HI 4,721 5
Highridge HI 8,075 9
Gichagi LI 6,409 7
Kangemi LI 15,256 16
Mt. View MI 5,194 6
Kileleshwa MI 4,592 5
Kitisuru HI 2,105 2
Kyuna HI 2,130 2
Loresho HI 5,907 6
Spring valley HI 1,378 2
Total 380,342 400
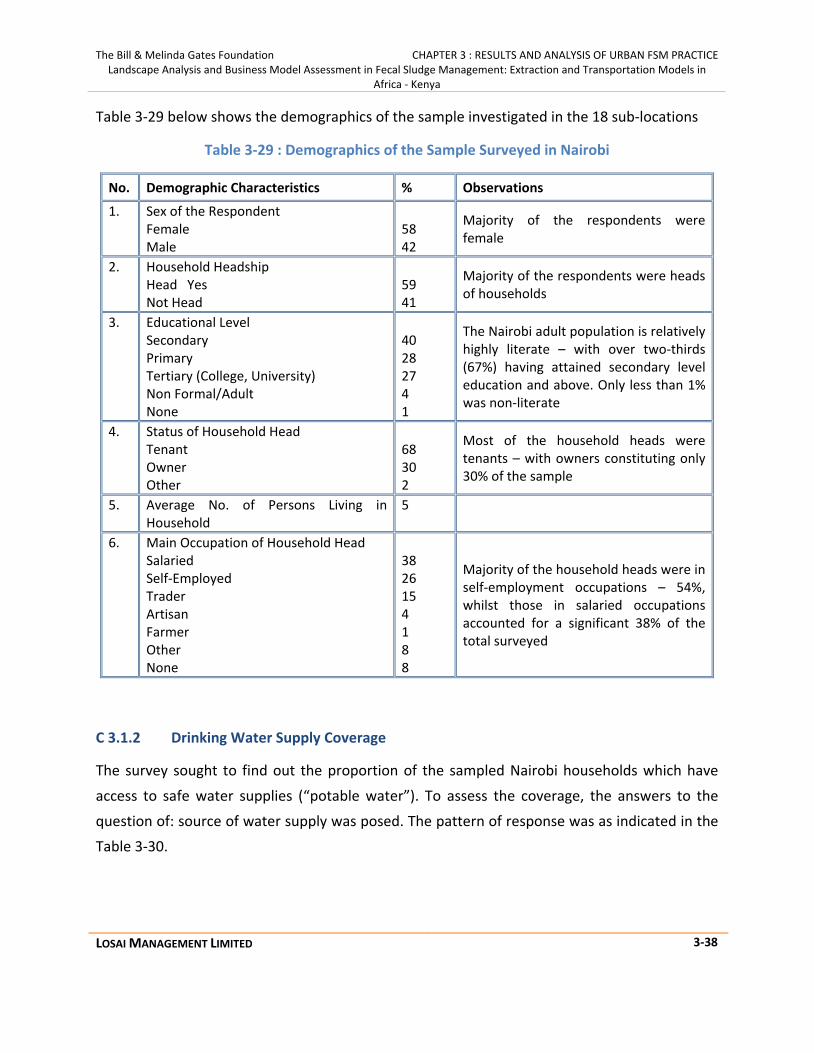
The Bill & Melinda Gates Foundation CHAPTER 3 : RESULTS AND ANALYSIS OF URBAN FSM PRACTICE Landscape Analysis and Business Model Assessment in Fecal Sludge Management: Extraction and Transportation Models in
Africa - Kenya
LOSAI MANAGEMENT LIMITED 3-38
Table 3-29 below shows the demographics of the sample investigated in the 18 sub-locations
Table 3-29 : Demographics of the Sample Surveyed in Nairobi
No. Demographic Characteristics % Observations
1. Sex of the Respondent Female Male
58 42
Majority of the respondents were female
2. Household Headship Head Yes Not Head
59 41
Majority of the respondents were heads of households
3. Educational Level Secondary Primary Tertiary (College, University) Non Formal/Adult None
40 28 27 4 1
The Nairobi adult population is relatively highly literate – with over two-thirds (67%) having attained secondary level education and above. Only less than 1% was non-literate
4. Status of Household Head Tenant Owner Other
68 30 2
Most of the household heads were tenants – with owners constituting only 30% of the sample
5. Average No. of Persons Living in Household
5
6. Main Occupation of Household Head Salaried Self-Employed Trader Artisan Farmer Other None
38 26 15 4 1 8 8
Majority of the household heads were in self-employment occupations – 54%, whilst those in salaried occupations accounted for a significant 38% of the total surveyed
C 3.1.2 Drinking Water Supply Coverage
The survey sought to find out the proportion of the sampled Nairobi households which have
access to safe water supplies (“potable water”). To assess the coverage, the answers to the
question of: source of water supply was posed. The pattern of response was as indicated in the
Table 3-30.

The Bill & Melinda Gates Foundation CHAPTER 3 : RESULTS AND ANALYSIS OF URBAN FSM PRACTICE Landscape Analysis and Business Model Assessment in Fecal Sludge Management: Extraction and Transportation Models in
Africa - Kenya
LOSAI MANAGEMENT LIMITED 3-39
Table 3-30 : Main Source of Water Supply – Nairobi city
No. Main Source % of Households
1. Individual Connection – NCWSC 44
2. Individual Connection – Private 3
3. Water Vendors 25
4. Water Kiosks 22
5. Borehole 2
6. Well 4
7. Surface Water -
8. Others 1
Forty-Seven per cent (47%) of Nairobi households derive their water supplies from piped
systems: with a significant 23.1% obtaining it from the city utility: Nairobi City Water and
Sewerage Company (NCWSC). Private piped sources supply account for only 3% of the
households. Water vendors – using mainly handcarts and trucks, supply a quarter of the City
households, whilst the level of access from boreholes and wells is only 6%. Only 1% of
households obtain their drinking from unsafe (unspecified) water sources.
Compared to the national urban figures (Table 1-1), Nairobi has a higher coverage from piped
sources but much lower from boreholes and wells. From this study too, Nairobi emerges with
no households using unsafe surface water sources (0%) against the national average of 9.2%.
C 3.1.3 Sanitation Coverage
In order to find out the level of sanitation coverage in the City, 3 specific questions were posed
to the respondents:
a. Access to a sanitation facility within the household premises,
b. Where respondents without access to sanitation facility at home, go to answer a call
of nature; and
c. The kind of sanitation facility installed.

The Bill & Melinda Gates Foundation CHAPTER 3 : RESULTS AND ANALYSIS OF URBAN FSM PRACTICE Landscape Analysis and Business Model Assessment in Fecal Sludge Management: Extraction and Transportation Models in
Africa - Kenya
LOSAI MANAGEMENT LIMITED 3-40
In terms of “safe or hygienic management of human waste” in non-sewered urban areas of the
City, Nairobi scores fairly well - compared to the national urban patterns. For instance, whereas
only about 6% nationally use the VIP Latrine, this is about 12% in Nairobi. For the septic tank
and cess pool, Nairobi’s coverage is 29% whilst nationally, this is only 8.7%.
Table 3-31 shows the level of access to and coverage of sanitation systems in Nairobi City.
Table 3-31 : Sanitation Coverage in Nairobi
No. Coverage Indicator % Observations
1. Access to a Sanitation Facility within Household Premises
Yes 85 An encouraging 85% of the households have access to a sanitation facility of one type or another, within their compound
No 15 2. Average No. of
Households Sharing Sanitation Facility
12
This high number households sharing a facility – mainly on-site, means that it fills up fast – hence requiring frequent (unaffordable) emptying
3. Place of Excreta Disposal (For the Disadvantaged 15% of Households)
Neighbor 34 A worrying 12% of these without access to a sanitation facility dispose human waste in open spaces and drainage channels. Another 7% are assumed to use other unsafe methods. This certainly contributes greatly to environmental pollution – thus posing danger to human health in the respective areas of the City
Public Toilet 46 Open Space 8 Drainage Channel 5 Other 7
4. Type of Sanitation Facility Installed (For the 85% who Have Access)
Ordinary Pit Latrine
44 The ordinary pit latrine predominates but majority are really of questionable standards of construction. Nevertheless, an encouraging 56% use facilities that may be categorized as constituting safe or hygienic management of human waste
VIP Latrine 12 Septic Tank 11
Cess Pool 18 Sewerage Connection
13
C 3.1.4 Institutional and Legal Framework for FSM at the City Level
Interrelationship in the FSM System
There are 5 main actors in the FSM system at the city level. These are: the National
Environmental Management Authority (NEMA); the City Council of Nairobi; Nairobi City Water

The Bill & Melinda Gates Foundation CHAPTER 3 : RESULTS AND ANALYSIS OF URBAN FSM PRACTICE Landscape Analysis and Business Model Assessment in Fecal Sludge Management: Extraction and Transportation Models in
Africa - Kenya
LOSAI MANAGEMENT LIMITED 3-41
and Sewerage Company the various companies and informal Emptying Operators; and to
certain extent, NGOs (Figure 3-5). These collectively may be referred to as the City FSM Service
Providers (CFSPS). The roles of the main actors in fecal sludge service delivery are summarized
below.
a. The National Environmental Management Authority (NEMA)
NEMA is the supreme authority in the country for enforcing the law for the protection and
conservation of the environment – under the Environmental Management and Coordination
Act (EMCA) 1999. EMCA also provides for the gazettement of regulations to control operations
regarding various environmental protection concerns.
For instance, for fecal sludge management, the relevant Environmental Protection Order is the
Environment and Coordination (Waste Management) Regulations 2006. These regulations are
meant to streamline the handling, transportation and disposal of various types of waste. This is
intended to protect human health and the environment.
Under these Regulations also, NEMA licenses operators who use waste transport vehicles, e.g.
for fecal sludge management, “to prevent occurrence of odor or health hazard and to ensure
that transported waste is disposed off at sites designated by the Authority.”
During the current year (2011), NEMA has licensed 60 trucks to operate the FSM business in
Nairobi City.

The Bill & Melinda Gates Foundation CHAPTER 3 : RESULTS AND ANALYSIS OF URBAN FSM PRACTICE Landscape Analysis and Business Model Assessment in Fecal Sludge Management: Extraction and Transportation Models in
Africa - Kenya
LOSAI MANAGEMENT LIMITED 3-42
b. The City Council of Nairobi (CCN)
Like the other local government authorities (LGAs) CCN is mandated by the Public Health Act,
Cap 242, “to take all lawful necessary and reasonably practicable measures, to maintain in their
jurisdiction, clean and sanitary condition and, to prevent occurrence of conditions liable to be
injurious or dangerous to human health.”
NAIROBI CITY COUNCIL
Business Permits Public Health Law
FSM SERVICE DELIVERY Industrial Customers Commercial Institutional Domestic Public Toilets
EMPTYING OPERATORS Private Companies Informal Operators
NAIROBI CITY WATER & SEWERAGE COMPANY
FSM Operator FS Disposal Sites
NGOs Domestic Sanitation Public
NEMA Licensing FS Operators
Figure 3-5 : The Institutional Framework for FSM at City Level (Nairobi)

The Bill & Melinda Gates Foundation CHAPTER 3 : RESULTS AND ANALYSIS OF URBAN FSM PRACTICE Landscape Analysis and Business Model Assessment in Fecal Sludge Management: Extraction and Transportation Models in
Africa - Kenya
LOSAI MANAGEMENT LIMITED 3-43
The city/municipal councils may also undertake the construction and operation of public toilets
– either by themselves, or by appropriate concessions to private sector actors – under the
Public Private Partnership (PPP) arrangement.
Two line departments of the City Council of Nairobi have a close relationship with the FSM
issue, viz, the Department of the Environment and the Public Health Department. Whereas the
Department of the Environment is involved in the development of physical infrastructure and
the protection and conservation of the environment, the Public Health Department enforces
the relevant laws and regulations.
Through the Public Private Partnership (PPP) CCN – through the Department of the
Environment, has in the past partnered with the Nairobi Central Business District Association
(NCBDA) to Build, Operate and Transfer public toilets – on five year concession arrangement.
After 5 years, CCN leased these facilities to a number of private operators and youth groups.
A similar concession has been made by CCN to Iko Toilets – on a Build, Operate and Transfer
(BOT) basis – which is still in operation.
In total, the City Council has concessioned 102 public toilets to be operated by private
companies and youth groups in various parts of the City.
During the Household Survey interviews, respondents were asked to give opinion as to; “What
should be role of the City Council (in FSM)”. Here below is summarized the wide range of
responses from the respondents:
Role of Nairobi City Council
The roles of the municipal council as indicated by the respondents were as shown in Table 3-32.
Table 3-32 : Role of Nairobi City Council
Build accessible sanitation facilities Garbage collection and infrastructure
development
Build sanitation facilities and maintain them Keep environment clean
Cater for environmental cleanliness Modernize operations for quality services
Collect garbage and monitor the water and
sewer lines Monitor hygiene standards

The Bill & Melinda Gates Foundation CHAPTER 3 : RESULTS AND ANALYSIS OF URBAN FSM PRACTICE Landscape Analysis and Business Model Assessment in Fecal Sludge Management: Extraction and Transportation Models in
Africa - Kenya
LOSAI MANAGEMENT LIMITED 3-44
Develop infrastructure and monitor sanitation Provide garbage disposal sites
Enforce by-laws in sanitation and hygiene Provide public toilets
Ensure all settlements have sanitation facilities Provide rubbish bags and coordinate disposal
Ensure people live in habitable area Provide water and clean the environment
Establish sewerage system Provision of cheaper exhauster services
Extend sewer line Repairs in case of damages
Facilitate street lighting in concert with KPLC
c. The Nairobi City Water and Sewerage Company (NCWSC)
Established under the provisions of the Water Act 2002, NCWSC is a public utility owned by the
Local Government Authority – City Council of Nairobi, but managed under arrangement by the
Ministry of Water. Under the Act, NCWSC as a Water Services Service Provider (WSSP) is
charged with the responsibility of providing water and sewerage services to the residents of
Nairobi City. The utility’s sewerage treatment plants and other designated points, provide
disposal sites for sludge from the private operators.
Role of the Water and Sanitation Utilities The role of the Water and Sanitation Utilities as indicated by the respondents were as shown in Table 3-33.
Table 3-33 : Role of the Water and Sanitation Utility – Nairobi
Clean drainage systems Offer exhaust services
Construct sewer lines and avail water Provide affordable and treated water to all households
Curb illegal connections Provide chemicals to suppress the smell of toilets
Educate on importance of health and sanitation Provide continuous water supply Ensure there’s clean water Provide improved sanitation facility Ensure they research on sanitation problems facing Provide piped water

The Bill & Melinda Gates Foundation CHAPTER 3 : RESULTS AND ANALYSIS OF URBAN FSM PRACTICE Landscape Analysis and Business Model Assessment in Fecal Sludge Management: Extraction and Transportation Models in
Africa - Kenya
LOSAI MANAGEMENT LIMITED 3-45
the people Meter reading Provide water infrastructure Monitor against dumping Regulate water bills Monitor sewerage infrastructure and water systems Regulate water delivery services Offer advice on septic construction Upgrade sanitation services
d. The Fecal Sludge Emptying Operators
The WSSPs are supposed to provide all residents of their cities with efficient and effective water
borne sewerage services. However, currently, Nairobi can provide only 65%.
Hence, there is a huge gap in the provision and demand for water borne sewerage services.
Consequently, private sector players – both formal and informal, have stepped in to fill the
wide gap – particularly for providing emptying services in the un-sewered parts of the
respective cities.
Licensed Exhauster Service Providers
There are 60 licensed exhauster trucks in operation in Nairobi – owned by 24 operators. NCWSC
is not currently involved in this line of sanitation service provision. This service level is not
adequate for the City. And given the low sewerage coverage, potential for investment in the
sector is great: demand for the service far outstrips the current supply.
The Informal Fecal Sludge Emptiers
In Nairobi, the informal FS emptiers tend to work in small groups of 5-15 people – who are
engaged in manual emptying of pit latrines in the informal settlements. One such group visited
in the Korogocho slums has 15 active members – operating in sub-groups of 5.
Manual emptiers thrive in the slums because, due to overcrowding, there is no vehicular access.
Moreover, the heavy sludge from the latrines is, not suited for mechanical pumping into the
trucks.
To transport the FS most groups of manual emptiers in Nairobi use 200 litre drums – loaded
onto handcarts and transported for disposal at a designated NCWSC points in the vicinity. But
the methods and tools they use still remain crude, unhygienic and stigmatized.
e. Non-Governmental Organizations (NGOs) in the Sanitation Sector

The Bill & Melinda Gates Foundation CHAPTER 3 : RESULTS AND ANALYSIS OF URBAN FSM PRACTICE Landscape Analysis and Business Model Assessment in Fecal Sludge Management: Extraction and Transportation Models in
Africa - Kenya
LOSAI MANAGEMENT LIMITED 3-46
Respondents in the Household Survey were asked to state what they perceived to be the role of
NGOs and further, to identify the NGOs in their areas currently active in water and sanitation
sectors.
Role of NGOs
The roles of the NGOs operating in the city as indicated by the respondents were as captured in
Table 3-34.
Table 3-34 : Role of NGOs – Nairobi
Adopt modern sanitation technology and educate locals Educate locals on use of sanitation facilities Assist community in water and sanitation issues Educate locals on water conservation Clean-up programs Educate people how to treat water Community sensitization Empower communities to improve life Community support in marginalized area and informal settlements Initiate water projects and funding Community support through project finance Offer training
Construct public toilets Provide relief services through economic empowerment
Create job opportunities through bio-centres Put up projects recycling water and wastes Create new strategies of dealing with waste Sensitize public on essence of clean environments Develop infrastructure Tap community’s' potential Develop technology and assist marginalized communities Upgrade slums Disseminate information and adopt new technologies Vet right contractors for projects Drill boreholes
A list of identified NGOs operating in the city is as captured in Table 3-35. A brief mention of
one of these 26 identified NGOs – i.e. Umande Trust – which is directly involved in FS issues, is
made here below.
The Umande Trust
The Bill & Melinda Gates Foundation CHAPTER 3 : RESULTS AND ANALYSIS OF URBAN FSM PRACTICE Landscape Analysis and Business Model Assessment in Fecal Sludge Management: Extraction and Transportation Models in
Africa - Kenya
LOSAI MANAGEMENT LIMITED 3-47
Umande Trust was earlier highlighted as being involved in water and sanitation activities in
Kisumu City. In Nairobi, the Trust has developed 44 community managed Bio-sanitation centers
in 4 informal settlements: 16 in Kibera; 14 in Korogocho; 12 in Mukuru; 1 in Muji wa Huruma
(Runda); and 1 in Kibagare.
The Umande model provides an economically viable approach for attaining sustainable
sanitation services in the informal settlements.
a. It combines the social objective of affordable basic service provision of the
underserved, with economic empowerment of participating communities. This is
really an underdeveloped social enterprise model.
b. For fecal sludge management, Umande has trained a corps of manual pit latrine
emptiers – equipped with hygienic tools of the trade, to provide services in the
crowded settlements. This has further been upgraded technologically, by the
introduction of the Gulper Pump: a small hand operated mechanical pump for FS
emptying.
c. The active partnership adopted by Umande with public agencies, private sector, and
other NGOs, ensures that there exists strong community organizational
infrastructure, to achieve real, longstanding and practical solutions to WAS
problems in the informal settlements.
Social Enterprise Firms
A social enterprise focused firm is one that combines business approaches to essentially
socially based service provision – in this case water supply and sanitation services.
Ecotact Ltd of Nairobi is a classic case of a social enterprise-driven business firm in the WASH
sector in Kenya.
Ecotact’s WASH delivery is based on 3 models (a) The (core) Urban-scape Model – operating in
the town’s central business district; (b) The Slum-scape Model – focusing on informal
settlements; and (c) The School Model. In all the 3 models Ecotact’s flagship is the Ikotoilet
technological innovation.
The Ikotoilet is a complete toilet “mall”, which in addition to providing basic sanitation facilities
for the slum dwellers also incorporates micro-business, in high demand in the area, such as
snack shops, barber/salon; advertising points; and recreation facilities.

The Bill & Melinda Gates Foundation CHAPTER 3 : RESULTS AND ANALYSIS OF URBAN FSM PRACTICE Landscape Analysis and Business Model Assessment in Fecal Sludge Management: Extraction and Transportation Models in
Africa - Kenya
LOSAI MANAGEMENT LIMITED 3-48
The Ikotoilet is established on Public Private Partnership framework and operates on a Build-
Operate and Transfer basis. However, Ecotact Ltd incorporates community participation by
partnering with a local committee in the management of the facility.
Undoubtedly, the Ecotact Model provides an innovative social enterprise business model that
could be replicated in the FSM framework.
Table 3-35 : List of NGOs operating in Nairobi city
1 ALVIDA 13 MONEY TRUST 2 AMREF 14 MSF BELGIUM 3 AUSTRALIA EVANGELIST 15 MYSA 4 BUKUNGU 16 OXFAM 5 CAROLINA 17 PAMOJA TRUST 6 ITALIAN CO-OPERATION 18 PLAN INTERNATIONAL 7 KICOSHEP 19 PLAN KENYA 8 KIVULI CENTRE 20 SAN FRONTIERS 9 KOINONIA 21 UMANDE TRUST 10 KWAHO 22 WASSUP 11 LIVING WATER INTERNATIONAL 23 WORLD VISION 12 MAJI NA UFANISI 24
C 3.1.5 Flow of Money Chart for FSM Transactions
The service channels in FS showed different financial transaction opportunities. The more
immediate being clients paying for FS management services to emptiers (Figure 3-6). However,
underlying this is the indirect payment to the FSTP through licensing by the Utility company
(NCWSCO) which manages the FSTP. More directly the FSTP receives payments for the sale of
treated FS to end users.

The Bill & Melinda Gates Foundation CHAPTER 3 : RESULTS AND ANALYSIS OF URBAN FSM PRACTICE Landscape Analysis and Business Model Assessment in Fecal Sludge Management: Extraction and Transportation Models in
Africa - Kenya
LOSAI MANAGEMENT LIMITED 3-49
Fecal Sludge management value chain
Therefore an expanded value chain of FS management value shows multiple flow of funds
among stakeholders as was noted in Nairobi. Improvements to this value chain are likely to
increase the demand for the services particularly by sealing leakages through unauthorized
burying of FS which occurs during manual empting.
In Nairobi the FS evacuation is undertaken by private entities. There is no public body providing
FS evacuation services. The private operators invest in their enterprises to provide these
services. Their key sources of finance are:
1. Personal savings and savings from friends and relatives
2. Loans from financial institutions
The Utility Company and the FSTP receive funds from two broad sources; sales and service
revenues from water sales- as a water utility and sewer connection fees plus FS management
licensing fees. The second source of funds is from the national exchequer as part of budget
allocation, grant and multilateral loan guarantees. There are formulations of private-public
partnerships that are being considered as a way of generating revenues. In Nairobi the
mechanical emptiers pay a dumping fee of USD 2.00 per trip and this is charged in advance of
tipping by the truck. The fee is payable to the Utility company which operates the dumping site.
Client
Cheque
Cash
M-Pesa Individual Househol
Institutional
Emptier
Figure 3-6 : Financial Transaction Opportunities for FSM Services - Nairobi

The Bill & Melinda Gates Foundation CHAPTER 3 : RESULTS AND ANALYSIS OF URBAN FSM PRACTICE Landscape Analysis and Business Model Assessment in Fecal Sludge Management: Extraction and Transportation Models in
Africa - Kenya
LOSAI MANAGEMENT LIMITED 3-50
Table 3-36 summarizes financial transaction data for FSM services. In Nairobi the average tariff
is not comparable as the trucks operating are of different capacities and from different
locations. The dumping fee of USD 2 charged by NCWSCO is similar for the trucks regardless of
the capacity. The treated sludge re-sale price is fixed by the utility company which operates the
treatment plant. Nairobi has 2 waste treatment plants. The one located at Njiru which receives
FS by mechanical operators and it does no process any FS for resale. The treatment and resale
of FS takes place at the Kariobangi WTP which is at another location.
Table 3-36 Tariffs and Fees for FSM Services - Nairobi
Client Category Emptiers Tariffs Number of Trucks
Licensing fee Per Month (NCWSCO) End User Re-sale
Price
Individual Households
Commercial premises
I 91 1 50 Households (Farm)
Households (Electricity)
II 71 1 50
III 81 1 50
Individual Households
Commercial premises
IV 70 2 50
Households (Farm)
Households (Electricity)
V 79 2 50
VI 108 2 50
VII 82 2 50
VIII 88 2 50
IX 75 2 50
Households (Farm)
Households (Electricity)
Individual Households
Commercial premises
X 79 4 50 Households (Farm)
Households (Electricity)
XI 77 4 50
C 3.1.6 FS emptying business owners’ profile (Nairobi)
Following a landscape review of the operators in Nairobi, it was decided to interview a number
of the mechanical truck operators across the spectrum of truck owners. Data from these eleven
operators was validated by a process of interviewing their employees.

The Bill & Melinda Gates Foundation CHAPTER 3 : RESULTS AND ANALYSIS OF URBAN FSM PRACTICE Landscape Analysis and Business Model Assessment in Fecal Sludge Management: Extraction and Transportation Models in
Africa - Kenya
LOSAI MANAGEMENT LIMITED 3-51
Table 3-37 FS Emptying Business Owners’ Profile - Nairobi
Operator Business Premises Business Type Age Business Plan
1 Yes-office block Limited liability About 1 year in business
2 None Sole proprietorship About 1 year in business
3 Yes-office block Sole proprietorship About 2 year in business
4 None Sole proprietorship About 2 years in business
5 Yes-office block Partnership About 5 years in business
6 None Sole proprietorship About 4 years in business
7 None Sole proprietorship About 10years in Business
8 Jua Kali Sole proprietorship About 2 year in business
9 Home Partnership About 6 year in business
10 Yes-office block Limited liability About 10 years in Business
11 Yes-office block and garage Sole proprietorship About 8 years in
Business
Table 3-38 : FS Emptying Business Profile - Nairobi
Operator Form of business No of trucks Started operation in
customers per year Mode of operation
1 Limited liability 1 About 1 year in business 347 Not diversified
2 Sole proprietorship 1 About 1 year in business 347 Diversified
3 Sole proprietorship 1 About 2 year in business
347 Not diversified
4 Sole proprietorship 2 About 2 years in business 480 Diversified
5 Partnership 2 About 5 years in business 504 Diversified
6 Sole proprietorship 2 About 4 years in business 624 Diversified
7 Sole proprietorship 2 About 10years in Business 696 Not diversified
8 Sole proprietorship 2 About 2 year in business 528 Diversified
9 Partnership 2 About 6 years in 528 Diversified
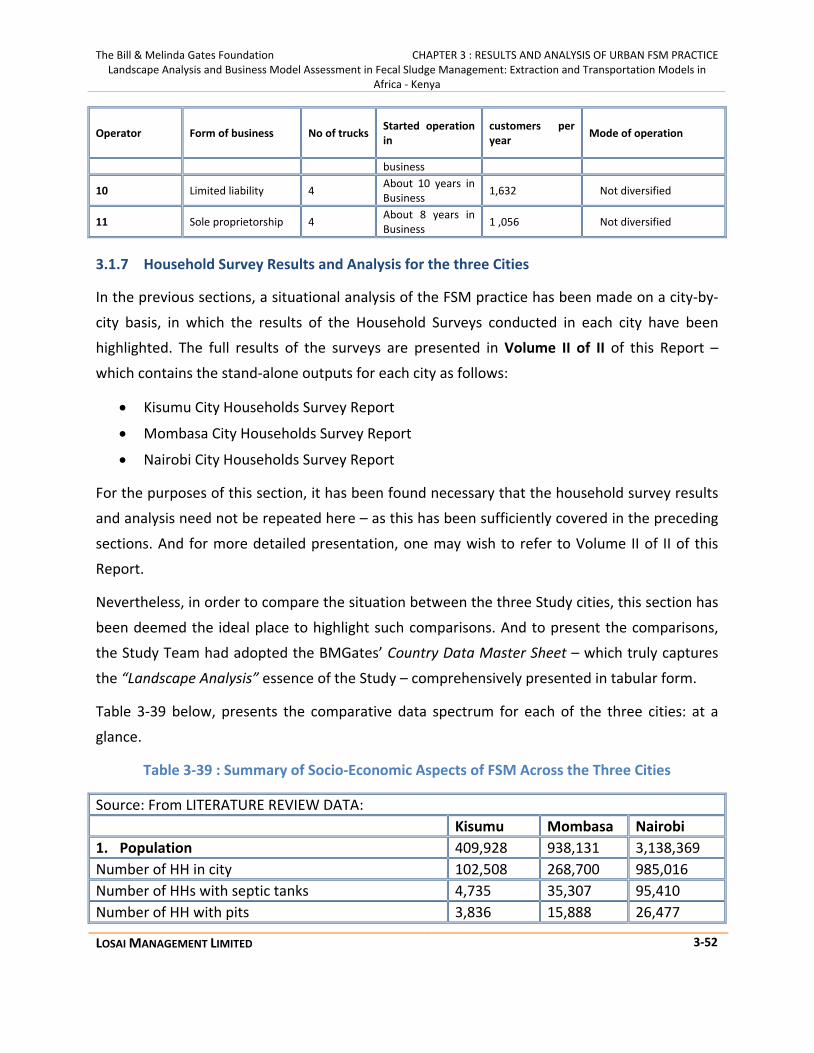
The Bill & Melinda Gates Foundation CHAPTER 3 : RESULTS AND ANALYSIS OF URBAN FSM PRACTICE Landscape Analysis and Business Model Assessment in Fecal Sludge Management: Extraction and Transportation Models in
Africa - Kenya
LOSAI MANAGEMENT LIMITED 3-52
Operator Form of business No of trucks Started operation in
customers per year Mode of operation
business
10 Limited liability 4 About 10 years in Business 1,632 Not diversified
11 Sole proprietorship 4 About 8 years in Business 1 ,056 Not diversified
3.1.7 Household Survey Results and Analysis for the three Cities
In the previous sections, a situational analysis of the FSM practice has been made on a city-by-
city basis, in which the results of the Household Surveys conducted in each city have been
highlighted. The full results of the surveys are presented in Volume II of II of this Report –
which contains the stand-alone outputs for each city as follows:
• Kisumu City Households Survey Report
• Mombasa City Households Survey Report
• Nairobi City Households Survey Report
For the purposes of this section, it has been found necessary that the household survey results
and analysis need not be repeated here – as this has been sufficiently covered in the preceding
sections. And for more detailed presentation, one may wish to refer to Volume II of II of this
Report.
Nevertheless, in order to compare the situation between the three Study cities, this section has
been deemed the ideal place to highlight such comparisons. And to present the comparisons,
the Study Team had adopted the BMGates’ Country Data Master Sheet – which truly captures
the “Landscape Analysis” essence of the Study – comprehensively presented in tabular form.
Table 3-39 below, presents the comparative data spectrum for each of the three cities: at a
glance.
Table 3-39 : Summary of Socio-Economic Aspects of FSM Across the Three Cities
Source: From LITERATURE REVIEW DATA: Kisumu Mombasa Nairobi 1. Population 409,928 938,131 3,138,369 Number of HH in city 102,508 268,700 985,016 Number of HHs with septic tanks 4,735 35,307 95,410 Number of HH with pits 3,836 15,888 26,477

The Bill & Melinda Gates Foundation CHAPTER 3 : RESULTS AND ANALYSIS OF URBAN FSM PRACTICE Landscape Analysis and Business Model Assessment in Fecal Sludge Management: Extraction and Transportation Models in
Africa - Kenya
LOSAI MANAGEMENT LIMITED 3-53
Number of HH with holding tank/cesspools 145 3,698 10,489 Source for all rest: HOUSEHOLD SURVEY DATA Consultant HH survey data: HH survey sample size 400 400 400 What % of HH in the city does this sample represent?
2.5% 0.15% 0.05%
2. Access to Drinking Water % HH with Piped systems to household 27.0 31.0 47.0 % HH using piped systems to public taps (kiosks) 26.0 28.0 22.0 % HH using Wells 7.0 9.0 4.0 % HH using Private vendors 11.0 11.0 25.0 % HH using Boreholes 18.0 21.0 2.0 % using Other Sources 2.0 - 1.0 3. Types of Sanitation facilities:
% HH with no sanitation 12.0 9.0 15.0 % HH with direct connection to sewer 4.0 11.0 13.0 % HH with Septic Tank 17.0 19.0 11.0 % HH with holding tank/cesspools 2.0 22.0 18.0 % HH with pit latrines 57.0 38.0 44.0 % HH with VIP 20.0 10.0 12.0 % HH with septic tanks to sewer network - - - % HH with pits to sewer network - - - %% with Other (describe “other”) - - - 4. Usage of the sanitation facility from survey
Number of people per HH 6 5 5 Average users per toilet 8 4 12

The Bill & Melinda Gates Foundation CHAPTER 3 : RESULTS AND ANALYSIS OF URBAN FSM PRACTICE Landscape Analysis and Business Model Assessment in Fecal Sludge Management: Extraction and Transportation Models in
Africa - Kenya
LOSAI MANAGEMENT LIMITED 3-54
3.1.8 FSM Emptying Practices and Technologies Used: Manual and Mechanical
FSM Emptying Practices and Technologies: Kisumu City
The methods of fecal sludge emptying were determined from the HH survey.
Based on the HH survey, the estimates for method of FS emptying were obtained by analyzing
the responses to questions and inferring based on those estimates the actual number of HH
with reference to the national population.
The questions respondents were asked were;
Q17: What kind of facility?
Q21: What kind of emptying services do you use?
The data collection instruments used in this regard are included as Appendix A and also in
Volume II of II of this report.
When Q17 and Q21 are transposed, they provide the breakdown of type of facility and method
of emptying which then when summed up gives the answers to method of FS emptying.
Similarly when Q21 is adjusted for sewered respondents, it provides the answer to the global
method of FS emptying.
The results (Table 3-40) indicate 25% of of the HH’s use mechanical operators while 75% use
manual methods of empting. Detailed analysis is included in this report as appendix B.
Table 3-40 : Methods of Emptying Fecal Sludge in Kisumu
Number of the city HH with On-site sanitation 124,830 Number of the HH with on-site sanitation having pits in the city using Mec. Emp 16,977
Number of the HH with on-site sanitation having septic tanks in the city using Mec. Emp 11,512
Number of the HH with on-site sanitation having cesspool in the city using Mec. Emp 2,498
Total number of HH with on-site sanitation emptied mechanically 30,987 Number of the HH with on-site sanitation having pits in the city using Man. Emp 82,887 Number of the HH with on-site sanitation having septic tanks in the city using Man. Emp 10,209
Number of the HH with on-site sanitation having cesspool in the city using Man. Emp 373
Total number of HH with on-site sanitation emptied mechanically 93,469 Mechanical (%) Manual (%) % of Method of Emptying by HH with on-site sanitation 25% 75% % of Share of Volume of FS emptied by method 2% 98%

The Bill & Melinda Gates Foundation CHAPTER 3 : RESULTS AND ANALYSIS OF URBAN FSM PRACTICE Landscape Analysis and Business Model Assessment in Fecal Sludge Management: Extraction and Transportation Models in
Africa - Kenya
LOSAI MANAGEMENT LIMITED 3-55
% of the HH with on-site sanitation having pits in the city emptied 17% 83% % of the HH with on-site sanitation having septic tanks in the city emptied 53% 47%
% of the HH with on-site sanitation having cesspool in the city emptied 87% 13%
To derive the share of manual and mechanical for the whole population;
93,469/124,830 = 75% that is percentage of HH with on-site sanitation using manual emptying
30,987/124,830 = 25% that is percentage of HH with on-site sanitation using mechanical
emptying
As the HH survey revealed, the manual emptying included: closing the pit when full and digging
another one, burying the pit, directing the sludge into existing drainage channels or directing
liquid sludge into farms, closing the pit when full and reusing it after some time when the
sludge has reduced. Further analysis of the responses of “other” indicated that respondents
would rather respond that the facility is not yet full instead of alluding to manual emptying.
Therefore, during amalysis, respondeds clustered under “other” were included in the manual
emptying category.
The operations of mechanical operators are insufficient to meet the existing demand of
emptying services, though neither is the effective demand sufficient to cause the operators to
operate at full capacity.
There are 3 private mechanical FS services businesses in Kisumu who between them operate 4
trucks. Table 3-41 provides data of these mechanical.
Table 3-41 : Data on Mechanical Operators in Kisumu
Kisumu # of private mechanical businesses in city 3 # of trucks run by private businesses 4 # of trucks owned by utilities 0 What are utility trucks used for (HH? Govt. institutions use, sewer cleaning? N.A # of private businesses that are small (1 truck) 2 # of pvt businesses that are medium (2-5 trucks) 1 # of pvt businesses that are large (>5 trucks) 0 What are the capacities of private trucks (m3) 8 m3 What are capacities of Utility trucks (m3) 0

The Bill & Melinda Gates Foundation CHAPTER 3 : RESULTS AND ANALYSIS OF URBAN FSM PRACTICE Landscape Analysis and Business Model Assessment in Fecal Sludge Management: Extraction and Transportation Models in
Africa - Kenya
LOSAI MANAGEMENT LIMITED 3-56
Price for new truck ( 15 m3 capacity ) USD 48,913 Price for USED truck ( 9 m3 capacity) USD 20,000
One of the operators runs the FS emptying service as part of an existing business. The trucks
currently in use in Kisumu are old and fairly unreliable, experiencing frequent breakdowns. In
addition they are all local assembly type model.
The trucks in use by the operators are old and delicate (Figure 3-7).
Kisumu has 3 mechanical operators who own a total of 4 trucks (Table 3-42 and Table 3-43).
They operate from a common area within the town, but do not have a designated parking. The
operator businesses are sole proprietorships and partnerships. The operators do not have
formal offices, and clients generally find them by visiting the common parking area or by
stopping the trucks on the road whenever they see them.
Table 3-42 : Truck Characteristics - Kisumu
Truck characteristics Volume in Cubic meters m3 Year of manufacture Operator 1 Truck 1 6 m3 1984 2 8 m3 1988 Operator 2 Truck 1 6 m3 1984 Operator 3 Truck 1 10 m3 1984
Figure 3-7 : Trucks in Kisumu for FS Services

The Bill & Melinda Gates Foundation CHAPTER 3 : RESULTS AND ANALYSIS OF URBAN FSM PRACTICE Landscape Analysis and Business Model Assessment in Fecal Sludge Management: Extraction and Transportation Models in
Africa - Kenya
LOSAI MANAGEMENT LIMITED 3-57
Table 3-43 : Commencement and Customers of Mechanical Operators – Kisumu
Employees
The operators do not have female employees. In general a truck has three employees which
include a driver, a pump operator and a plumber cum turn boy. Two of the operators pay their
employees a daily casual wage while one operator has three employees on monthly wages.
Licensing
All operators are required to have 3 (three) licenses which include
1. Trading license obtained from the Municipal Authority but issued as a business license.
This is renewed annually.
2. Environmental license issued by the national environmental office located in Kisumu
and issued on a per truck basis. This is renewed annually.
3. Tipping licensing issued by the utility firm. This permit is issued on per truck basis and is
renewed annually.
Operations
Each of the 3 operators uses similar management structures. Operator 1 parks his trucks
overnight at the local administration police office. Operator 2 and 3 park their trucks in their
personal compounds. There are no charges for this. In the morning the drivers and their crew
pick the trucks and relocate to the common space in town to “hawk” for business. The driver
fuels the truck based on earnings from clients where the typical arrangement is for the client to
make a deposit. In some instances the driver retains USD 10 of the previous day’s sales as float
to fuel the vehicle at the beginning of the following day.
Operators No. of Trucks Year of Commencement
Number of Customers/year
1 2 2004 528 2 1 2008 46 3 1 2011 288 Projections

The Bill & Melinda Gates Foundation CHAPTER 3 : RESULTS AND ANALYSIS OF URBAN FSM PRACTICE Landscape Analysis and Business Model Assessment in Fecal Sludge Management: Extraction and Transportation Models in
Africa - Kenya
LOSAI MANAGEMENT LIMITED 3-58
Table 3-44 : Per Trip Fees for FSM Services – Kisumu
Within Municipal -Per Trip fees (irrespective of whether HH or Corporate)
Tariffs Operator 1 Minimum fee USD Maximum fee USD
Truck 1 27 43
2 38 59
Operator 2 27 48
Operator 3 38 65
Once a client contacts the truck, a deposit is received and they drive to the location. The service
charge is on a trip and distance basis. Customers pay for either a single trip, multiple trips and
as many trips as are necessary to empty the pit latrine or septic tank. Thus, the shorter the
distance the lower the charge. The driver and his crew collect all earnings and submit these to
the truck owner at end of day or whenever the truck owner calls upon them in the field. There
is an allowance for lunch. The driver and his crew are responsible for refueling the truck in the
course of the day as they operate. At fueling stations, the truck crew does not necessarily
obtain any receipts.
At the end of day, the truck crews, with the driver acting as team leader submit their verbal
report of earnings, number of trips and expenses to the owner. The truck owner has no way of
verifying the number of trips, the fee paid by each customer nor the amount spent on fuel and
lubricants if the need arises. As a matter of general policy the truck crew is not permitted to
undertake any major vehicle repairs nor take the car to the garage for general service. These
two activities are conducted only by the truck owner and handles the payments.
Table 3-45 : Mechanical Emptiers Truck Crew – Kisumu
# of employees
Type of employment Organization of employees (truck crew)
Operator 1 3 Permanent on monthly wage 1 Driver, 1 Pump attendant 1 Pump Assistant
Operator 2 2
Casual employees paid on a daily basis on a per trip basis -No trip no pay
1 Driver cum pump operator assistant 1 Pump attendant
Operator 3 2 Casual employees paid on a daily basis on a per trip basis -No trip no pay
1 Driver cum pump operator assistant 1 Pump attendant
The Bill & Melinda Gates Foundation CHAPTER 3 : RESULTS AND ANALYSIS OF URBAN FSM PRACTICE Landscape Analysis and Business Model Assessment in Fecal Sludge Management: Extraction and Transportation Models in
Africa - Kenya
LOSAI MANAGEMENT LIMITED 3-59
Trips and customers
The number of trips per day reported to the truck owner does not always tally with the actual
trips made by the crew.
It was observed that the truck crew will report different number of trips, and in addition the
truck crew tend to inflate fuel expenditure on any given day. As such number of trips, revenues
per truck and amounts paid by customers are difficult to track or estimate with a high degree of
accuracy. There is no receipting system except for corporate customers who often require
evidence of payment.
A number of reasons may exist for lack of customer receipting in the industry. Foremost
receipts are only absolutely necessary for
1. Expense claims process-where the customer may have the service paid for by employer
or landlord
2. Where the customer maintains book keeping records such as a corporate client-hotel,
factory etc.
3. Where the customer makes a VAT return and therefore the service VAT incurred is
INPUT TAX and is useful for offsetting purposes
Dumping site
There is one official dumping site for FS, which is Nyalenda Wastewater Treatment Works
(Figure 3-8). Generally there are no reported cases of sludge dumping in unauthorized areas in
Kisumu though the dump site is not well secured by a fence. The site is not manned by security
guards is open on a 24 hour basis on a 7 day week basis. Dumping takes place all days of the
week and almost at all hours. At the dumping site, the trucks discharge to a man-hole of which
there are two available. These man-holes are connected by sewer line to the FSTP. The facility is
not well maintained at present, and no records are kept of dumping activity. However there is
planned rehabilitation to include fencing and re-organize the management.

The Bill & Melinda Gates Foundation CHAPTER 3 : RESULTS AND ANALYSIS OF URBAN FSM PRACTICE Landscape Analysis and Business Model Assessment in Fecal Sludge Management: Extraction and Transportation Models in
Africa - Kenya
LOSAI MANAGEMENT LIMITED 3-60
The dumping site does not charge a tipping fee as this has already being included in the license
fee charged by the utility company which is responsible for operating the dumping site.
Trucks
Three of the 4 trucks operating in Kisumu have similar pumps and suction technologies (Figure
3-9), which use robust pumps to suction FS from the septic tank and pit latrines. There are no
vacuum trucks in operation. One of the operators who has a single truck (6 m3) on the other
hand uses a conventional water pump to suction FS. Given the limitations of this water pump,
this operator can only empty cess pools as the machinery in use is weak to de-sludge septic
tanks and pit latrines. Nonetheless the average age of all trucks in use in for mechanical
emptying in Kisumu is over 25 years.
Figure 3-8 : FS Disposal at the inlet of Nyalenda TP (left) and access to the plant (right)
Figure 3-9 : Location of Pumps in Trucks - Kisumu
The Bill & Melinda Gates Foundation CHAPTER 3 : RESULTS AND ANALYSIS OF URBAN FSM PRACTICE Landscape Analysis and Business Model Assessment in Fecal Sludge Management: Extraction and Transportation Models in
Africa - Kenya
LOSAI MANAGEMENT LIMITED 3-61
Number of Trips per Day
Two of the three operators report at least 1 trip per day every day on a 22 working day cycle.
The third operator has about 1 trip per week. While the number of trips obtained from the
operators is 1 per day on average, based on interviews on the truck crews they make 5 trips
every 3 days per truck, indicating that between 30% and 40% of trips are not disclosed to the
owner. The nature of the undisclosed trips however appears to be small in value and to be
short distance trips.
Fuel Consumption and Expenditure
In Kisumu, the distance of a single trip-from park to client to dump site and back to park-is 12
km for the longest distance and for short distances this could be less than 4km. Based on the
vehicle models in use though the trucks are old, the average distance per litre is 3 to 3.5
kilometers. The pump technologies in use by the 3 trucks require about 30minutes to fill 8000
litres. The suction process consumes between 2.5 and 3 litres of fuel. Therefore the cost of
servicing a short distance client is 5 litres and a long distance client is between 8 and 9 litres.
Thus the fuel cost of a single trip is between USD 5.9 to USD 9.4, and the undisclosed trips are
charged between USD 10 and USD 15, whereas fees for disclosed trips range between USD 26
and USD 53.
Operations Audit and Supervision
The absence of a tipping fee and permit means that there is no active record keeping of vehicle
trucks. As such the truck owners conduct random inspection of the operations of their trucks,
but this system is incomplete because the truck owner has to drive around covering several
kilometers to validate the number of trips reported. This is not done on a regular basis
especially because such supervision requires the owner to spend on fuel on a private car. One
way of undertaking active supervision is by being stationed at the dumping site, but even this
works only if the place is secured. The truck owners in Kisumu expressed frustration with the
lack of tipping point security and record keeping.
The exception to active monitoring is one operator (owner of two trucks) who owns a motor
cycle which he rides daily into town to monitor the movement of his trucks. These varied
methods of monitoring are not dependable. As the odometers in all the trucks do not work it is
precisely difficult for the truck owner to establish the total number of kilometers covered by a

The Bill & Melinda Gates Foundation CHAPTER 3 : RESULTS AND ANALYSIS OF URBAN FSM PRACTICE Landscape Analysis and Business Model Assessment in Fecal Sludge Management: Extraction and Transportation Models in
Africa - Kenya
LOSAI MANAGEMENT LIMITED 3-62
truck on any given day. In addition if the owner is pre-occupied with monitoring, it leaves little
room for business development functions which are necessary to grow the business.
Marketing
Marketing activities include on truck telephone listing and distribution of flyers directly to
households.
Table 3-46 and Table 3-47 summarize the operations and a number of the challenges
highlighted by some of the operators interviewed.
Table 3-46 : Summary of Operations – Kisumu
Operator 1 Marketing Word of mouth, flyers and door to door house visits Supervision Owns a motorcycle for occasional random truck
tracking, keeps a record based on the information provided by truck crew.
Challenge Vehicle odometers do not work Challenge Dumping site register is not maintained Operator 2 Supervision Word of mouth by driver but keeps a record and
uses information comparison from his 2 employees Challenge Vehicle odometers do not work Challenge Dumping site register is not maintained Operator 3 Marketing Word of mouth Supervision Does not have ability to “run around” Challenge Vehicle odometers do not work Challenge Dumping site register is not maintained
Table 3-47 : Challenges Faced by Mechanical Operators in Kisumu
# Operator 1 Operator 2 Operator 3
1 Licenses Maintenance costs Manual operators 2 Equipment failure Licenses Unfair competition 3 Cost of credit Equipment failure Lack of marketing 4 Maintenance costs
lack of operations control
5 Manual operators 6 Unfair competition

The Bill & Melinda Gates Foundation CHAPTER 3 : RESULTS AND ANALYSIS OF URBAN FSM PRACTICE Landscape Analysis and Business Model Assessment in Fecal Sludge Management: Extraction and Transportation Models in
Africa - Kenya
LOSAI MANAGEMENT LIMITED 3-63
Clients Receipting and Payments
With the exception of clients who contact the owner of a truck or who are known to the truck
owner, the truck crew has discretion in presenting sales information to the truck owner. There
are no receipts issued especially to domestic clients. Institutions demand for receipts, which are
issued. The daily sales as reported by the crew cannot be independently determined. The use of
mobile phone based payment service such as M-pesa has not been adopted by the mechanical
emptiers and hence the truck crew still handle a lot of cash based on day to day operations.
Credit services
Only one operator offers credit services, particularly to old customers. There is no extra fee
charged for this, though the credit extended is only for a portion of the total fee. Usually the
operator extends the credit for 30 days but requires the customer to raise an initial amount
sufficient to cover fuel expenses. The other 2 operators only provide services on a cash basis.
Payment systems
Two operators accept payment by way of cheques, especially from institutional clients and
payments by M-pesa from domestic clients. However, the truck crew do not encourage M-pesa
because they require part of the payment in order to fuel the truck, while M-pesa payments are
made directly to the owner. In majority of payments, the most used mode of payment is cash
on site after suction. Where multiple trips may occur, clients pay in advance or in arrears. The
truck crew does no encourage pre-payments since the truck may break down and this would
place them in bad light with the customer. The owner of the two trucks however would like to
encourage advance payment for multiple trips as one of the trucks can be on stand-by in such
cases to complete the process. However this would only work well in this particular instance if
the two trucks were not of different sizes.
Hire of third party trucks to service a client
None of the operators sub-contracts competitors’ trucks for use to service clients. Instead each
operator opts to stall the service demands by the client until the operator’s own truck is
available to offer the service. When this is not possible, the operator gives up the business
opportunity.

The Bill & Melinda Gates Foundation CHAPTER 3 : RESULTS AND ANALYSIS OF URBAN FSM PRACTICE Landscape Analysis and Business Model Assessment in Fecal Sludge Management: Extraction and Transportation Models in
Africa - Kenya
LOSAI MANAGEMENT LIMITED 3-64
Collaboration with Manual Empties
One operator collaborates with manual emptiers to identify and desludge septic tanks and pit
latrines. The truck operator in this situation transports and dumps the FS and this often occurs
when the client does not wish to bury the FS in the ground. The manual emptiers in this case
are used to liquefy the FS by the owner.

The Bill & Melinda Gates Foundation CHAPTER 3 : RESULTS AND ANALYSIS OF URBAN FSM PRACTICE Landscape Analysis and Business Model Assessment in Fecal Sludge Management: Extraction and Transportation Models in
Africa - Kenya
LOSAI MANAGEMENT LIMITED 3-65
Emptying Practices and Technologies: Mombasa City
The methods of fecal sludge emptying were determined from the HH survey.
Based on the HH survey, the estimates for method of FS emptying were obtained by analyzing
the responses to questions and inferring based on those estimates the actual number of HH
with reference to the national population.
The questions respondents were asked were;
Q17: What kind of facility
Q21: What kind of emptying services do you use?
The data collection instruments used in this regard are included as Appendix A and also in
Volume II of II of this report.
When Q17 and Q21 are transposed, they provide the breakdown of type of facility and method
of emptying which then when summed up gives the answers to method of FS emptying.
Similarly when Q21 is adjusted for sewered respondents, it provides the answer to the global
method of FS emptying.
The results (Table 3-48) indicate a small number of HH using mechanical operators (7%) than
manual (93%). Detailed analysis is incuded in this report as appendix B.
Therefore to derive the share of manual and mechanical for the whole population;
106,632/115,228 = 93% that is %tage of HH with on-site sanitation using manual emptying
8,596/115,228 = 7% that is %tage of HH with on-site sanitation using mechanical emptying

The Bill & Melinda Gates Foundation CHAPTER 3 : RESULTS AND ANALYSIS OF URBAN FSM PRACTICE Landscape Analysis and Business Model Assessment in Fecal Sludge Management: Extraction and Transportation Models in
Africa - Kenya
LOSAI MANAGEMENT LIMITED 3-66
Table 3-48 : Methods of Emptying Fecal Sludge in Mombasa
Number of the city HH with On-site sanitation 115,228 Number of the HH with on-site sanitation having pits in the city using Mec. Emp 4,356 Number of the HH with on-site sanitation having septic tanks in the city using Mec. Emp
1,936
Number of the HH with on-site sanitation having cesspool in the city using Mec. Emp
2,305
Total number of HH with on-site sanitation emptied mechanically 8,596 Number of the HH with on-site sanitation having pits in the city using Man. Emp 57,868 Number of the HH with on-site sanitation having septic tanks in the city using Man. Emp
22,262
Number of the HH with on-site sanitation having cesspool in the city using Man. Emp
26,502
Total number of HH with on-site sanitation emptied mechanically 106,632 Mechanical (%) Manual (%) Method of Emptying by HH with on site sanitation 7% 93% Share of Volume of FS emptied by method 10% 90% % of the HH with on-site sanitation having pits in the city emptied
7% 93%
% of the HH with on-site sanitation having septic tanks in the city emptied
8% 92%
% of the HH with on-site sanitation having cesspool in the city emptied
8% 92%
As the HH survey revealed, the manual emptying included: closing the pit when full and digging
another one, burying the pit, directing the sludge into existing drainage channels or directing
liquid sludge into farms, closing the pit when full and reusing it after some time when the
sludge has reduced. Further analysis of the responses of “other” indicated that respondents
would rather respond that the facility is not yet full instead of alluding to manual emptying.
Therefore, during amalysis, respondeds clustered under “other” were included in the manual
emptying category.
The operations of mechanical operators are insufficient to meet the existing demand of
emptying services, though neither is the effective demand sufficient to cause the operators to
operate at full capacity.

The Bill & Melinda Gates Foundation CHAPTER 3 : RESULTS AND ANALYSIS OF URBAN FSM PRACTICE Landscape Analysis and Business Model Assessment in Fecal Sludge Management: Extraction and Transportation Models in
Africa - Kenya
LOSAI MANAGEMENT LIMITED 3-67
There are fourteen (14) private mechanical FS services businesses in Mombasa who between
them operate ten (10) trucks. Table 3-49 provides data of these mechanical operators.
Table 3-49 : Data on Mechanical Operators in Mombasa
Mombasa # of private mechanical businesses in city 14 # of trucks run by private businesses 10 # of trucks owned by utilities 0 What are utility trucks used for (HH? Govt. institutions use, sewer cleaning? N.A # of private businesses that are small (1 truck) 3 # of pvt businesses that are medium (2-5 trucks) 2 # of pvt businesses that are large (>5 trucks) 0 What are the capacities of private trucks (m3) 10 m3 What are capacities of Utility trucks (m3) 0 Price for new truck ( 15 m3 capacity ) USD 48,913 Price for USED truck ( 9 m3 capacity) USD 20,000
Some of the operators run the FS emptying service as part of existing businesses. Most of the
trucks currently in use in Mombasa are old and fairly unreliable, experiencing frequent
breakdowns.
The trucks in use by most operators are old and delicate (Figure 3-10).
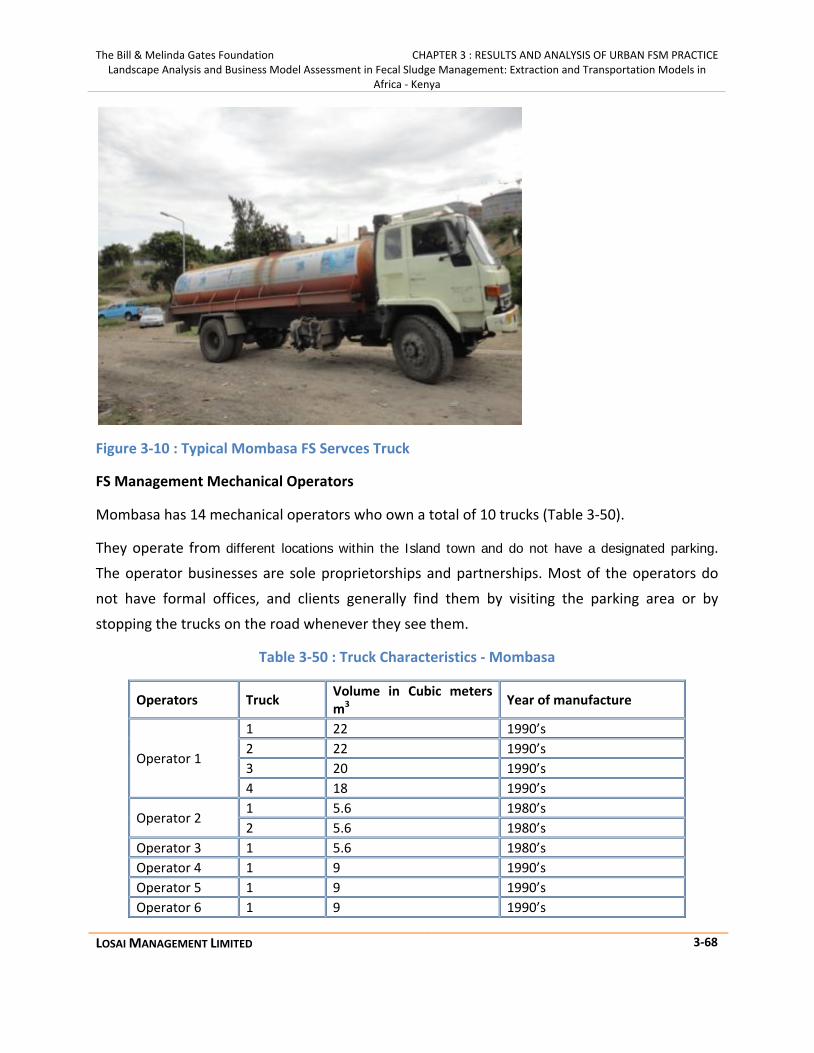
The Bill & Melinda Gates Foundation CHAPTER 3 : RESULTS AND ANALYSIS OF URBAN FSM PRACTICE Landscape Analysis and Business Model Assessment in Fecal Sludge Management: Extraction and Transportation Models in
Africa - Kenya
LOSAI MANAGEMENT LIMITED 3-68
Figure 3-10 : Typical Mombasa FS Servces Truck
FS Management Mechanical Operators
Mombasa has 14 mechanical operators who own a total of 10 trucks (Table 3-50).
They operate from different locations within the Island town and do not have a designated parking.
The operator businesses are sole proprietorships and partnerships. Most of the operators do
not have formal offices, and clients generally find them by visiting the parking area or by
stopping the trucks on the road whenever they see them.
Table 3-50 : Truck Characteristics - Mombasa
Operators Truck Volume in Cubic meters m3 Year of manufacture
Operator 1
1 22 1990’s 2 22 1990’s 3 20 1990’s 4 18 1990’s
Operator 2 1 5.6 1980’s 2 5.6 1980’s
Operator 3 1 5.6 1980’s Operator 4 1 9 1990’s Operator 5 1 9 1990’s Operator 6 1 9 1990’s

The Bill & Melinda Gates Foundation CHAPTER 3 : RESULTS AND ANALYSIS OF URBAN FSM PRACTICE Landscape Analysis and Business Model Assessment in Fecal Sludge Management: Extraction and Transportation Models in
Africa - Kenya
LOSAI MANAGEMENT LIMITED 3-69
Employees
In general a truck has two employees to it which includes a driverand a plumber cum turn boy.
Most of the operators pay their employees a daily casual wage while other operators have their
employees on full monthly wages. Two operators in Mombasa have diversified operations in
sanitation. They have in place fully fledged sales and marketing departments which are tasked
with seeking business opportunities. These departments are in both instances managed by
ladies.
Licensing
All operators are required to have 3 (three) licenses which include
1. Trading license obtained from the Municipal Authority but issued as a business license.
This is renewed annually.
2. Environmental license issued by the national environmental office located in Mombasa
and issued on a per truck basis. This is renewed annually.
3. Tipping permit and fee licensing issued by the utility firm. This permit is issued on a
dumping trip basis.
Table 3-51 : Commencement and Customers of Mechanical Operators - Mombasa
Operators No. of Trucks Year of Commencement
Number of Customers/year
1 4 1996 326 2 2 2000 258 3 1 2005 142 4 1 0 0 5 1 0 6 0 0 7 0 0 8 0 0 9 0 0 10 0 0 11 0 0 12 0 0 13 0 0 14 0 0

The Bill & Melinda Gates Foundation CHAPTER 3 : RESULTS AND ANALYSIS OF URBAN FSM PRACTICE Landscape Analysis and Business Model Assessment in Fecal Sludge Management: Extraction and Transportation Models in
Africa - Kenya
LOSAI MANAGEMENT LIMITED 3-70
Operations
The mechanical operators can be classified into different categories by number of trucks,
business type and type of technology used to de-sludge.
In general operators make an assessment of the required de-sludging and then quote a fee. The
fees are fixed per trip of the vehicle. As the vehicles sizes are different fees vary (Table 3-52 and
Table 3-53). However, fees range from USD 110 to USD 236 for 5.6 m3 to 22 m3 which is a range
of 50-93 USD per cubic meter. There are few instances where the rate varies because of
distance.
Table 3-52 : Per Trip Fees for FSM Services – Mombasa
Operator Trucks Tariff ($) 1 4 205 2 2 108 3 1 124
Table 3-53 : Per Trip Fees for Different Types of Trucks for FSM Services – Mombasa
Truck # Truck CC Make of Truck Tariff USD
Operator 1 1 22 Mack 205 2 22 Mack 205 3 20 Mack 205 4 28 Mack 205 Operator 2 1 5.6 Bedford 108 2 5.6 Bedford 108 Operator 3 1 5.6 Bedford 124 Operator 4 1 9 Isuzu 108 Operator 5 1 9 Isuzu 108 Operator 6 1 9 Isuzu 108
During the day the trucks operate from different locations as there is no designated central
location for this group of service providers. At night the service providers have secured parking
lots for their trucks but these are not exclusive. Some park by the road side, while others have
hired parking lots near office blocks.
The business practice is payment after service. The fee is usually agreed in advance. The client
pays the truck driver once the sludge has been loaded onto the truck. Some operators issue

The Bill & Melinda Gates Foundation CHAPTER 3 : RESULTS AND ANALYSIS OF URBAN FSM PRACTICE Landscape Analysis and Business Model Assessment in Fecal Sludge Management: Extraction and Transportation Models in
Africa - Kenya
LOSAI MANAGEMENT LIMITED 3-71
receipts while others do not. For commercial clients receipts are issued because the service is
taxable (vatable) and this tax can be claimed back.
The truck driver generally collects payments from the client. Though this is becoming less
common with the availability of mobile phone based payment system, in particular M-pesa
(Table 3-54) in Kenya. As a result most clients pay directly by phone-through M-pesa – to a
designated number which often is the telephone line of the principal. Commonly a single truck
has a crew of two people. Some of the operators have their employees on a fixed wage though
the majority engage their truck crew on a casual (daily wage) basis (Table 3-55).
Dumping permits are obtained from the Utility Company at a fee of USD 10.87 per trip. Upon
payment, the permit is issued. When dumping the sludge at the FSTP plant the truck is required
to register itself and surrender the permit and receipt of fee payment. Truck owners use the
dumping permits to reconcile the number of trips per day with number of customers served.
However, use of the mobile phone is extensive as a way of tracking the movement of the truck.
The levels of organization for the operators are varied. While some are sole proprietors or
partnerships with the owner operating the truck, others have an elaborate structure comprising
of an operations manager, accountant, drivers, plumbers and plumbing assistants.
With the exception of one firm -which has centralized its fueling operation, fueling of trucks is
undertaken by the truck crew and is based on collections from clients. However, for all firms,
the daily collections are remitted net of fuel amounts to begin operations the following day
which ranges from USD 5 to USD 10 per truck. In some instances, the truck crew ensures they
have received enough money in advance from their office to fund a long distance trip to a
customer.

The Bill & Melinda Gates Foundation CHAPTER 3 : RESULTS AND ANALYSIS OF URBAN FSM PRACTICE Landscape Analysis and Business Model Assessment in Fecal Sludge Management: Extraction and Transportation Models in
Africa - Kenya
LOSAI MANAGEMENT LIMITED 3-72
Table 3-55 : Mechanical Emptiers Truck Crew – Mombasa
Operator Number of employees
Type of Employment Organization of Employees (truck Crew)
1 8 Permanent/ Casual Driver/Turn boy
2 4 Permanent/ Casual Driver/Turn boy 3 2 Permanent/ Casual Driver/Turn boy
Trips and customers
In Mombasa each trip by a truck is always recorded at the dumping site. This is because of the
use of a dumping fee and receipting system by the FSTP operator is regularly reconciled by the
finance office of the Utility Company. However revenues per truck are difficult to track as there
are no customer receipts, therefore there are difficulties in determining the exact amounts paid
by customers.
A number of reasons may exist for lack of customer receipting in the industry. Foremost
receipts are only absolutely necessary for:
M-Pesa service (M for Mobile and Pesa for money in Swahili); is a mobile-based money transfer services pioneered by Safaricom a mobile telecommunication services provider in Kenya. The product concept is one that allows an M-Pesa customer to send money quickly, safely and across great distances through a mobile phone to another M-Pesa customer. M-Pesa was developed by mobile phone operator Vodafone and launched commercially by its Kenyan affiliate Safaricom in March 2007. To access the service, customers must first register at an authorized M-Pesa retail outlet. They are then assigned an individual electronic money account linked to their phone number and accessible through an application stored on the subscriber identification module (SIM) cards of their mobile phones. Functions The application has two main functions. First, it allows customers to deposit cash to and withdraw cash from their accounts by exchanging cash for electronic value at a network of retail stores to day there are more than 23,000 such outlets. (M-Pesa Agencies) Second, it allows users to transfer funds to others, to pay bills, and to purchase mobile airtime credit. Retail stores (M-Pesa Agents) are paid a fee by Safaricom each time they exchange cash for M-Pesa credit on behalf of customers. All M-Pesa transactions are authorized and recorded in real time using secure short messaging service (SMS) and are capped at $500. M-Pesa registration is free, as is making deposits into the system. Customers are charged flat fees of approximately$0.403 for person-to-person (P2P) transfers and bill payments, $0.33 for withdrawals (for transactions under $33) and $0.013 for balance inquiries. Individual customer accounts are maintained in a server that is owned and managed by Vodafone, but Safaricom deposits the full value of its customers’ balances in the system in pooled accounts in two regulated banks. Thus, while Safaricom issues and manages the M-PESA accounts, the value of the accounts is fully backed by highly liquid deposits at commercial banks. Rather than paying customers interest on the balance in their M-Pesa accounts, Safaricom sets aside a small percentage of account balances in a not-for-profit trust fund. The purpose of these funds has not yet been decided. M-Pesa’s function as a retail payment platform is important because it reaches a large number of people compared with other financial services outlets in Kenya.
Table 3-54 : M-PESA Service in Kenya

The Bill & Melinda Gates Foundation CHAPTER 3 : RESULTS AND ANALYSIS OF URBAN FSM PRACTICE Landscape Analysis and Business Model Assessment in Fecal Sludge Management: Extraction and Transportation Models in
Africa - Kenya
LOSAI MANAGEMENT LIMITED 3-73
1. Expense claims process-where the customer may have service paid for him by his
employer or landlord
2. Where the customer maintains book keeping records such as a corporate client-
hotel, factory etc.
3. Where the customer makes a VAT return and therefore the service VAT incurred is
INPUT TAX and is useful for offsetting purposes
Dumping site
There is one official dumping site for FS, which is Kipevu Wastewater Treatment Works in West
Mainland (Figure 3-11). The WWTP is under rehabilitation. Generally there are no reported
cases of sludge dumping in unauthorized areas. The dump site is well secured by a fence and a
single entry gate. The site is manned by security guards on a 24 hour basis. Dumping takes place
between Monday to Saturday and the gates are closed at 1800 hrs. At the dumping site, the
trucks discharge to a man-hole which is connected by sewer line to the WWTP. The facility is
tidy and well maintained, without odors, and a record is maintained of every truck dumping
visit. No dumping is permitted by a truck without a valid dumping permit and payment of fee.
However during the rehabilitation, some dumping has occurred in the general area of the
dumping site especially by drum truck operators who use the combined technology.

The Bill & Melinda Gates Foundation CHAPTER 3 : RESULTS AND ANALYSIS OF URBAN FSM PRACTICE Landscape Analysis and Business Model Assessment in Fecal Sludge Management: Extraction and Transportation Models in
Africa - Kenya
LOSAI MANAGEMENT LIMITED 3-74
TL-Top Right, TR-Top Right, BL-Bottom Left
The dumping site and the WWTP are managed by the water and sewerage utility (MOWASCO).
The WWTP has a designed capacity of 17,100 cubic meters but currently operates well below
10%.
Trucks
There are 10 trucks operating in Mombasa while there are 14 registered operators. The
business is controlled by 6 operators who account for 99% of the business and own the 10
trucks. There are 8 operators who do not have any trucks but hire periodically from the
mainstream operators. Of the registered trucks 3 use a unique combination of technologies
where 200 litre drums are placed at the back of the truck and a water pump or manual
emptiers are used to fill these drums. These 3 trucks two which belong to one operator and one
for another operator have difficulties emptying sludge at the manhole provided for dumping at
Figure 3-11 : Kipevu WWTP (TL), Access (TR), disposal point (BL), Truck emptying

The Bill & Melinda Gates Foundation CHAPTER 3 : RESULTS AND ANALYSIS OF URBAN FSM PRACTICE Landscape Analysis and Business Model Assessment in Fecal Sludge Management: Extraction and Transportation Models in
Africa - Kenya
LOSAI MANAGEMENT LIMITED 3-75
FSTP. Part of the rehabilitation includes designing a receiving bay to act as a dump location for
these trucks.
The trucks in Figure 3-12 have a capacity of 22,000 litres and are oil cooled as opposed to water
cooled. This system is much more fuel efficient and delivers almost 5km per litre.
The capacity of trucks in Mombasa varies from 9000 litres to 22,000 litres. The drum
combination trucks have a lower capacity of 5600 litres and 7200 litres. However, all trucks
charge on a per trip basis. The longest distance for discharge is 20 km comprising of from client
to dumpsite to parking bay, while the shortest distance is 6 km. Most trips have a total distance
of 7 km.
Number of Trips per Day
There are least 3 trips to the dumping site every day between Monday and Saturday. Two of
the 6 operators report at least 1 trip per day every day on a 22 working day cycle while another
2 report a trip every two days. One operator reports at least a trip every week. The 8 operators
without trucks often sub contract those with trucks for their services. There are reports of
manual emptying taking place and illegal dumping and connection of septic tanks to the storm
drain. Two of the operators – those using the drum trucks-work closely with manual emptiers.
Manual emptiers reported that only 50% of their emptying is transported by truck. The total
dumping trips by drum trucks in a year is estimated at 180. This means that every 2 days there
is manual emptying taking place with the FS being either dumped into the storm drain or being
buried into the ground.
Figure 3-12 : Fuel Efficient Trucks in Mombasa

The Bill & Melinda Gates Foundation CHAPTER 3 : RESULTS AND ANALYSIS OF URBAN FSM PRACTICE Landscape Analysis and Business Model Assessment in Fecal Sludge Management: Extraction and Transportation Models in
Africa - Kenya
LOSAI MANAGEMENT LIMITED 3-76
Fuel Consumption and Expenditure
In Mombasa, the average distance of a single trip-from park to client to dump site and back to
park-is 12 km. Based on the vehicle models there are significant variations in fuel expenditure.
Local assembly trucks are in use by all Mombasa operators except for one operator who uses
exclusively imported trucks. The local assembly trucks have an integrated pump system, while
the reconditioned second hand trucks have nonintegrated pump system. On the imported
truck, the average distance per litre is 4.5 kilometers. The pump technologies in use by on
imported trucks requires about 30 minutes to fill 20,000 litres. The suction process consumes
between 1 and 1.5 litres of fuel. This is the pump system of the imported vehicle. It operates
with its own generator.
Therefore the cost of servicing a short distance client of 12km is 5 litres and a long distance
client is between 8 and 9 litres. Thus the fuel cost of a single trip is between USD 5.9 to USD 9.4.
These imported trucks whose capacity ranges from 18000 to 22000 litres use oil based cooling
system and have separate pump engines. One of these engines can run for 8 hours on 4 litres.
This pump system shown in Figure 3-13 is more fuel efficient and operationally safe.
Where the system runs on the engine of the vehicle, during operations the driver has to “rev”
the vehicle to drive the pump system. In this system, the pump is connected to the engine via a
pulley system- fan belt at RHS of pump (Figure 3-14). This is driven by a central shaft, which the
driver moves by pressing the pedal while the vehicle is not in gear. The vehicle is reconfigured
to switch to this mode during pump operation. This is the more common pump installation
Figure 3-13 : Fuel Efficient Pump System of an Imported Vehicle - Mombasa

The Bill & Melinda Gates Foundation CHAPTER 3 : RESULTS AND ANALYSIS OF URBAN FSM PRACTICE Landscape Analysis and Business Model Assessment in Fecal Sludge Management: Extraction and Transportation Models in
Africa - Kenya
LOSAI MANAGEMENT LIMITED 3-77
technique for mechanical operators. The pump here was found to be the most common in use
by truck owners.
The local assembly trucks in use by other operators in Mombasa perform an average distance
of 4 kilometer per litre. These trucks range from 9,000 litres to 11,000 litres in capacity. The
drum trucks have smaller capacity. The pump technologies in use by local assembly trucks
require about 30 minutes to fill 8000 litres. The suction process consumes between 2.5 and 3
litres of fuel. Therefore the cost of servicing a short distance client of 12 km is 5 litres and a long
distance client is between 8 and 9 litres.
However, the larger capacity trucks charge between USD 160 and USD 220 per trip while the
smaller trucks charge between USD 80 and USD 120 per trip.
Operations Audit and Supervision
The dumping permit system at the FSTP provides an audit mechanism for the truck owners to
monitor the number of trips per truck per day. In the absence of this, it would be difficult to
confirm actual trips as most trucks have defective odometers. The 6 dominant operators in
Mombasa have organizational structures that allow them to conduct random inspections on the
movement of the trucks. The approach is to call the truck driver and request for his location,
then hire out a small taxi-tuk tuk- to the location to confirm. Given the inexpensive fares
Figure 3-14 : Pump System coupled to Shaft of Truck - Mombasa

The Bill & Melinda Gates Foundation CHAPTER 3 : RESULTS AND ANALYSIS OF URBAN FSM PRACTICE Landscape Analysis and Business Model Assessment in Fecal Sludge Management: Extraction and Transportation Models in
Africa - Kenya
LOSAI MANAGEMENT LIMITED 3-78
charged by these tuk-tuks management personnel in these firms are able carry out regular
checks on the movement of trucks. In other instances the operator management personnel
locate themselves along a route and place a call to the truck crew when they are passing by and
seek confirmation of their location. This takes places on a regular basis in the course of the day.
Challenges Faced by Mechanical Operators in Mombasa
Some of the challenges highlighted include:
• Difficulties in extracting latrines due to disposal of solid waste into the latrines
• Low customer awareness
• Extortion , penalties , expensive, permits, bribes by the local authorities
• High maintenance cost
• High fuel prices
• Limited sources of capital
Table 3-56 summarizes some of the operations and operator challenges highlighted by some of
the operators interviewed.
Table 3-56 : Summary of Operations and Operator Challenges – Mombasa
Operator1
Marketing Has an active operations and marketing manager, word of mouth and established reputation
Supervision Operations manager actively supervises the truck and most transactions are formally recorded
Challenge Unfair practices
Challenge Manual emptying still undertaken with complicity of the officials
Operator2
Marketing Collaborates with many manual emptiers and pays a commission for finding the work
Supervision Owner also acts as a truck driver, and negotiates all contracts directly
Challenge Harassment by city council officials Challenge Dumping site is not well suited for the drum truck technology
Operator 3
Marketing Uses related business in outdoor activities to advertise, there is a marketing manager
Supervision Rotational drivers and truck crew Challenge municipal should stop discharge to storm drains Challenge Manual emptiers are very active, fuel costs are high

The Bill & Melinda Gates Foundation CHAPTER 3 : RESULTS AND ANALYSIS OF URBAN FSM PRACTICE Landscape Analysis and Business Model Assessment in Fecal Sludge Management: Extraction and Transportation Models in
Africa - Kenya
LOSAI MANAGEMENT LIMITED 3-79
Marketing
Marketing activities include on truck telephone listing, on truck posters and wall posters in
offices (Figure 3-15).
Clients Receipting and Payments
Domestic clients generally do not require receipts and thus revenue accounting is mostly
dependent on the truck crew. Commercial clients on the other hand-restaurants, land lords and
factories do require receipts for these sanitation services. Most commercial clients prefer to
make cheque payments as opposed to cash. Domestic clients on the other hand pay in cash.
Credit services
All operators do offer credit services, but this is often to the commercial clients. Domestic
clients only known to the business proprietor receive credit while all others pay upon service
delivery. The operators’ primary reason for extending credit is to retain the business
relationship as opposed to giving price discounts.
Payment systems
Three payment systems are observed in the industry, cash, mobile phone based systems and
cheques. Domestic clients tend to pay in cash or by mobile phone system. Commercial
operators pay either in cash or by cheque but predominantly by cheque.
Figure 3-15 : Marketing FSM Services - Mombasa

The Bill & Melinda Gates Foundation CHAPTER 3 : RESULTS AND ANALYSIS OF URBAN FSM PRACTICE Landscape Analysis and Business Model Assessment in Fecal Sludge Management: Extraction and Transportation Models in
Africa - Kenya
LOSAI MANAGEMENT LIMITED 3-80
Hire of third party trucks to service a client
Hire of third party trucks to service a client occurs at two levels. In the first instance those
operators who do not own any trucks but are able to secure “exhausting contracts” from
households and commercial entities. Under such circumstances the renting contractor
negotiates varied pricing. In the second instance, some operators when overwhelmed by orders
prefer to hire the trucks of their industry colleagues in order to serve the clients. In this second
instance the pricing system is commission based.
Collaboration with Manual Empties
The 2 Drum truck operators who own 3 trucks were noted to have strong collaboration with
manual emptiers (Figure 3-16). This is because the drum-trucks are more affordable and mostly
in use where conventional trucks may not be able to access.
Figure 3-16 : Drum Truck Operators and Mannual Emptiers

The Bill & Melinda Gates Foundation CHAPTER 3 : RESULTS AND ANALYSIS OF URBAN FSM PRACTICE Landscape Analysis and Business Model Assessment in Fecal Sludge Management: Extraction and Transportation Models in
Africa - Kenya
LOSAI MANAGEMENT LIMITED 3-81
FSM Emptying Practices and Technologies: Nairobi City
The methods of fecal sludge emptying were determined from the HH survey.
Based on the HH survey, the estimates for method of FS emptying were obtained by analyzing
the responses to questions and inferring based on those estimates the actual number of HH
with reference to the national population.
The questions respondents were asked were;
Q17: What kind of facility?
Q21: What kind of emptying services do you use?
The data collection instruments used in this regard are included as Appendix A and also in
Volume II of II of this report.
When Q17 and Q21 are transposed, they provide the breakdown of type of facility and method
of emptying which then when summed up gives the answers to method of FS emptying.
Similarly when Q21 is adjusted for sewered respondents, it provides the answer to the global
method of FS emptying.
The results (Table 3-57) indicate 52% of of the HH’s use mechanical operators while 48% use
manual methods of empting. Detailed analysis is included in this report as Apendix B.
Table 3-57 : Methods of Emptying Fecal Sludge in Nairobi
Number of the city HH with On-site sanitation 502,839 Number of the HH with on-site sanitation having pits in the city using Mec. Emp 126,112 Number of the HH with on-site sanitation having septic tanks in the city using Mec. Emp
46,412
Number of the HH with on-site sanitation having cesspool in the city using Mec. Emp
88,701
Total number of HH with on-site sanitation emptied mechanically 261,225 Number of the HH with on-site sanitation having pits in the city using Man. Emp 205,762 Number of the HH with on-site sanitation having septic tanks in the city using Man. Emp 18,957 Number of the HH with on-site sanitation having cesspool in the city using Man. Emp 16,895 Total number of HH with on-site sanitation emptied mechanically 241,614 Mechanical (%) Manual (%) Method of Emptying by HH with on site sanitation 52% 48% Share of Volume of FS emptied by method 32% 68%
The Bill & Melinda Gates Foundation CHAPTER 3 : RESULTS AND ANALYSIS OF URBAN FSM PRACTICE Landscape Analysis and Business Model Assessment in Fecal Sludge Management: Extraction and Transportation Models in
Africa - Kenya
LOSAI MANAGEMENT LIMITED 3-82
% of the HH with on-site sanitation having pits in the city emptied
38% 62%
% of the HH with on-site sanitation having septic tanks in the city emptied
71% 29%
% of the HH with on-site sanitation having cesspool in the city emptied
84% 16%
Therefore to derive the share of manual and mechanical for the whole population;
241,614/502,839 = 48% that is %tage of HH with on-site sanitation using manual emptying
261,225/502,839 = 52% that is % tage of HH with on-site sanitation using mechanical emptying
As the HH survey revealed, the manual emptying included: closing the pit when full and digging
another one, burying the pit, directing the sludge into existing drainage channels or directing
liquid sludge into farms, closing the pit when full and reusing it after some time when the
sludge has reduced.
The operations of mechanical operators are insufficient to meet the existing demand of
emptying services, though neither is the effective demand sufficient to cause the operators to
operate at full capacity.
There are 26 private mechanical FS services businesses in Nairobi who between them operate
sixty trucks. Table 3-58 provides data of these mechanical operators.
Table 3-58 : Data on Mechanical Operators in Nairobi
Nairobi # of private mechanical businesses in city 26 # of trucks run by private businesses 60 # of trucks owned by utilities 4 What are utility trucks used for (HH? Govt. institutions use, sewer cleaning? Not in Use # of private businesses that are small (1 truck) 8 # of pvt businesses that are medium (2-5 trucks) 18 # of pvt businesses that are large (>5 trucks) 0 What are the capacities of private trucks (m3) 10 What are capacities of Utility trucks (m3) 10 Price for new truck ( 10 m3 capacity ) USD 48,000 Price for USED truck ( 10 m3 capacity) USD 20,000
Some operators run the FS emptying service as part of existing businesses. The trucks currently
in use in Nairobi are old and fairly unreliable, experiencing frequent breakdowns.
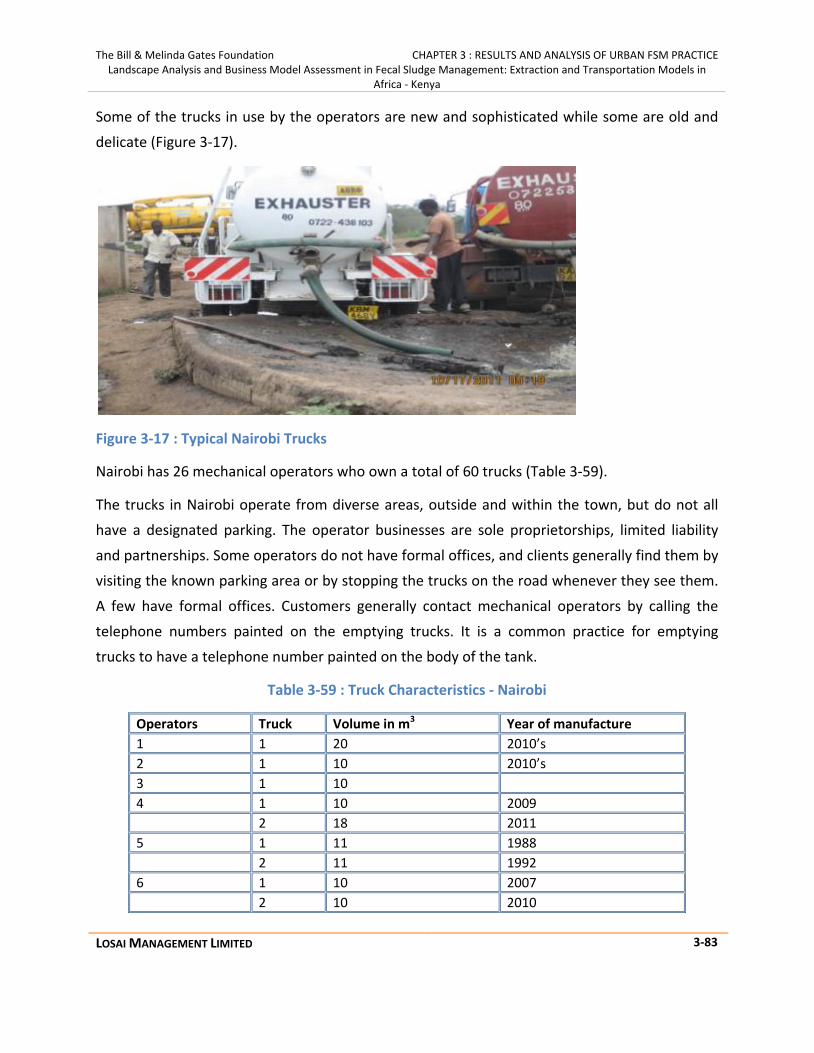
The Bill & Melinda Gates Foundation CHAPTER 3 : RESULTS AND ANALYSIS OF URBAN FSM PRACTICE Landscape Analysis and Business Model Assessment in Fecal Sludge Management: Extraction and Transportation Models in
Africa - Kenya
LOSAI MANAGEMENT LIMITED 3-83
Some of the trucks in use by the operators are new and sophisticated while some are old and
delicate (Figure 3-17).
Figure 3-17 : Typical Nairobi Trucks
Nairobi has 26 mechanical operators who own a total of 60 trucks (Table 3-59).
The trucks in Nairobi operate from diverse areas, outside and within the town, but do not all
have a designated parking. The operator businesses are sole proprietorships, limited liability
and partnerships. Some operators do not have formal offices, and clients generally find them by
visiting the known parking area or by stopping the trucks on the road whenever they see them.
A few have formal offices. Customers generally contact mechanical operators by calling the
telephone numbers painted on the emptying trucks. It is a common practice for emptying
trucks to have a telephone number painted on the body of the tank.
Table 3-59 : Truck Characteristics - Nairobi
Operators Truck Volume in m3 Year of manufacture 1 1 20 2010’s 2 1 10 2010’s 3 1 10 4 1 10 2009 2 18 2011 5 1 11 1988 2 11 1992 6 1 10 2007 2 10 2010

The Bill & Melinda Gates Foundation CHAPTER 3 : RESULTS AND ANALYSIS OF URBAN FSM PRACTICE Landscape Analysis and Business Model Assessment in Fecal Sludge Management: Extraction and Transportation Models in
Africa - Kenya
LOSAI MANAGEMENT LIMITED 3-84
7 1 10 2005 2 12 2009 8 1 10 2005 9 2 10 2002 10 1 10 2006 2 10 2006 3 20 2007 4 20 2008 11 1 15 2009 2 15 1989 3 15 2002 4 10 1994
Employees
In general each truck has two employees who include a driver and a plumber cum turn boy.
Most of the operators pay their employees a daily casual wage while the other operators have
their employees on full monthly wages. Six operators in Nairobi have diversified operations in
sanitation. They have in place fully fledged sales and marketing departments which are tasked
with seeking business opportunities.
Licensing
All operators (Table 3-60) are required to have 4 (four) licenses which include:
1. Trading license obtained from the City Council Authority but issued as a business license.
This is renewed annually.
2. Environmental license issued by the national environmental office located in Nairobi
and issued on a per truck basis. This is renewed annually.
3. Exhausting license issued by the utility company and issued on a truck basis
4. Tipping permit issued by the utility firm. This permit is issued on a dumping trip basis.
Table 3-60 : Commencement and Customers of Mechanical Operators - Nairobi
Operators No. of Trucks Year of Commencement Number of Customers/year
1 1 2010 347
2 1 2010 347
3 1 2009 347
4 2 2009 480

The Bill & Melinda Gates Foundation CHAPTER 3 : RESULTS AND ANALYSIS OF URBAN FSM PRACTICE Landscape Analysis and Business Model Assessment in Fecal Sludge Management: Extraction and Transportation Models in
Africa - Kenya
LOSAI MANAGEMENT LIMITED 3-85
Operations
The mechanical operators can be classified into different categories by number of trucks,
business type and type of technology used to de-sludge.
In general operators make an assessment of the required de-sludging and then quote a fee. The
fees are fixed per trip of the vehicle. As the vehicles sizes are different fees vary (Table 3-61).
However, fees range from USD 70 to USD 108 for 10 m3 to 18 m3 which is a range of 6-7 USD
per cubic meter. The fees charged also tend to vary with distance; there are few instances
where the rate varies because of distance.
Table 3-61 : Per Trip Fees for FSM Services – Nairobi
Tariff in USD
One Truck Operator
Operator I Operator II Operator III
Long Distance 100 80 100 Short Distance 70 50 35 Average Tariff 91 71 81 Two Trucks Operators
Operator I Operator II Operators III Operator IV Operator V Operator VI
Long Distance 80 100 120 100 95 90 Short Distance 45 30 80 40 70 40 Average Tariff 70 79 108 82 88 75
Four Trucks Operators
Operator I Operator II
Long Distance 100 80
Short Distance 30 70
Average Tariff 79 77
5 2 2000 504
6 2 2007 624
7 2 2005 696
8 2 2009 528
9 2 2005 528
10 4 2000 1632
11 4 2002 1056

The Bill & Melinda Gates Foundation CHAPTER 3 : RESULTS AND ANALYSIS OF URBAN FSM PRACTICE Landscape Analysis and Business Model Assessment in Fecal Sludge Management: Extraction and Transportation Models in
Africa - Kenya
LOSAI MANAGEMENT LIMITED 3-86
During the day the trucks operate from different locations as there is no designated central
location for this group of service providers. At night the service providers have secured parking
lots for their trucks but these are not exclusive. Some park by the road side, while others park
at the nearest gas station.
Table 3-62 : Per Trip Fees for Different Types of Trucks for FSM Services – Nairobi
Operator Truck # Truck CC Make of Truck Max fee USD Min fee Usd
1 1 20 Mercedes 100 70 2 1 10 Isuzu 80 50 3 1 10 Isuzu 100 35 4 1 10 Isuzu 100 40 2 18 Mercedes 100 40 5 1 11 Isuzu 95 70 2 11 Isuzu 95 70 6 1 10 Isuzu 80 45 2 10 Isuzu 80 45 7 1 10 Tata 90 40 2 12 Mercedes 90 40 8 1 10 Nissan 100 30 2 10 Ford 100 30 9 1 10 Isuzu 120 80 2 10 Isuzu 120 80 10 1 10 Mercedes 100 30 2 10 Renault 100 30 3 20 Mercedes 100 30 4 20 Mercedes 100 30 11 1 15 Isuzu 80 70 2 15 Isuzu 80 70 3 15 Nissan 80 70 4 10 Nissan 80 70
The business practice is payment after service. The fee is usually agreed in advance. The client
pays the truck driver once the sludge has been loaded into the truck. Some operators issue
receipts while others do not. For commercial clients receipts are issued because the service is
taxable (vatable) and this tax can be claimed back.
The truck driver generally collects payments from the client. Though this is becoming less
common with the availability of mobile phone based payment system, in particular M-pesa in

The Bill & Melinda Gates Foundation CHAPTER 3 : RESULTS AND ANALYSIS OF URBAN FSM PRACTICE Landscape Analysis and Business Model Assessment in Fecal Sludge Management: Extraction and Transportation Models in
Africa - Kenya
LOSAI MANAGEMENT LIMITED 3-87
Kenya. As a result most clients pay directly by phone-through M-pesa – to a designated number
which often is the telephone line of the principal. Commonly a single truck has a crew of two
people. Some of the operators have their employees on a fixed wage though the majority
engages their truck crew on a casual (per trip/ daily) basis.
Operators pay a sum of USD 2.00 as the tipping fee per trip to the Utility Company. When
dumping the sludge at the FSTP plant the truck is required to register itself and surrender the
permit and dumping fee receipt of payment. Truck owners use the dumping permits to
reconcile the number of trips per day with number of customers served. However, use of the
mobile phone is extensive as a way of tracking the movement of the truck. Records kept at the
dumping site cannot be validated.
The levels of organization for the operators are varied. While some are sole proprietors or
partnerships with the owner operating the truck, others have an elaborate structure comprising
of an operations manager, accountant, drivers, and plumbing assistants.
In most instances fueling of trucks is undertaken by the truck crew (Table 3-63) and is based on
collections from clients. However, for all firms, the daily collections are remitted net of fuel
amounts to begin operations the following day which ranges from USD 25 to USD 30 per truck
for the first trip of the day. In some instances, the truck crew ensures they have received
enough money in advance from their office to fund a long distance trip to a customer.
Table 3-63 : Mechanical Emptiers Truck Crew – Nairobi
Operator Number of employees
Type of Employment Organization of Employees (truck Crew)
1 2 Permanent Driver/Turn boy 2 2 Permanent/ Casual Driver/Turn boy 3 2 Casual Driver/Turn boy 4 4 Casual Driver/Turn boy 5 4 Casual Driver/Turn boy
6 4 Casual Driver/Turn boy 7 4 Casual Driver/Turn boy 8 4 Casual Driver/Turn boy 9 4 Permanent Driver/Turn boy 10 8 Casual Driver/Turn boy 11 8 Casual Driver/Turn boy

The Bill & Melinda Gates Foundation CHAPTER 3 : RESULTS AND ANALYSIS OF URBAN FSM PRACTICE Landscape Analysis and Business Model Assessment in Fecal Sludge Management: Extraction and Transportation Models in
Africa - Kenya
LOSAI MANAGEMENT LIMITED 3-88
Trips and customers
The number of trips per day reported to the truck owner cannot be confirmed to always tally
with the actual trips made by the crew to the dumping site. This is despite the use of a dumping
fee and receipting system by the FSTP operator. Revenues per truck are also difficult to track.
As there are no customer receipts there are therefore difficulties in knowing the exact trips by a
truck and amounts paid by customers.
A number of reasons may exist for lack of customer receipting in the industry. Foremost
receipts are only absolutely necessary for
1. Expense claims process-where the customer may have service paid for him by his
employer or landlord.
2. Where the customer maintains book keeping records such as a corporate client-hotel,
factory etc.
3. Where the customer makes a VAT return and therefore the service VAT incurred is
INPUT TAX and is useful for offsetting purposes
Tipping point
In Nairobi, all trucks tip at Njiru tipping point. Figure 3-18 shows a typical tipping scenario at the
Njiru Tipping point and one of the largest trucks (green truck) which has a capacity of 18,000
litres. The maximum number of trucks that can tip at a given time is four. Most trucks have a
capacity of between 10,000 – 15,000 litres.
Figure 3-18 : Njiru Tipping Point in Nairobi

The Bill & Melinda Gates Foundation CHAPTER 3 : RESULTS AND ANALYSIS OF URBAN FSM PRACTICE Landscape Analysis and Business Model Assessment in Fecal Sludge Management: Extraction and Transportation Models in
Africa - Kenya
LOSAI MANAGEMENT LIMITED 3-89
Trucks
Some of these trucks are sophisticated in nature and very effective. The truck on the left of
Figure 3-19 is a locally fabricated unit (tank) built on a new chassis.
Figure 3-19 : Some of the Trucks Operating in Nairobi.
The capacity of trucks varies from 10,000 litres to 20,000 litres. However, all trucks charge on a
per trip basis. The longest distance for discharge is 50 km comprising of from client to
dumpsite, while the shortest distance is 4 km. Most trips have an average distance of 27 km.
Number of Trips per Day
On average for a single truck operator there are least 4 trips every three days, which translates
to 8 trips for a week of six days. There are reports of manual emptying taking place and illegal
dumping and connection of septic tanks to the storm drain. In the low income areas manual
emptying is very common. It certain parts of the City, connections to the storm drain of on-site
sanitation facilities in particular septic tanks and cess pools was very prevalent.
Fuel Consumption and Expenditure
In Nairobi, the average distance of a single trip-from park to client to dump site and back to
park-is 27 km. Based on the vehicle models there are significant variations in fuel expenditure.
The local assembly trucks have an integrated pump system while the reconditioned second
hand trucks have nonintegrated pump system. On the imported truck, the average distance per
litre is 4.5 kilometers. The pump technologies in use by this type of trucks require about 30
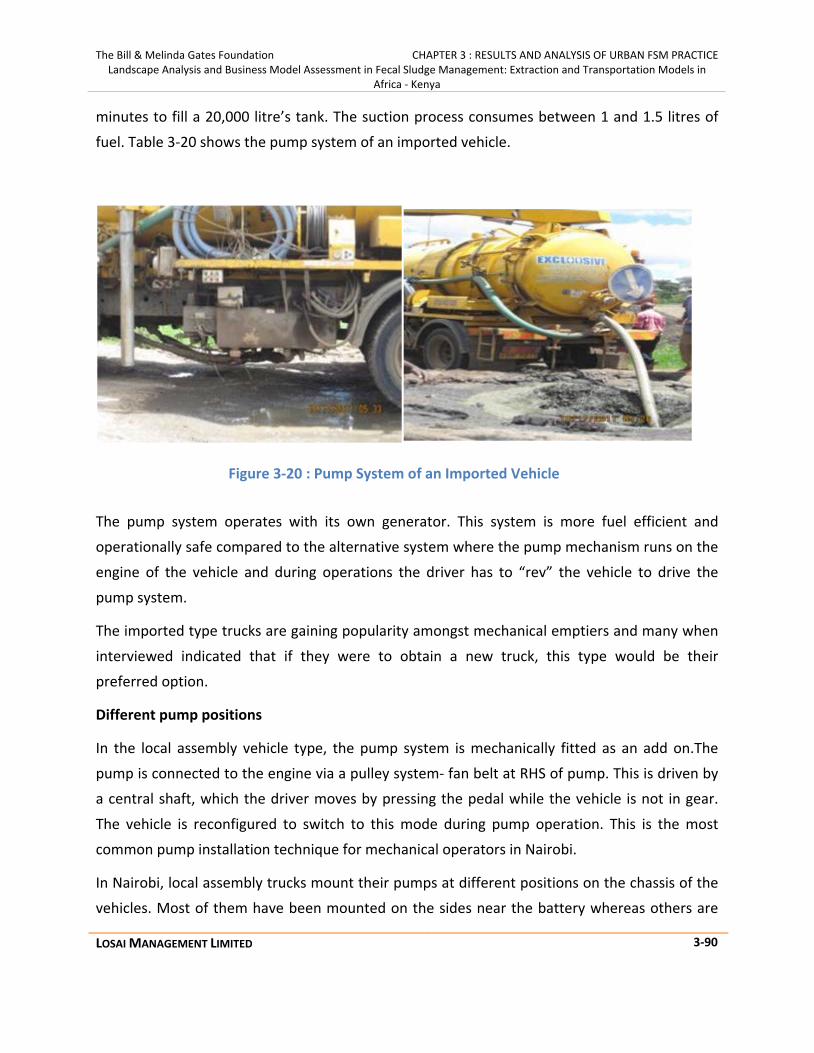
The Bill & Melinda Gates Foundation CHAPTER 3 : RESULTS AND ANALYSIS OF URBAN FSM PRACTICE Landscape Analysis and Business Model Assessment in Fecal Sludge Management: Extraction and Transportation Models in
Africa - Kenya
LOSAI MANAGEMENT LIMITED 3-90
minutes to fill a 20,000 litre’s tank. The suction process consumes between 1 and 1.5 litres of
fuel. Table 3-20 shows the pump system of an imported vehicle.
The pump system operates with its own generator. This system is more fuel efficient and
operationally safe compared to the alternative system where the pump mechanism runs on the
engine of the vehicle and during operations the driver has to “rev” the vehicle to drive the
pump system.
The imported type trucks are gaining popularity amongst mechanical emptiers and many when
interviewed indicated that if they were to obtain a new truck, this type would be their
preferred option.
Different pump positions
In the local assembly vehicle type, the pump system is mechanically fitted as an add on.The
pump is connected to the engine via a pulley system- fan belt at RHS of pump. This is driven by
a central shaft, which the driver moves by pressing the pedal while the vehicle is not in gear.
The vehicle is reconfigured to switch to this mode during pump operation. This is the most
common pump installation technique for mechanical operators in Nairobi.
In Nairobi, local assembly trucks mount their pumps at different positions on the chassis of the
vehicles. Most of them have been mounted on the sides near the battery whereas others are
Figure 3-20 : Pump System of an Imported Vehicle

The Bill & Melinda Gates Foundation CHAPTER 3 : RESULTS AND ANALYSIS OF URBAN FSM PRACTICE Landscape Analysis and Business Model Assessment in Fecal Sludge Management: Extraction and Transportation Models in
Africa - Kenya
LOSAI MANAGEMENT LIMITED 3-91
on top, below and even behind (Figure 3-21). These types of trucks were reported by owners to
consume far much more fuel than the imported type both per kilometre basis for
transportation as well as on the pumping process. For instance it was reported that the local
truck pump technologies require about 30 minutes filling 8,000 litres. The suction process
consumes between 2.5 and 3 litres of fuel and the average distance per litre is 3.5km to 4 km.
Operations Audit and Supervision
The dumping permit system at the FSTP provides an audit mechanism for the truck owners to
monitor the number of trips per truck per day. In the absence of this, it would be difficult to
confirm actual trips as trucks tend to have defective odometers. The dominant operators in
Nairobi have organizational structures that allow them to conduct random inspections on the
movement of the trucks. The approach is to call the truck driver and request for the trucks
location, then ride on a public transport vehicle locally known as- Matatu-to the location to
confirm. Given the inexpensive fares charged by these –Matatus-management personnel in
these firms are able carry out regular checks on the movement of trucks. In other instances the
operator management personnel locate themselves along a route and place a call to the truck
crew when they are passing by and seek confirmation of their location. This takes places on a
regular basis in the course of the day.
Marketing
Figure 3-21 : Different Pump Positions for Locally Assembled Trucks

The Bill & Melinda Gates Foundation CHAPTER 3 : RESULTS AND ANALYSIS OF URBAN FSM PRACTICE Landscape Analysis and Business Model Assessment in Fecal Sludge Management: Extraction and Transportation Models in
Africa - Kenya
LOSAI MANAGEMENT LIMITED 3-92
Most operators in Nairobi market through listing the telephone number of the office on the
body of the truck (Figure 3-22).
Challenges Faced by Mechanical Operators in Nairobi
Some of the challenges faced include:
• Long distance to discharge point
• Difficult to extract latrines due to disposal of solid waste into the latrines
• Low customer awareness
• Extortion , penalties , expensive, permits, bribes by the local authorities
• High maintenance cost
• High fuel prices
• Poor roads infrastructure
• Limited sources of capital
Table 3-64 summarizes a number of the challenges highlighted by some of the operators
interviewed.
Figure 3-22 : Using Trucks to Market FSM Services

The Bill & Melinda Gates Foundation CHAPTER 3 : RESULTS AND ANALYSIS OF URBAN FSM PRACTICE Landscape Analysis and Business Model Assessment in Fecal Sludge Management: Extraction and Transportation Models in
Africa - Kenya
LOSAI MANAGEMENT LIMITED 3-93
Table 3-64 : Summary of Operations and Operator Challenges – Nairobi
Operator 1
Marketing Has been in business for long and has an active list of clients many of whom own multiple flat complexes
Supervision Employs close relative to work on each truck as driver Challenge Unfair practices by other ME Challenge illegal connections to storm drains
Operator 2
Marketing Has an active list of clients, but uses word of mouth in most cases
Supervision Owner is actively engaged in monitoring of truck movement Challenge Harassment by police officers
Challenge Dumping site is too far and police officers along the route have to be paid
Operator 3
Marketing Word of mouth, , posters on truck and an active marketing function by the branch manager
Supervision All client activities are centralized at the office, and operations manager monitors truck movements through work-ticket process.
Challenge Dumping Permit processing can be made better
Challenge
Manual emptiers are very active, fuel costs are high finance is expensive dumping site is too far in some instances illegal connections to storm drains
Clients Receipting and Payments
Domestic clients generally do not require receipts and thus revenue accounting is mostly
dependent on the truck crew. Commercial clients on the other hand-restaurants, land lords and
factories do require receipts for these sanitation services. Most commercial clients prefer to
make cheque payments as opposed to cash. Domestic clients on the other hand pay in cash but
more predominantly now by M-pesa.
Credit services
All operators offer credit services, but this is often to the commercial clients. Domestic clients
only known to the business proprietor receive credit while all others pay upon service delivery.
The operators’ primary reason for extending credit is to retain the business relationship as
opposed to lowering the price.

The Bill & Melinda Gates Foundation CHAPTER 3 : RESULTS AND ANALYSIS OF URBAN FSM PRACTICE Landscape Analysis and Business Model Assessment in Fecal Sludge Management: Extraction and Transportation Models in
Africa - Kenya
LOSAI MANAGEMENT LIMITED 3-94
Payment systems
Three payment systems are observed in the industry, cash, mobile phone based systems and
cheques. Domestic clients tend to pay in cash but more predominantly by mobile phone
payment system. Commercial operators pay either in cash or by cheque but more often by
cheque.
Hire of third party trucks to service a client
Hire of third party trucks to service a client occurs at two levels. In the first instance, those
operators who do not own any trucks but are able to secure “exhausting contracts” from
households and commercial entities. Under such circumstances the renting contractor
negotiates varied pricing. In the second instance, some operators when overwhelmed by
service orders prefer to hire the trucks of their industry colleagues in order to serve the clients.
In this second instance the pricing system is commission based.
Collaboration with Manual Empties
There is collaboration with manual emptiers at varied levels. In the low income areas, public
sanitation blocks commonly referred to as bio-centres are often located in areas inaccessible by
vehicles. Such bio-centres therefore engaged a combination of manual and mechanical
operators.
3.1.9 Overview of all WWTP, FSTP or dumping sites
Overview of Kisumu WWTP and dumping Sites
Kisumu has two FS treatment plants operated by the Kisumu Water and Sanitation Company
(KIWASCO). One plant is of the stabilization ponds type which is the Nyalenda Sewerage
Treatment Works located at the edge of Kisumu City. The system consists of the preliminary,
secondary and tertiary treatment process. The inlet works with screening and grit removal then
followed by 3 facultative ponds in parallel and 6 maturation ponds in parallel pairs. Effluent is
discharged to an adjacent water course, from whence it percolates to the lake via the Nyalenda
papyrus swamp. Estimated inflow of 2000 m3/d at present is very low compared to design
capacity of 11,000 m3/d. The Nyalenda plant currently is the dumping facility for the mechanical
emptiers operating in the city. The feacal sludge from the mechanical operators is emptied at
the inlet of the treatment pond system where it mixes with incoming sewage (Figure 3-8).
There is no separate fee (other than the license paid to KIWASCO) for the mechanical emptiers

The Bill & Melinda Gates Foundation CHAPTER 3 : RESULTS AND ANALYSIS OF URBAN FSM PRACTICE Landscape Analysis and Business Model Assessment in Fecal Sludge Management: Extraction and Transportation Models in
Africa - Kenya
LOSAI MANAGEMENT LIMITED 3-95
to discharge into this facility. This pond wastewater treatment system does not separate faecal
sludge from the treated wastewater stream.
The second treatment plant is Kisat Wastewater Treatment plant (Figure 3-23) which is a
conventional type facility. It is currently under rehabilitation. It provides primary and secondary
treatment to domestic, commercial and industrial wastewater.
Faecal sludge is conditioned in cold digestion tanks and dried in sludge drying beds before
disposal (Figure 3-24).
Figure 3-23 Sedimentation Tanks at the Kisat Wastewater Treatment Plant
Figure 3-24 : FS Drying Beds (left) and dried FS (right) at the Kisat WWTP

The Bill & Melinda Gates Foundation CHAPTER 3 : RESULTS AND ANALYSIS OF URBAN FSM PRACTICE Landscape Analysis and Business Model Assessment in Fecal Sludge Management: Extraction and Transportation Models in
Africa - Kenya
LOSAI MANAGEMENT LIMITED 3-96
Overview of Mombasa WWTP and dumping Sites
Mombasa has two main sewerage treatment plants, the Kizingo Wastewater Treatment Works
located in Mombasa Island and Kipevu Wastewater Treatment Works in West Mainland both
operated by Mombasa Water and Sewerage Company (MOWASCO). The West Mainland system
has continually expanded since the first one which was built in 1952. The Island has had
minimal expansion since it was initially built in 1962.
Kizingo Wastewater Treatment Works
The Treatment Plant at Kizingo was designed to provide only preliminary treatment (screening
and grit removal) and primary treatment (sedimentation). The Inlet Works was designed for a
Dry Weather Flow of 32,500 m3/day. The Treatment Plant has been out of operation for many
years. Most of the equipment is missing and the wastewater flows by-pass the Works and are
discharged directly to the ocean through a 40 m long outfall pipe at Ras Serani.
When the plant was operational, no treatment was provided to the sludge collected from the
Sedimentation Tanks, instead, it was pumped directly into the ocean each day through the
outfall pipe during periods when the tide was going out, so that it would be transported by the
tide out to deep water for greater dilution. At present this WWTP is not operational.
Kipevu Wastewater Treatment Works
A new treatment plant at Kipevu in West Mainland was commissioned in 2003. Originally, it
employed the use of biological filters and the treated effluent was discharged directly into the
creek at Port Reitz close to Kilindini Harbour. A new extended Aeration Treatment Plant,
utilising an Oxidation Ditch System, was constructed to replace the original biological filter
plant. Its nominal design capacity is 17,000 m3/day of wastewater with a BOD of 560 mg/l and
the design BOD/SS effluent standard is 20/30. The mechanical and electrical equipment at the
plant is currently undergoing extensive rehabilitation.
Fecal sludge collected by both manual (operators use buckets to empty feacal sludge into large
containers which are carried in lorries) and mechanical operators is currently discharged at the
Kipevu Wastewater Treatment Plant (Table 3-65).

The Bill & Melinda Gates Foundation CHAPTER 3 : RESULTS AND ANALYSIS OF URBAN FSM PRACTICE Landscape Analysis and Business Model Assessment in Fecal Sludge Management: Extraction and Transportation Models in
Africa - Kenya
LOSAI MANAGEMENT LIMITED 3-97
Table 3-65 : Data on Wastewater Treatment Plant in Mombasa
What is the official dumping site for city? (WWTP, FSTP, wetlands, landfill, official open land, or nothing?
Kipevu Wastewater Treatment Plant
What is the m3 capacity of this treatment facility? 17, 100 m3
Where is it located? (Center of city, edge of city, outside city?) Edge of the city
What is the dumping fee truckers have to pay? USD (Per Truck) 10.87
Is this payment per trip or per month or m3 or? Per Trip
The Kipevu plant is currently under rehabilitation. The plant located at Kizingo is not in use, but
there is planned rehabilitation. Consequently, almost all the sewage collected flows into the sea
at various points.
Overview of Nairobi WWTP and dumping Sites
Nairobi City has numerous treatment plants. The main ones are Dandora and Kariobangi
Sewage treatment plants. Dandora was commissioned in 1977 whereas Kariobangi was
commissioned in 1964. Currently, Kariobangi is functioning at 40 per cent of its design capacity
of 32,000 m3/day.
Kariobangi
The sewage treatment plant employs conventional waste treatment technology for primary and
secondary treatment. The construction of the facilities was done in two phases. Phase 1 was
commissioned in 1961 and Phase 2 in 1963 with a dry weather design flow of 16,000 m3/day for
each phase, with combined capacity of 32,000 m3/day. However, due to ageing of some of the
equipment, the capacity has significantly reduced to estimated 40 per cent of its design
capacity.
Dandora estate sewerage treatment plant
Dandora sewerage treatment plant is located at Ruai, 30 km east of the city centre along
Kangundo Road. It uses stabilization ponds and has a dry weather capacity of 80,000 m3/d. Both
industrial and domestic sewage are discharged at the plant.

The Bill & Melinda Gates Foundation CHAPTER 3 : RESULTS AND ANALYSIS OF URBAN FSM PRACTICE Landscape Analysis and Business Model Assessment in Fecal Sludge Management: Extraction and Transportation Models in
Africa - Kenya
LOSAI MANAGEMENT LIMITED 3-98
There are two designated fecal sludge discharge points; Ruai Treatment Works and Njiru.
Currently, only Njiru is in use (Table 3-66). These points are designated to only discharge
domestic waste and not industrial effluent. An annual licence fee is payable as sewage
discharge fee and is not based on the load capacity of the exhauster tank.
Table 3-66 : Data on Wastewater Treatment Plant in Nairobi
What is the official dumping site for city? (WWTP, FSTP, wetlands, landfill, official open land, or nothing?
Dandora estate sewerage treatment plant (Ruai)
What is the m3 capacity of this treatment facility? 80,000 m3
Where is it located? (Center of city, edge of city, outside city..?) Edge of the city
What is the dumping fee truckers have to pay? USD (Per Truck) 2.17
Is this payment per trip or per month or m3 or? Per Trip
After treatment of wastewater, at Kariobangi treatment plant, the sludge is pumped to a series
of drying beds (Figure 3-25). The beds have underdrains which drain excess wastewater back to
the treatment plant. The wastewater is used for seeding incoming wastewater. Drying of the
treated sludge depends on weather conditions. It takes an average of two (2) weeks for
complete drying of the treated sludge. Currently there are no storage facilities for dried sludge,
thus it is sold directly to farmers. Farmers use it a night soil for such crops as tea, coffee and
agroforestry.
Dried FS
Figure 3-25 : FS Drying Beds - Kariobangi WWTP Nairobi

The Bill & Melinda Gates Foundation CHAPTER 3 : RESULTS AND ANALYSIS OF URBAN FSM PRACTICE Landscape Analysis and Business Model Assessment in Fecal Sludge Management: Extraction and Transportation Models in
Africa - Kenya
LOSAI MANAGEMENT LIMITED 3-99
3.1.10 FS End Re-Use in the three cities Kisumu, Mombasa and Nairobi
FS re-use in all the cities is acceptable among the local residents. However, due to the under
performance of the FSTP facilities, there are no regular sales of treated FS. Across the three
cities, the management of the FSTP’s however would like to carry out public sensitization and
awareness campaigns to increase the acceptability of treated FS particularly in agro forestry.
3.2 Market Analysis per City
The methodology for market size calculation is presented in section 2.4 of this report.
There are 148,494 households in Kisumu; out of which 84% have on-site sanitation facilities.
The volume of fecal sludge emptied mechanically in a year is 204,049 m3 while the volume
emptied manually is 508,215 m3. The total volume of fecal sludge emptied in a year is 712,264
m3. The fecal sludge per capita per annum is 4.8 m3.
There are 140,535 households in Mombasa; out of which 82% have on-site sanitation facilities.
The volume of fecal sludge emptied mechanically in a year is 57,754 m3 while the volume
emptied manually is 793,727 m3. The total volume of fecal sludge emptied in a year is 851,481
m3. The fecal sludge per capita per annum is 6.06 m3.
The number of household in Nairobi is 985,016; out of which 51% have on-site sanitation
facilities. The volume of fecal sludge emptied mechanically in a year is 3,073,485m3 while the
volume emptied manually is 1,505,126 m3. The total volume of fecal sludge emptied in a year is
4,578,584 m3. The fecal sludge per capita per annum is 4.65 m3.
3.3 Service Delivery Models Review
3.3.1 Overview of Existing Service Delivery Models
There are four service delivery models for FSM services;
• Utility companies - these provide
connection to sewer
Sewer infrastructure
• Local Authorities – these provide
sewer infrastructure
Public toilets and public toilet infrastructure

The Bill & Melinda Gates Foundation CHAPTER 3 : RESULTS AND ANALYSIS OF URBAN FSM PRACTICE Landscape Analysis and Business Model Assessment in Fecal Sludge Management: Extraction and Transportation Models in
Africa - Kenya
LOSAI MANAGEMENT LIMITED 3-100
Mechanical emptying at a lower fee (not operational)
• Private emptiers – mechanical emptying services
Manual emptying services
Pay for use toilets often under concession or Public private partnership
with local authority
FS treatment in collection aggregation bio centre facilities
FS re-use in bio-centres
• NGOs - These provide:
Pay for use toilets often under concession or Public private partnership
with local authority
FS re-use in Bio-centres for onsite cooking
FS-re-use through delivery of bio-gas by pipe infrastructure to homes
FS-evacuation through disposable bags
FS-sanitation services through household pit latrines
3.3.2 Comparison with Solid Waste Management Service Models
Kenya has four classes of local authorities: City, Municipality, Town and County council. Nairobi
is under City Council of Nairobi, Mombasa is under Municipal Council of Mombasa while Kisumu
is under Municipal Council of Kisumu. There is only one official Solid Waste dumpsite in each of
these cities/towns, owned and operated by the respective councils.
In the three councils, the collection and transportation of municipal solid waste is carried out by
four organizations:
• The Council • Contractors subcontracted by the Council • Private Service Providers • CBOs
There are three service delivery models in solid waste management;
• Local authorities – These:
Garbage Collection
Provide dumping site
Regulatory enforcement
Licenses-environmental restoration – greening

The Bill & Melinda Gates Foundation CHAPTER 3 : RESULTS AND ANALYSIS OF URBAN FSM PRACTICE Landscape Analysis and Business Model Assessment in Fecal Sludge Management: Extraction and Transportation Models in
Africa - Kenya
LOSAI MANAGEMENT LIMITED 3-101
• Private operators- are involved in:
Garbage collection
Garbage disposal to dump-site
Solid waste processing
Solid waste re-use applications
• NGOs – are involved in:
Solid waste re-use- energy
Environmental restoration
Solid waste re-use - plastic poles
Solid waste re-use in fertilizer processing
Environmental restoration- a forestation
3.3.2.1 Similarities between Fecal sludge management and solid waste management
• Participants- utility companies, emptiers and households. These are the key participants
in both FSM and SWM
• Legal enforcement – Dumping site for both fecal waste and solid waste is under a central authority (Utility Company/ City Council) who take charge of the dumping sites and ensure that operations are conducted in orderly manner.
3.3.2.2 Differences between Fecal sludge management and solid waste management
• Nature of waste – there are important differences in the nature of FS and SW.
• Enforcement agencies - During inception the enforcement agencies were similar in both
cases, however at some point separation took place creating different mandates.
• Infrastructure - the infrastructure required to effectively transport and dispose varies with the kind of waste in question. The means of transporting fecal sludge is different from how solid waste can be transported and therefore require varying infrastructure.

The Bill & Melinda Gates Foundation CHAPTER 3 : RESULTS AND ANALYSIS OF URBAN FSM PRACTICE Landscape Analysis and Business Model Assessment in Fecal Sludge Management: Extraction and Transportation Models in
Africa - Kenya
LOSAI MANAGEMENT LIMITED 3-102
3.4 Financial and Business Model Analysis
3.4.1 Financial and Business Model Analysis for Kisumu, Mombasa and Nairobi
3.4.1.1 Demand and supply in each city
Kisumu City
The city has three mechanical operators operating a total of four trucks among them. It has an
estimated annual demand for mechanical FS management services of 691,903 m3 and the
mechanical supply for those services is estimated to cater for only 6,240 m3 representing a 1%
service delivery rate. On the other hand, the manual supply has an annual demand of
approximately 508,431 m3 and a corresponding 266,549 m3 annual supply from manual
operators which represents about 52% service delivery rate (Table 3-67).
Table 3-67 : Demand and Supply of FSM Services in Kisumu
Market Demand and Supply Mechanical Emptying
Manual Emptying Total
Fecal sludge Produced (Demand)
183,472 m3 508,431 m3 691,903 m3 Supply ( emptied) p.a. 6,240 m3 266,549 m3 269,966 m3 Deficit 177,232 m3 241,882 m3 419,114 m3
Mombasa City
The annual demand for FS management services is estimated at 853,341 m3 of which 3 per cent
is services by mechanical emptiers and 33 per cent by manual emptiers. The estimated
mechanical demand is at 50,930 m3 and the supply is approximately 28,142 m3 representing a
54% service delivery rate. On the other hand, the manual supply has an annual demand of
approximately 802,411 m3 with a corresponding annual supply of 261,766 m3 from manual
operators which represents about 33% service delivery rate (Table 3-68).
Table 3-68 : Demand and Supply of FSM Services in Mombasa
Market Demand and Supply Mechanical Emptying
Manual Emptying Total
Fecal sludge Produced (Demand) p.a. 50,930 m3 802,411 m3 853,341 m3
Supply ( emptied) p.a. 28,142 m3 261,766 m3 289,908 m3 Deficit 22,787 m3 540,645 m3 563,433 m3

The Bill & Melinda Gates Foundation CHAPTER 3 : RESULTS AND ANALYSIS OF URBAN FSM PRACTICE Landscape Analysis and Business Model Assessment in Fecal Sludge Management: Extraction and Transportation Models in
Africa - Kenya
LOSAI MANAGEMENT LIMITED 3-103
Nairobi City
The annual demand for mechanical FS management services is estimated at 2,796,692 m3 and
the estimated supply from mechanical emptiers is at approximately 299,520 m3 representing a
10% service delivery rate. On the other hand, the manual supply has an annual demand of
approximately 1,808,010 m3 with a corresponding annual supply of 629,766 m3 from manual
operators which represents about 35% service delivery rate (Table 3-69). The capacity to cater
for more demand exists in the current operating environment both for mechanical and manual
operators, however due to the hazardous nature of manual FS extraction; mechanical
extraction should be promoted to meet the excess demand. To effectively meet the market
demand, the operators will have to increase their annual trips to more than 4,000 trips. For 60
trucks, each truck will have to make approximately 2,000 trips every three days. This is not
attainable without an increase in the number of trucks and other modification to reduce the
distance to dumping sites. The gap for mechanical emptiers to meet current demand is
approximately 3,675,416 m3 which demands for more trucks to the business and additional
dumping and tipping destinations.
Table 3-69 : Demand and Supply of FSM Services in Nairobi
Market Demand and Supply Mechanical Emptying
Manual Emptying Total
Fecal sludge Produced ( Demand) p.a.
2,796,692 M3 1,808,010 M3 4,604,701 M3
Supply ( emptied) p.a. 299,520 M3 629,766 M3 929,286 M3
Deficit 2,773,938 M3 1,178,244 M3 3,675,416 M3
3.4.1.2 Company Level Financial Analysis FSM Businesses
Manual Operators
One team of manual emptiers was surveyed in each of the three cities. Manual emptiers are
generally organized in teams which are sub-groups of a larger group. The larger group tends to
own the equipment for emptying and the practice is to hire these out to active teams
depending on work availability. It was estimated that there was one main group in each city and
this is closely related to the fact that manual emptyingg tends to take place in the informal
settlements, which though dispersed geographically have economic networks.

The Bill & Melinda Gates Foundation CHAPTER 3 : RESULTS AND ANALYSIS OF URBAN FSM PRACTICE Landscape Analysis and Business Model Assessment in Fecal Sludge Management: Extraction and Transportation Models in
Africa - Kenya
LOSAI MANAGEMENT LIMITED 3-104
In order to obtain comparable information from manual emptiers, a format was introduced
(Table 3-70). Based on the interviews it was identified that most manual emptiers perform this
amongst other types of manual work and are generally engaged on a daily basis. However, the
team leaders engage different groups of persons and are more engaged on manual emptying
contracts.
Table 3-70 : Activity Profile of Manual Emptiers across the 3 Cities
Input data Nairobi Kisumu Mombasa
Charge to hire drum and buckets -USD 1 1 1 Number of people per team 4 5 6 Size of drums in litres 2
Size of pits in litres 25 Charge per drum -USD 2.50 Number of drums/latrine 13 Welfare contribution per contract 1.50 1.50 1.50
Number of Jobs per day 2 0 0 Number of contract days in month 3 3 3 Number of days in month 24 24 24 Number of days of equip hire 6 6 6 Number of days of equip hire in month 24 24 24
Financial Performance
The income (Table 3-71) from manual emptying on a daily wage basis was comparable to wages
obtained from other types of manual work. However, it was reported to be seasonal and in
particular depended on the team leader for the manual contracts.
Table 3-71 : Income Statements for Manual Emptiers Across the 3 Cities
Income Statement-USD Nairobi Kisumu Mombasa
Revenue
Total income per day- USD 31.25 30.00 60.00 Total income per month-USD 93.75 90.00 180.00 Operating Costs
Equipment hire costs per month -USD 3.00 3.00 3.00

The Bill & Melinda Gates Foundation CHAPTER 3 : RESULTS AND ANALYSIS OF URBAN FSM PRACTICE Landscape Analysis and Business Model Assessment in Fecal Sludge Management: Extraction and Transportation Models in
Africa - Kenya
LOSAI MANAGEMENT LIMITED 3-105
Monthly welfare contribution-USD 4.50 4.50 4.50 Miscellaneous cost-USD 5.00 5.00 5.00 Total operating cost- USD 12.50 12.50 12.50 Profit- USD 81.25 77.50 167.50 Monthly income to each member- USD 20.31 15.50 27.92
Assumptions
• The minimum contract cost in Mombasa is USD. 60
• The minimum contract cost in Kisumu is USD. 30
Manual emptying faces a complex outlook. With the emergence of bio-centres, manual
emptying is being moved away from households to these collective FS centres, where forms of
mechanization are being tested. It is unlikely that manual emptying shall seize to exist, however
there is a need to improve on the conditions of work in particular to provision of protective
gear and medicines.
Table 3-72 provides a comparison of mechanical operators in Kisumu by number of hours worked, number of trips and number of trucks. There is observed consistency in the operations of operators with key indicators remaining relatively uniform and estimates re-appearing with regularity when estimated based on the various sources interviewed during the data collection exercise.
Table 3-72 : Comparison of Mechanical Operators - Kisumu
Kisumu
Macro-economic & business size data ONE TRUCK OPERATOR TWO TRUCKS OPERATOR
Inflation (CPI) 16% 16% Any other inflation index 0% 0% Number of trucks 1 2 Number of drivers 1 1 Number of turn boys per truck 2 3 Hour worked in a year(hrs) 547 1,003 Distance covered per year (Km) 1,207 4,224 Number of trips per annum 288 528 Average hours per trip 1.5 1.5 Fuel consumption Emptying& Transportation km/litre 4.5 4.5
Fuel Cost per litre (USD) 1.15 1.15 Tariffs (USD) 51.50 51.50

The Bill & Melinda Gates Foundation CHAPTER 3 : RESULTS AND ANALYSIS OF URBAN FSM PRACTICE Landscape Analysis and Business Model Assessment in Fecal Sludge Management: Extraction and Transportation Models in
Africa - Kenya
LOSAI MANAGEMENT LIMITED 3-106
Table 3-73 provides a comparison of mechanical operators in Mombasa by number of hours worked, number of trips and number of trucks. As can be noted from the data, the estimates are consistent across the operators. The key variables remain, number of trips, tariffs and number of trucks.
Table 3-73 Comparison of Mechanical Operators -– Mombasa
Mombasa
Macroeconomic & business size data
ONE TRUCK OPERATOR
TWO TRUCKS OPERATOR
FOUR TRUCK OPERATOR
Inflation (CPI) 16% 16% 16% Any other inflation index 0% 0% 0% Number of trucks 1 2 4 Number of drivers 1 2 4 Number of turn boys per truck 2 2 2 Hour worked in a year(hrs) 213 387 489 Distance covered per year (Km) 1,207 2,193 2,771 Number of trips per annum 142 258 326 Average hours per trip 1.5 1.5 1.5
Fuel consumption Emptying& Transportation km/litre 4.5 4.5 4.5
Fuel Cost per litre (USD) 1.15 1.15 1.15 Tariffs $124 $108 $205
Table 3-74 provides a comparison of mechanical operators in Nairobi across categories. The key variables are number of hours worked, number of trips and number of trucks. The number of trips per truck by operators appears to have the highest impact on the profitability of an operator. This is consistent as tariffs remain competitive.
Table 3-74 : Comparison of Mechanical Operators -– Nairobi
Nairobi
Macroeconomic & business size data ONE TRUCK
OPERATOR
TWO TRUCKS
OPERATOR
FOUR TRUCK
OPERATOR
Inflation (CPI) 16% 16% 16%
Any other inflation index 0% 0% 0%
Number of trucks 1 2 4
Number of drivers 1 2 4
Number of turn boys per truck 2 2 2
Hour worked in a year(hrs) 1,041 1,584 4,896

The Bill & Melinda Gates Foundation CHAPTER 3 : RESULTS AND ANALYSIS OF URBAN FSM PRACTICE Landscape Analysis and Business Model Assessment in Fecal Sludge Management: Extraction and Transportation Models in
Africa - Kenya
LOSAI MANAGEMENT LIMITED 3-107
Distance covered per year (Km) 9,356 14,256 14,028
Number of trips per annum 347 528 1,682
Average hours per trip 3 3 3
Fuel consumption Emptying&
Transportation km/litre 5.3 5.3 5.3
Fuel Cost per litre (USD) 1.15 1.15 1.15
Tariffs $94 $108 $79
3.4.1.2.1 Income statements
Kisumu City
The financial analysis follows the framework and methodology provided in the study guide.
Estimates have been generated after validation to ensure a higher degree of accuracy. The
initial estimates are in the local currency (Kenya Shillings) which are thereafter converted to
USD at the exchange rate prevailing as at the time of the survey.
The analysis (Table 3-75) shows the income statements of operators operating in Kisumu. The
operators recorded varied revenues; this is because revenue is a function of two factors; the
tariffs charge as well as the number of trips made throughout the year which varies from
operator to operator. In determining the businesses profitability two scenarios were considered
one, when depreciation is factored in and two when depreciation is excluded in computing
profitability. In the first case, when depreciation is accounted for the operators are
unprofitable, that is, when depreciation is included in the estimates, the businesses are
unprofitable. However on a cash basis these operators remain profitable, that is, if depreciation
is excluded the businesses are profitable. In general the businesses represent strong cash flows,
low debtors and thin margins. Under the present circumstances, the exiting business models
may be on a short term basis self-sustaining but may not be in the medium and long term.
Based on the impact of depreciation on profitability, the periodic surpluses are consumed by
intermittent but high cost of repairs which lower the bottom line.

The Bill & Melinda Gates Foundation CHAPTER 3 : RESULTS AND ANALYSIS OF URBAN FSM PRACTICE Landscape Analysis and Business Model Assessment in Fecal Sludge Management: Extraction and Transportation Models in
Africa - Kenya
LOSAI MANAGEMENT LIMITED 3-108
Table 3-75 : Mechanical Emptiers Condensed Income Statement - Kisumu
Condensed Income Statement KISUMU
ONE TRUCK TWO TRUCKS USD USD Revenue 14,832.00 27,192.00 Total Revenue 14,832.00 27,192.00 Operating Expenses Fixed Expenses 3,465.22 12,171.70 Gross Profit 11,366.78 15,020.30 Variable Expenses 7,513.04 5,739.13 Operating Profit/loss Before Dep & Tax 3,853.74 9,281.17 Depreciation 9,782.61 19,565.22 P/loss After Depreciation (5,928.87) (10,284.04)
The cash flow statements depict the economic character of the business. Whereas accounting
profit is possible if the depreciation charge (Table 3-76) is omitted, the economic profit of the
business is negative for the two operators. If the depreciation charge was a proxy of loan
repayment, then the businesses would be unable to support debt obligation, at the present
tariffs and number of trips.
Table 3-76 : Depreciation Charge on Mechanical Emptiers’ Income Statement-Kisumu
USD USD Depreciation (20%) 9,783 19,565 Adjusted for depreciation(Profit Before Tax) (5,929) (10,284) Tax 0 0 After tax (5,929) (10,284)
Negative cash flows (Table 3-77) because of the depreciation charge reveal the lack of profits of
the businesses. An increase in the tariff (fees) and an increase in the number of trips offer an
appreciable increase in revenues which would offer far much higher income relative to costs for
the operator. An increase in number of trips would easily offset the corresponding increase in
costs.
Table 3-77 : Cash Flow Statements Charge of Mechanical Emptiers’-Kisumu
Cash flow Statement USD USD Investment Cash flow (48,913) (97,826)

The Bill & Melinda Gates Foundation CHAPTER 3 : RESULTS AND ANALYSIS OF URBAN FSM PRACTICE Landscape Analysis and Business Model Assessment in Fecal Sludge Management: Extraction and Transportation Models in
Africa - Kenya
LOSAI MANAGEMENT LIMITED 3-109
Cash flow from operation Net Profit After Tax &Depreciation (5,929) (10,284) Add Back : Depreciation 9,783 19,565 Net Cash flow from Operation 3,854 9,281 Net Cash flow (45,059) (88,545)
Mombasa City
The financial analysis follows the framework and methodology provided in the study guide.
Estimates have been generated after validation to ensure a higher degree of accuracy. The
initial estimates are in the local currency (Kenya Shillings) which are thereafter converted to
USD at the exchange rate prevailing as at the time of the survey.
The analysis (Table 3-78) shows the income statements of operators operating in the city.
Mombasa had multiple operators under the three categories, namely one, two and four trucks
operators with trucks of varied capacities and operating from different locations. The operators
recorded varied revenues; this is because revenue is a function of many factors; the tariffs
charge, the capacity of trucks, the distance covered and the number of trips made throughout
the year which varies from operator to operator and between operators in different categories.
In determining the businesses profitability two scenarios were considered one, when
depreciation is factored in and two when depreciation is excluded in computing profitability. In
the first case, when depreciation is accounted for, all the operators are unprofitable, that is,
when depreciation is included in the estimates, the businesses are unprofitable. On a cash basis
only the two and four category operators were profitable that is, if depreciation is excluded the
businesses are profitable. The two and four truck operator businesses represent strong cash
flows, low debtors but thin margins. Under the present circumstances the one truck operator
model is not sustainable, and the exiting two and four truck business models may be on a short
term basis self-sustaining but may not be in the medium and long term. Based on the impact of
depreciation on profitability, the periodic surpluses are consumed by intermittent but high cost
of repairs which lower the bottom line.
Table 3-78 : Mechanical Emptiers Condensed Income Statement - Mombasa
Condensed Income Statement MOMBASA
ONE TRUCK TWO TRUCKS FOUR TRUCKS

The Bill & Melinda Gates Foundation CHAPTER 3 : RESULTS AND ANALYSIS OF URBAN FSM PRACTICE Landscape Analysis and Business Model Assessment in Fecal Sludge Management: Extraction and Transportation Models in
Africa - Kenya
LOSAI MANAGEMENT LIMITED 3-110
USD USD USD Revenue 17,608.00 27,735.00 66,961.11 Total Revenue 17,608.00 27,735.00 66,961.11 Operating Expenses Fixed Expenses 8,978.35 10,497.96 31,945.87 Gross Profit 8,629.65 17,237.04 35,015.24 Variable Expenses 32,413.04 8,413.04 14,882.61 Operating Profit/loss Before Dep & Tax (23,783.39) 8,824.00 20132.63 Depreciation 9,782.61 19,565.22 39,130.43 P/loss After Depreciation (33,566.00) (10,741.22) (18,997.80)
The cash flow statements illustrate the economic character of the business. Whereas
accounting profit is possible if the depreciation charge is omitted, the economic profit of the
business is negative for the three categories of operators. If the depreciation charge was a
proxy of loan repayment, then the businesses would be unable to support debt obligation, at
the present tariffs and number of trips.
Negative cash flows because of the depreciation charge reflect the absence of profits of the
business and indicate the profit margin nature of the business. An increase in the tariff (fees)
and an increase in the number of trips offer an appreciable increase in revenues which would
offer far much higher income relative to costs for the operator. An increase in number of trips
would easily offset the corresponding increase in costs.
Nairobi City
The financial analysis follows the framework and methodology provided in the study guide.
Estimates have been generated after validation to ensure a higher degree of accuracy. The
initial estimates are in the local currency (Kenya Shillings) which are thereafter converted to
USD at the exchange rate prevailing as at the time of the survey.
Nairobi had multiple operators under the three categories, namely one, two and four trucks
operators with trucks of varied capacities and operating from different locations. In Nairobi
under each category several operators were interviewed. The analysis therefore followed a two
step procedure, the first procedure was an intra category analysis and the second procedure
was an inter category analysis, within each category as well as between categories, the
operators performed differently recording different levels of revenues. This is explained by
differences in number of trips and operating locations. The analysis (Table 3-79, Table 3-80,
Table 3-81) show the income statements of operators operating in the city within (intra) each
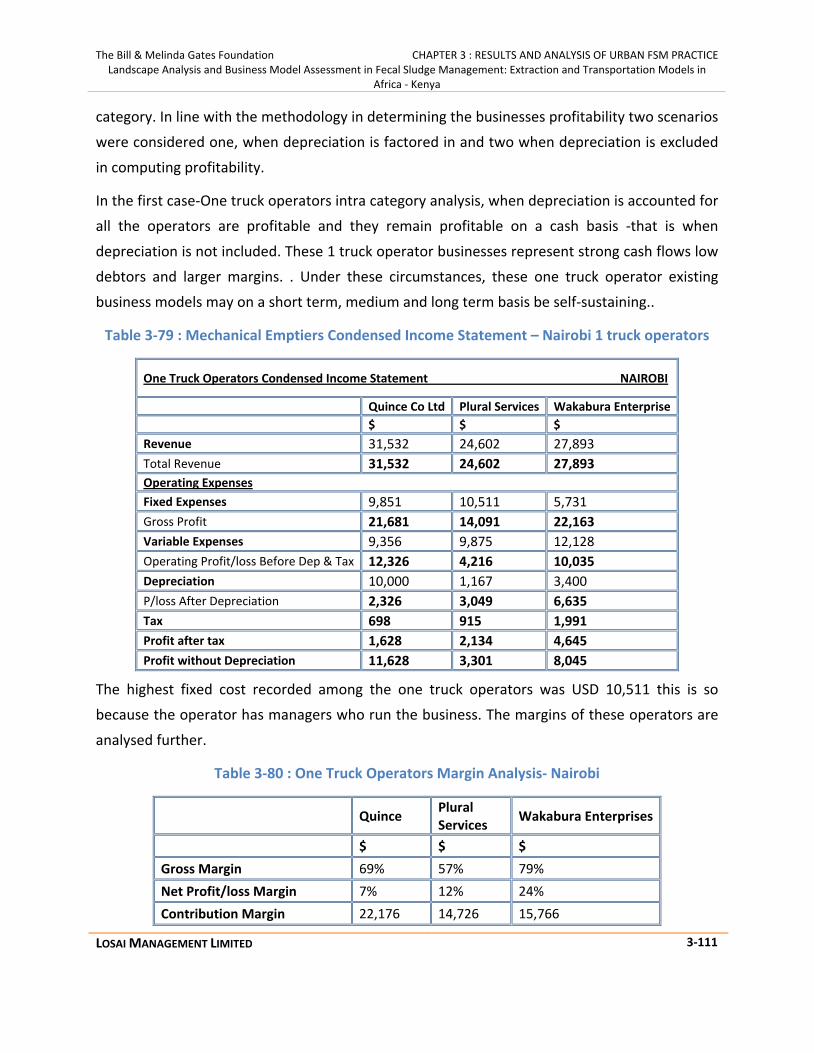
The Bill & Melinda Gates Foundation CHAPTER 3 : RESULTS AND ANALYSIS OF URBAN FSM PRACTICE Landscape Analysis and Business Model Assessment in Fecal Sludge Management: Extraction and Transportation Models in
Africa - Kenya
LOSAI MANAGEMENT LIMITED 3-111
category. In line with the methodology in determining the businesses profitability two scenarios
were considered one, when depreciation is factored in and two when depreciation is excluded
in computing profitability.
In the first case-One truck operators intra category analysis, when depreciation is accounted for
all the operators are profitable and they remain profitable on a cash basis -that is when
depreciation is not included. These 1 truck operator businesses represent strong cash flows low
debtors and larger margins. . Under these circumstances, these one truck operator existing
business models may on a short term, medium and long term basis be self-sustaining..
Table 3-79 : Mechanical Emptiers Condensed Income Statement – Nairobi 1 truck operators
One Truck Operators Condensed Income Statement NAIROBI
Quince Co Ltd Plural Services Wakabura Enterprise $ $ $ Revenue 31,532 24,602 27,893 Total Revenue 31,532 24,602 27,893 Operating Expenses Fixed Expenses 9,851 10,511 5,731 Gross Profit 21,681 14,091 22,163 Variable Expenses 9,356 9,875 12,128 Operating Profit/loss Before Dep & Tax 12,326 4,216 10,035 Depreciation 10,000 1,167 3,400 P/loss After Depreciation 2,326 3,049 6,635 Tax 698 915 1,991 Profit after tax 1,628 2,134 4,645 Profit without Depreciation 11,628 3,301 8,045
The highest fixed cost recorded among the one truck operators was USD 10,511 this is so
because the operator has managers who run the business. The margins of these operators are
analysed further.
Table 3-80 : One Truck Operators Margin Analysis- Nairobi
Quince Plural Services Wakabura Enterprises
$ $ $ Gross Margin 69% 57% 79% Net Profit/loss Margin 7% 12% 24% Contribution Margin 22,176 14,726 15,766

The Bill & Melinda Gates Foundation CHAPTER 3 : RESULTS AND ANALYSIS OF URBAN FSM PRACTICE Landscape Analysis and Business Model Assessment in Fecal Sludge Management: Extraction and Transportation Models in
Africa - Kenya
LOSAI MANAGEMENT LIMITED 3-112
Contribution margin Per Truck 22,176 14,726 15,766 Contribution margin per trip 64 43 46 Revenue per Trip 91 71 81 Revenue Per Truck 31,532 24,602 27,893 Trip Per Truck 347 347 347 Fixed Cost per trip 28 30 17 Fixed Cost Per Truck 9,851 10,511 5,731 Variable Cost Per trip 27 29 35 Variable cost per Truck 9,356 9,875 12,128 Number of Trucks 1 1 1 Number of Trips 347 347 347 Distance Covered in KM 9,356 9,356 9,356
The net profit is largely dependent on the tariffs and and how effective the business is run while keeping costs at the lowest possible levels. All operators in this case are profitable. In the case of two truck operators intra category analysis all operators are unprofitable when depreciation is charged and only become profitable when depreciation is excluded. Table 3-81 : Mechanical Emptiers Condensed Income Statement – Nairobi 2 trucks operators
Two Truck OperatorsCondensed Income Statement NAIROBI Karanja Gitua Tash Josmag Pambaza Mapal $ $ $ $ $ $ Revenue 43,368 41,712 57,024 39,360 44,100 52,200 Total Revenue 43,368 41,712 57,024 39,360 44,100 52,200 Operating Expenses Fixed Expenses 12,874 12,874 17,482 13,274 12,274 13,234 Gross Profit 30,494 28,838 39,542 26,086 31,826 38,966 Variable Expenses 36,928 32,392 18,800 31,360 30,488 39,512 Operating Profit/loss Before Dep & Tax 1,166 8,246 26,342 4,726 8,138 6,254 Depreciation 7,600 11,800 5,600 10,000 6,800 6,800 P/loss After Depreciation (6,434) (3,554) 20,742 (5,274) 1,338 (546) Tax - - 6223 - 401 - Profit after tax (6,434) (3,554) 14,519 (5,274) 937 (546) Profit without Depreciation 1,166 8,246 20,119 4,726 7,737 6,254

The Bill & Melinda Gates Foundation CHAPTER 3 : RESULTS AND ANALYSIS OF URBAN FSM PRACTICE Landscape Analysis and Business Model Assessment in Fecal Sludge Management: Extraction and Transportation Models in
Africa - Kenya
LOSAI MANAGEMENT LIMITED 3-113
As all the businesses are profitable with the exclusion of depreciation from determining the
profit level then it implies that they are profitable only on a cash basis and therefore these
businesses represent strong cash flows, low debtors and thin margins. Under these
circumstances the existing business may be self sustaining on a short term basis but may not be
in the medium and long term. This further indicates that any periodic surpluses are consumed
by intermittent but high costs of repairs which lower the bottom line. Tash enterprises (Table
3-82) is the best performing business in this category in terms of both revenue and profitability.
Table 3-82 : Two Trucks Operators Margin Analysis- Nairobi
One Truck Operators Karanja Gitua Tash Josmag Pambaza Mapal
$ $ Gross Margin 70% 69% 69% 66% 72% 75% Net Profit/loss Margin -15% -9% 36% -13% 3% -1% Contribution Margin 6,440 9,320 38,224 8,000 13,612 12,688 Contribution margin Per Truck 3,220 4,660 19,112 4,000 6,806 6,344 Contribution margin per trip 1,032 1,494 7,239 1,667 2,701 1,823 Revenue per Trip 70 67 108 82 88 75 Revenue Per Truck 21,684 20,856 28,512 19,680 22,050 26,100 Trip Per Truck 312 312 264 240 252 348 Fixed Cost per trip 21 21 33 28 24 19 Fixed Cost Per Truck 6,437 20,856 28,512 19,680 22,050 26,100 Variable Cost Per trip 59 52 36 65 60 57 Variable cost per Truck 18,464 16,196 9,400 15,680 15,244 19,756 Number of Trucks 2 2 2 2 2 2 Number of Trips 624 624 528 480 504 696 Distance Covered in KM 8,451 16,902 14,256 12,960 13,608 8,451
Tash enterprises is the only one in the two truck category in Nairobi that has a positive profit
margin. This indicates that profitability is strongly influenced by tariffs.
In the case of four truck operators intra category analysis (Table 3-83), the results were mixed.
One operator was profitable in both instances pre and post depreciation charge. The other

The Bill & Melinda Gates Foundation CHAPTER 3 : RESULTS AND ANALYSIS OF URBAN FSM PRACTICE Landscape Analysis and Business Model Assessment in Fecal Sludge Management: Extraction and Transportation Models in
Africa - Kenya
LOSAI MANAGEMENT LIMITED 3-114
operator remained unprofitable on both accounts with and without depreciation charge. The
difference in performance was explained by the variation in number of trips.
Table 3-83 : Mechanical Emptiers Condensed Income Statement – Nairobi 4 trucks operators
Condensed Income Statement NAIROBI
Jipe Moyo Rural Urban $ $ Revenue 128,928 81,312 Total Revenue 128,928 81,312 Operating Expenses Fixed Expenses 23,086 20,246 Gross Profit 105,842 61,066 Variable Expenses 57,120 62,304 Operating Profit/loss Before Dep & Tax 48,722 (2,258) Depreciation 30,000 24,940 P/loss After Depreciation 18,722 (27,198) Tax 5,617 - Profit after tax 13,105 (27,198) Profit without Depreciation 43,105 (2,258 )
In the case of the profitable four trusck operator if the depreciation charge was a proxy for loan
repayment, the businesses would be able to support debt servicing, at the present tariffs and
number of trips. For the loss making operator adjustments would be needed to the number of
trips in order to improve financial performance.
When the margins of these businesses are analysed (Table 3-84), it indicates that profitability is
influenced by both tariffs and number of trips.

The Bill & Melinda Gates Foundation CHAPTER 3 : RESULTS AND ANALYSIS OF URBAN FSM PRACTICE Landscape Analysis and Business Model Assessment in Fecal Sludge Management: Extraction and Transportation Models in
Africa - Kenya
LOSAI MANAGEMENT LIMITED 3-115
Table 3-84 : Four Truck Operators Margin Analysis-Nairobi
One Truck Operators Jipe Moyo Rural Urban
$ $ Gross Margin 82% 75% Net Profit/loss Margin 15% -33% Contribution Margin 71,808 19,008 Contribution margin Per Truck 17,952 4,752
Contribution margin per trip 44 18 Revenue per Trip 79 77 Revenue Per Truck 32,232 20,328 Trip Per Truck 408 264 Fixed Cost per trip 14 19 Fixed Cost Per Truck 5,772 5,062 Variable Cost Per trip 35 59 Variable cost per Truck 14,280 15,576 Number of Trucks 4 4 Number of Trips 1,632 1,056 Distance Covered in KM 14,029 28,512
Jipe Moyo which has a positive profit margin also has a higher number of trips and enjoys a
higher tariff, but in addition does more trips.

The Bill & Melinda Gates Foundation CHAPTER 3 : RESULTS AND ANALYSIS OF URBAN FSM PRACTICE Landscape Analysis and Business Model Assessment in Fecal Sludge Management: Extraction and Transportation Models in
Africa - Kenya
LOSAI MANAGEMENT LIMITED 3-116
Kisumu City Mechanical Operators BEP Analysis –Kisumu
This analysis sought to establish the levels at which the surveyed businesses made neither
profits nor losses (Break-even), and became profitable thereafter. It is assumed that breakeven
is a function of either tariffs or number of trips. The break even analysis is therefore done at
two levels, the tariff break even analysis and the number of trips break even analysis.
Break Even Analysis
Sales Revenue – Variable Cost = Contribution Margin
Therefore: - Contribution Margin – Fixed Cost =Operating Income or loss
The comparison analyses the performance of two categories of operators in Kisumu, namely
one and two truck owners. The comparison of revenues shows that the two truck operator still
has lower revenue per truck but higher contribution margins. The increase in the contribution
margin shows operational economies of scale setting in. However profitability is diminished
mainly by the increase in fixed cost per truck. Illustration on (Table 3-85) , this therefore means
that profitability is not guaranteed by just the increase in number of trucks or trips but is also
influenced by other factors such as number of truck breakdowns, the pattern of demand and
variability of truck capacities. In addition the three operators in Kisumu have different models
in the nature of employment of their personnel. As the industry is unregulated, it is unclear
what the optimal number of trucks would be.
Table 3-85 : Mechanical Operators Margin Analysis – Kisumu
1 Truck 2 Trucks USD USD
Gross Margin 77% 55% Net Profit/loss Margin 26% 34% Contribution Margin 7,318.96 21,452.87 Contribution margin Per Truck 7,318.96 10,726.43 Contribution margin per trip 25.41 40.63 Revenue/Tariff per Trip 51.50 51.50 Revenue Per Truck 14,832.00 13,596.00 Trip Per Truck 288 264 Fixed Cost per trip 12.03 23.05

The Bill & Melinda Gates Foundation CHAPTER 3 : RESULTS AND ANALYSIS OF URBAN FSM PRACTICE Landscape Analysis and Business Model Assessment in Fecal Sludge Management: Extraction and Transportation Models in
Africa - Kenya
LOSAI MANAGEMENT LIMITED 3-117
Fixed Cost Per Truck 3,465.22 6,085.85 Variable Cost Per trip 26.09 10.87 Variable cost per Truck 7,513.04 2,869.57
Operational Analysis
Based on their income statements the two operators are unprofitable when depreciation was
charged but remained profitable on a cash basis. Thus based on standard profitability analysis
for the two operators to break even they would need to increase either their tariffs or the
number of trips.
Table 3-86 : Comparison of Mechanical Operators Kisumu for BEP Analysis
KISUMU
Macroeconomic & business size data ONE TRUCK OPERATOR TWO TRUCKS OPERATOR
Inflation (CPI) 16% 16% Any other inflation index 0% 0% Number of trucks 1 2 Number of drivers 1 2 Number of turn boys per truck 2 2 Hour worked in a year(hrs) 547 1003 Distance covered per year (Km) 2,304 4,224 Number of trips per annum 288 528 Average hours per trip 1.9 1.9 Fuel consumption Emptying& Transportation km /Km 4.5 4.5
Fuel Cost per litre(USD) 1.15 1.15 Tariffs $ 52 $ 52
Arising from the uprofitability of the operators break even, options available are price and
number of trips or unit sales. Hence for operator #1 to break even there are three options;
either increase the number of trips per year to 340 or increase the tariff charge to $ 72 per trip
for the same number of trips currently per year (Table 3-87). Third the operator may consider
adopting a different business model from a permanent employment basis to a casual basis to
reduce the fixed operating cost to an optimum level. For operator #2 with two trucks there are

The Bill & Melinda Gates Foundation CHAPTER 3 : RESULTS AND ANALYSIS OF URBAN FSM PRACTICE Landscape Analysis and Business Model Assessment in Fecal Sludge Management: Extraction and Transportation Models in
Africa - Kenya
LOSAI MANAGEMENT LIMITED 3-118
two options available. Option one is increasing the tariff to $ 70 per trip or increase the number
of trips to 717 per year at the same tariff rate.
Table 3-87 : Per unit BEP analysis-Kisumu
Operator 1 Operator 2
Revenue $ 14,832 $27,192 Fixed Expenses $ 13,247 $ 31,565 Variable Expenses $ 7,513 $ 5,739 Contribution Margin $ 7,319 $ 21,453 BEP Revenue $ 20,760 $ 37,304 Number of Trips 288 528 BEP tariffs $ 72 $ 70 BEP # trips per year 340 717
This being a price sensitive business, increasing the tariff charge may result in loss of clients.
Therefore the two operators are perhaps best served by increasing the number of trips if
possible as there is still substantial unmet demand for the services.
Mombasa City
Mechanical Operators BEP Analysis –Mombasa
This analysis sought to establish the levels at which the surveyed businesses made neither
profits nor losses (Break-even), and became profitable thereafter. It is assumed that breakeven
if a function of either tariffs or number of trips. The break even analysis is therefore done at
two levels, the tariff break even analysis and the number of trips break even analysis.
Break Even Analysis
Sales Revenue – Variable Cost = Contribution Margin
Therefore: - Contribution Margin – Fixed Cost =Operating Income or loss
The comparison analyses the performance of three categories of operators in Mombasa,
namely one, two and four truck owners. The comparison of revenues shows that the two and
four truck operators performed better than the single truck operators. The increases in the
contribution margin shows operational economies of scale setting in with increase in trucks and
in particular as both variable and fixed costs are marginally lower for the two and four truck

The Bill & Melinda Gates Foundation CHAPTER 3 : RESULTS AND ANALYSIS OF URBAN FSM PRACTICE Landscape Analysis and Business Model Assessment in Fecal Sludge Management: Extraction and Transportation Models in
Africa - Kenya
LOSAI MANAGEMENT LIMITED 3-119
operators in comparison to the one truck operator. Analysis on revenue per truck (Table 3-88)
indicates that profitability is not guaranteed by just the increase in number of trucks or trips but
is also influenced by other factors.
The results on profitability are mixed. The one truck category operators indicated losses before
and after depreciation.
Table 3-88 : Mechanical Operators Margin Analysis – Mombasa
1 Truck 2 Trucks 4 Trucks
$ $ $ Gross Margin 49% 62% 52% Net Profit/loss Margin (135%) 32% 30% Contribution Margin (14,805.04) 19,321.96 52,078.50 Contribution margin Per Truck (14,805.04) 9,660.98 13,019.63 Contribution margin per trip (104.26) 74.89 159.75 Revenue/Tariff per Trip 124.00 107.50 205.40 Revenue Per Truck 17,608.00 13,867.50 16,740.28 Trip Per Truck 142 129 81.5 Fixed Cost per trip 63.23 40.69 97.99 Fixed Cost Per Truck 8,978.35 5,248.98 7,986.47 Variable Cost Per trip 228.26 32.61 45.65 Variable cost per Truck 32,413.04 4,206.52 3,720.65
The two and four truck category operators indicated losses when depreciation was not charged
but showed that they were profitable on a cash basis, that is, before depreciation was charged.
Thus based on standard profitability analysis for the two operators to break even they would
need to increase either their tariffs or the number of trips.
Operational Analysis
The emptier with two trucks has a greater efficiency in his operations and is able to retain more
revenues as shown by a gross margin of 62 per cent compared to 49 per cent of emptier with
one truck and emptier with four trucks (Table 3-88). The emptier with one truck is able to
generate more revenue with a single truck as shown by revenue per truck compared with the
other emptiers with two and four trucks. This shows that the emptiers with two and four trucks
are unable to utilize the advantage of having more trucks to generate more revenue. Though
there are two operators with two trucks, one is more productive than the other and has more

The Bill & Melinda Gates Foundation CHAPTER 3 : RESULTS AND ANALYSIS OF URBAN FSM PRACTICE Landscape Analysis and Business Model Assessment in Fecal Sludge Management: Extraction and Transportation Models in
Africa - Kenya
LOSAI MANAGEMENT LIMITED 3-120
customers. However, the operators of two trucks in Mombasa also use a non-conventional
technology of transporting FS,-that is the open drum technique. These truckers charge a lower
fee but amounts to a higher fee per cubic metre as the truck capacities are small.
When unprofitable, in order to break even the operators have two possible courses of action,
that is, they can either increase the tariff charge or increase the number of trips made annually.
But, whichever way deemed prudent there are also limitations occasioned by the prevailing
market tariff and the state of the truck and roads infrastructure. Increasing the tariffs will only
be practical if they do not exceed the market rates due to tariff sensitivity of this business. And,
on the other hand trips can be increased if the trucks are either in good condition or new so as
to reduce the number of breakdowns, and two if the road infrastructure is pliable
Tariff and trips Break Even Analysis
The operators break even options available are price and number of trips or unit sales. To break
even, operator #1 has two options; he can either increase the number of trips per year to 398
from 142 or increase the tariff charge to $ 347 per trip for the same number of trips per year
(Table 3-89).
For the second operator with two trucks there are three options available. That is increasing the
tariff to $ 162 per trip or increase the number of trips to 388 from 258 per year at the same
tariff rate.
For operator #3 with four trucks there are three options are available. That is increasing the
tariff to $ 284 per trip or increase the number of trips to 452 from 326 per year at the same
tariff rate.
However, theoretically increasing prices is possible but in practice constraints are bound to
arise. This is a price sensitive business and the action of increasing the tariff charge will most
likely result in loss of clients to the any other lower cost operator who can charge less.
Table 3-89 : Per unit BEP analysis- Mombasa
One Truck Operator 1
Two Truck Operator 2
Four Truck Operator 4
Revenue $ 17,608 $ 27,735 $ 66,961
Fixed Expenses $ 18,761 $ 30,063 $ 71,076

The Bill & Melinda Gates Foundation CHAPTER 3 : RESULTS AND ANALYSIS OF URBAN FSM PRACTICE Landscape Analysis and Business Model Assessment in Fecal Sludge Management: Extraction and Transportation Models in
Africa - Kenya
LOSAI MANAGEMENT LIMITED 3-121
Nairobi City
As there were several operators under each category of truck ownership in Nairobi who were
interviewed, this analysis sought to establish the levels at which each operator within the three
categories of operators in Nairobi, namely one, two and four truck owners surveyed made
neither profits nor losses (Break-even), and became profitable thereafter. It is assumed that
breakeven, is a function of either tariffs or number of trips. The break even analysis is therefore
done at two levels, the tariff break even analysis and the number of trips break even analysis.
Break Even Analysis
The comparison analyses the performance of each operator within the three categories of
operators in Nairobi, namely one-truck (Table 3-90), two-truck (Table 3-91) and four-truck
(Table 3-92) owners. The comparison of revenues shows that the two and four truck operators
performed better than the single truck operators. The increases in the contribution margin
shows operational economies of scale setting in with increase in trucks and in particular as both
variable and fixed costs are marginally lower for the two and four truck operators in
comparison to the one truck operator. Illustration on (Table 3-85), on revenue per truck
indicates that profitability is not guaranteed by just the increase in number of trucks or trips but
is also influenced by other factors.
Sales Revenue – Variable Cost = Contribution Margin
Therefore: - Contribution Margin – Fixed Cost =Operating Income or loss
This analysis sought to establish the levels at which the surveyed businesses made neither
profits nor losses (Break-even), and became profitable thereof. The break even analysis is
Variable Expenses $ 32,413 $ 8,413 $ 14,883
Contribution Margin $ (14,805) $ 19,322 $ 52,079
BEP Revenue $ 49,339 $ 41,874 $ 92,591
Number of Trips 142 258 326
BEP tariffs $ 347 $ 162 $ 284
BEP # trips per year 398 388 452

The Bill & Melinda Gates Foundation CHAPTER 3 : RESULTS AND ANALYSIS OF URBAN FSM PRACTICE Landscape Analysis and Business Model Assessment in Fecal Sludge Management: Extraction and Transportation Models in
Africa - Kenya
LOSAI MANAGEMENT LIMITED 3-122
therefore done at two levels, the tariff break even analysis and the number trips break even
analysis.
The tariff Break Even Analysis of the one truck operators in Nairobi (Table 3-90) indicates that
all the operators are making profits and thus the objective to break even ceases to be the
underlying objective but rather to maximize profits and to keep the tariffs at higher than BEP
tariffs. Thus from a tariff point of view, this would be profit maximization attainable by way of
increasing the tariffs above the current rates. Owing to the price sensitivity of this business, the
alternative is only limited to the extent to which tariffs can be adjusted upwards without losing
the current client base to competition. Thus the alternative to remaining very profitable is to
increase the number of trips made per annum.
Table 3-90 : One Truck Operator BEP Analysis-Nairobi
One Truck operators
Quince Plural Services Wakabura Enterprises Revenue 31,532 24,602 27,893 Fixed Expenses 9,851 10,511 5,731 Variable Expenses 9,356 9,875 12,128 Contribution Margin 22,176 14,726 15,766 BEP Revenue 19,206 20,386 17,858 Current # of Trips 347 347 347 BEP tariffs 55 59 51 BEP # trips per year 211 287 222
The number of trips Break Even Analysis for one truck operators is also informed by the tariff
break even analysis. At present all the one truck operators in Nairobi are profitable, however
profit maximization is the objective, this can be achieved through increase in number of trips to
the highest possible level. Alternatively, the costs of operations may be reduced significantly to
lowest possible levels. Cost efficiency can be attained by way of business restructuring to new
models in terms of costs. At present costs the number of trips should be sustained at levels
above 211, 287 and 222 respectively failure to which the businesses will become unprofitable.
Two truck Operators BEP Analysis
Referring to the income statements (Table 3-81) with the exception of Pambaza services, all the
other operators are making losses. The operators are profitable on a cash basis but are
unprofitable when depreciation is charged.

The Bill & Melinda Gates Foundation CHAPTER 3 : RESULTS AND ANALYSIS OF URBAN FSM PRACTICE Landscape Analysis and Business Model Assessment in Fecal Sludge Management: Extraction and Transportation Models in
Africa - Kenya
LOSAI MANAGEMENT LIMITED 3-123
Pambaza services is profitable on a cash basis and even when depreciation is charged. This
therefore implies that the key objective of the other operators within the two truck category
would be to break even and thereafter become profitable.
In order to break even the operators in this category will have to either increase their tariffs, or
increase the number of trips or restructure their businesses into cost effective business models.
The tariff break even analysis of two truck operators (Table 3-91) indicates that the operators
should increase the tariff up from the current tariffs to USD 80, 73, 93 and 73 respectively.
Table 3-91 : Two truck Operators BEP Analysis-Nairobi
Two Truck operators
Karanja Gitua Josmag Mapal
Revenue 43,368 41,712 39,360 52,200
Fixed Expenses 12,874 12,874 13,274 13,234
Variable Expenses 36,928 32,392 31,360 39,512
Contribution Margin 6,440 45,266 44,634 52,746
BEP Revenue 49,802 45,266 44,634 52,746
Current # of Trips 624 624 480 696
BEP tariffs 80 73 93 76
BEP # trips per year 717 677 544 703
However tariff increases cannot ignore price sensitivity of the demand for the services and the
actions of other industry players. In determining what tariff to charge, the proprietors should
be cautious so as not to lose customers. Their tariffs shouldn’t exceed those their profitable
competitors are charging since that is more likely to result to loss of customers. Unless the
tariffs increase can be justified by giving premium services above those of competitors, then the
other alternatives will be to increase the number of trips made per year and work on reducing
costs.
The number of trips break even analysis for two truck operators indicates that the operators’
practical course of action is increasing the number of trips per operator. The breakeven trips
without seeking to adjust costs downwards are 717, 677, 544 and 703 respectively (Table 3-91).
However, this may be limited by the state of the trucks; old trucks may not be able to meet the
break even number of trips in a year.

The Bill & Melinda Gates Foundation CHAPTER 3 : RESULTS AND ANALYSIS OF URBAN FSM PRACTICE Landscape Analysis and Business Model Assessment in Fecal Sludge Management: Extraction and Transportation Models in
Africa - Kenya
LOSAI MANAGEMENT LIMITED 3-124
Four truck Operators BEP analysis
Referring to the income statements (Table 3-83), there are two four truck operators Jipe Moya
and Rural Urban. Jipe Moyo is profitable on a cash basis and even after charging depreciation.
Rural Urban on the other hand is unprofitable on both accounts and has two break even
options which are either to increase the number of trips or increase the tariff.
The tariff break even analysis for this four truck operator is an increase in the tariff charge to
USD 78 per trip while the number of trips break even analysis is to to increase the number of
trips per year to 1,072 from 1,056 for all the four trucks.
From the BEP analysis (Table 3-92) of this operator it is evident that economies of scale do not
necessarily set in as the number of trucks increases. This could be for a number of factors such
as number of truck breakdowns, which is largely affected by the age of the truck and the road
infrastructure, the pattern of demand and variability of truck capacities and sometimes the
business model such as the nature of employment as either on casual or permanent term.
Table 3-92 : Four truck Operators BEP analysis-Nairobi
Four Truck operator Rural Urban
Revenue 81,312
Fixed Expenses 20,246
Variable Expenses 62,304
Contribution Margin 19,008
BEP Revenue 82,550
Current # of Trips 1,056
BEP tariffs 78
BEP # trips per year 1,072

The Bill & Melinda Gates Foundation CHAPTER 3 : RESULTS AND ANALYSIS OF URBAN FSM PRACTICE Landscape Analysis and Business Model Assessment in Fecal Sludge Management: Extraction and Transportation Models in
Africa - Kenya
LOSAI MANAGEMENT LIMITED 3-125
3.4.1.2.2 IRR, NPV, Cash Flow and ROE
Kisumu City : IRR, NPV, Cash Flow and ROE
Cash Flow Statement of Mechanical Emptiers – Kisumu
A. One truck operator’s cash flow projection for 5 years: IRR, NPV, Cash Flow and ROE
Using the information on income statements (Table 3-75), the revenue projections (Table 3-93)
for the one truck operator were generated for a period of 5 years. The results indicate that the
end value of cash flows is smaller than the initial investment and is also negative.
Table 3-93 : One truck operator’s Cash flow projection to 2016 - Kisumu
Income Statement Year 1 Actual Year 2 Projected Year 3 Projected
Year 4 Projected
Year 5 Projected
$ $ $ $ $ Revenue 14,832 17,135 19,797 22,871 26,423 Less: operating expenses 10,978 12,683 16,210 23,208 37,998 EBITDA 3,854 4,452 3,586 (337) (11,575) Less depreciation (9,783) (9,783) (9,783) (9,783) (9,783) EBIT (5,929) (5,330) (6,196) (10,119) (21,358) Total tax payable (1,779) (1,599) (1,859) (3,036) (6,407) EAITDA (4,150) (3,731) (4,337) (7,083) (14,950) Balance Sheet - year end Assets Vehicle 39,130 29,348 19,565 9,783 - Closing cash 5,632 6,051 5,445 2,699 (5,168) 44,763 35,399 25,010 12,482 (5,168) Liabilities Owner's equity Opening equity 48,913 48,913 48,913 48,913 48,913 Add: annual net EAITDA (4,150) (3,731) (4,337) (7,083) (14,950) Net owner's equity 44,763 45,182 44,576 41,830 33,963 44,763 45,182 44,576 41,830 33,963 Return on Equity (ROE) -9% -8% -10% -17% -44%
Average annual 5 year ROE -18%

The Bill & Melinda Gates Foundation CHAPTER 3 : RESULTS AND ANALYSIS OF URBAN FSM PRACTICE Landscape Analysis and Business Model Assessment in Fecal Sludge Management: Extraction and Transportation Models in
Africa - Kenya
LOSAI MANAGEMENT LIMITED 3-126
Based on the one truck operator’s cash flow projection for 5 years (Table 3-93) the
corresponding NPV estimate (Table 3-94) indicates that the rate of return falls below the
discount rate of 15% p.a. This result is consistent with the negativity of the ROE over the years.
Table 3-94 : One truck operator’s NPV,IRR - Kisumu
5 year analysis NPV @15% discount rate 344 Avg 5 yr monthly cash to operator 2,826
B. Two-truck operator’s cash flow projection to 2016: IRR, NPV, Cash Flow and ROE
Using the information on income statements (Table 3-75), the revenue projections (Table 3-95)
for the two truck operator were generated for a period of 5 years. The results indicate that the
cash flows have improved over the one truck operator as the number of trucks has increased
and this implies some form of economies of scale is attainable. Cash flows begin to improve as
the number of trucks increases this implies that if well managed efficiency and subsequent
economies of scale is attainable. In the projections cash flows improve each year for the next 5
years. However the end value of cash flows is smaller than the initial investment. That is end
term cash is less than initial investment.
Table 3-95 : Two truck operator’s Cash flow projection 5 years - Kisumu
Income Statement Year 1 Actual Year 2 Projected Year 3 Projected
Year 4 Projected
Year 5 Projected
$ $ $ $ $ Revenue 27,192 31,415 36,294 41,930 48,442 Less: operating expenses 17,911 26,432 29,645 33,358 37,647 EBITDA 9,281 4,983 6,649 8,572 10,795 Less: depreciation (19,565) (19,565) (19,565) (19,565) (19,565) EBIT (10,284) (14,582) (12,917) (10,993) (8,770) Total tax payable - - - - - EAITDA (10,284) (14,582) (12,917) (10,993) (8,770) Balance Sheet - year end Assets Vehicle 78,261 58,696 39,130 19,565 - Closing cash 9,281 4,983 6,649 8,572 10,795 87,542 63,679 45,779 28,138 10,795 Liabilities Owner's equity

The Bill & Melinda Gates Foundation CHAPTER 3 : RESULTS AND ANALYSIS OF URBAN FSM PRACTICE Landscape Analysis and Business Model Assessment in Fecal Sludge Management: Extraction and Transportation Models in
Africa - Kenya
LOSAI MANAGEMENT LIMITED 3-127
Income Statement Year 1 Actual Year 2 Projected Year 3 Projected
Year 4 Projected
Year 5 Projected
Opening equity 97,826 97,826 97,826 97,826 97,826 Add annual net EAITDA (10,284) (14,582) (12,917) (10,993) (8,770) Net owner's equity 87,542 83,244 84,909 86,833 89,056 87,542 83,244 84,909 86,833 89,056 Return on Equity (ROE) -12% -18% -15% -13% -10% Average annual 5 year ROE -13%
Based on the two truck operator’s cash flow projection to 2016 (Table 3-95) the corresponding
NPV estimate indicates (Table 3-96) that the rate of return falls below the discount rate of 15%
p.a. This result is consistent with the lower end value of cashflows and the negativity of the ROE
over the years.
Table 3-96 : Two Truck operator’s NPV,IRR – Kisumu
Present value
Value of Firm
Where;
PV – Present Value TR- Total Revenue TC- Total Cost π – Periodic cash flows r- Rate of return t- Time
1 21 2
1(1 ) (1 ) (1 ) (1 )
nn t
n tt
PVr r r r
π ππ π=
= + + + =+ + + +∑
1 1(1 ) (1 )
n nt t t
t tt t
TR TCValueof Firmr r
π= =
−= =
+ +∑ ∑
5 year analysis NPV @15% discount rate 601 Avg 5 yr monthly cash to operator 8,056

The Bill & Melinda Gates Foundation CHAPTER 3 : RESULTS AND ANALYSIS OF URBAN FSM PRACTICE Landscape Analysis and Business Model Assessment in Fecal Sludge Management: Extraction and Transportation Models in
Africa - Kenya
LOSAI MANAGEMENT LIMITED 3-128
Mombasa City : IRR, NPV, Cash Flow and ROE
A. One truck operator’s cash flow projection for 5 years : IRR, NPV, Cash Flow and ROE
Using the information on income statements (Table 3-78 ), the revenue projections (Table 3-97)
for the one truck operator were generated for a period of 5 years. This operator was
unprofitable based on the income statements on both accounts of before and after charging
depreciation. Therefore despite the exclusion of depreciation this operator reports adverse
cash flow meaning that the operations are not only non-profitable but meeting cash obligations
as they fall due is a challenge. The results indicate that the end value of cash flows is smaller
than the initial investment and is also negative.
The operating expenses rise at a higher rate than the revenues. The emptier will be required to
increase tariffs, cut costs or increase the number of trips as a way of increasing revenue in
order to break even. The growth in trips needs to be much higher than the growth in costs for
the operator to sustain profitability.
Table 3-97 : One Truck Operator Cash Flow Projection for 5 years - Mombasa
Income Statement Year 1 Actual Year 2
Projected Year 3 Projected
Year 4 Projected
Year 5 Projected
$ $ $ $ $ Revenue 17,608 20,343 23,502 27,152 31,368 Less: operating expenses 39,557 45,580 52,538 60,578 69,866 EBITDA (21,949) (25,237) (29,037) (33,426) (38,498) Less depreciation (9,783) (9,783) (9,783) (9,783) (9,783) EBIT (31,731) (35,020) (38,819) (43,209) (48,280) Total tax payable (9,519) (10,506) (11,646) (12,963) (14,484) EAITDA (22,212) (24,514) (27,174) (30,2460 (33,796) Balance Sheet - year end Assets Vehicle 39,130 29,348 19,565 9,783 - Closing cash (12,429) (14,731) (17,391) (20,464) (24,014) Liabilities Owner's equity Opening equity 48,913 48,913 48,913 48,913 48,913 Add: annual net EAITDA (22,212) (24,514) (27,174) (30,2460 (33,796) Net owner's equity 26,701 24,399 21,739 18,667 15,117

The Bill & Melinda Gates Foundation CHAPTER 3 : RESULTS AND ANALYSIS OF URBAN FSM PRACTICE Landscape Analysis and Business Model Assessment in Fecal Sludge Management: Extraction and Transportation Models in
Africa - Kenya
LOSAI MANAGEMENT LIMITED 3-129
Income Statement Year 1 Actual Year 2 Projected
Year 3 Projected
Year 4 Projected
Year 5 Projected
26,701 24,399 21,739 18,667 15,117 Return on Equity (ROE) Average annual 5 year ROE -83% -100% -125% -162% -224%
Based on the one truck operator’s cash flow projection for 5 years (Table 3-97) the
corresponding NPV estimate (Table 3-98) indicates that the rate of return falls below the
discount rate of 15% p.a. This result is consistent with the negative end value of cashflows and
the negativity of the ROE over the years.
Table 3-98 : One Truck Operator’s NPV,IRR – Mombasa
5 year analysis
NPV @15% discount rate (838.95) Avg 5 yr monthly cash to operator (17,805.73)
Present value
Value of Firm
Where; PV – Present Value TR- Total Revenue TC- Total Cost π – Periodic cash flows r- Rate of return t- Time
B. Two-Truck Operator’s Cash flow projection for 5 years : IRR, NPV, Cash Flow and ROE-
Mombasa
Using the information on income statements (Table 3-78), the revenue projections (Table 3-99)
for the two truck operator were generated for a period of 5 years. This operator was profitable
on a cashbasis but not profitable after charging depreciation. As expected the cash flows begin
to improve as the number of trucks increases. Cash flows each year are projected to improve
1 21 2
1(1 ) (1 ) (1 ) (1 )
nn t
n tt
PVr r r r
π ππ π=
= + + + =+ + + +∑
1 1(1 ) (1 )
n nt t t
t tt t
TR TCValueof Firmr r
π= =
−= =
+ +∑ ∑

The Bill & Melinda Gates Foundation CHAPTER 3 : RESULTS AND ANALYSIS OF URBAN FSM PRACTICE Landscape Analysis and Business Model Assessment in Fecal Sludge Management: Extraction and Transportation Models in
Africa - Kenya
LOSAI MANAGEMENT LIMITED 3-130
for the next 5 years, however operating expenses are also rising rapidly. The results indicate
that the end value of cash flows is smaller than the initial investment.
Table 3-99 : Two-Truck Operator Cash flow Analysis to 2016 – Mombasa
Income Statement Year 1 Actual Year 2 Projected Year 3
Projected Year 4 Projected
Year 5 Projected
$ $ $ $ $ Revenue 27,735 32,042 37,018 42,767 49,409 Less: operating expenses 23,309 25,338 28,837 32,880 37,551 EBITDA 5,426 6,705 8,181 9,887 11,858 Less: depreciation (19,565) (19,565) (19,565) (19,565) (19,565) EBIT (14,139) (12,861) (11,384) (9,678) (7,707) Total tax payable (42,42) (3,858) (3,415) (2,903) (2312) EAITDA (9,897) (9,002) (7,969 (6,775) (5,395) Balance Sheet - year end Assets Vehicle 78,260 58,696 39,130 19,565 - Closing cash 9,668 10,563 11,594 12,791 14,170 87,929 69,258 50,727 32,356 14,170 Liabilities Owner's equity Opening equity 97,826 97,826 97,826 97,826 97,826 Add annual net EAITDA (9,897) (9,002) (7,969) (6,775) (5,395) Net owner's equity 87,929 88,824 89,857 91,052 92,431 87,929 88,824 89,857 91,052 92,431 Return on Equity (ROE) -11% -10% -9% -7% -6% Average annual 5 year ROE -9%
Based on the two truck operator’s cash flow projection for 5 years (Table 3-99) and the lower
end value of cash flows than the initial investment the corresponding NPV estimate (Table
3-100) indicates that the rate of return falls below the discount rate of 15% p.a. This result is
consistent with the negativity of the ROE over the years.

The Bill & Melinda Gates Foundation CHAPTER 3 : RESULTS AND ANALYSIS OF URBAN FSM PRACTICE Landscape Analysis and Business Model Assessment in Fecal Sludge Management: Extraction and Transportation Models in
Africa - Kenya
LOSAI MANAGEMENT LIMITED 3-131
Table 3-100 : Two Truck operator’s NPV,IRR – Mombasa
5 year analysis
NPV @15% discount rate 648.55 Avg 5 yr monthly cash to operator 11,757.65
The operating expenses rise at a higher rate than the revenues. The emptier options include
increasing tariffs, cutting costs or increasing the number of trips as a way of increasing revenue
and cash flows. The growth in trips needs to be much higher than the growth in costs.
Present value
Value of Firm
Where; PV – Present Value TR- Total Revenue TC- Total Cost π – Periodic cash flows r- Rate of return t- Time
C. Four-truck operator’s cash flow projection for 5 years : IRR, NPV, Cash Flow and ROE -
Mombasa
Using the information on income statements (Table 3-78), the revenue projections (Table
3-101) for the four truck operator were generated for a period of 5 years. This operator was
profitable on a cashbasis but not profitable after charging depreciation. As expected the cash
flows begin to improve as the number of trucks increases. Cash flows each year are projected to
improve for the next 5 years, however operating expenses are also rising rapidly. The results
indicate that the end value of cash flows is smaller than the initial investment.
1 21 2
1(1 ) (1 ) (1 ) (1 )
nn t
n tt
PVr r r r
π ππ π=
= + + + =+ + + +∑
1 1(1 ) (1 )
n nt t t
t tt t
TR TCValueof Firmr r
π= =
−= =
+ +∑ ∑

The Bill & Melinda Gates Foundation CHAPTER 3 : RESULTS AND ANALYSIS OF URBAN FSM PRACTICE Landscape Analysis and Business Model Assessment in Fecal Sludge Management: Extraction and Transportation Models in
Africa - Kenya
LOSAI MANAGEMENT LIMITED 3-132
Table 3-101 : Four Truck Operator Cash FlowProjections for 5 years – Mombasa
Income Statement Year 1 Actual Year 2 Projected Year 3
Projected Year 4 Projected
Year 5 Projected
$ $ $ $ $ Revenue 66,961 77,360 89,374 103,254 119,289 Less: operating expenses 53,461 60,663 68,983 78,596 89,701 EBITDA 13,500 16,697 20,391 24,658 29,589 Less: depreciation (39,130) (39,130) (39,130) (39,130) (39,130) EBIT (25,630) (22,433) (18,739) (14,472) (9,542) Total tax payable (7,689) (6,730) (5,622) (4,342) (2,863) EAITDA (17,941) (15,703) (13,118) (10,130) (6,679) Balance Sheet - year end Assets Vehicle 156,522 117,391 78,261 39,130 - Closing cash 21,189 23,427 26,013 29,000 32,451 177,711 140,819 104,274 68,131 32,451 Liabilities Owner's equity Opening equity 195,652 195,652 195,652 195,652 195,652 Add annual net EAITDA (17,941) (15,703) (13,118) (10,130) (6,679) Net owner's equity 177,711 179,949 182,535 185,522 188,973 177,711 179,949 182,535 185,522 188,973 Return on Equity (ROE) -10% -9% -7% -5% -4% Average annual 5 year ROE -7%
Based on the four truck operator’s cash flow projection for 5 years (Table 3-101) the
corresponding NPV estimate (Table 3-102) indicates that the rate of return falls below the
discount rate of 15% p.a. This result is consistent with the negativity of the ROE over the years

The Bill & Melinda Gates Foundation CHAPTER 3 : RESULTS AND ANALYSIS OF URBAN FSM PRACTICE Landscape Analysis and Business Model Assessment in Fecal Sludge Management: Extraction and Transportation Models in
Africa - Kenya
LOSAI MANAGEMENT LIMITED 3-133
Table 3-102 : Four Truck operator’s NPV,IRR – Mombasa
5 year analysis
NPV @15% discount rate 1,423 Avg 5 yr monthly cash to operator 26,416
The operating expenses rise at a higher rate than the revenues. The emptier options include
increasing tariffs, cutting costs or increasing the number of trips as a way of increasing revenue
and cash flows.in order to break even. The growth in trips needs to be much higher than the
growth in costs.
Present value
Value of Firm
Where; PV – Present Value TR- Total Revenue TC- Total Cost π – Periodic cash flows r- Rate of return t- Time
1 21 2
1(1 ) (1 ) (1 ) (1 )
nn t
n tt
PVr r r r
π ππ π=
= + + + =+ + + +∑
1 1(1 ) (1 )
n nt t t
t tt t
TR TCValueof Firmr r
π= =
−= =
+ +∑ ∑

The Bill & Melinda Gates Foundation CHAPTER 3 : RESULTS AND ANALYSIS OF URBAN FSM PRACTICE Landscape Analysis and Business Model Assessment in Fecal Sludge Management: Extraction and Transportation Models in
Africa - Kenya
LOSAI MANAGEMENT LIMITED 3-134
Nairobi City : IRR, NPV, Cash Flow and ROE
In analyzing the cash flow statements the purchase of trucks was assumed to have been
undertaken within the year of study. Ordinarily, the cash flows for the years would otherwise
be positive or much higher than the figures represented below. In that respect revenue and
revenue items are projected over the next five years to ascertain the possible cash and cash
equivalent positions for the business. The analysis and projections are for the top performing
businesses in each truck category that is one truck, two trucks and four trucks. This approach
was based on the within category analsys undertaken earlier.
A. One truck operator’s cash flow projection for 5 years : IRR, NPV, Cash Flow and ROE-
Nairobi
Using the information on income statements (Table 3-79 ), the revenue projections (Table
3-103) for the one truck operator were generated for a period of 5 years. This operator was as
well as others in this category were profitable on a cashbasis and also profitable after charging
depreciation. The cash flows improve in the first 2 years and then begin to decline; this is
because operating expenses are rising rapidly faster than the revenues. The results indicate that
the end value of cash flows is smaller than the initial investment and is also negative.
Table 3-103 : One Truck Operator Cash Flow Projections for 5 years –Nairobi
Income Statement Year 1 Actual Year 2 Projected Year 3
Projected Year 4 Projected
Year 5 Projected
$ $ $ $ $ Revenue 27,893 32,724 38,392 45,042 52,843 Less: operating expenses 21,258 24,351 30,706 43,589 72,055 EBITDA 6,635 8,373 7,687 1,453 (19,212) Less depreciation (3,400) (3,400) (3,400) (3,400) (3,400) EBIT 3,235 4,973 4,287 (1,947) (22,612) Total tax payable 1,991 2,512 2,306 436 (5,764) EAITDA 1,245 2,461 1,981 (2,383) (16,848) Balance Sheet - year end Assets Vehicle 13,600 10,200 6,800 3,400 - Closing cash 8,045 9,261 8,781 4,417 (10,048) Liabilities

The Bill & Melinda Gates Foundation CHAPTER 3 : RESULTS AND ANALYSIS OF URBAN FSM PRACTICE Landscape Analysis and Business Model Assessment in Fecal Sludge Management: Extraction and Transportation Models in
Africa - Kenya
LOSAI MANAGEMENT LIMITED 3-135
Owner's equity Opening equity 17,000 17,000 17,000 17,000 17,000 Add: annual net EAITDA 4,645 10,506 15,887 16,904 3,456 Net owner's equity 21,645 27,506 32,887 33,904 20,456 21,645 27,506 32,887 33,904 20,456 Return on Equity (ROE) 21% 38% 48% 50% 17% Average annual 5 year ROE 35%
Based on the one truck operator’s cash flow projection for 5 years (Table 3-103) the
corresponding NPV estimate indicates (Table 3-104) that the rate of return falls below the
discount rate of 15% p.a. This result is consistent with the negative end value of cashflows and
the negativity of the ROE over the years.
Table 3-104 : One Truck operator’s NPV,IRR – Nairobi
5 year analysis NPV @15% discount rate (521) Avg 5 yr monthly cash to operator 691
As the operating expenses rise at a higher rate than the revenues, the emptier will be required to increase tariffs, cut costs or increase the number of trips as a way of increasing revenue in order to mitigate the arising loss position in the future. The growth in trips needs to be much higher than the growth in costs for the operator to sustain this. Present value
Value of Firm
Where; PV – Present Value TR- Total Revenue TC- Total Cost π – Periodic cash flows r- Rate of return t- Time
1 21 2
1(1 ) (1 ) (1 ) (1 )
nn t
n tt
PVr r r r
π ππ π=
= + + + =+ + + +∑
1 1(1 ) (1 )
n nt t t
t tt t
TR TCValueof Firmr r
π= =
−= =
+ +∑ ∑

The Bill & Melinda Gates Foundation CHAPTER 3 : RESULTS AND ANALYSIS OF URBAN FSM PRACTICE Landscape Analysis and Business Model Assessment in Fecal Sludge Management: Extraction and Transportation Models in
Africa - Kenya
LOSAI MANAGEMENT LIMITED 3-136
B. Two truck operator’s cash flow projection for 5 years : IRR, NPV, Cash Flow and ROE-
Nairobi
Using the information on income statements (Table 3-81 ), the revenue projections (Table
3-105) for the two truck operator were generated for a period of 5 years. This operator was the
only profitable one in this category as all others in this category were unprofitable. This
operator was profitable on a cashbasis and also profitable after charging depreciation.
The cash flows improve in the first 2 years and then begin to decline; this is because operating
expenses are rising rapidly faster than the revenues. The results indicate that the end value of
cash flows is smaller than the initial investment and is also negative.
Table 3-105 : Two Truck Operator Cash Flow Projections for 5 years–Nairobi
Income Statement Year 1 Actual
Year 2 Projected
Year 3 Projected
Year 4 Projected
Year 5 Projected
$ $ $ $ $ Revenue 57,024 66,901 78,488 92,082 108,030 Less: operating expenses 36,282 41,174 50,482 67,668 103,244 EBITDA 20,742 25,727 28,006 24,414 4,786 Less: depreciation (5,600) (5,600) (5,600) (5,600) (5,600) EBIT 15,142 20,127 22,406 18,814 (814) Total tax payable 6,223 7,718 8,402 7,324 1,436 EAITDA 8,919 12,409 14,004 11,490 (2,250) Balance Sheet - year end Assets Vehicle 22,400 16,800 11,200 5,600 - Closing cash 25,719 29,209 30,804 28,290 14,550 Liabilities Owner's equity Opening equity 28,000 28,000 28,000 28,000 28,000 Add annual net EAITDA 20,119 43,728 68,932 91,622 100,572 Net owner's equity 48,119 71,728 96,932 119,622 128,572 48,119 71,728 96,932 119,622 128,572 Return on Equity (ROE) 42% 61% 71% 77% 78% Average annual 5 year ROE 66%

The Bill & Melinda Gates Foundation CHAPTER 3 : RESULTS AND ANALYSIS OF URBAN FSM PRACTICE Landscape Analysis and Business Model Assessment in Fecal Sludge Management: Extraction and Transportation Models in
Africa - Kenya
LOSAI MANAGEMENT LIMITED 3-137
Based on the two truck operator’s cash flow projection for 5 years (Table 3-105) the
corresponding NPV estimate indicates (Table 3-106) that the rate of return falls below the
discount rate of 15% p.a. This result is consistent with the negative end value of cashflows and
the negativity of the ROE over the years.
Table 3-106 : Two Truck operator’s NPV,IRR – Nairobi
5 year analysis
NPV @15% discount rate (20) Avg 5 yr monthly cash to operator 20114
As the operating expenses rise at a higher rate than the revenues, the emptier will be required to increase tariffs, cut costs or increase the number of trips as a way of increasing revenue in order to mitigate the arising loss position in the future. The growth in trips needs to be much higher than the growth in costs for the operator to sustain profitability. Present value
Value of Firm
Where; PV – Present Value TR- Total Revenue TC- Total Cost π – Periodic cash flows r- Rate of return t- Time
C. Four Truck operator’s cash flow projection for 5 years : IRR, NPV, Cash Flow and ROE-
Nairobi
Using the information on income statements (Table 3-83 ), the revenue projections (Table
3-107) for the four truck operator were generated for a period of 5 years. This operator was the
only profitable one in this category as the other operator in this category was unprofitable. This
operator was profitable both on a cashbasis and also profitable after charging depreciation.
1 21 2
1(1 ) (1 ) (1 ) (1 )
nn t
n tt
PVr r r r
π ππ π=
= + + + =+ + + +∑
1 1(1 ) (1 )
n nt t t
t tt t
TR TCValueof Firmr r
π= =
−= =
+ +∑ ∑

The Bill & Melinda Gates Foundation CHAPTER 3 : RESULTS AND ANALYSIS OF URBAN FSM PRACTICE Landscape Analysis and Business Model Assessment in Fecal Sludge Management: Extraction and Transportation Models in
Africa - Kenya
LOSAI MANAGEMENT LIMITED 3-138
The cash flows improve in the first 2 years and then begin to decline; this is because operating
expenses are rising rapidly faster than the revenues. The results indicate that the end value of
cash flows is smaller than the initial investment and is also negative.
Table 3-107 : Four Truck Operator Cash Flow Projections for 5 years – Nairobi
Income Statement Year 1 Actual Year 2 Projected Year 3
Projected Year 4 Projected
Year 5 Projected
$ $ $ $ $ Revenue 128,928 151,258 177,456 208,192 244,251 Less: operating expenses 110,206 122,831 148,635 198,276 304,157 EBITDA 18,722 28,428 28,821 9,915 (59,906) Less: depreciation (30,000) (30,000) (30,000) (30,000) (30,000) EBIT (11,278) (1,572) (1,179) (20,085) (89,906) Total tax payable (3,383) (472) (354) (6,025) (26,972) EAITDA (7,895) (1,101) (825) (14,059) (62,934) Balance Sheet - year end Assets Vehicle 120,000 90,000 60,000 30,000 - Closing cash 22,105 28,899 29,175 15,941 (32,934) Liabilities Owner's equity Opening equity 150,000 150,000 150,000 150,000 150,000 Add annual net EAITDA (7,895) (8,995) (9,821) (23,880) (86,814) Net owner's equity 142,105 141,005 140,179 126,120 63,186 142,105 141,005 140,179 126,120 63,186 Return on Equity (ROE) -10% -9% -7% -5% -4% Average annual 5 year ROE -7%
Based on the four truck operator’s cash flow projection for 5 years (Table 3-107) the
corresponding NPV estimate indicates (Table 3-108) that the rate of return falls below the
discount rate of 15% p.a. This result is consistent with the negative end value of cashflows and
the negativity of the ROE over the years.

The Bill & Melinda Gates Foundation CHAPTER 3 : RESULTS AND ANALYSIS OF URBAN FSM PRACTICE Landscape Analysis and Business Model Assessment in Fecal Sludge Management: Extraction and Transportation Models in
Africa - Kenya
LOSAI MANAGEMENT LIMITED 3-139
Table 3-108 : Four Truck operator’s NPV,IRR – Nairobi
5 year analysis NPV @15% discount rate (7,873) Avg 5 yr monthly cash to operator (17,363)
As the operating expenses rise at a higher rate than the revenues, the emptier will be required
to increase tariffs, cut costs or increase the number of trips as a way of increasing revenue in
order to mitigate the arising loss position in the future. The growth in trips needs to be much
higher than the growth in costs for the operator to sustain profitability.
3.4.1.3 Sensitivity and Risks Analysis
Kisumu City
The trucks in use have an average age of 25 years, are inefficient and use old technology which
is expensive. These aged trucks experience numerous breakdowns and thus slow down the
possible number of trips achievable. Moreover the truck owner has no way of validating the
number of trips made since clients are not issued with receipts and the dumping site which is
also not properly fenced and largely unmanned therefore the truck drivers do not record the
trips they make. The truck owners incur more cost trying to monitor the business. The
operating environment and the equipment in use exposes the business in Kisumu to greater
risk, however minor changes may be able to radically shift this unfavourable to favourable
environment given the unmet demand for mechanical emptying services in Kisumu.
Mombasa City
The trucks in use by most operators are old meaning they are inefficient and use old technology
which is expensive. Some operators have trucks with smaller capacity and they have better
chance of increasing their revenues especially when they are dealing with large institutions
since they can make numerous trips and as billings is made against trips as opposed to truck
capacity. However, small sized truck owners also tend to be one or two truck owners.
In general the truck owner has no way of validating the number of trips made since all clients
are not issued with receipts. For large truck owners there is a chance the the truck can exhsuat
twice on a single trip and report it a single trip to the owner.

The Bill & Melinda Gates Foundation CHAPTER 3 : RESULTS AND ANALYSIS OF URBAN FSM PRACTICE Landscape Analysis and Business Model Assessment in Fecal Sludge Management: Extraction and Transportation Models in
Africa - Kenya
LOSAI MANAGEMENT LIMITED 3-140
Nairobi City
The trucks in use have an average age of 25 years meaning they are inefficient and use old
technology which is expensive.The presence of only one tipping point implies very long
distances for the truck, and hence lowers the likelihood of more than one trip per day.
Moreover poor enforcement has also reduced and impeded the demand for ME services as
households engage manual emptiers or connect to storm drains.
3.4.1.4 Access to finance
Kisumu City
None of the private truck owners interviewed used loan facilities. It was also found that the
truck owners operate other businesses unrelated to FSM (Table 3-109).
Table 3-109 : Access to Finance - Kisumu
What % of the private truck owners take loans? 0 What are bank interest rate and years for repayment? N.A Are the rest self-financing? Yes Do they run any other business from which they get this self-finance money? Yes What % of the FS emptying owners does this as their main business? 0
Mombasa City
None of the private truck owners interviewed used loan facilities. It was also found that the
truck owners operate other businesses unrelated to FSM
Nairobi City
Only one of the private truck owners interviewed use loan facilities. It was also found that the
truck owners operate other businesses unrelated to FSM. Access to finance remains a big
challenge on three fronts.
Rate of Interest: The rates of interest on lending have remained very high in the economy over
the last 20 years. This has deterred borrowing as the business would experience challenges in
making payments.
Credit limits: Access to credit at micro finance institutions falls well below what is required to
acquire the key asset in mechanical emptying services, namely the truck. MFI would have to

The Bill & Melinda Gates Foundation CHAPTER 3 : RESULTS AND ANALYSIS OF URBAN FSM PRACTICE Landscape Analysis and Business Model Assessment in Fecal Sludge Management: Extraction and Transportation Models in
Africa - Kenya
LOSAI MANAGEMENT LIMITED 3-141
raise their credit limit but even then the MFI’s would have to lend at lower interest rates than
they have been in the past.
Lack of Lease financial services for the sector: Lease finance tends to be at lower rates of
interest; however, since there is no equipment supplier in Kenya for specialized mechanical
emptying trucks, this has not developed. Thus whereas a new truck chassis would be lease
financed, the value for money of the locally fabricated mechanical emptying truck falls below
the value for money of an imported specialized reconditioned emptying truck. As a
consequence it may be more beneficial to offer lease finance services for reconditioned
imported trucks.
3.4.1.5 Role of Public Sector in Business sustainability
FSM policy is generally lacking and as a consequence, the present framework of guiding private
sector stakeholders does not lend itself to developing a sustainable industry. A number of areas
are in need of public policy intervention
1. Regulation : This has to be centralized and formulated
2. Licensing: This is not coherent, the licensing regime and the whole system lacks
structure
3. Industry Incentives: These are non-existent and therefore private sector operators have
to pay to provide public infrastructure. For example the lack of sufficient tipping points
causes long distance travel, which reduces the overall service rate of the industry.
4. Taxation: Fiscal incentives lack for this industry even which may be deserved since the
service often qualifies as an essential service
3.4.1.6 Business Analysis of Wastewater Treatment Plants in the cities
None of the cities have dedicated treatment facilities for the feacal sludge collected. Only the
conventional waswater treatment plants are equipped with facilities to treat fecal sludge.
Unfortunately, currently all the fecal sludge collected in Nairobi and Kisumu is tipped and mixes
with sewage directed to stabilization ponds while faecal sludge in Mombasa is tipped at the
non-functional convential treatment plant.
All the wastewater treatmenet plants in the three cities are owned and operated by their
respective city water (public) companies. WWTP receive funds from budgetary allocations from
the water companies and are not autonomous neither are they expected to be financially self

The Bill & Melinda Gates Foundation CHAPTER 3 : RESULTS AND ANALYSIS OF URBAN FSM PRACTICE Landscape Analysis and Business Model Assessment in Fecal Sludge Management: Extraction and Transportation Models in
Africa - Kenya
LOSAI MANAGEMENT LIMITED 3-142
sustaining. Feacal Sludge revenues for the WWTP are at the moment insignificant (section
3.4.2.1.28).
3.4.1.7 Recommendations for Sustainable business models per city
Kisumu City
Three business models proposed for Kisumu are as follows:
1. Bio-centres as social enterprises: On the whole the Bio centres have proven to be self-
sustaining once capitalized and have demonstrated positive health externalities
particularly at the low income household levels. There has been recorded success by the
activities of Umande Trust. This model should be pursued.
2. Microfinance targeted at Sanitation services: A microfinance model and fund targeted at
sanitation services would enhance access to credit to the sub-sector. This is already in
place with SANA which has been operating such a scheme albeit at a micro level. This
model should be pursued.
3. Treatment plants enhancement for product drying, packaging and distribution. Treated
FS is more affordable than commercial fertilizers. The acceptability of treated FS re-use
would be raised by increased public education, though already there is FR-re-use
acceptability. Investing in modernizing FSTP to rely less on weather for the drying
process would increase annual output. Kenya has wet conditions for 8 months of the
year. In addition, because of the bulky nature of treated FS packaging would ease
transportation and distribution to market. The large share of agriculture in the economy
at 24% of GDP would offer a market for the use of treated FS. Kisumu is surrounded by
large agricultural farms and therefore treated FS would be in great demand due to its
low cost.
Mombasa City
Bio-centres as social enterprises: A number of sanitation blocks have been constructed as
private public partnerships in the town. These have been successful. The demand for these
facilities however exceeds supply and in particular to progress, these bio-centres need to
undertake FS-reuse such as biogas production. This model is in place with Excloosive (section
B.3.14 -b) and Umande. The existing operations should be upgraded.

The Bill & Melinda Gates Foundation CHAPTER 3 : RESULTS AND ANALYSIS OF URBAN FSM PRACTICE Landscape Analysis and Business Model Assessment in Fecal Sludge Management: Extraction and Transportation Models in
Africa - Kenya
LOSAI MANAGEMENT LIMITED 3-143
Nairobi City
Three business models proposed.
1. Bio-centres as social enterprises: On the whole the Bio centres have proven to be self-
sustaining once capitalized and have demonstrated positive health externalities
particularly at the low income household levels. There has been recorded success by the
activities of Umande Trust. This model should be pursued.
2. Microfinance targeted at Sanitation services: A microfinance model and fund targeted at
sanitation services would enhance the access to credit to the sub-sector. This model
should be introduced and supported.
3. Treatment plants enhancement for product drying, packaging and distribution. Treated
FS is more affordable than commercial fertilizers. The acceptability of treated FS re-use
would be raised by increased public education, though already there is FR-re-use
acceptability. Investing in modernizing FSTP to rely less on weather for the drying
process would increase annual output. Kenya has wet conditions for 8 months of the
year. In addition, because of the bulky nature of treated FS packaging would ease
transportation and distribution to market. The large share of agriculture in the economy
at 24% of GDP would offer a market for the use of treated FS. Nairobi is surrounded by
large areas engaged in farming and treated FS is by far much cheaper than commercial
fertilizers.
3.4.2 Country Level (across cities)
3.4.2.1 Difference in Parameters across three cities
3.4.2.1.1 General
Formal financial records for the operators were difficult to obtain. Moreover, there was varying
quality on operational data that would provide inference on financial performance of
operators. However by cross referencing various data sources it was possible to corroborate
information on key financial indicators such as tariff, wages, fuel and motor vehicle service
costs. Taken together these sources of information were used to construct financial data for the
operators, which were then analyzed.
3.4.2.1.2 Income statements

The Bill & Melinda Gates Foundation CHAPTER 3 : RESULTS AND ANALYSIS OF URBAN FSM PRACTICE Landscape Analysis and Business Model Assessment in Fecal Sludge Management: Extraction and Transportation Models in
Africa - Kenya
LOSAI MANAGEMENT LIMITED 3-144
The analysis of the results obtained indicates operating consistency between the operators
operating in the three cities surveyed; and there are no noticeable outlier estimates. For the
case of Kisumu and Mombasa, only one operator was interviewed for each category of trucks
owned and operated. In Nairobi 16 operators were interviewed. However, for purposes of the
analysis, the best performing operator in Nairobi was selected and marked against comparable
operators in Kisumu and Mombasa in the corresponding category of number of trucks owned.
When depreciation is included in the financial estimates, most operators are found to be
unprofitable. However on a cash basis the mechanical operators remain profitable.
In the absence of a proper accounting framework, the businesses represent strong cash flow,
low debtors but equally thin margins in absolute terms. Under these circumstances, the existing
business models may on a short term basis be self-sustaining but they may not be self-
sustaining in the medium and long term. Periodic cash surpluses are consumed by intermittent
but high cost of repairs as shown by the impact of depreciation on the bottom line.
Alternatively, probably all businesses are profitable, but the reported number of trips per truck
is understated to give the impression of low profitability. The short depreciation period also
meant a very large charge on the profits, assuming a longer horizon would have provided a
lesser aggressive charge on profits.
One truck operators
The broad framework of emptiers in the 3 cities is identical. Trucks are licensed on a unit basis
by the national environmental agency. Each city has 2 treatment plants of either kind,
conventional or stabilization ponds. Dumping in the 3 cities is centralized and as such there is
only one designated tipping point in each of the 3 cities. There are more similarities than
differences amongst the operators and in some instances some are branch outlets, therefore
operating in more than one city. In addition, in all the cities the FSM sub sector policy
framework is under developed and in urgent need of formulation. Mechanical emptying
services are 100% provided by the private sector with the public sector playing varied
regulatory and oversight role. The degree of oversight across the cities is generally licensing and
less of enforcement. The comparison of One Truck Operators (Table 3-110) indicates several
impacts including that of service tariff, size of truck, number of trips and structure of business.
Among other things the tariffs across the 3 towns are different. However, the Mombasa
Operator has fixed personnel costs few trips and the business is diversified, and therefore the
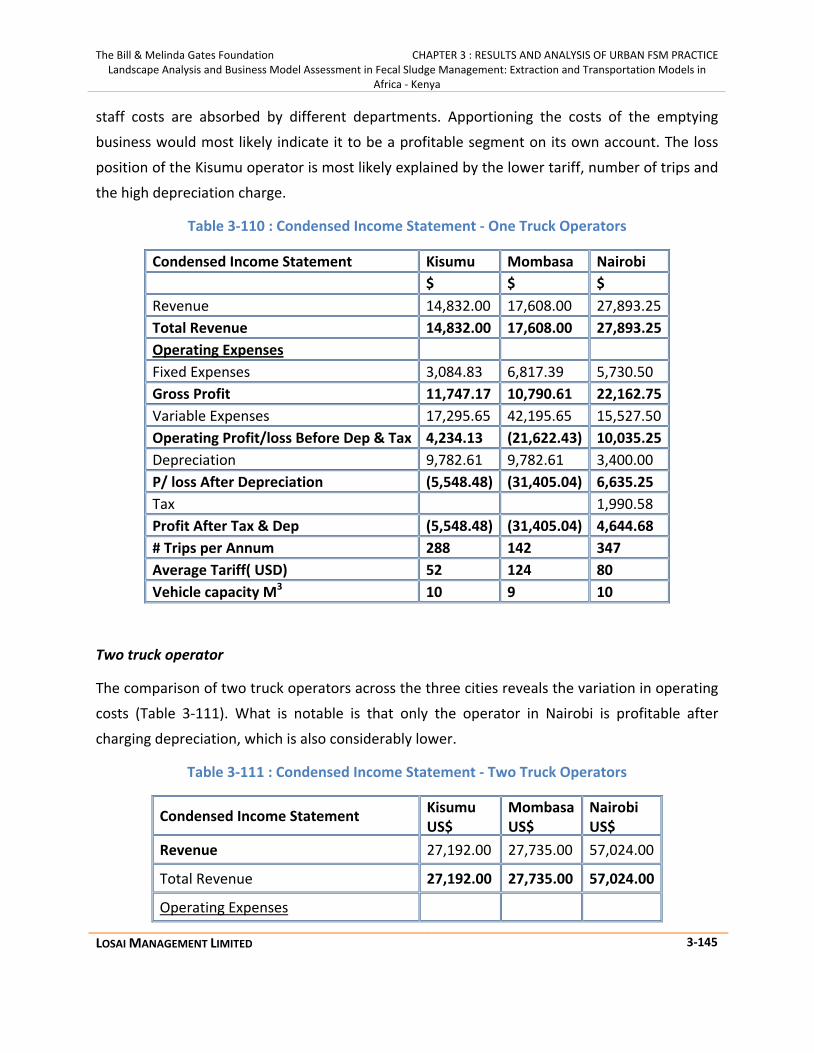
The Bill & Melinda Gates Foundation CHAPTER 3 : RESULTS AND ANALYSIS OF URBAN FSM PRACTICE Landscape Analysis and Business Model Assessment in Fecal Sludge Management: Extraction and Transportation Models in
Africa - Kenya
LOSAI MANAGEMENT LIMITED 3-145
staff costs are absorbed by different departments. Apportioning the costs of the emptying
business would most likely indicate it to be a profitable segment on its own account. The loss
position of the Kisumu operator is most likely explained by the lower tariff, number of trips and
the high depreciation charge.
Table 3-110 : Condensed Income Statement - One Truck Operators
Condensed Income Statement Kisumu Mombasa Nairobi $ $ $ Revenue 14,832.00 17,608.00 27,893.25 Total Revenue 14,832.00 17,608.00 27,893.25 Operating Expenses Fixed Expenses 3,084.83 6,817.39 5,730.50 Gross Profit 11,747.17 10,790.61 22,162.75 Variable Expenses 17,295.65 42,195.65 15,527.50 Operating Profit/loss Before Dep & Tax 4,234.13 (21,622.43) 10,035.25 Depreciation 9,782.61 9,782.61 3,400.00 P/ loss After Depreciation (5,548.48) (31,405.04) 6,635.25 Tax 1,990.58 Profit After Tax & Dep (5,548.48) (31,405.04) 4,644.68 # Trips per Annum 288 142 347 Average Tariff( USD) 52 124 80 Vehicle capacity M3 10 9 10
Two truck operator
The comparison of two truck operators across the three cities reveals the variation in operating
costs (Table 3-111). What is notable is that only the operator in Nairobi is profitable after
charging depreciation, which is also considerably lower.
Table 3-111 : Condensed Income Statement - Two Truck Operators
Condensed Income Statement Kisumu US$
Mombasa US$
Nairobi US$
Revenue 27,192.00 27,735.00 57,024.00
Total Revenue 27,192.00 27,735.00 57,024.00
Operating Expenses

The Bill & Melinda Gates Foundation CHAPTER 3 : RESULTS AND ANALYSIS OF URBAN FSM PRACTICE Landscape Analysis and Business Model Assessment in Fecal Sludge Management: Extraction and Transportation Models in
Africa - Kenya
LOSAI MANAGEMENT LIMITED 3-146
Fixed Expenses 10,943.52 6,641.30 14,181.52
Gross Profit 16,248.48 21,093.70 42,842.48
Variable Expenses 25,304.35 27,978.26 19,856.00
Operating Profit/loss Before Dep & Tax 10,509.35 12,680.65 28,586.48
Depreciation 19,565.22 19,565.22 5,600.00
P/loss After Depreciation (9,055.87) (6,884.57) 22,986.48
Tax 6,895.94
Profit after tax (9,055.87) (6,884.57) 16,090.54
# Trips per Annum 528 258 528
Average Tariff( USD) 52 108 108 Vehicle capacity M3 Truck 1
T 6 5.6 10
Truck 2 8 5.6 10
Four Truck operators
Generally 4 truck operators are profitable and exhibit economies of scale, but more likely
supported by more trips. In addition operators of larger fleet tended to have also large capacity
vehicles and therefore were able to charge higher service tariffs. There were no 4 truck
operators in Kisumu (Table 3-112).
Table 3-112 Condensed Income Statement - Four Truck Operators
Condensed Income Statement Kisumu US$
Mombasa US$
Nairobi US$
Revenue 128,928.00 66,961.11 Total Revenue 128,928.00 66,961.11 Operating Expenses Fixed Expenses 23,086.00 24,393.48 Gross Profit 105,842.00 42,567.63 Variable Expenses 87,120.00 54,013.04 Operating Profit/loss Before Dep & T
48,722.00 81,698.07 Depreciation 30,000.00 39,130.43

The Bill & Melinda Gates Foundation CHAPTER 3 : RESULTS AND ANALYSIS OF URBAN FSM PRACTICE Landscape Analysis and Business Model Assessment in Fecal Sludge Management: Extraction and Transportation Models in
Africa - Kenya
LOSAI MANAGEMENT LIMITED 3-147
P/loss After Depreciation 18,722.00 42,567.63 Tax 5,616.60 12,770.29 Profit after tax 13,105.40 29,797.34
# Trips per Annum 326 1,632
Average Tariff( USD) 205 79 Vehicle capacity M3 Truck 1
T 22 10
Truck 2 22 10
Truck 3 20 20
Truck 4 18 20
3.4.2.1.3 Cash Flow Statements for Mechanical Emptiers - Case of Kenya (Three Cities)
One truck operator’s cash flow statement
Cash flow is important because it underlies the ability of a business to meet its day to day
operations. In the emptying business, there are few debtors and most sales are collected
immediately after service. Single truck operators have positive cash flows, though the Kisumu
and Mombasa operators are unprofitable (Table 3-113). The combination of losses and positive
cash flow imply there are numerous occasions of deficit financing especially during periods of
vehicle repairs, when the owners have to obtain debt.
Table 3-113 : One Truck Operators Cash Flow Statement
Cash flow Statement Kisumu US$
Mombasa US$
Nairobi US$
Investment Cash flow (48,913.04) (48,913.04) (17,000.00) - - - - Cash flow from operation - - Net Profit After Tax &Depreciation (5,548.48) (31,405.04) 4,644.68 Add Back : - - Depreciation 9,782.61 9,782.61 3,400.00 - - Net Cash flow from Operation 4,234.13 (21,622.43) 8,044.68 Net Cash flow (44,678.91) (70,535.48) (8,955.33)

The Bill & Melinda Gates Foundation CHAPTER 3 : RESULTS AND ANALYSIS OF URBAN FSM PRACTICE Landscape Analysis and Business Model Assessment in Fecal Sludge Management: Extraction and Transportation Models in
Africa - Kenya
LOSAI MANAGEMENT LIMITED 3-148
Line items to calculate taxation Truck Costs 48,913.04 48,913.04 17,000.00 Depreciation 20%* cost 9,782.61 9,782.61 3,400.00 Book value of vehicle at year end 39,130.43 39,130.43 13,600.00 # Trips per Annum 288 142 347 Average Tariff( USD) 52 124 80 Vehicle capacity M3 10 9 10
Two trucks operators cash flow statement
The high depreciation charges undermine profitability. The financial performance and cash flow
position of a single truck owner and a two truck owner is somewhat identical (Table 3-114). This
may stem from the nature of the emptying operations, where single truck owners may be
unable to secure large emptying contracts and rely more on small volume household customers
who provide irregular demand for services.
Table 3-114 : Two Trucks Operators Cash Flow Statement
Cash flow Statement Kisumu US$
Mombasa US$
Nairobi US$
Investment Cash flow (97,826.09) (97,826.09) (28,000.00) Cash flow from operation Net Profit After Tax &Depreciation (9,055.87) (6,884.57) 16,090.54 Add Back : Depreciation 19,565.22 19,565.22 5,600.00 Net Cash flow from Operation 10,509.35 12,680.65 21,690.54 Net Cash flow (87,316.74) (85,145.43) (6,309.46) Line items to calculate taxation Truck Costs 97,826.09 97,826.09 28,000.00 Depreciation 20%* cost 19,565.22 19,565.22 5,600.00 Book value of vehicle at year end 78,260.87 78,260.87 22,400.00 # Trips per Annum 528 258 528 Average Tariff( USD) 52 108 108 Vehicle capacity M3 Truck 1 6 5.6 10 Truck 2 8 5.6 10

The Bill & Melinda Gates Foundation CHAPTER 3 : RESULTS AND ANALYSIS OF URBAN FSM PRACTICE Landscape Analysis and Business Model Assessment in Fecal Sludge Management: Extraction and Transportation Models in
Africa - Kenya
LOSAI MANAGEMENT LIMITED 3-149
Four trucks operator cash flow statement
The 4 truck operators have strong positive cash flows (Table 3-115). In the absence of revenue
leakages, the larger operators can easily leapfrog their business size buy financing the purchase
of more trucks and enhance the economies of scale of their operations.
Table 3-115 : Four trucks operator cash flow statement
Cash flow Statement Mombasa $
Nairobi $
Investment Cash flow (195,652.17) (150,000.00) - - - - Cash flow from operation - - Net Profit After Tax &Depreciation 29,797.34 13,105.40 Add Back : - - Depreciation 39,130.43 30,000.00 - - Net Cash flow from Operation 68,927.78 43,105.40 Net Cash flow (126,724.40) (106,894.60) Line items to calculate taxation Truck Costs 195,652.17 150,000.00 Depreciation 20%* cost 39,130.43 30,000.00 Book value of vehicle at year end 156,521.74 120,000.00 # Trips per Annum 326 1,632 Average Tariff( USD) 205 79 Vehicle capacity M3 Truck 1
T 22 10
Truck 2 22 10 Truck 3 20 20 Truck 4 18 20
Given the reported number of trips by the operators accounting profit is possible for most
operators if the depreciation charge is omitted. Thus if the depreciation charge is viewed as a
proxy of loan repayment, then the businesses would be unable to support debt servicing, at the
reported tariffs and number of trips.

The Bill & Melinda Gates Foundation CHAPTER 3 : RESULTS AND ANALYSIS OF URBAN FSM PRACTICE Landscape Analysis and Business Model Assessment in Fecal Sludge Management: Extraction and Transportation Models in
Africa - Kenya
LOSAI MANAGEMENT LIMITED 3-150
Negative cash flows because of the depreciation charge unmask the real profits of the business
and indicate the nature of the business. An increase in the tariff (fees) and an increase in the
number of trips offer an appreciable increase in revenues which would offers far much higher
income relative to costs for the operator. An increase in number of trips would easily offset the
corresponding increase in costs.
Data on number of trips was difficult to obtain. As a result, one reason for the apparent
underperformance by the operators would be explained by underreporting of the number of
trips. Data obtained from a dumping site registry showed that some operators were able to
achieve more than 40 trips per month on a single truck. This data could not be validated for
being applicable to all operators.
3.4.2.1.4 Overview of Existing Business models
Operating environment
There are 4 business models in place. These include
1. Manual emptiers
2. Mechanical emptiers
3. Bio-centers and aggregators
4. FS processors
Fecal sludge management business can be considered a growing sub sector, particularly
because of the increasing number of un-sewered households in urban populations. The need
for service providers to offer reliable extraction and disposal of FS and other solid waste is as
such to be anticipated.
Manual and Mechanical Operators
The business models here often combine extraction, transportation and disposal of FS. A
number of operators cited having identified the need for such services in the society as the
reason they chose to start their businesses. Overtime FSM in the area of manual and
mechanical emptying has become very competitive and though tariffs remain high in most
areas.

The Bill & Melinda Gates Foundation CHAPTER 3 : RESULTS AND ANALYSIS OF URBAN FSM PRACTICE Landscape Analysis and Business Model Assessment in Fecal Sludge Management: Extraction and Transportation Models in
Africa - Kenya
LOSAI MANAGEMENT LIMITED 3-151
Bio-centres and Aggregators
This business model combines provision of sanitation services and re-use of treated FS. Pricing
for use of sanitation facilities is aimed at enhancing access over financial return. However the
sale of treated FS in the re-use option particularly as biogas aims at providing a sustainable and
viable financial return. Bio-centres also operate as micro commercial centres, with rental
offices, meeting rooms and cyber shops for internet access.
FS Processors
This business model combines disposal sites, treatment plants and production of treated FS for
re-use. The common treated FS for re-use takes the form of solid and liquid fertilizers. There is a
general underdevelopment of the FS processors business model. In the cities studied all the
Utilities were found to operate FS processors limited only to FS treatment.
3.4.2.1.5 Ownership Structure, Business Financing
Most of the businesses can be categorized into three main broad categories in terms of their
ownership structures; namely sole proprietorships, partnerships and limited liability companies
(corporations). The decision to assume a certain business model is largely influenced by the
capital intensity of the business particularly since start-up capital is a barrier to entry. Most of
the manual and mechanical emptier businesses are sole proprietorships or partnerships (Table
3-116).
Table 3-116 : Business Ownership Structures
Mode of operations Common business Type
Manual Emptiers Informal and not registered, Sole proprietors,
Mechanical Emptiers Sole proprietors, partnerships and limited liability companies
Bio-Digesters & Aggregators Limited liability companies and NGO set ups
FS Processors Utility corporations set up as Limited liability companies partially owned by the government.
In most instances startup capital is from personal savings and borrowings from friends and
relatives. Bank credit is often accessed for expansion or fleet replacement purposes when the
entrepreneur has developed sufficient track record of operations. In the case of bank credit, the
vehicle log book acts as the collateral for the loan facility.
The Bill & Melinda Gates Foundation CHAPTER 3 : RESULTS AND ANALYSIS OF URBAN FSM PRACTICE Landscape Analysis and Business Model Assessment in Fecal Sludge Management: Extraction and Transportation Models in
Africa - Kenya
LOSAI MANAGEMENT LIMITED 3-152
For the case of partnerships, in the mechanical emptier business, the partners tended to be
family members and predominantly husband and wife. In the case of limited liability set ups,
the shareholders were found to be predominantly relatives and for all survey cases these were
family owned businesses.
In both cases of the sole proprietor or the partnership the entrepreneurs retain the right of
management of the business and will often be the one (s) to formulate and implement the
businesses’ strategies.
In Kenya few of these mechanical emptying businesses will take the form of a corporate body
during inception due to the complexities of forming and registering a limited liability company.
In addition to the unfamiliarity with typical corporate structure, the legal obligations tend to be
overwhelming and requiring formal frameworks of auditors, lawyers and legal company
representatives. Only after years of operations, and having been able to mobilize adequate
resources, are entrepreneurs willing to consider transforming their businesses into a limited
company with more elaborate corporate structures. This transformation is however nudged by
regulators, bankers or potential partners who then provide owners with an opportunity to
expand their operations.
3.4.2.1.6 Economic Viability, Revenue and Profit Drivers
Economic viability of the mechanical emptying business depends on the level of demand for the
service, use of the right equipment and appropriate scale. The appropriate equipment include
custom made trucks to allow for suction and disposal of fecal substance, proper car parking
facility, garage and an ideally located disposal point. It is also important that enforcement takes
place to combat malpractice etc.
In the past, truck fabrication has been taking place, but more recently operators prefer to buy
reconditioned custom made trucks as these are found to be more durable and have lower
maintenance costs. A locally fabricated truck based on a second hand chassis costs USD 20,000
whereas a reconditioned custom made truck costs USD 48,000. Industry malpractice such as
illegal dumping, disposal into storm drains and the presence of manual emptiers undermines
the demand for mechanical emptying of FS.

The Bill & Melinda Gates Foundation CHAPTER 3 : RESULTS AND ANALYSIS OF URBAN FSM PRACTICE Landscape Analysis and Business Model Assessment in Fecal Sludge Management: Extraction and Transportation Models in
Africa - Kenya
LOSAI MANAGEMENT LIMITED 3-153
3.4.2.1.7 Value chain Structure
Fecal sludge management process starts from the households and terminates at a dumping
site, FSTP or as re-usable material. Often this process will go through a series of value addition
stages. There are three main value chain structures;
1 Households
On-site
Extraction
Dumpsite
2 Households
On-site
Extraction
Bio-centre
Re-use Extraction Dumpsite
3 Households
On-site
Extraction
FSTP
Re-use
3.4.2.1.8 Service delivery models
Overview of FSM service delivery models
There are four service delivery models:
• Utility companies; these provide:
Connection to sewer
Sewer infrastructure
Mechanical emptying at a lower fee
• Local Authorities; these provide:
sewer infrastructure
Public toilets and public toilet infrastructure
Mechanical emptying at a lower fee (not operational)
• Private emptiers; these provide:
Mechanical emptying services
Manual emptying services
Pay for use toilets often under concession or public private partnership with local
authority
FS treatment in collection aggregation bio centre facilities
FS re-use in bio-centres
• NGOs; these provide:
Pay for use toilets often under concession or Public private partnership with local
authority
FS re-use in Bio-centres for onsite cooking
FS-re-use through delivery of bio-gas by pipe infrastructure to homes
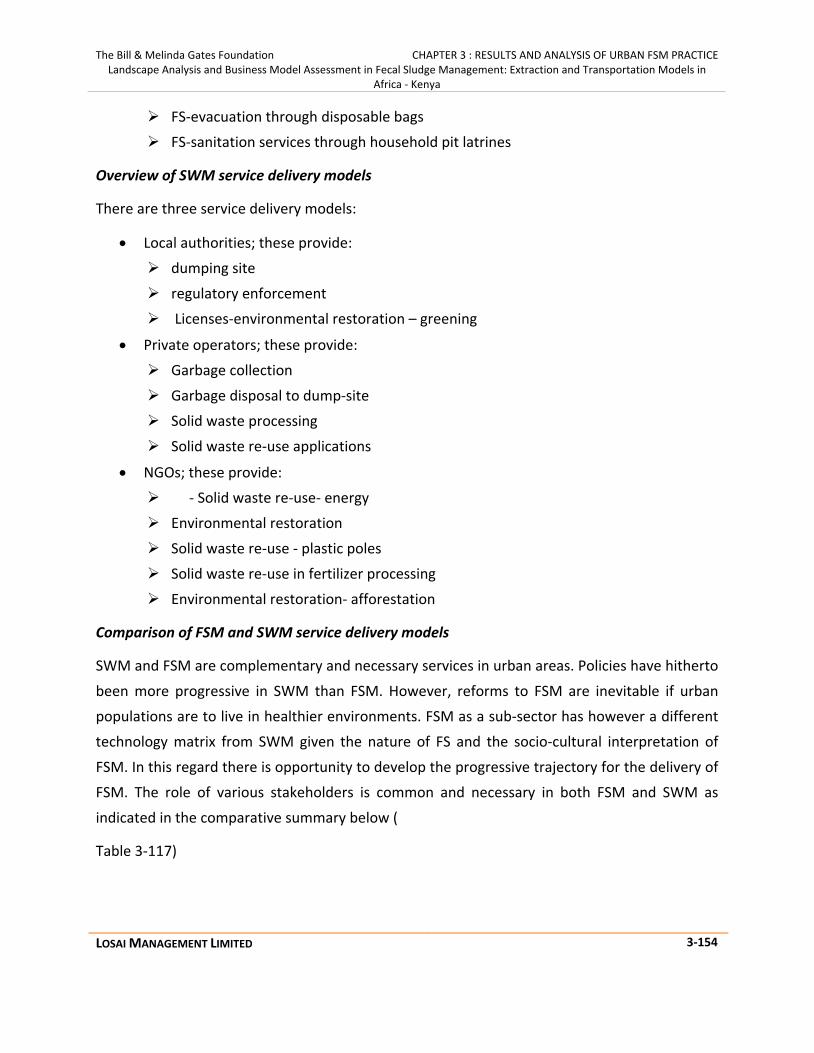
The Bill & Melinda Gates Foundation CHAPTER 3 : RESULTS AND ANALYSIS OF URBAN FSM PRACTICE Landscape Analysis and Business Model Assessment in Fecal Sludge Management: Extraction and Transportation Models in
Africa - Kenya
LOSAI MANAGEMENT LIMITED 3-154
FS-evacuation through disposable bags
FS-sanitation services through household pit latrines
Overview of SWM service delivery models
There are three service delivery models:
• Local authorities; these provide:
dumping site
regulatory enforcement
Licenses-environmental restoration – greening
• Private operators; these provide:
Garbage collection
Garbage disposal to dump-site
Solid waste processing
Solid waste re-use applications
• NGOs; these provide:
- Solid waste re-use- energy
Environmental restoration
Solid waste re-use - plastic poles
Solid waste re-use in fertilizer processing
Environmental restoration- afforestation
Comparison of FSM and SWM service delivery models
SWM and FSM are complementary and necessary services in urban areas. Policies have hitherto
been more progressive in SWM than FSM. However, reforms to FSM are inevitable if urban
populations are to live in healthier environments. FSM as a sub-sector has however a different
technology matrix from SWM given the nature of FS and the socio-cultural interpretation of
FSM. In this regard there is opportunity to develop the progressive trajectory for the delivery of
FSM. The role of various stakeholders is common and necessary in both FSM and SWM as
indicated in the comparative summary below (
Table 3-117)
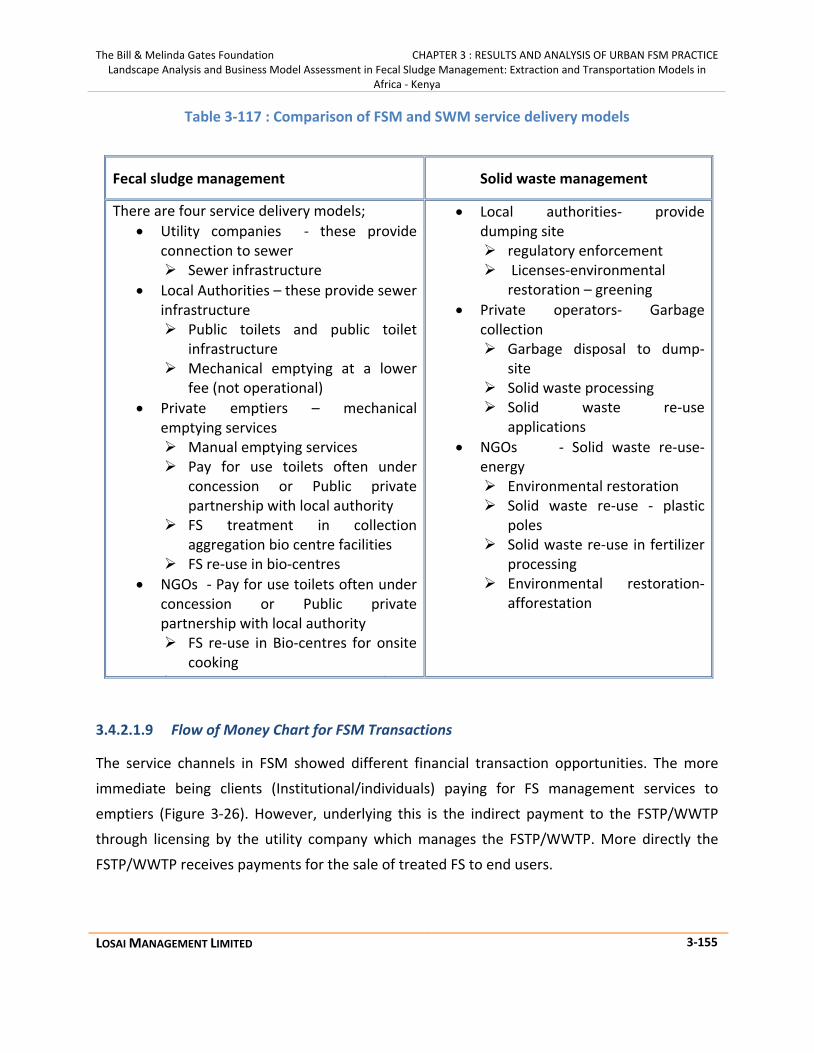
The Bill & Melinda Gates Foundation CHAPTER 3 : RESULTS AND ANALYSIS OF URBAN FSM PRACTICE Landscape Analysis and Business Model Assessment in Fecal Sludge Management: Extraction and Transportation Models in
Africa - Kenya
LOSAI MANAGEMENT LIMITED 3-155
Table 3-117 : Comparison of FSM and SWM service delivery models
3.4.2.1.9 Flow of Money Chart for FSM Transactions
The service channels in FSM showed different financial transaction opportunities. The more
immediate being clients (Institutional/individuals) paying for FS management services to
emptiers (Figure 3-26). However, underlying this is the indirect payment to the FSTP/WWTP
through licensing by the utility company which manages the FSTP/WWTP. More directly the
FSTP/WWTP receives payments for the sale of treated FS to end users.
Fecal sludge management Solid waste management
There are four service delivery models; • Utility companies - these provide
connection to sewer Sewer infrastructure
• Local Authorities – these provide sewer infrastructure Public toilets and public toilet
infrastructure Mechanical emptying at a lower
fee (not operational) • Private emptiers – mechanical
emptying services Manual emptying services Pay for use toilets often under
concession or Public private partnership with local authority
FS treatment in collection aggregation bio centre facilities
FS re-use in bio-centres • NGOs - Pay for use toilets often under
concession or Public private partnership with local authority FS re-use in Bio-centres for onsite
cooking h h d l f b
• Local authorities- provide dumping site regulatory enforcement Licenses-environmental
restoration – greening • Private operators- Garbage
collection Garbage disposal to dump-
site Solid waste processing Solid waste re-use
applications • NGOs - Solid waste re-use-
energy Environmental restoration Solid waste re-use - plastic
poles Solid waste re-use in fertilizer
processing Environmental restoration-
afforestation

The Bill & Melinda Gates Foundation CHAPTER 3 : RESULTS AND ANALYSIS OF URBAN FSM PRACTICE Landscape Analysis and Business Model Assessment in Fecal Sludge Management: Extraction and Transportation Models in
Africa - Kenya
LOSAI MANAGEMENT LIMITED 3-156
Figure 3-26 : Flow of Money Chart for FSM Transactions
3.4.2.1.10 Tariffs and Fees for FSM Services
Table 3-118 summarizes financial transaction data for FSM services. The average tariffs in the
three cities are incomparable as the trucks are of different capacities. In Kisumu there is no
dumping fee since it is already included in the business permit, in Mombasa, operators are
required to have three licenses, that is a business permit renewable annually, Environmental
license and a dumping permit charged on a per truck basis, while in Nairobi operators are
required to have four licenses; business permit, environmental license charged on a per truck
basis and NCWSCO licensing fee charged on a truck basis and a dumping fees of USD 2.00 per
trip. The treated sludge re-sale price is fixed by the utility company which operates the
treatment plant. However at present there is no regular sale of sludge at any of the WTP in the
three cities studied. Moreover the WWTP where FS is dumped in Nairobi and Kisumu comprises
of stabilization ponds which in effect cannot undertake any FS waste treatment.
Client
Cheque
Cash
M-Pesa Individual
Households
Institutional
Emptier
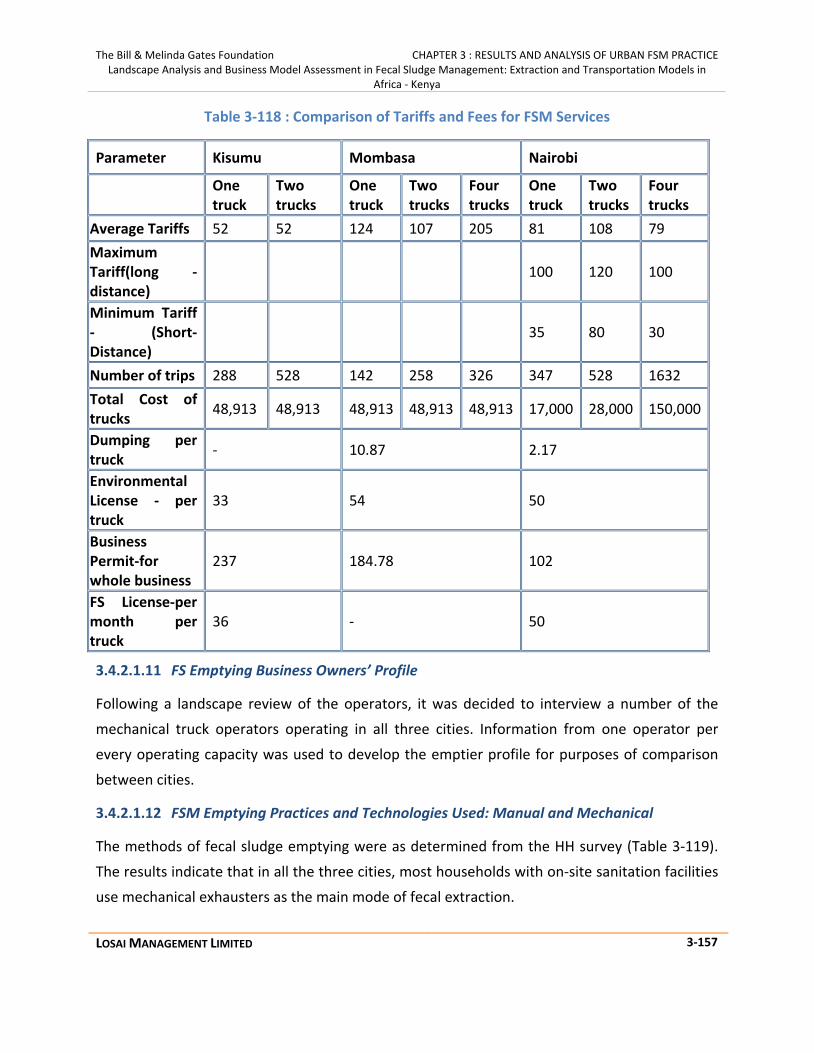
The Bill & Melinda Gates Foundation CHAPTER 3 : RESULTS AND ANALYSIS OF URBAN FSM PRACTICE Landscape Analysis and Business Model Assessment in Fecal Sludge Management: Extraction and Transportation Models in
Africa - Kenya
LOSAI MANAGEMENT LIMITED 3-157
Table 3-118 : Comparison of Tariffs and Fees for FSM Services
Parameter Kisumu Mombasa Nairobi
One truck
Two trucks
One truck
Two trucks
Four trucks
One truck
Two trucks
Four trucks
Average Tariffs 52 52 124 107 205 81 108 79 Maximum Tariff(long -distance)
100 120 100
Minimum Tariff - (Short- Distance)
35 80 30
Number of trips 288 528 142 258 326 347 528 1632 Total Cost of trucks 48,913 48,913 48,913 48,913 48,913 17,000 28,000 150,000
Dumping per truck - 10.87 2.17
Environmental License - per truck
33 54 50
Business Permit-for whole business
237 184.78 102
FS License-per month per truck
36 - 50
3.4.2.1.11 FS Emptying Business Owners’ Profile
Following a landscape review of the operators, it was decided to interview a number of the
mechanical truck operators operating in all three cities. Information from one operator per
every operating capacity was used to develop the emptier profile for purposes of comparison
between cities.
3.4.2.1.12 FSM Emptying Practices and Technologies Used: Manual and Mechanical
The methods of fecal sludge emptying were as determined from the HH survey (Table 3-119).
The results indicate that in all the three cities, most households with on-site sanitation facilities
use mechanical exhausters as the main mode of fecal extraction.

The Bill & Melinda Gates Foundation CHAPTER 3 : RESULTS AND ANALYSIS OF URBAN FSM PRACTICE Landscape Analysis and Business Model Assessment in Fecal Sludge Management: Extraction and Transportation Models in
Africa - Kenya
LOSAI MANAGEMENT LIMITED 3-158
Table 3-119 : Methods of Emptying Fecal Sludge in the Three Cities
Nairobi Mombasa Kisumu
Mechanical Manual Mechanical Manual Mechanical Manual % of Method of Emptying by HH with on-site sanitation 52% 48% 7% 93% 25% 75%
% of Share of Volume of FS emptied by method 32% 68% 10% 90% 2% 98%
% of the HH with on-site sanitation (pits) in the city emptied
38% 62% 7% 93% 17% 83%
% of the HH with on-site sanitation (septic tanks) in the city emptied
71% 29% 8% 92% 53% 47%
% of the HH with on-site sanitation (cesspool) in the city emptied
84% 16% 8% 92% 87% 13%
Total Volume in m3 of FS emptied (manual + mechanical) 929,286 289,908 272,789
As the HH survey revealed, manual emptying included: closing the pit when full and digging
another one, burying the pit, directing the sludge into existing drainage channels or directing
liquid FS into farms, closing the pit when full and reusing it after some time when the sludge
has reduced.
The operations of mechanical operators are insufficient to meet the existing demand of
emptying services, though neither is the effective demand sufficient to cause the operators to
operate at larger capacities. This sluggish effective demand for mechanical emptiers may be
explained by three reasons.
1. Price and affordability: - many HH opt for manual emptying as mechanical services are
unaffordable
2. Illegal dumping: - it was common to observe emptying channels constructed connecting
SP or CP to storm drains
3. Weak enforcement and corruption: Enforcement is generally weak creating room for
illegal connections of ST and CS to storm drains.

The Bill & Melinda Gates Foundation CHAPTER 3 : RESULTS AND ANALYSIS OF URBAN FSM PRACTICE Landscape Analysis and Business Model Assessment in Fecal Sludge Management: Extraction and Transportation Models in
Africa - Kenya
LOSAI MANAGEMENT LIMITED 3-159
There are 43 mechanical FS services businesses operating in the cities that among them operate
74 trucks.
Table 3-120 provides data on these mechanical operators.
Table 3-120 : Data on Mechanical Operators in Cities
Kisumu Mombasa Nairobi
# of private mechanical businesses in city 3 14 26
# of trucks run by private businesses 4 11 60
# of trucks owned by utilities 0 0 4
What are utility trucks used for (HH? Govt. institutions use, sewer cleaning?
# of private businesses that are small (1 truck) 1 3 8
# of pvt businesses that are medium (2-5 trucks) 2 3 18
# of pvt businesses that are large (>5 trucks) 0 0 0
What are the capacities of private trucks (m3) 10 10 8
What are capacities of Utility trucks (m3) 0 0 10
Price for new truck ( 10 m3 capacity ) USD-2nd hand import 48,000 48,000 48,000
Price for USED truck (10 m3 capacity) USD-fabricated 20,000 20,000 20,000
Based on the survey a number of operators run the FS emptying service as part of existing
businesses, however, the market leaders in each city were observed to be solely focused on
mechanical FS emptying as the core business.
The vast majority of trucks currently in use in all the cities are old and fairly unreliable, and
experiencing frequent breakdowns. In the last 6 months however, new trucks into the industry
have been procured in departure from past practice. In the past, mechanical emptiers preferred
to purchase old trucks and thereafter fabricate the ferrying tanks as well as fit in the needed
pumps. However, more recently, the new tanks in two of the three cities have been second
hand reconditioned specialized exhauster trucks. This new trend not to attempt local
fabrication appears to be informed by experience, economy and maintenance costs and
suitability of the specialized trucks. Across the 3 cities there are other challenges experienced
by the emptiers besides those associated with trucks and these include the following:

The Bill & Melinda Gates Foundation CHAPTER 3 : RESULTS AND ANALYSIS OF URBAN FSM PRACTICE Landscape Analysis and Business Model Assessment in Fecal Sludge Management: Extraction and Transportation Models in
Africa - Kenya
LOSAI MANAGEMENT LIMITED 3-160
3.4.2.1.13 Challenges Faced by Mechanical Operators
The FSM sub sector is under developed and general policy lags that of SWM. As a consequence
FSM service providers do face policy as well business challenges which include some of the
following:
• Long distance to discharge point
• Difficult to extract latrines due to disposal of solid waste into the latrines
• Poor roads infrastructure
• Extortion , penalties , expensive, permits, bribes by the local authorities
• High fuel prices
• Limited sources of capital
3.4.2.1.14 Trucks
The trucks in use by some operators are old and delicate, while others are new with much
higher capacity (Figure 3-27).
Figure 3-27 Trucks used by Mechanical Operators

The Bill & Melinda Gates Foundation CHAPTER 3 : RESULTS AND ANALYSIS OF URBAN FSM PRACTICE Landscape Analysis and Business Model Assessment in Fecal Sludge Management: Extraction and Transportation Models in
Africa - Kenya
LOSAI MANAGEMENT LIMITED 3-161
3.4.2.1.15 FS Management: Mechanical Operators
The cities have a total of 43 mechanical operators who own a total of 74 trucks; in Kisumu and
Mombasa, they operate from diverse areas and within the town but do not have a designated
parking area, whereas in Nairobi most reported having designated parking area under the
management of the City Council.
The operator’s businesses are sole proprietorships, partnerships and corporate bodies. The
majority of mechanical emptying operators do not have formal offices, and clients generally
find them by visiting the common parking area or by stopping the trucks on the road whenever
they see them or calling them on the telephone numbers usually displayed on the trucks. The
ownership of the business is predominantly male.
3.4.2.1.16 Mechanical Operators’ Employees
In general a truck has two employees to it, which includes a driver and a plumber cum turn boy.
Some of the owners engage their employees on casual employment terms based mainly on the
number of trips, while other had them on permanent employment. The businesses can be
classified further as informal or formal.
Informal businesses do not have central offices or designated area of operation and lack an
organizational structure. But, on the other hand, formal businesses have a central office and a
defined organizational structure; they have in place fully fledged sales and marketing
departments which are tasked with seeking business opportunities. These sales and marketing
departments where they exist are often managed by ladies and the operators are in diversified
operations not exclusively FS emptying.
3.4.2.1.17 Mechanical Operator Licensing
All operators are required to have 3 or 4 licenses which include:
1. Trading license obtained from the City Council Authority but issued as a business license.
This is renewed annually.
Environmental license issued by the national environmental office located in Nairobi and
issued on a per truck basis. This is renewed annually.
2. Tipping permit and fee licensing issued by the utility firm. This permit is issued on a
dumping trip basis. This applies only to Nairobi and Mombasa.

The Bill & Melinda Gates Foundation CHAPTER 3 : RESULTS AND ANALYSIS OF URBAN FSM PRACTICE Landscape Analysis and Business Model Assessment in Fecal Sludge Management: Extraction and Transportation Models in
Africa - Kenya
LOSAI MANAGEMENT LIMITED 3-162
3. FS Operator license which is on a truck basis and issues annually by the Utility Company.
This applies to Kisumu and Nairobi.
3.4.2.1.18 Operations of Mechanical Emptiers
In general mechanical operators make an assessment of the required de-sludging and then
quote a fee. The fees are fixed per trip but in other instances the fee varies depending on the
size of the truck and the distance covered. The business practice is payment after service. The
fee is usually agreed in advance. The client pays the truck driver or the owner through mobile
money once the sludge has been loaded into the truck. Some operators issue receipts while
others do not. For commercial clients receipts are issued because the service is taxable
(vatable) and this tax can be claimed back.
In the case of Nairobi operators pay a sum of USD 2.00 as the tipping fee per trip to the Utility
Company, In Mombasa operators pay a per trip dumping fee of USD 10.87 while in Kisumu
there is no dumping fee charged. In Nairobi and Mombasa when dumping the sludge at the
FSTP plant the truck is required to register itself and surrender the permit and receipt of fee
payment. Truck owners generally use the dumping permits to reconcile the number of trips per
day with number of customers served. However, use of the mobile phone is extensive as a way
of tracking the movement of the truck.
Most of the truck owners do not have a central area of operation, but, operated from different
locations. At night the truck owners have designated parking lots for their trucks but these are
not exclusive. Some park by the road side, while others park at the nearest gas station.
The levels of organization for the operators are varied. While some are sole proprietors or
partnerships or corporate bodies with the owner operating the truck, others have an elaborate
structure comprising of an operations manager, accountant, drivers, and plumbing assistants.
Fueling of trucks is undertaken by the truck crew and is based on collections from clients.
However, for all firms, the daily collections are remitted net of fuel amounts to begin
operations the following day which ranges from USD 25 to 30 per truck for the first trip of the
day.
Trips and customers
The number of trips per day reported to the truck owner may not tally actual trips made by the
crew to the dumping site. However the variation may be small where there is dumping fee and

The Bill & Melinda Gates Foundation CHAPTER 3 : RESULTS AND ANALYSIS OF URBAN FSM PRACTICE Landscape Analysis and Business Model Assessment in Fecal Sludge Management: Extraction and Transportation Models in
Africa - Kenya
LOSAI MANAGEMENT LIMITED 3-163
receipting system by the FSTP operator. What is likely to be very varied is the amount the client
pays to the truck crew and what they report to the owner especially where there are no
receipts issued and the truck crew is responsible for revenue collection. With the presence of
mobile based payments-M-pesa- some operators forbid their truck crew from handling any
payments and require customers to pay directly to the truck owner. A number of reasons may
exist for lack of receipting in the industry. Foremost receipts are only absolutely necessary for
1. Expense claims process-where the customer may have service paid for him by his employer
or landlord.
2. Where the customer maintains book keeping records such as a corporate client-hotel,
factory etc.
3. Where the customer makes a VAT return and therefore the service VAT incurred is INPUT
TAX and is useful for offsetting purposes
3.4.2.1.19 FS Tipping/Dumping points
In Nairobi, all trucks tip at Njiru tipping point. In Kisumu trucks tip at Nyalenda while in
Mombasa it is at Changamwe. In Kisumu and Nairobi the maximum number of trucks that can
tip at a given time is four, while in Mombasa only two trucks can tip at a given time. Across the
cities surveyed most trucks have a capacity of between 6,000 – 22,000 litres.
Figure 3-28 show a typical tipping scenario and one of the largest trucks (green truck) in Nairobi
which has a capacity of 18,000 litres.
Figure 3-28 : Nairobi FS Tipping Point

The Bill & Melinda Gates Foundation CHAPTER 3 : RESULTS AND ANALYSIS OF URBAN FSM PRACTICE Landscape Analysis and Business Model Assessment in Fecal Sludge Management: Extraction and Transportation Models in
Africa - Kenya
LOSAI MANAGEMENT LIMITED 3-164
Across the cities surveyed there is only one designated tipping site for FS and the use of remote
transfer points for mechanical emptiers is prohibited. All tipping points except that of Kisumu
are manned by security guards on a 24 hour basis and dumping takes place between Monday to
Saturday and the gates are open between 0600 to 1800hrs. At all dumping sites, the trucks
discharge to a man-hole which is connected by sewer line to the WWTP. In Mombasa the
tipping point is not well managed thus, not all trucks tip to the man hole. The drum trucks pour
the FS onto the grounds. Arising out of this, the Mombasa WWTP facility now under
rehabilitation is developing a special tipping point for the drum type of trucks.
3.4.2.1.20 Number of Trucks for FS operations
There are 74 trucks operating in the 3 cities while there 43 registered operators. Unlike in
Kisumu and Nairobi there are more operators in Mombasa than the number of trucks. This is
because some of the operators are “brokers” who hire the trucks periodically from the
mainstream operators-truck owners- to service clients.
Of the trucks surveyed, the 3 found in Mombasa use a unique combination of technologies
where 200 litre drums are placed at the back of the truck and a water pump or manual
emptiers are used to fill these drums. These 3 trucks two which belong to one operator and one
for another operator have difficulties emptying sludge at the manhole provided for dumping at
WWTP. Part of the rehabilitation includes designing a receiving bay to act as a dump location
for these trucks. Across the three cities the capacity of trucks varies from 6,000 litres to 22,000
litres. Figure 3-29 shows one of the largest trucks in terms of capacity.
The drum combination trucks found in Mombasa have a lower capacity of 5,600 litres and 7,200
litres. However, all trucks across the cities charge on a per trip basis and sometimes the fee is
higher depending on the distance to the dumping site. The longest distance is in Nairobi which
is 50 km comprising of from client to dumpsite to parking bay, while the shortest distance is in
Mombasa which is 4 kilometers. Most trips have an average distance of 8 km in Kisumu and
Mombasa.
The Bill & Melinda Gates Foundation CHAPTER 3 : RESULTS AND ANALYSIS OF URBAN FSM PRACTICE Landscape Analysis and Business Model Assessment in Fecal Sludge Management: Extraction and Transportation Models in
Africa - Kenya
LOSAI MANAGEMENT LIMITED 3-165
Figure 3-29 : One of the Largest Trucks in Mombasa -22,000 litres
3.4.2.1.21 Number of Trips per Day
Across the cities the number of trips per day varies. In the case of Nairobi there are least 4 trips
for every three days, which translates to 8 trips for a week of six days and in Mombasa 3 trips
for every three days, that is 6 trips per week and at least one trip per day for the operators in
Kisumu where two of the 3 operators reported at least 1 trip per day every day on a 22 working
day cycle while the other reported a trip every two days. There are reports of manual emptying
taking place and illegal dumping and connection of septic tanks to the storm drain in Nairobi
and Mombasa. The operators using drum-trucks-in Mombasa work closely with manual
emptiers. Manual emptiers in Mombasa reported that only 50% of their emptying is
transported by trucks. The total dumping by drum trucks in a year is estimated at 180. This
means that every 2 days there is manual emptying taking place in Mombasa with the FS being
either dumped into the storm drain or being buried into the ground.

The Bill & Melinda Gates Foundation CHAPTER 3 : RESULTS AND ANALYSIS OF URBAN FSM PRACTICE Landscape Analysis and Business Model Assessment in Fecal Sludge Management: Extraction and Transportation Models in
Africa - Kenya
LOSAI MANAGEMENT LIMITED 3-166
3.4.2.1.22 Fuel Consumption and Expenditure
Figure 3-30 shows a more advanced pump technology. The pump technologies take about
30minutes to fill a 20,000 litre’s tank. The suction process consumes between 1 and 1.5 litres of
fuel. This is the pump system of the vehicle. It operates with its own generator. This system is
more fuel efficient and operationally safer.
This pump system is found in the imported
second hand specialized exhauster trucks,
which are the vehicle of choice for new buys
by operators.
In the alternate models, the pump system
runs on the engine of the vehicle, during
operations the driver has to “rev” the vehicle
to drive the pump system. Figure 3-31 shows
how such pump technology looks like.
Therefore the level of fuel consumption is
higher in this pump model compared to the
advance pumping system. The pump is
connected to the engine via a pulley system-
fan belt at RHS of pump. This is driven by a
central shaft, which the driver moves by
pressing the pedal while the vehicle is not in
gear. The vehicle is reconfigured to switch to
this mode during pump operation. This is the
most common pump installation technique
for mechanical operators in the three cities.
These pumps can be mounted in different
positions on the chassis of the vehicles. Most
of them have been mounted on the sides near the battery with others on the top, below and
even at the rear.
Figure 3-30 : Pump Technology for Exhauster Trucks
Figure 3-31 : Alternative Pump Technology for Exhauster Trucks
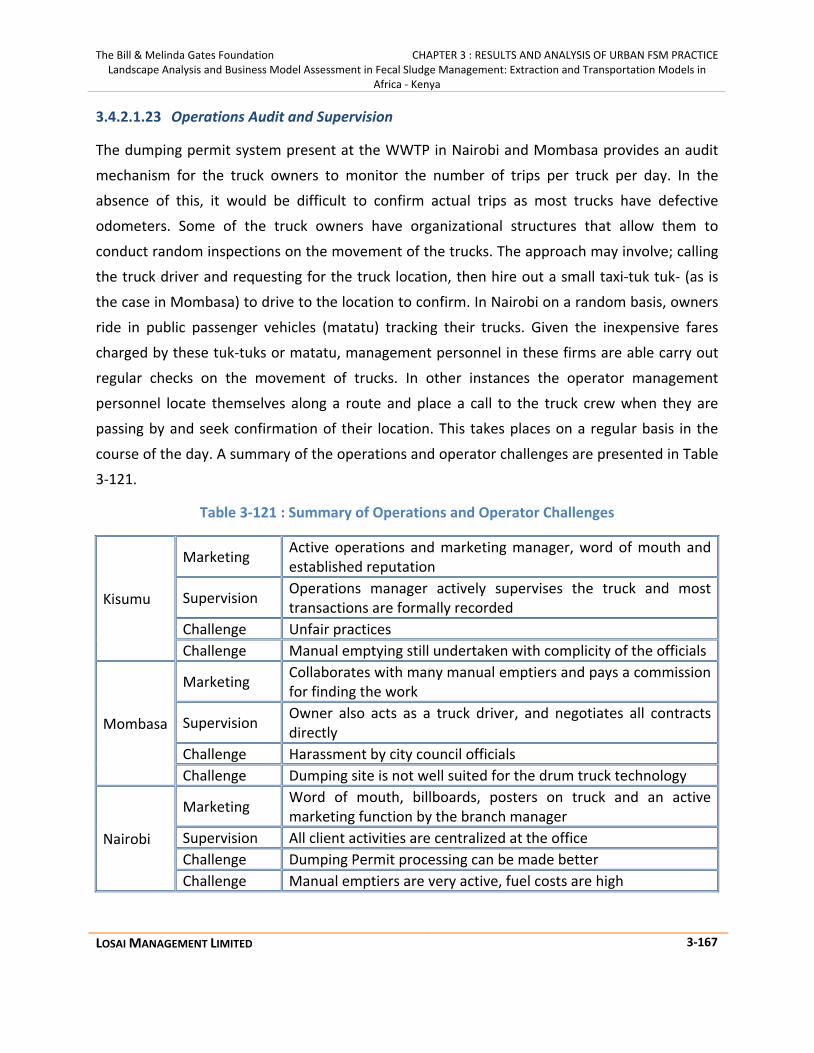
The Bill & Melinda Gates Foundation CHAPTER 3 : RESULTS AND ANALYSIS OF URBAN FSM PRACTICE Landscape Analysis and Business Model Assessment in Fecal Sludge Management: Extraction and Transportation Models in
Africa - Kenya
LOSAI MANAGEMENT LIMITED 3-167
3.4.2.1.23 Operations Audit and Supervision
The dumping permit system present at the WWTP in Nairobi and Mombasa provides an audit
mechanism for the truck owners to monitor the number of trips per truck per day. In the
absence of this, it would be difficult to confirm actual trips as most trucks have defective
odometers. Some of the truck owners have organizational structures that allow them to
conduct random inspections on the movement of the trucks. The approach may involve; calling
the truck driver and requesting for the truck location, then hire out a small taxi-tuk tuk- (as is
the case in Mombasa) to drive to the location to confirm. In Nairobi on a random basis, owners
ride in public passenger vehicles (matatu) tracking their trucks. Given the inexpensive fares
charged by these tuk-tuks or matatu, management personnel in these firms are able carry out
regular checks on the movement of trucks. In other instances the operator management
personnel locate themselves along a route and place a call to the truck crew when they are
passing by and seek confirmation of their location. This takes places on a regular basis in the
course of the day. A summary of the operations and operator challenges are presented in Table
3-121.
Table 3-121 : Summary of Operations and Operator Challenges
Kisumu
Marketing Active operations and marketing manager, word of mouth and established reputation
Supervision Operations manager actively supervises the truck and most transactions are formally recorded
Challenge Unfair practices Challenge Manual emptying still undertaken with complicity of the officials
Mombasa
Marketing Collaborates with many manual emptiers and pays a commission for finding the work
Supervision Owner also acts as a truck driver, and negotiates all contracts directly
Challenge Harassment by city council officials Challenge Dumping site is not well suited for the drum truck technology
Nairobi
Marketing Word of mouth, billboards, posters on truck and an active marketing function by the branch manager
Supervision All client activities are centralized at the office Challenge Dumping Permit processing can be made better Challenge Manual emptiers are very active, fuel costs are high

The Bill & Melinda Gates Foundation CHAPTER 3 : RESULTS AND ANALYSIS OF URBAN FSM PRACTICE Landscape Analysis and Business Model Assessment in Fecal Sludge Management: Extraction and Transportation Models in
Africa - Kenya
LOSAI MANAGEMENT LIMITED 3-168
3.4.2.1.24 Marketing
Clients Receipting and Payments
Domestic clients generally do not require receipts and thus revenue accounting is mostly
dependent on the truck crew. Commercial clients on the other hand (restaurants, landlords and
factories) do require receipts for the FS services. Most commercial clients prefer to make
cheque payments as opposed to cash. Domestic clients on the other hand pay in cash. Payment
by mobile money-in particular M-pesa is very common and increasing in use. This is because it
is convenient, safer and more effective in remitting the money. In the past, when M-pesa was
not available, truck owners would have to visit the client premises, obtain the money before
instructing the truck to commence the trip to the extraction site. This no longer applies.
However, with mobile payments such as M-pesa, most truck owners do not allow their truck
crew to handle payments and require that the client pays directly by M-pesa to the owner.
Credit services
All operators do offer credit services, but this is often to the commercial clients. Domestic
clients only known to the business proprietor receive credit while all others pay upon service
delivery. The operators’ primary reason for extending credit is to maintain the business
relationship as opposed to price cutting.
Payment systems
Three payment systems are observed in the industry, cash, mobile phone based systems and
cheques. Domestic clients tend to pay in cash or by mobile phone system. Commercial
operators pay either in cash or by cheque.
3.4.2.1.25 Hire of Third Party Trucks to Provide FS Services
There are cases where operators who do not own trucks secure “exhausting contracts” then
hire truck from a third party to service a client. This usually occurs at two levels. The first case is
where the operators who do not own any trucks-brokers- but are able to secure “exhausting
contracts” from households and commercial entities engage a lessor contractor who negotiates
varied pricing. In the second instance, some operators when overwhelmed by emptying
contracts prefer to hire the trucks of their industry colleagues in order to service the clients. In
this second instance the pricing system is commission based. Across the three cities, hire of
trucks by brokers was most predominant in Mombasa and to a renter extent in Nairobi. These

The Bill & Melinda Gates Foundation CHAPTER 3 : RESULTS AND ANALYSIS OF URBAN FSM PRACTICE Landscape Analysis and Business Model Assessment in Fecal Sludge Management: Extraction and Transportation Models in
Africa - Kenya
LOSAI MANAGEMENT LIMITED 3-169
brokers often obtain exhausting contracts through the tender process which is the predominant
procurement approach by many large commercial, public and non-governmental institutions. In
Mombasa, this prevalence is because many commercial installations are outside the functioning
sewer system.
3.4.2.1.26 Collaboration of Drum Trucks with Manual Emptiers
The Drum truck operators in Mombasa were noted to have strong collaboration with manual
emptiers .This is because the drum-trucks are more affordable and mostly in use where
conventional trucks may not be able to access. Drum trucks in Mombasa are also used for solid
waste transport services. In Kisumu one operator was noted to work closely with manual
emptiers. In Nairobi like in Kisumu, manual and mechanical operators collaborate in instances
where the client would like to have the FS transported by truck but the sanitation facility is
inaccessible by a mechanical emptier. This was found to be the case for bio-centres and certain
public toilet facilities. One of the promoter institutions of bio-centres is investing in the
development of a manual FS pump to be used by the manual operators as a way of improving
hygiene standards in the manual emptying service. Moreover in Nairobi, many of the bio-
centres and FS aggregator sites are inaccessible by conventional trucks and therefore there is
use of manual emptiers. Figure 3-32 below shows a drum truck used in Mombasa.
Figure 3-32 : Drum Truck in Mombasa

The Bill & Melinda Gates Foundation CHAPTER 3 : RESULTS AND ANALYSIS OF URBAN FSM PRACTICE Landscape Analysis and Business Model Assessment in Fecal Sludge Management: Extraction and Transportation Models in
Africa - Kenya
LOSAI MANAGEMENT LIMITED 3-170
3.4.2.1.27 Overview of all WWTP, FSTP or dumping sites
Only the conventional WWTPs in Mombasa can treat FS for re-use. The fecal sludge from the
designated tipping points in Nairobi and Kisumu mixes up with sewage and ends up in
wastewater stabilization ponds (Table 3-122).
Table 3-122 : Data on Wastewater Treatment Plant in Nairobi, Kisumu and Mombasa
3.4.2.1.28 FS End Re-Use in the three cities Kisumu, Mombasa and Nairobi
FS re-use in all the cities is acceptable among the local residents. FS End re-use occurs at two
levels one-Macro FS re-use undertaken by FSTP’s and second Micro FS re-use undertaken by
small FS processors including bio-centres.
Macro FS re-use by FSTP’s
FSTPs in the 3 cities have generally underperformed; consequently there are marginal sales of
treated FS. However, across the three towns, the management of the FSTP’s would like to carry
out public sensitization and awareness campaigns to increase the acceptability of treated FS
particularly in agroforestry. Treated FS in Kisumu sells at USD 1.25 per tonne when available.
Treated FS sell at USD1.45 per tonne in Nairobi and is often unavailable. There have not been
any treated FS sales in Mombasa over the last 12 months. The main challenges with sales of
treated FS are logistical given that the product is bulky and not packaged. Logistical problems
therefore arise in the transportation and distribution process.
Nairobi Mombasa Kisumu
What is the official dumping site for city? (WWTP, FSTP, wetlands, landfill, official open land, or nothing?
Ruai Changamwe Nyalenda (Stabilization Pond)
What is the m3 capacity of this treatment facility? 17,000 2,000
Where is it located? (Center of city, edge of city, outside city..?)
Edge of the city
Edge of the city
Edge of the city
What is the dumping fee truckers have to pay? USD (Per Truck) 2.17 10.87 -
Is this payment per trip or per month or m3 or? Per Trip Per Trip N.A.

The Bill & Melinda Gates Foundation CHAPTER 3 : RESULTS AND ANALYSIS OF URBAN FSM PRACTICE Landscape Analysis and Business Model Assessment in Fecal Sludge Management: Extraction and Transportation Models in
Africa - Kenya
LOSAI MANAGEMENT LIMITED 3-171
Micro FS re-use by Bio-centres
Micro FS re-use takes place under a framework referred to as bio-centres (Figure 3-33). Bio-
centres are public sanitation –toilet and bathroom-facilities operated on a pay for use basis.
Bio-centres are located more often than not in high density settlements –slums- and provide
access to superior sanitation services for residents. More than 100 bio centres exist in the 3
cities studied. Amongst the bio-centres, FS-re-use takes place through the generation of biogas
which is used for cooking purposes within cooking facilities present at these centres. The
cooking facilities are more cost-effective on a fuel basis for the households as well as much
more friendly to the users vis a vis the alternatives of wood fuel and kerosene. The daily biogas
output of a standard bio-centre is 12 cubic meters of gas.
3.4.2.1.29 Market Demand and supply analysis
The survey was conducted across the cities revealing the following varied statistics on
households, sanitation facilities distribution and mode of emptying (Table 3-123).
Figure 3-33 : Construction of Bio- center; Kisumu (left); Stara Bio-centre; Nairobi

The Bill & Melinda Gates Foundation CHAPTER 3 : RESULTS AND ANALYSIS OF URBAN FSM PRACTICE Landscape Analysis and Business Model Assessment in Fecal Sludge Management: Extraction and Transportation Models in
Africa - Kenya
LOSAI MANAGEMENT LIMITED 3-172
Table 3-123 : Statistics on Households, Sanitation Facilities and Mode of Emptying
Cities
FS Collection Calculations Nairobi Mombasa Kisumu
Number of households in the city 985,016 140,535 148,494 % of the city HH with On-site sanitation 51% 82% 84% Number of the city HH with On-site sanitation 502,839 115,228 124,830 % HH with Onsite sanitation in the city Pits 66% 54% 80% Septic tanks 13% 21% 17% OTHER (i.e. cesspools, holding tanks) 21% 25% 2% # of HH with on-site sanitation Pits 331,874 62,223 99,864 Septic tanks 65,369 24,198 21,720 OTHER (i.e. cesspools, holding tanks) 105,596 28,807 2,871 502,839 115,228 124,456 % of HH with O-S in the city using Mec. Emp Pits 38% 7% 17% Septic tanks 71% 8% 53% OTHER (i.e. cesspools, holding tanks) 84% 8% 87% % of HH with O-S in the city using Man. Emp Pits 62% 93% 83% Septic tanks 29% 92% 47% OTHER (i.e. cesspools, holding tanks) 16% 92% 13% % of HH with On-site sanitation using Mec Emp 52% 7% 25% Man Emp 48% 93% 75% 100% 100% 100% # of HH with O-S using Mec Emp Pits 126,112 4,356 16,977 Septic tanks 46,412 1,936 11,512 OTHER (i.e. cesspools, holding tanks) 88,701 2,305 2,498 261,225 8,596 30,987 # of HH with O-S using Man Emp Pits 205,762 57,868 82,887 Septic tanks 18,957 22,262 10,209 OTHER (i.e. cesspools, holding tanks) 16,895 26,502 373

The Bill & Melinda Gates Foundation CHAPTER 3 : RESULTS AND ANALYSIS OF URBAN FSM PRACTICE Landscape Analysis and Business Model Assessment in Fecal Sludge Management: Extraction and Transportation Models in
Africa - Kenya
LOSAI MANAGEMENT LIMITED 3-173
241,614 106,632 93,469 Other Typical volume of the septic tank (SV) 5 5 5 Typical volume of the pits (PV) 3 3 3 Typical volume of the Cesspool (CV) 5 5 5 Fecal sludge ratio on pits 0.6 0.6 0.6 Fecal sludge ratio on septic tanks 1 1 1 Number of Users 6 6 6 Number of trucks 60 11 4 Capacity of trucks 12 16.4 7.5 Number of trips per year 416 156 208 Trips per year *Nairobi- 4 trips for every 3 days for 6 days *Mombasa- 3 trips for every 3 days for 6 days *1 trip everyday for 6 days
3.4.2.1.30 City demand and supply analysis
Nairobi
The annual demand for FS management services is estimated at 4,604,701 m3 and the
mechanical supply for those services is estimated to cater for only 299,520 m3 at present
representing 10% service delivery rate (Table 3-124). On the other hand, the manual supply has
an annual demand of approximately 1,808,010 m3 which represents about 35% service delivery
rate.

The Bill & Melinda Gates Foundation CHAPTER 3 : RESULTS AND ANALYSIS OF URBAN FSM PRACTICE Landscape Analysis and Business Model Assessment in Fecal Sludge Management: Extraction and Transportation Models in
Africa - Kenya
LOSAI MANAGEMENT LIMITED 3-174
Table 3-124 : Nairobi City FS Demand and Supply Data
The capacity to cater for more demand exists in the current operating environment both for
mechanical and manual operators, however due to the hazardous nature of manual FS
extraction; mechanical extraction if well developed as a service may experience the needed
growth to meet the excess demand. There is a huge potential for the operators to operate
above their current averages, although it may not exceed 6 times their current number of trips
given the infrastructural limitations, vehicle capacities and number of vehicles currently in
operation. As such the gap for mechanical emptiers to meet current demand is approximately
2,497,172 m3 which demands for more trucks to the business and additional tipping
destinations preferably well managed transfer points that reduce travel distances.
Mombasa
The annual demand for FS management services is estimated at 853,341 m3 and the mechanical
supply for those services is estimated to cater for 28,142 m3 representing 3% service delivery
rate and 261,766 m3 in manual extraction supply, representing 30% service delivery rate (Table
3-125). From the study it was established that a substantial number of households do not use
the mechanical services but opt for manual services. These households was estimated to
produce a total of 50,930 m3 annually in FS, however the mechanical supply was estimated at
Pit latrines (PL) Septic Tanks (ST) Cess pools (CP) Total FS Volume
Emptying frequency % # of HH PL V Pit (2.6 M3) % # of HH
ST ( 5 M3) V ST % # of HH CP(5 M3) V CP
Mechanical P1 me Two times/ yr 32% 39,935 79,871 207,664 42% 19,580 39,160 195,801 26% 22,728 45,455 227,276 630,741 Once/yr 16% 19,968 19,968 51,916 16% 7,614 7,614 38,072 10% 8,523 8,523 42,614 132,603 After 2-4 years 6% 7,357 1,839 4,782 4% 1,813 453 2,266 5% 4,419 1,105 5,524 12,572 Once every three months 47% 58,852 235,409 612,064 38% 17,405 69,618 348,090 60% 53,031 212,124 1,060,622 2,020,776 Number of HH emptied P me M3 100% 126,112 337,087 876,426 100% 46,412 116,846 584,230 100% 88,701 267,207 1,336,036 2,796,692 Manual P1 Ma Two times/ yr 37% 76,391 152,781 397,231 50% 9,479 18,957 94,785 60% 10,137 20,274 101,372 593,389 Once/yr 7% 13,553 13,553 35,238 38% 7,109 7,109 35,544 0% 70,783 After 2-4 years 4% 7,393 1,848 4,805 13% 2,370 592 2,962 40% 6,758 1,690 8,448 16,215 Once every three months 53% 108,425 433,701 1,127,624 0% 0% 1,127,624 Number HH emptied P ma M3 100% 205,762 601,884 1,564,898 100% 18,957 26,658 133,292 100% 16,895 21,964 109,820 1,808,010 TOTAL ( Me and Ma) 331,874 938,971 2,441,324 65,369 143,504 717,521 105,596 289,171 1,445,856 4,604,701
Market Demand and Supply M3 % (D) Demand M3 % (S) Supply M3 % (D/S) Excess D/S M3 Service Delivery Volume of FS emptied Mech M3 61% 2,796,692 32% 299,520 68% 2,497,172 11% Volume of FS emptied Man M3 39% 1,808,010 68% 629,766 32% 1,178,244 35% Total Volume FS Produced M3 100% 4,604,701 100% 929,286 100% 3,675,416 20%

The Bill & Melinda Gates Foundation CHAPTER 3 : RESULTS AND ANALYSIS OF URBAN FSM PRACTICE Landscape Analysis and Business Model Assessment in Fecal Sludge Management: Extraction and Transportation Models in
Africa - Kenya
LOSAI MANAGEMENT LIMITED 3-175
28,142 m3,. This implies that the operators operated with underemployed capacity and in some
cases had to make trips to the dumping site with half-filled tanks. On the other hand, the
manual supply has an annual demand of approximately 802,411 m3 and a corresponding
261,766 m3 annual supply from manual operators which represents about 33% service delivery
rate.
The capacity to cater for more demand exists in the current operating environment both for
mechanical and manual operators, however since there is excess supply for manual extraction
there is need to seal the leakages into the manual extraction due to the hazardous nature of
manual FS extraction; mechanical extraction if well developed as a service may experience the
needed growth to meet the excess demand.
Table 3-125 : Mombasa City FS Demand and Supply Data
*NB: SF –Sanitation facility
To effectively meet the market demand, the operators will have to increase their popularity and
penetration into the manual demand and convert that to mechanical extraction. There is a huge
potential for the operators to operate above average, although it may not exceed 6 times their
current number of trips given the infrastructural limitations, vehicle capacities and number of
vehicles currently in operation. As such the gap for mechanical emptiers to meet current
Pit latrines (PL) Septic Tanks (ST) Cess pools (CP) Total FS Volume
Emptying frequency % # of HH PL V Pit (2.6 M3) % # of HH ST ( 5 M3) V ST % # of HH CP(5
M3) V CP
Mechanical P1 me Two times/ yr 34% 1,493 2,987 7,765 46% 893 1,787 8,935 43% 988 1,975 9,877 34% Once/yr 17% 747 747 1,941 23% 447 447 2,234 21% 494 494 2,469 17% After 2-4 years 14% 622 156 404 31% 596 149 745 36% 823 206 1,029 14% Once every three months 34% 1,493 5,973 15,531 0% 0% 34%
Number of HH emptied P me M3 100% 4,356 9,862 25,642 100% 1,936 2,383 11,913 100% 2,305 2,675 13,375 100%
Manual P1 Ma Two times/ yr 23% 13,354 26,708 69,441 53% 11,873 23,746 118,731 44% 11,739 23,479 117,393 23% Once/yr 16% 9,348 9,348 24,304 33% 7,421 7,421 37,103 22% 5,870 5,870 29,348 16% After 2-4 years 24% 13,799 3,450 8,969 13% 2,968 742 3,710 1% 356 89 445 24% Once every three months 37% 21,366 85,466 222,211 0% 32% 8,538 34,151 170,754 37%
Number HH emptied P ma M3 100% 57,868 124,972 324,926 100% 22,262 31,909 159,545 100% 26,502 63,588 317,940 100%
TOTAL ( Me and Ma) 62,223 134,834 350,568 24,198 34,291 171,457 28,807 66,263 331,315
Market Demand and Supply M3 % (D) Demand M3 % (S) Supply M3 % (D/S) Excess D/S M3 Service Delivery Volume of FS emptied Mech M3 6% 50,930 10% 28,142 4% 22,787 55% Volume of FS emptied Man M3 94% 802,411 90% 261,766 96% 540,645 33% Total Volume FS Produced M3 100% 853,341 100% 289,908 100% 563,433 34%

The Bill & Melinda Gates Foundation CHAPTER 3 : RESULTS AND ANALYSIS OF URBAN FSM PRACTICE Landscape Analysis and Business Model Assessment in Fecal Sludge Management: Extraction and Transportation Models in
Africa - Kenya
LOSAI MANAGEMENT LIMITED 3-176
demand is approximately 22,787 m3 which demands for more trucks to the business and
additional tipping destinations preferably well managed transfer points.
Kisumu
The city has three mechanical operators operating a total of four trucks among them. It has an
estimated annual demand for FS management services of 691,903 m3 and the mechanical
supply for those services is estimated to cater for only 6,240 m3 at present representing a 1%
service delivery rate. On the other hand, the manual supply has an annual demand of
approximately 508,431 m3 and a corresponding 266,549 m3 annual supply from manual
operators which represents about 35% service delivery rate (Table 3-126). The capacity to cater
for more demand exists in the current operating environment both for mechanical and manual
operators.
Table 3-126 : Kisumu City FS Demand and Supply Data
*NB: SF –Sanitation facility
3.4.2.1.31 Operational Analysis
One truck operators
Two operators, in Kisumu and Nairobi have greater operational efficiency as shown by their
gross margins of 79 % each compared with the Mombasa operator (Table 3-127). Considering
that all the operators have the same number of trucks, Kisumu operator can be concluded to be
Pit latrines (PL) Septic Tanks (ST)
Cess pools (CP) Total
FS Volume
Emptying frequency
% # of HH
PL
V Pit (2.6 M 3 )
% # of HH
ST ( 5 M 3 ) V ST
% # of HH
CP(5 M 3 ) V CP
Mechanical P1 me
Two times/ yr 48%
8,225 16,450
42,769 14%
1,625 3,250
16,252 0%
59,021 Once/yr
15% 2,531
2,531 6,580
56% 6,501
6,501 32,504
69% 1,729
1,729 8,646
47,730 After 2 - 4 years
14% 2,425
606 1,576
15% 1,761
440 2,20 1
31% 769
192 961
4,738 Once every three months
22% 3,796
15,184 39,479
14% 1,625
6,501 32,504
0% 7 1,983
Number of HH emptied P me M 3
100% 16,977
34,771 90,405
100% 11,512
16,692 83,461
100% 2,498
1,921 9,607
183,472
Manual P1 Ma Two times/ yr
49% 40,747
81,494 211,885
37% 8,220
7,539 37,69 3
0% 249,578
Once/yr 27%
22,463 22,463
58,404 18%
1,885 1,885
9,423 100%
373 67,827
After 2 - 4 years 11%
9,229 2,307
5,999 8%
785 196
982 0%
6,980 Once every three months
13% 10,448
41,792 108,659
37% 3,769
15,077 75,387
0% 184,045
Number HH emptied P ma M 3
100% 82,887
148,056 384,946
100% 14,659
24,697 123,485
100% 373
508,431 TOTAL ( Me and Ma)
99,864 182,827
475,351 26,171
41,389 206,945
2,871 1,921
9,60 7 691,903
Market Demand and Supp ly M 3
% (D) Demand M 3
% (S) Supply M 3
% (D/S) Excess D/S M3
Service Delivery Volume of FS emptied Mech M 3
27% 183,472
2% 6,240
42% 177,232
3% Volume of FS emptied Man M 3
73% 508,431
98% 266,549
58% 241,882
52% Total Volume FS Produced M 3
100% 691,903
100% 272,789
100% 419,114
39%

The Bill & Melinda Gates Foundation CHAPTER 3 : RESULTS AND ANALYSIS OF URBAN FSM PRACTICE Landscape Analysis and Business Model Assessment in Fecal Sludge Management: Extraction and Transportation Models in
Africa - Kenya
LOSAI MANAGEMENT LIMITED 3-177
more efficient since he is able to retain a greater portion of his revenue despite the revenue
being lower than for Nairobi and Mombasa operators.
Table 3-127 : Operational Analysis of One Truck Operators
One Truck Operators KISUMU MOMBASA NAIROBI
USD USD USD
Gross Margin 79% 61% 79%
Net Profit/loss Margin 29% -123% 36%
Contribution Margin (2,463.65) (24,587.65) 12,365.75
Contribution margin Per Truck (2,463.65) (24,587.65) 12,365.75
Contribution margin per trip (8.55) (173.15) 35.69
Revenue per Trip 51.50 124.00 80.50
Revenue Per Truck 14,832.00 17,608.00 27,893.25
Trip Per Truck 288 142 347
Fixed Cost per trip 10.71 48.01 16.54
Fixed Cost Per Truck 3,084.83 6,817.39 5,730.50
Variable Cost Per trip 60.05 297.15 44.81
Variable cost per Truck 17,295.65 42,195.65 15,527.50
Number of Trucks 1 1 1
Number of Trips 288 142 347
Distance Covered in KM 2,304 1,207 9,356
Two Trucks Operators
The operating margins are within trend (Table 3-128). The variation that leads to a negative
position of the Mombasa two truck operators may be on account of the cost of the trucks and
the resulting amount of depreciation charge.
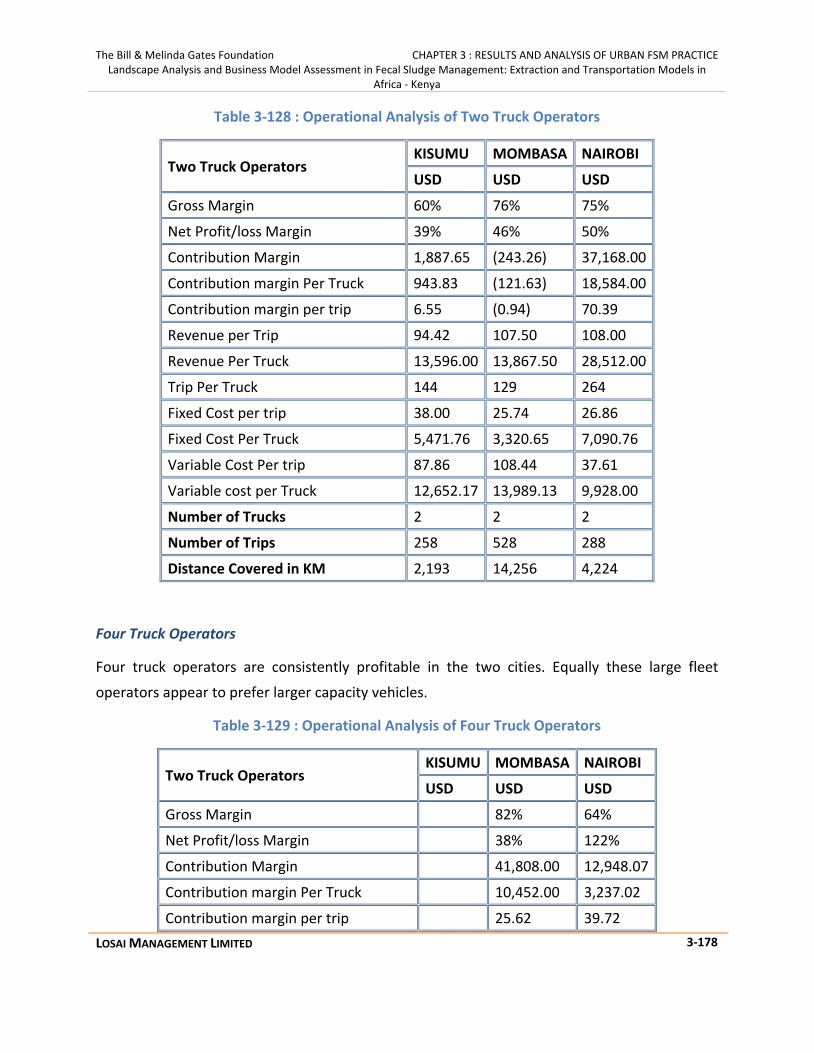
The Bill & Melinda Gates Foundation CHAPTER 3 : RESULTS AND ANALYSIS OF URBAN FSM PRACTICE Landscape Analysis and Business Model Assessment in Fecal Sludge Management: Extraction and Transportation Models in
Africa - Kenya
LOSAI MANAGEMENT LIMITED 3-178
Table 3-128 : Operational Analysis of Two Truck Operators
Two Truck Operators KISUMU MOMBASA NAIROBI
USD USD USD
Gross Margin 60% 76% 75%
Net Profit/loss Margin 39% 46% 50%
Contribution Margin 1,887.65 (243.26) 37,168.00
Contribution margin Per Truck 943.83 (121.63) 18,584.00
Contribution margin per trip 6.55 (0.94) 70.39
Revenue per Trip 94.42 107.50 108.00
Revenue Per Truck 13,596.00 13,867.50 28,512.00
Trip Per Truck 144 129 264
Fixed Cost per trip 38.00 25.74 26.86
Fixed Cost Per Truck 5,471.76 3,320.65 7,090.76
Variable Cost Per trip 87.86 108.44 37.61
Variable cost per Truck 12,652.17 13,989.13 9,928.00
Number of Trucks 2 2 2
Number of Trips 258 528 288
Distance Covered in KM 2,193 14,256 4,224
Four Truck Operators
Four truck operators are consistently profitable in the two cities. Equally these large fleet
operators appear to prefer larger capacity vehicles.
Table 3-129 : Operational Analysis of Four Truck Operators
Two Truck Operators KISUMU MOMBASA NAIROBI
USD USD USD
Gross Margin 82% 64%
Net Profit/loss Margin 38% 122%
Contribution Margin 41,808.00 12,948.07
Contribution margin Per Truck 10,452.00 3,237.02
Contribution margin per trip 25.62 39.72

The Bill & Melinda Gates Foundation CHAPTER 3 : RESULTS AND ANALYSIS OF URBAN FSM PRACTICE Landscape Analysis and Business Model Assessment in Fecal Sludge Management: Extraction and Transportation Models in
Africa - Kenya
LOSAI MANAGEMENT LIMITED 3-179
Revenue per Trip 79.00 205.40
Revenue Per Truck 32,232.00 16,740.28
Trip Per Truck 408 81.5
Fixed Cost per trip 14.15 74.83
Fixed Cost Per Truck 5,771.50 6,098.37
Variable Cost Per trip 53.38 165.68
Variable cost per Truck 21,780.00 13,503.26
Number of Trucks 4 4
Number of Trips 1632 326
Distance Covered in KM 14,029 2,771 Break Even Analysis
Sales Revenue – Variable Cost = Contribution Margin
Therefore: - Contribution Margin – Fixed Cost =Operating Income or loss
The comparative table (Table 3-130) on the operators indicates that economies of scale do not
necessarily set in with the number of trucks owned and operated. This could be for a number of
factors such as number of truck breakdowns, the pattern of demand and variability of truck
capacities. In addition the operators have different models in the nature of employment of
their personnel. As the industry is unregulated, it is unclear what the optimal number of trucks
would be, and what level of service demand would be needed to ensure operational
sustainability.
Table 3-130 : Operations Data Comparison of One, Two and Four Truck Mechanical Operators
KISUMU, MOMBASA AND NAIROBI Macroeconomic & business size data
ONE TRUCK OPERATOR TWO TRUCKS OPERATOR FOUR TRUCKs OPERATOR
Inflation (CPI) 17% 17% 17% Any other inflation index 0% 0% 0%
Number of trucks 1 2 4
Number of drivers 1 2 4
Number of turn 2 2 2

The Bill & Melinda Gates Foundation CHAPTER 3 : RESULTS AND ANALYSIS OF URBAN FSM PRACTICE Landscape Analysis and Business Model Assessment in Fecal Sludge Management: Extraction and Transportation Models in
Africa - Kenya
LOSAI MANAGEMENT LIMITED 3-180
boys per Truck
Other Parameters KSM MSA NBO KSM MSA NBO KSM
MSA NRB
Distance covered per year (Km) 2,304 1,207 9,356 4,224 2,193 14,256 2,771 14,029
Number of trips per annum 288 142 347 288 258 528 326 1632
Fuel consumption 3,130.43 1,543.48 8,662.50 5,739.13 2,804.35 13,200.00 3,543.48 40,800.00
Tariffs 51.50 124.00 80.50 94.42 107.50 108.00 205.40 79.00 Operator BEP analysis
For both Mombasa and Kisumu one truck operators, their businesses have negative
contribution margins which imply that they are making losses. In each case, to break even,
operators have two options; they can either increase the number of trips one makes per year to
396 from 288 or increase the tariff charge per trip to $ 70.77 for the same number of trips they
need to make per year (Table 3-131). While for the second operator in Mombasa, they need to
increase his number of trips to 395 per year from 142 or double the tariff charge per trip to USD
345 for the same number of trips.
Table 3-131 : Mechanical Operators BEP Analysis – Kisumu, Mombasa and Nairobi
One truck Operators Two trucks operators Four trucks operators
Kisumu Mombasa Nairobi Kisumu Mombasa Nairobi Mombasa Nairobi
Revenue 14,832.00 17,608.00 27,893.25 27,192.00 27,735.00 57,024.00 66,961.11 128,928.0
Fixed Expenses 3,084.83 6,817.39 5,730.50 10,943.52 6,641.30 14,181.52 24,393.48 23,086.00
Variable Expenses 17,295.65 42,195.65 15,527.50 25,304.35 27,978.26 19,856.00 54,013.04 87,120.00
Gross margin 79% 61% 79% 60% 76% 75% 64% 82%
Net gain/loss 29% -123% 36% 39% 46% 50% 122% 38%
Contr-Margin MaMaMargin (2,463.65) (24,587.65) 12,365.75 1,887.65 (243.26) 37,168.00 12,948.07 41,808.00
CM per truck (2,463.65) (24,587.65) 12,365.75 943.83 (121.63) 18,584.00 3,237.02 10,452.00
CM per trip (8.55) (173.15) 35.69 6.55 (0.94) 70.39 39.72 25.62
Revenue per Trip 51.50 124.00 80.50 94.42 107.50 108.00 205.40 79.00
Revenue Per Truck 14,832.00 17,608.00 27,893.25 13,596.00 13,867.50 28,512.00 16,740.28 32,232.00

The Bill & Melinda Gates Foundation CHAPTER 3 : RESULTS AND ANALYSIS OF URBAN FSM PRACTICE Landscape Analysis and Business Model Assessment in Fecal Sludge Management: Extraction and Transportation Models in
Africa - Kenya
LOSAI MANAGEMENT LIMITED 3-181
Trip Per Truck 288 142 347 144 129 264 81.5 408
Fixed Cost per trip 10.71 48.01 16.54 38.00 25.74 26.86 74.83 14.15
Fixed Cost Per Truck 3,084.83 6,817.39 5,730.50 5,471.76 3,320.65 7,090.76 6,098.37 5,771.50
Variable Cost Per trip 60.05 297.15 44.81 87.86 108.44 37.61 165.68 53.38
Variable cost per Truck 17,295.65 42,195.65 15,527.50 12,652.17 13,989.13 9,928.00 13,503.26 21,780.00
Number of Trucks 1 1 1 2 2 2 4 4
Number of Trips 288 142 347 288 258 528 326 1632
Distance Covered in KM 2,304 1,207 9,356 4,224 2,193 14,256 2,771 14,029
BEP Revenue 20,380.48 49,013.04 21,258.00 36,247.87 34,619.56 34,037.52 78,406.52 110,206.00
BEP #Trips per truck 396 395 264 192 161 158 95 349
BEP Tariff 70.77 345.16 61.26 125.86 134.18 64.47 240.51 67.53
Price variance 37% 178% -24% 33% 25% -40% 17% -15%
The price variance in order to break even and become profitable is 37% and 178% respectively.
Due to the price sensitivity nature of this kind of business and the high level of competition
increasing the tariff may be difficult due to clientele flight to cheaper service providers. It is also
very likely that the number of trips reported is far below the actual trips by the operators.
In the case of two truck operators only Mombasa operator yields a negative contribution
margin. For this operator to break even they need to increase the number of trips per truck to
161 per year from the current 129 trips or increase the charges to USD 134 from 108 charged
currently.
Sensitivity and risk analysis
The trucks in use have an average age of 25 years meaning they are inefficient and use old
technology which is expensive. Some operators have trucks with smaller capacity and they have
better chance of increasing their revenues especially when they are dealing with large
institutions since they can make numerous trips and billings is made against trips as opposed to
truck capacity.
The truck owner has in many cases no way of validating the number of trips made since clients
are not issued with receipts. The dumping sites are not properly controlled and largely truck
The Bill & Melinda Gates Foundation CHAPTER 3 : RESULTS AND ANALYSIS OF URBAN FSM PRACTICE Landscape Analysis and Business Model Assessment in Fecal Sludge Management: Extraction and Transportation Models in
Africa - Kenya
LOSAI MANAGEMENT LIMITED 3-182
drivers do not record the trips they make. The truck owners incur more cost trying to monitor
the business.
3.4.2.2 Sustainable Business Models across the Common Parameters
Micro-Finance Fund Model
In most urban areas especially low income areas such as the informal settlements, the
challenges of managing fecal sludge are enormous. This is compounded by the fact that most
slum areas are inaccessible and lack basic social amenities, while those available are in
deplorable conditions.
To address the challenges of fecal sludge management, there is need to empower FSM service
providers by offering low cost targeted credit, which they may then use to acquire tools,
machines and equipment essential for the effective delivery of their services.
Reasons for establishment of a micro-finance fund include:
1. High cost of Credit: Unfortunately, commercial bank offer credit at high interest rate
which makes it unviable for many borrowers as the servicing costs are too high.
2. Small loan size: In addition high rates of interest imply a very low maximum loan
account. For many service providers large loans are necessary for these operators to
transition from micro to small and then to medium sized enterprises. Accessing credit at
high interest rates always exerts too much pressure on the business cash flow since the
loan must be serviced.
3. Unfamiliarity with FSM: Many commercial banks are unfamiliar with the FSM sub sector
and do not have appropriate credit facilities available to such borrowers.
4. MFI’s operate small loan sizes: Existing MFI’s have very low credit limits which are not
suited for the required lump sums by industry operators.
To overcome these challenges a specialty funded micro-finance fund would be established
to augment an existing one operated by SANA. SANA which has been operating such a
microfinance model and fund targeted at sanitation services that has enhanced the access
to credit to the sub-sector scheme albeit at a micro capitalization level relative to the
demand for funding.
SANA is a specialist water and sanitation sector NGO, implementing projects in Nyanza – in both
urban and rural areas of the province. Through its commercial arm – SANA Holdings Ltd, the

The Bill & Melinda Gates Foundation CHAPTER 3 : RESULTS AND ANALYSIS OF URBAN FSM PRACTICE Landscape Analysis and Business Model Assessment in Fecal Sludge Management: Extraction and Transportation Models in
Africa - Kenya
LOSAI MANAGEMENT LIMITED 3-183
NGO is currently offering credit to 7 water and sanitation associations in Nyanza, enabling some
35,000 people to access safe water supplies and sanitation.
The Study Team found the SANA Credit for Water and Sanitation model quite an interesting
initiative – which could fittingly be replicated in the FSM system. Here below is highlighted the
main features of the SANA Model.
1. Previous sanitation initiatives – mainly through donor grants, have failed to improve
access to sanitation by the majority of the population, mainly because of hijacking by
the rich and unsustainability of installed facilities.
2. Sanitation has in the past been accorded a rather low priority – vis-à-vis water –
resulting in sanitation being denied access to adequate investment finance.
3. Hence, the main objective of sanitation loans is to enable for the establishment of a
revolving loan fund pool – exclusively dedicated to sanitation development: at the
household level and public places – in low income areas.
4. The target beneficiaries are women groups and self-help groups (50% must be women)
– with a membership of 10-30 people. Whilst the group acts as the main security for the
loans disbursed, individual members are expected to save monthly into the collective
pool and service disbursed loans.
5. After servicing sanitation loans, members can venture into other related income
generating activities, e.g. solid waste management (and hence possibility exists here for
FSM?)
Bio-Centre Model
Throughout the developing world many of the urban poor depend on informal, private small-
scale providers for sanitation services. These entrepreneurs receive no government resources
but survive by offering services that the consumers want and are willing to pay for. Small Scale
Providers (SSPs) mostly provide manual emptying services to the slum dwellers since
mechanical emptiers cannot access the slums due to overcrowding and lack of infrastructure.
SSPs were thought to offer only temporary, short-term solutions to the increasing and unmet
demand for sanitation services and were often ignored by government policy makers and
donors. But there is growing recognition that a meaningful response to the needs of low-
income and informal areas must involve partnerships between small entrepreneurs and formal
utilities.

The Bill & Melinda Gates Foundation CHAPTER 3 : RESULTS AND ANALYSIS OF URBAN FSM PRACTICE Landscape Analysis and Business Model Assessment in Fecal Sludge Management: Extraction and Transportation Models in
Africa - Kenya
LOSAI MANAGEMENT LIMITED 3-184
One of the reasons for this change in attitude is the persistent failure by municipalities and
public utilities to meet service demands in slum settlements that develop on the outskirts of
cities and towns. This gap can be filled by SSPs who have shown remarkable resourcefulness in
finding simple, but effective, solutions often under the most adverse operating conditions.
The high population density, unplanned and crowded housing, and lack of infrastructure have
resulted in poor provision of environmental and social services in most slums areas.
Furthermore most slums areas are inaccessible to vehicles, drainage channels on the sides of
the roads are often blocked, pit latrines overflow (especially in the rainy season) and heaps of
uncollected garbage is everywhere. Taking all these factors into consideration the construction
of a bio-centre would offer an opportunity to provide sanitation facilities while addressing the
issue of fecal management.
A bio-centre is a bio sanitation unit that provides secure and adequate access to sanitation and
income generation by converting human waste (fecal sludge) into biogas and fertilizer (liquid
and solid). Bio centres contain sanitation facilities such as showers and toilets and are mostly
located in slums areas where access to sanitation is low or non existence. The households that
are served by the bio-centre pay a small fee of about USD 5 cents (Kshs. 5) to access it.
The bio-centre also contains a digester which is used to process fecal sludge to produce biogas
and fertilizer. The biogas is used for cooking. The major advantage of using biogas over
kerosene is reduction of health complications like respiratory problems caused by use of
kerosene while reducing gases emitted to the environment.
Reasons for establishment of Bio-Centres include:
Positive Impact on Health: The location of bio-centre in a slum area has the highest
impact on hygiene and health; it offers an alternative and better access to sanitation.
Sanitation facilities in slums are close to non existent, even the few available are in
dilapidated conditions. One latrine is often used by several households or even several
plots (a plot refers to a group of rooms either belonging to the same owner or placed
side by side), which means up to 150 people may be sharing a single latrine. In many
cases the latrines lack privacy and security, are unhygienic and in poor condition with
gaping holes in the walls, broken doors and filled pits.

The Bill & Melinda Gates Foundation CHAPTER 3 : RESULTS AND ANALYSIS OF URBAN FSM PRACTICE Landscape Analysis and Business Model Assessment in Fecal Sludge Management: Extraction and Transportation Models in
Africa - Kenya
LOSAI MANAGEMENT LIMITED 3-185
Where neither private nor public latrines are available, many residents have had to
resort to using plastic bags that are then dumped in alleys and ditches – a practice called
“flying toilets”. In the already overcrowded slums, lack of adequate water supply, solid
waste management, excreta disposal, drainage and wastewater management impact
severely on public health. Most of the widespread diseases in these slum areas are
linked directly to inadequate water and sanitation provision (diarrhoea, skin diseases,
typhoid, tuberculosis, malaria).
Cultural Acceptance : The concept of bio-centre has a cultural acceptance in that the
sanitation facilities are located outside households like in majority of rural areas.
Income and Employment generating and economically self sustaining : The centre also
offer a source of employment to the community through the construction and
management of such centres. There is considerable expertise in selecting an ideal site of
a bio centre and construction of one as is undertaken by Umande Trust in Kenya.
Funding the construction of bio centres therefore has multiple benefits to the
community most of all economic, health and social.
Umande Trust
Umande is a rights-based agency supporting community-based initiatives in Kenya. It currently
has operations in Nairobi (where its head office is located), Kisumu and Embu town. It’s main
focus area of operation is water and sanitation: financing investment and eco-friendly
technologies.
In Kisumu, it has operations in 4 slums of Bandani, Obunga, Manyatta and Nyalenda – where it
has financed community members’ sanitation facilities through its Sanitation Development
Fund (SANDEF). Umande’s flagship initiative however is the Bio-Sanitation Center of which at
the national level Umande operates more than 48 bio-centres.
Design
The bio centre pre construction process starts with a design of a bio digester a shown in Figure
3-34.

The Bill & Melinda Gates Foundation CHAPTER 3 : RESULTS AND ANALYSIS OF URBAN FSM PRACTICE Landscape Analysis and Business Model Assessment in Fecal Sludge Management: Extraction and Transportation Models in
Africa - Kenya
LOSAI MANAGEMENT LIMITED 3-186
Courtesy: Umande Trust
Figure 3-34 : Bio Centre Construction
After the completing the design of the centre, the site is selected and the work of constructing
it begin with excavation and laying of the foundation as shown in Figure 3-35.
Courtesy: Umande Trust
The dome and super structure are also constructed as shown below in Figure 3-36.
Figure 3-35 : Excavation and Laying of Foundation for Bio-Centre

The Bill & Melinda Gates Foundation CHAPTER 3 : RESULTS AND ANALYSIS OF URBAN FSM PRACTICE Landscape Analysis and Business Model Assessment in Fecal Sludge Management: Extraction and Transportation Models in
Africa - Kenya
LOSAI MANAGEMENT LIMITED 3-187
Courtesy: Umande Trust
A complete bio-centre is shown in Figure 3-37.
Location
The location of a bio-centre should be in low income areas with low access to sanitation
facilities. One bio-centre can serve households within a radius of up to sixty metres. Such a
facility would have a huge impact in provision of sanitation facilities to many households given
the nature of congestion in slums.
The Treatment Process and Value Addition
Figure 3-36 : The dome and super structure of a Bio-centre
Figure 3-37 : Complete Bio-Centre

The Bill & Melinda Gates Foundation CHAPTER 3 : RESULTS AND ANALYSIS OF URBAN FSM PRACTICE Landscape Analysis and Business Model Assessment in Fecal Sludge Management: Extraction and Transportation Models in
Africa - Kenya
LOSAI MANAGEMENT LIMITED 3-188
The fecal sludge is treated in the digester to produce biogas and organic fertilizer. A digester
operates as shown in Figure 3-38. The biogas is piped to household who use is as a source of
energy.
Implications
• Social Implications
The bio-centre offers an opportunity to provide basic social amenities like toilets to many
households since one bio-centre can serve households within the radius of up to sixty metres.
As existing amenities are often in deplorable conditions in slum areas, construction of a bio-
centre would enhance the human dignity of households living there.
• Financial Implication
Construction of bio-centre offers employment opportunities to communities residing
where it is located. A community can be empowered by allowing them to run the
centre’s thus earning a source of income. The biogas is a cheap source of green energy
meaning it will reduce expenses incurred by household purchasing kerosene which is
expensive since it is dependent on international crude oil prices.
Figure 3-38 : Schematic of Feacal Sludge Digester

The Bill & Melinda Gates Foundation CHAPTER 3 : RESULTS AND ANALYSIS OF URBAN FSM PRACTICE Landscape Analysis and Business Model Assessment in Fecal Sludge Management: Extraction and Transportation Models in
Africa - Kenya
LOSAI MANAGEMENT LIMITED 3-189
The use of biogas also reduces medical expenses incurred by household who use
kerosene since it has a negative effect on their respiratory systems. The biogas can also
be supplied to middle income households who live nearby at a much higher price. The
production of organic fertilizer would also increase the income earned by the
community making the venture viable in the long term.
FS Treatment Plant Model
Across the three cities two broad types of treatment plants/dumping sites are known to exist,
one-conventional type and two stabilization pond type. The conventional type includes is ideal
for treating FS for re-use especially where quality control standards are to apply to mitigate the
poor processing of heavy metals. However the production of treated FS is very low and the
availability is also irregular.
Therefore investing in enhancing Treatment plants would increase production. The
enhancement would be for product drying, packaging and distribution. Treated FS is more
affordable than commercial fertilizers. The acceptability of treated FS re-use would be raised by
increased public education, though already there is FR-re-use acceptability. Investing in
modernizing FSTP to rely less on weather for the drying process would increase annual output.
Kenya has wet conditions for 8 months of the year. In addition, because of the bulky nature of
treated FS packaging would ease transportation and distribution to market. The large share of
agriculture in the economy at 24% of GDP would offer a market for the use of treated FS.
In the conventional type, there is use of mechanical aeration, filtration and discharge in
treatment of fecal sludge. At the inlet the fecal sludge is filtered for solids and metals before
being released into a tank where it is stirred for effective concentration. The fecal sludge is then
moved to filtration tank and then to sedimentation tank which has a filter of rocks and sands
for separation of solid and liquid. Wastewater treatment standards are included in the design
such as a BOD of 560 mg/l or a design of BOD/SS effluent standard of 20/30. The processed
fecal sludge which is transforming to organic fertilizer is left to dry naturally in the drying beds.
In the drying beds further use of use of ultra violets rays from sunlight to kill micro organisms in
the fecal sludge improves quality control in the processing. The challenge in Kenya is the need
to hasten the drying process, packaging of the treated FS and distribution of the final product.
Treated FS-re use is acceptable in Kenya. The present processes are slow as the sludge is
pumped to the drying beds which depend on the weather to complete the process Figure 3-39.

The Bill & Melinda Gates Foundation CHAPTER 3 : RESULTS AND ANALYSIS OF URBAN FSM PRACTICE Landscape Analysis and Business Model Assessment in Fecal Sludge Management: Extraction and Transportation Models in
Africa - Kenya
LOSAI MANAGEMENT LIMITED 3-190
The beds have under drains which drain excess wastewater back to the treatment plant.
Figure 3-39: First sludge drying bed at Kariobangi Treatment Plant
Drying of the treated sludge depends on weather conditions. It takes an average of two (2)
weeks for complete drying of the treated sludge. Kenya generally has 8 wet months in a year,
therefore only availing drying opportunities for 20 out of 52 weeks. Moreover as the 20 weeks
are grouped in two clusters of 8 weeks (January and February) and 12 weeks (August,
September and October), there is variation in production. The ideal is to ensure production
through out March, April, May, June and July through industrial drying. In addition to
strengthen the market supply of the product storage of the dried sludge would be needed to
hold stock ready for distribution.
Figure 3-40 shows portions of already dried sludge ready to be sold. Currently none of the
treatment parts in the country has storage facilities for dried sludge since the plants are being
operated below capacity. Thus it is sold directly to farmers.

The Bill & Melinda Gates Foundation CHAPTER 3 : RESULTS AND ANALYSIS OF URBAN FSM PRACTICE Landscape Analysis and Business Model Assessment in Fecal Sludge Management: Extraction and Transportation Models in
Africa - Kenya
LOSAI MANAGEMENT LIMITED 3-191
Figure 3-40: Second sludge drying bed at Kariobangi Treatment Plant
The treated and dried FS is sold directly to farmers who use it as night soil for growing a variety
of crops such as tea, coffee and in agro- forestry.
Reasons for increasing production:
Increase production: The processed fecal sludge needs to be dried so as to remain with
solid organic fertilizer. The drying process is done naturally by leaving the processed
fecal sludge in t he field to be dried by the sunlight. The biggest challenge with the
present approach is that the process is dependent on the weather. During the rainy and
cold season which is 8months of the year, the processed fecal sludge cannot be dried.
In a competitive business value chain, such a scenario would result in a lot of inefficiencies
and losses. There is need to fund the treatment plants to acquire drying machines so as to
make fecal sludge management a viable business. This will enable the operations to run
throughout the year irrespective of the weather conditions.
Increase retailing opportunity: Processed fecal sludge is bulky in nature which makes it
very cumbersome and unviable to transport. In order to improve the transportation and
distribution logistics of treated sludge, there is need to provide funds for the
Dried treated sludge

The Bill & Melinda Gates Foundation CHAPTER 3 : RESULTS AND ANALYSIS OF URBAN FSM PRACTICE Landscape Analysis and Business Model Assessment in Fecal Sludge Management: Extraction and Transportation Models in
Africa - Kenya
LOSAI MANAGEMENT LIMITED 3-192
establishment of packaging lines at the treatment plants. The packaging line would be
able to process many bags per day. This will enable the treatment plants to package the
processed fecal sludge in smaller quantities which can be sold at retail stores. This will
create market for processed fecal sludge since it is easy to be accessed by small scale
farmers.
Treatment plants have been selling treated sludge to local farmers. In general demand far
outstrips supply, but transportation remains a big challenge. Most towns are surrounded by
large farming settlements and the need for FS based manure would be in great demand,
moreover it is by far very affordable. Treated FS costs USD 1.45 per tonne while commercial
fertilizer costs USD 900 per tonne. This price differential would be a big driver of demand.
3.5 Details and Recommendations of Business for Investment and Growth
Bio-centres
Sewerage coverage in the 3 cities and across Kenya is very low. Access to quality sanitation is
lacking for more than 60% of the population residing in these 3 cities.
The quality of sanitation in the informal settlement areas is in particular very low, sometime
lacking and where available fails to meet sanitary standards.
The location of bio-centres in densely populated areas has the highest impact on hygiene and
health as it offers an alternative and better access to sanitation. Bio centres may be classified
into two categories, namely:
• Bio-centre – Town complex: - this includes bathrooms, toilets and grocery stores. These
are often located in the town areas, and often connected to the sewer system. They
generally tend to replace public toilet facilities where some were provided in the past by
the local authority.
• Bio-centre – Estate complex: this includes bathrooms, toilets, cooking centre, social hall,
cyber café, office block and grocery store. These are often located in the settlement
areas and act as a service provision initiative, as the informal settlements lack decent
facilities. They may or may not be connected to the sewer line, but often they are not
connecting to any sewer line. In most cases their location is inaccessible by motor
vehicle and therefore emptying is carried out by manual emptiers.

The Bill & Melinda Gates Foundation CHAPTER 3 : RESULTS AND ANALYSIS OF URBAN FSM PRACTICE Landscape Analysis and Business Model Assessment in Fecal Sludge Management: Extraction and Transportation Models in
Africa - Kenya
LOSAI MANAGEMENT LIMITED 3-193
Bio-centres of both kinds are a key initiative in FS management in the 3 cities covered under the
study. At present there are more than 100 bio-centres at the national level.
3.5.1 Current Service Levels
Service levels
Bio centre complexes provide at least 6 services (Table 3-132).
1. Sanitation facilities:- bathrooms and toilets including hot showers
2. General grocery:- retails household items and refreshments
3. Hire of public kitchen:- this is operated on biogas
4. Social hall for hire:-this is available to members of the public
5. Office space for hire:- this includes very short term lease offices including day hire
offices
6. Cyber café services:- this service is available to members of the public
Table 3-132 : Bio –Centre Complex Service Levels
Town Bio-centre Complex Estate (Residential Area) Bio-centre Complex
1. Sanitation facilities:- bathrooms and toilets including hot showers
2. General grocery:- retails household items and refreshments
1. Sanitation facilities:- bathrooms and toilets including hot showers
2. General grocery:- retails household items and refreshments
3. Hire of public kitchen:- this is operated on biogas
4. Social hall for hire:-this is available to members of the public
5. Office space for hire:- this includes very short term lease offices including day hire offices
6. Cyber café services:- this service is available to members of the public
3.5.2 Current Profitability
Traffic to a very well performing bio-centre sanitation block of 8 toilets and 8 bathrooms
exceeds 1000 people per day (Table 3-133).

The Bill & Melinda Gates Foundation CHAPTER 3 : RESULTS AND ANALYSIS OF URBAN FSM PRACTICE Landscape Analysis and Business Model Assessment in Fecal Sludge Management: Extraction and Transportation Models in
Africa - Kenya
LOSAI MANAGEMENT LIMITED 3-194
Table 3-133 : Data on Typical Bio-Centre
High Performing Bio- centre Income Statement
Bio Centre Estate Complex Bio Centre Town Complex
Revenues Per Month Per Annum Per Month Per Annum
Sanitation fees 1,034 12,414 1,379 16,548 Gas fees 207 2,483 Other fees 207 2,483 200 2,400 Total Revenues 1,448 17,379 1,579 18,948 Operating Costs Salaries 161 1,931 241 2,897 Water fees 14 166 20 240 Electricity 11 138 20 240 Detergents 7 83 15 180 Toiletry 69 828 80 960 Total Costs 262 3,145 376 4,517 Net Income 1,186 14,234 1,203 14,431
Source: Umande Trust
These are top performing biocentres and the average profit for bio centres is about USD 400
per month and USD 4,800 per annum. Relative to the cost of a bio-centre, the pay back period
is within 5 years.
3.5.3 Projected Profitability in 3-5 years
Unit profitability does not increase rapidly but the group profit of the managing unit is driven by
expansion in order to lower unit cost of centralized management. Operation of more than 50
units provides economies of scale. The revenue combined of 50 units would be approximately
USD 20,000 per month in profit and more than USD 240,000 per annum.
However, to invest back in the community, a system has to be devised that pays more than 80%
of these amounts reported as profit back to the community groups that works within the
development of the bio-centre. Therefore scaling up does increase the profitability and
sustainability of the entire service as all stakeholders experience welfare improvements.

The Bill & Melinda Gates Foundation CHAPTER 3 : RESULTS AND ANALYSIS OF URBAN FSM PRACTICE Landscape Analysis and Business Model Assessment in Fecal Sludge Management: Extraction and Transportation Models in
Africa - Kenya
LOSAI MANAGEMENT LIMITED 3-195
3.5.4 Investment Required
A single bio centre estate complex costs USD 19,540 to construct. There exists already a large
demand for bio centres in the country. The biggest challenge to establishing bio-centres has
been funding. The demand is estimated as needing 300 units, therefore requiring a total
investment of USD 5.8 million.
The distribution is as follows:
• 170 units in Nairobi
• 80 units in Mombasa
• 50 units in Kisumu
We propose the implementation to be as follows:
• Appointment of a fund administrator: to manage the funds received to be invested in
bio-centres and disburse the funds under a micro-finance set-up where then a revolving
fund is to emerge.
• Call for Request for Proposals: call out for proposals from interest groups to provide bio-
centre implementation.
• Vetting Criteria: Establish criteria for determining the organizations or individuals that
would be suitable to work with on the implementation.
• Funding Selection criteria: Establish a criteria for qualifying those who are eligible for
funding under the bio-centre funding initiative
• Service provider criteria: In order to ensure greater value for money, establish a listing
of accredited service providers which includes bio-centre management service
providers, contractors, manual emptiers, mechanical emptiers and social workers. The
objective is to ensure value for money as well as building long term capacity in the FSM
sub sector.
3.5.5 Risk Analysis
The projects do face numerous risks but those associated with performance are mitigated by
careful analysis to understand the environment better and the involvement of the local
community as stakeholders. This also secures the project against vandalism or other form of
physical destruction.

The Bill & Melinda Gates Foundation CHAPTER 3 : RESULTS AND ANALYSIS OF URBAN FSM PRACTICE Landscape Analysis and Business Model Assessment in Fecal Sludge Management: Extraction and Transportation Models in
Africa - Kenya
LOSAI MANAGEMENT LIMITED 3-196
1. Unsuitable location either by population, acceptance or accessibility. This risk is
mitigated by an analytical methodology that is used to evaluate each bio-centre project.
2. Initial low traffic users: This should be mitigated by bringing onboard the local
community as stakeholders and working with a community group to champion the use
of the facility. In the town centre areas, the role of the local authorities, utility
companies and other stakeholders shall be incorporated to provide the project with the
sufficient levels of goodwill.
3.5.6 Future Service levels
These include:
1. Sale of treated FS for re-use
2. Sale of piped biogas to households
3. Sale of cylindered biogas to households
Various stakeholders are currently undertaking product research in these areas and are in the
process of developing the product prototypes and in other cases there are plans for early stages
of product testing in December 2011.
i. Expected Impact
Table 3-134 indicates the city statistics showing the number of households per square
kilometers, the area and city population densities. The bio centers are expected to have a
social-economic impact to the people within the bio centre proximity and by extension the
dwellers of the three cities. Assuming that typical household has at least 6 members, the total
population we expect the project to service will be over 200,000 persons (Table 3-135).
Table 3-134 : City Statistics on Population
City Area km2 Households Density per km2 Population by city
Nairobi 695.1 985,016 4,515 3,138,369
Mombasa 126.2 140,535 4,146 523,183 Kisumu 917.9 148,494 674 618,556 Total 1,739.2 1,274,045 4,280,108
Source:Kenya National Bureasue of Statistics, Census Data 2009

The Bill & Melinda Gates Foundation CHAPTER 3 : RESULTS AND ANALYSIS OF URBAN FSM PRACTICE Landscape Analysis and Business Model Assessment in Fecal Sludge Management: Extraction and Transportation Models in
Africa - Kenya
LOSAI MANAGEMENT LIMITED 3-197
We expect impact at 4 levels
1. Employment
2. Access to quality sanitation
3. Health improvement
4. Industry formalization
Table 3-135 : Projections for Population to be Served
Service radius in meters per Biocentre 225
Area Coverage (Km2) per Biocentre 0.16
Total area in km2 for the 3 cities 1,739
Households per Sq km 733
Estimated Population ( HH) 117
For 300 Bio centers 34,966
Number of Persons Per HH 6
Total Population 209,796
On the whole we expect employment of over 3,000 people on a sustainable basis. More than
10,000 people shall indirectly be employed and well over 100,000 people shall economically
benefit from the bio-centre facilities. These employees include- contractors, maintenance staff,
administration staff, emptiers, social workers, community workers, shop keepers, farmers,
transporters and security personnel.
With 300 bio centre facilities, more than 30,000 families shall receive direct access to improved
sanitation especially in the informal settlements. In addition the facilities shall be available to
more than 500,000 users across the three cities.
The 30,000 families will have access to better sanitation including more than 150,000 children
who are likely to be exposed to a more sanitary environment.
From the level of organization to be brought onboard in executing the implementation of the
bio-centres, the FSM sub- sector will enjoy enhanced capacity and develop the much needed
formal structures to help shape future national policy. This formalization is likely to improve the
welfare of the people and the environments they live in.

The Bill & Melinda Gates Foundation CHAPTER 4 : CONCLUSION Landscape Analysis and Business Model Assessment in Fecal Sludge Management: Extraction and Transportation Models in
Africa - Kenya
LOSAI MANAGEMENT LIMITED 4-1
CHAPTER 4. CONCLUSION
Following the landscape review of FSM practices in the 3 cities of Nairobi, Kisumu and
Mombasa , the findings indicate that most households have on-site sanitation and far too many
use manual emptiers as opposed to mechanical emptiers. The main reason for the preference
of manual emptiers is affordability. Only 19.5% of Kenyan households are connected to the
sewerage system in all the cities and towns in the country. The remainder use on-site sanitation
facilities – with the simple pit latrine accounting for whopping 74.1% in the rural areas and
62.5% in towns (Table 4-1).
Table 4-1 : HH by Main Mode of Faecal Waste Disposal – Kenya
Mode of disposal % Urban % Rural
1. Main Sewer 19.5 0.2
2. Septic Tank 8.0 0.5
3. Cess Pool 0.7 0.1
4. VIP Pit Latrine 5.9 4.3
5. Pit Latrine (Covered/Uncovered 62.5 74.1
Source: 2009 Kenya Population Census
The data at the City level for Mombasa and Kisumu shows a predominance of on-site sanitation
in these two towns (Table 4-2). Nationally, Nairobi remains by far the most sewered town in the
country and most towns having on-site sanitation. The rapid urbanization in Nairobi and other
towns is increasing the proportion of on-site sanitation comprising of septic tans and cess pools
and predominantly pit latrines in the informal settlements. The construction and usage of the
simple (or ordinary) pit latrine varies considerably from place to place and in varied socio-
economic situations – in regard to safety, hygiene and privacy parameters, so much so that,
some could not qualify to be regarded as being “safe and hygienic mode of excreta disposal.”

The Bill & Melinda Gates Foundation CHAPTER 4 : CONCLUSION Landscape Analysis and Business Model Assessment in Fecal Sludge Management: Extraction and Transportation Models in
Africa - Kenya
LOSAI MANAGEMENT LIMITED 4-2
Table 4-2 : HH by Main Mode of Faecal Waste Disposal-Kisumu, Mombasa and Nairobi
Households statistics Kisumu Mombasa Nairobi Total
Number of Households 148,494 140,535 985,016 1,274,045
Number of households with onsite sanitation facility 124,830 115,228 502,839 742,897
Households with pit latrines 97,367 62,223 331,874 491,464
Households with Septic tanks 24,966 24,198 65,369 114,533
Households with Cess pools 2,497 28,807 105,596 136,900
Households with sewer connections 16% 18% 49% 42% Number of households with onsite sanitation facility 84% 82% 51% 58%
Households with pit latrines 66% 44% 34% 39% Households with Septic tanks 20% 21% 13% 15% Households with Cess pools 3% 46% 32% 28%
Manual emptying included: closing the pit when full and digging another one, burying the pit,
directing the sludge into existing drainage channels or directing liquid FS into farms, closing the
pit when full and reusing it after some time when the sludge has reduced (Table 4-3).
Table 4-3 : Methods of Emptying Fecal Sludge in the Three Cities
Nairobi Mombasa Kisumu
Mechanical Manual Mechanical Manual Mechanical Manual % of Method of Emptying by HH with on-site sanitation 52% 48% 7% 93% 25% 75%
% of Share of Volume of FS emptied by method 32% 68% 10% 90% 2% 98%
% of the HH with on-site sanitation having pits in the city emptied 38% 62% 7% 93% 17% 83%
% of the HH with on-site sanitation having septic tanks in the city emptied 71% 29% 8% 92% 53% 47%
% of the HH with on-site sanitation having cesspool in the city emptied 84% 16% 8% 92% 87% 13%
Total ( # in absolute terms) 825,741 287,080 269,966
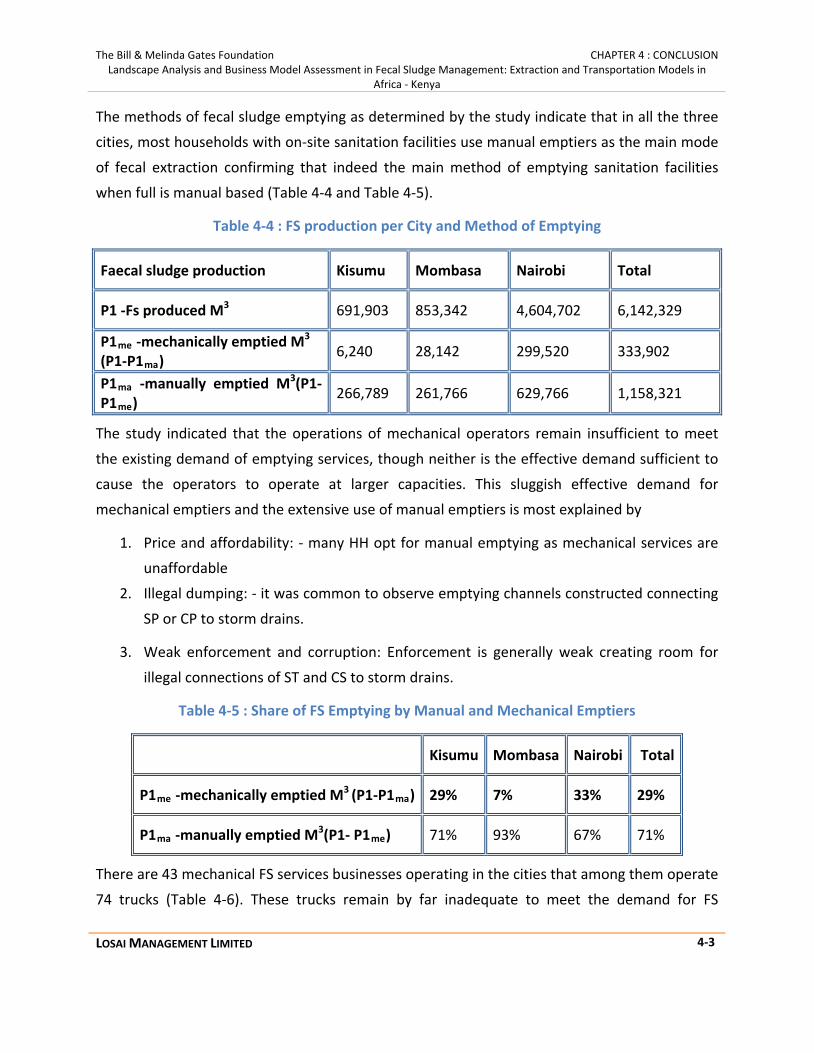
The Bill & Melinda Gates Foundation CHAPTER 4 : CONCLUSION Landscape Analysis and Business Model Assessment in Fecal Sludge Management: Extraction and Transportation Models in
Africa - Kenya
LOSAI MANAGEMENT LIMITED 4-3
The methods of fecal sludge emptying as determined by the study indicate that in all the three
cities, most households with on-site sanitation facilities use manual emptiers as the main mode
of fecal extraction confirming that indeed the main method of emptying sanitation facilities
when full is manual based (Table 4-4 and Table 4-5).
Table 4-4 : FS production per City and Method of Emptying
Faecal sludge production Kisumu Mombasa Nairobi Total
P1 -Fs produced M3 691,903 853,342 4,604,702 6,142,329
P1me -mechanically emptied M3
(P1-P1ma) 6,240 28,142 299,520 333,902
P1ma -manually emptied M3(P1- P1me) 266,789 261,766 629,766 1,158,321
The study indicated that the operations of mechanical operators remain insufficient to meet
the existing demand of emptying services, though neither is the effective demand sufficient to
cause the operators to operate at larger capacities. This sluggish effective demand for
mechanical emptiers and the extensive use of manual emptiers is most explained by
1. Price and affordability: - many HH opt for manual emptying as mechanical services are
unaffordable
2. Illegal dumping: - it was common to observe emptying channels constructed connecting
SP or CP to storm drains.
3. Weak enforcement and corruption: Enforcement is generally weak creating room for
illegal connections of ST and CS to storm drains.
Table 4-5 : Share of FS Emptying by Manual and Mechanical Emptiers
Kisumu Mombasa Nairobi Total
P1me -mechanically emptied M3 (P1-P1ma) 29% 7% 33% 29%
P1ma -manually emptied M3(P1- P1me) 71% 93% 67% 71%
There are 43 mechanical FS services businesses operating in the cities that among them operate
74 trucks (Table 4-6). These trucks remain by far inadequate to meet the demand for FS
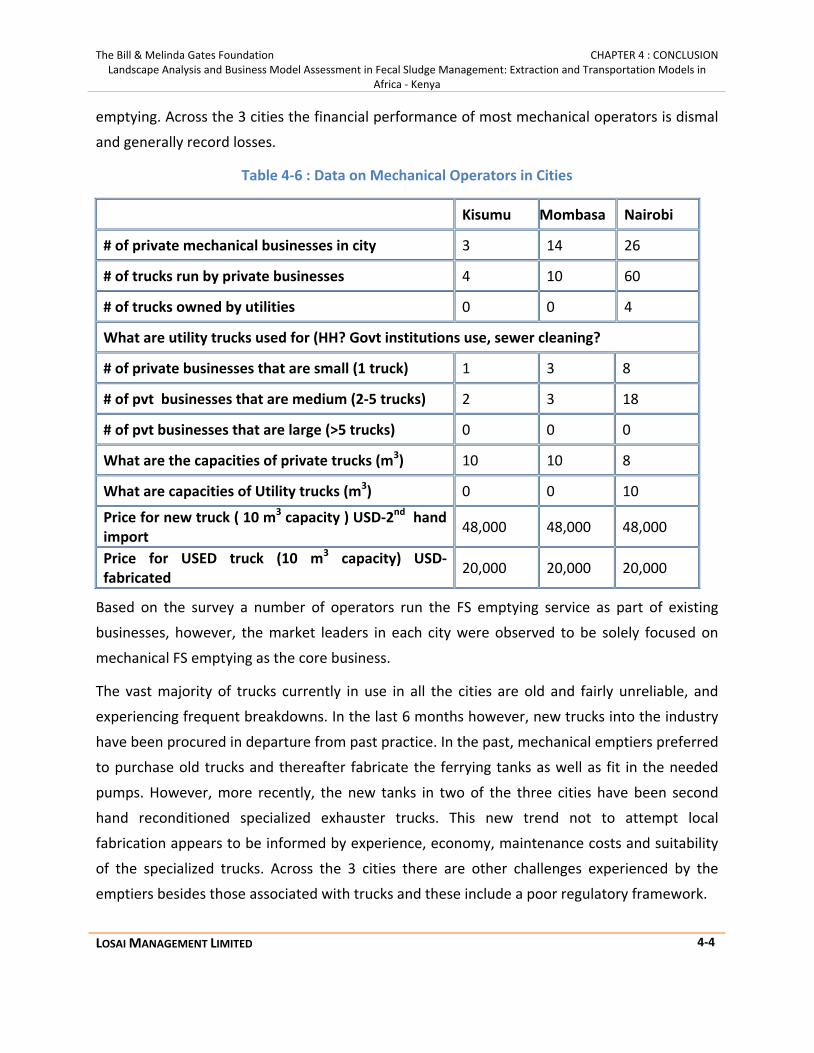
The Bill & Melinda Gates Foundation CHAPTER 4 : CONCLUSION Landscape Analysis and Business Model Assessment in Fecal Sludge Management: Extraction and Transportation Models in
Africa - Kenya
LOSAI MANAGEMENT LIMITED 4-4
emptying. Across the 3 cities the financial performance of most mechanical operators is dismal
and generally record losses.
Table 4-6 : Data on Mechanical Operators in Cities
Kisumu Mombasa Nairobi
# of private mechanical businesses in city 3 14 26
# of trucks run by private businesses 4 10 60
# of trucks owned by utilities 0 0 4
What are utility trucks used for (HH? Govt institutions use, sewer cleaning?
# of private businesses that are small (1 truck) 1 3 8
# of pvt businesses that are medium (2-5 trucks) 2 3 18
# of pvt businesses that are large (>5 trucks) 0 0 0
What are the capacities of private trucks (m3) 10 10 8
What are capacities of Utility trucks (m3) 0 0 10
Price for new truck ( 10 m3 capacity ) USD-2nd hand import 48,000 48,000 48,000
Price for USED truck (10 m3 capacity) USD-fabricated 20,000 20,000 20,000
Based on the survey a number of operators run the FS emptying service as part of existing
businesses, however, the market leaders in each city were observed to be solely focused on
mechanical FS emptying as the core business.
The vast majority of trucks currently in use in all the cities are old and fairly unreliable, and
experiencing frequent breakdowns. In the last 6 months however, new trucks into the industry
have been procured in departure from past practice. In the past, mechanical emptiers preferred
to purchase old trucks and thereafter fabricate the ferrying tanks as well as fit in the needed
pumps. However, more recently, the new tanks in two of the three cities have been second
hand reconditioned specialized exhauster trucks. This new trend not to attempt local
fabrication appears to be informed by experience, economy, maintenance costs and suitability
of the specialized trucks. Across the 3 cities there are other challenges experienced by the
emptiers besides those associated with trucks and these include a poor regulatory framework.

The Bill & Melinda Gates Foundation CHAPTER 4 : CONCLUSION Landscape Analysis and Business Model Assessment in Fecal Sludge Management: Extraction and Transportation Models in
Africa - Kenya
LOSAI MANAGEMENT LIMITED 4-5
This is not surprising as the main institutional context for the effective delivery of FSM in Kenya
is outlined within the Ministry of Water context and therefore is difficult to operationalize at a
city level.
Collected FS by mechanical emptiers is usually dumped at a WWTP. Each of the 3 cities has a
single dumping point (Table 4-7). Though the cities operate WWTP none is actively engaged in
regular production of treated FS for re-use.
Table 4-7 : Wastewater Treatment Plant in Nairobi, Kisumu and Mombasa
An innovative FSM solution available in low income areas in the 3 cities is the existence of
communal sanitation blocks known as bio centres. Bio centres are funded in most instances as a
combination of public and private capital under a framework broadly described as public
private partnership (PPP). Bio centres may be classified into two namely,
• Bio-centre – Town complex: - this includes bathrooms, toilets and grocery stores. These
are often located in the town areas, and often connected to the sewer system. They
generally tend to replace public toilet facilities where some were provided in the past by
the local authority.
• Bio-centre – Estate complex: this includes bathrooms, toilets, cooking centre, social hall,
cyber café, office block and grocery store. These are often located in the settlement
areas and act as a service provision initiative, as the informal settlements lack decent
facilities. They may or may not be connected to the sewer line, but often they are not
Nairobi Mombasa Kisumu
What is the official dumping site for city? (WWTP, FSTP, wetlands, landfill, official open land, or nothing?
Ruai Changamwe Nyalenda (Stabilization Pond)
What is the m3 capacity of this treatment facility? 17,000 2,000
Where is it located? (Center of city, edge of city, outside city..?)
Edge of the city
Edge of the city
Edge of the city
What is the dumping fee truckers have to pay? USD (Per Truck) 2.17 10.87 -
Is this payment per trip or per month or m3 or? Per Trip Per Trip N.A.
The Bill & Melinda Gates Foundation CHAPTER 4 : CONCLUSION Landscape Analysis and Business Model Assessment in Fecal Sludge Management: Extraction and Transportation Models in
Africa - Kenya
LOSAI MANAGEMENT LIMITED 4-6
connecting to any sewer line. In most cases their location is inaccessible by motor
vehicle and therefore emptying is carried out by manual emptiers.
The location of bio-centre in densely populated areas has the highest impact on hygiene and
health as it offers an alternative and better access to sanitation. At present there are more than
100 bio-centres of both kinds at the national level.
Kenya – like many other developing countries elsewhere in the world, is currently faced with
the twin challenges of urban poverty and inadequate sanitation infrastructure in urban slums
and other low income areas. The challenge of FSM requires a multi-pronged approach, which
brings together numerous stakeholders but however begins with the urgent need for a
coherent policy because of the rapid urbanization taking place. There are significant
environmental and health pressure effects building in the urban areas.
The landscape analysis offers a good starting point to obtain an overall perspective of the
status. The subsequent actions include a combination of policy and direct intervention
measures. The direct intervention measures include funding of construction of hundreds of bio
centres and enhancing the capacity of FSTP. Admittedly the fiscal requirements to put in place
sanitary facilities in the urban areas in time are out of reach of the financial strengths of
Government, hence the need to bring on board the private sector in several ways particularly to
spearhead sustainable service delivery models. As the report indicates FS sub-sector is also an
important and emerging industry that needs proactive policy formulation.
The Bill & Melinda Gates Foundation Landscape Analysis and Business Model Assessment in Fecal Sludge Management: Extraction and Transportation Models in
Africa - Kenya
LOSAI MANAGEMENT LIMITED I
BIBLIOGRAPHY
1. Bill and Melinda Gates Foundation, 2011: Water, Sanitation and Hygiene: Grand
Challenges Exploration
2. Straus M. et al, 2000, 2003: On-Site Sanitation: When the Pits are Full: Planning for
Resource Protection in Fecal Sludge Management
3. EAWAG-SANDEC, 2006: Urban Excreta Management: Situation, Challenge and
Promising Solutions
4. Water and Sanitation Program. (2011). Economic impacts of poor sanitation in Africa
5. Water and Sanitation Program (2004): Sanitation is a Business, Approaches for
demand-oriented policies
6. Rose Osinde, 2006: Fecal Sludge Management and On-Site Sanitation in Lunga Lunga
and Korogocho Informal Settlements in Nairobi
7. Water and Sanitation Program & Maji na Ufanisi: 2004: Understanding Small Scale
Providers of Sanitation Services: A Case Study of Kibera (Nairobi)
8. Ministry of Health, Kenya, 2007: The National Environmental Sanitation and Hygiene
(ESH) Policy
9. Ministry of Water and Irrigation, Kenya, 2007: The National Water Services Strategy
(NWSS): 2007 to 2015
10. Government of the Republic of Kenya, 2007: Kenya Vision 2030 A Globally Competitive
and Prosperous Kenya
The Bill & Melinda Gates Foundation Landscape Analysis and Business Model Assessment in Fecal Sludge Management: Extraction and Transportation Models in
Africa - Kenya
LOSAI MANAGEMENT LIMITED II
APPENDIX A: DATA COLLECTION INSTRUMENT
The Bill & Melinda Gates Foundation Landscape Analysis and Business Model Assessment in Fecal Sludge Management: Extraction and Transportation Models in
Africa - Kenya
LOSAI MANAGEMENT LIMITED III
Landscape Analysis and Business Model Assessment in Faecal Sludge Management: Extraction and Transportation Models in Africa
Households’ Survey This questionnaire intends to better understand the system of Fecal Sludge Management in the cities covered by the study. The survey is realized in the framework of a Project funded by Bill and Melinda Gates Foundation. The results will be used in an anonymous way. We request you to answer to questions sincerely and spontaneously. The interview will take almost 30 to 45 minutes.

The Bill & Melinda Gates Foundation Landscape Analysis and Business Model Assessment in Fecal Sludge Management: Extraction and Transportation Models in
Africa - Kenya
LOSAI MANAGEMENT LIMITED IV
Interview N°: ……………………….... Name and Surname of Interviewer: …………………………... Date of interview : ………………................... Address: Phone No. …………….......................
PART 1 : GENERAL INFORMATION ON THE
HOUSEHOLD
1- Name and surname:……………………………………………..
2- Sex:
Male 1
Female 2
3- a)Is the interviewed leading the Household :
Yes 1
No 2
b) What is your relationship with the head of the household?
..............................................................................................
………………………………………………………………
4- Educational Level
Primary 1
Secondary 2

The Bill & Melinda Gates Foundation Landscape Analysis and Business Model Assessment in Fecal Sludge Management: Extraction and Transportation Models in
Africa - Kenya
LOSAI MANAGEMENT LIMITED V
Tertiary(college,university) 3
Non-formal/adult literacy 4
None 5
5- Status of Household Head
Owner 1
Tenant 2
Other 3 Specify :……………………………………………………..
6- Number of persons living in the Household
Total : ………….
7- Main Occupation of the Household Head
Salaried 1
Self employed 2
Trader 3
Artisan 4
Farmer 5
None 6 Specify if :(disabled/retired/unemployed)
Other 7 Specify :…………………………………
8- Secondary Activity/occupation
……………………………..
9-a) Does the Household Head hold any position in the community?
The Bill & Melinda Gates Foundation Landscape Analysis and Business Model Assessment in Fecal Sludge Management: Extraction and Transportation Models in
Africa - Kenya
LOSAI MANAGEMENT LIMITED VI
Yes 1
No 2
b) Does the household head belong to any self help group?
Yes 1
No 2
10-if Yes, specify:
..….………………...….
For the countries where it is not easy for people to talk about their income
11- Transportation means
Bicycle 1
Motocycle 2
Car 3
Boat 4
Donkey 5
None 6
12- Do you have ?
Radio 1
Electricity connection 2
TV 3
Fridge 4
Mobile Phone 5
For the countries where it is easy for people to talk about their income
13-What is your monthly income in Ksh?
Less than 10,000 1
10,000-20,000 2
20,000-30,000 3
30,000-40,000 4

The Bill & Melinda Gates Foundation Landscape Analysis and Business Model Assessment in Fecal Sludge Management: Extraction and Transportation Models in
Africa - Kenya
LOSAI MANAGEMENT LIMITED VII
40,000-50,000 5
Over 50,000 6
14-Source of water supply ?
Individual connection (water company) 1
Individual connection (private) 2
Borehole 3
Water Kiosk 4
Water Vendors 5
Well 6
Surface water 7
Others 8
PART 2 : HYGIENE AND SANITATION
15- Do you have access to a sanitation facility within the household premises/compound?
Yes 1
No 2
b) How many households use/share the facility?
…………………………………………………
If No, ask the question 16 and go to question 37
16- Where do you go to answer a call of nature?
Drainage channel 1
The neighbor 2
Open space 3

The Bill & Melinda Gates Foundation Landscape Analysis and Business Model Assessment in Fecal Sludge Management: Extraction and Transportation Models in
Africa - Kenya
LOSAI MANAGEMENT LIMITED VIII
Other 4
Public Toilet 5
If Yes go to question 17
17- What kind of Facility ?
Sewerage connexion 1
Ordinary Pit Latrine 2
VIP Latrine 3
Septic Tank 4
No Mixed Toilet 5
Cess Pool 6
18- What is the level of satisfaction with the facility?
Very Satisfied 1
Fairly Satisfied 2
Not Satisfied 3
19- Why? …………………………………………………
.............................................................................
.............................................................................
20- When the facility is full, what do you do?
I empty immediately 1

The Bill & Melinda Gates Foundation Landscape Analysis and Business Model Assessment in Fecal Sludge Management: Extraction and Transportation Models in
Africa - Kenya
LOSAI MANAGEMENT LIMITED IX
I empty if I have money 2
I close the pit 3
Not yet full 4
Other 5
21- What kind of emptying service do you use?
Manual 1
Mechanical 2
Other 3
N/A (Sewered) 4
The Bill & Melinda Gates Foundation Landscape Analysis and Business Model Assessment in Fecal Sludge Management: Extraction and Transportation Models in
Africa - Kenya
LOSAI MANAGEMENT LIMITED X
22- If Manual emptying, who does it?
Family Members 1
Manual Emptier (commercial) 2
Other 3
23- On which criteria do you choose type of emptying service?
Cost 1
Availability 2
Quality of Service 3
Other 4
24- How do you pay the emptying service?
One time 1
By tranche 2
When I have money 3
Other 4
25- a) How much do you pay for the service? …………… (in Ksh) for Manual Emptying
…………… (in Ksh) for Mechanical Emptying
b) Do you pay per trip or depending on volume?
...............................................................................................
………………………………………………………………
26- Are you happy with the payment method?

The Bill & Melinda Gates Foundation Landscape Analysis and Business Model Assessment in Fecal Sludge Management: Extraction and Transportation Models in
Africa - Kenya
LOSAI MANAGEMENT LIMITED XI
Yes 1
No 2
27- if No, please propose a payment method
…………………………..…………………..
28- Are you pleased with the quality of the service?
Yes 1
No 2
29- If No, Why?
...............................................................................................
………………………………………………………………
30- What is the emptying frequency?
Twice a year 1
Once a year 2
Every couple of years 3
Other 4
31- Do you reuse the sludge?
Yes 1
No 2

The Bill & Melinda Gates Foundation Landscape Analysis and Business Model Assessment in Fecal Sludge Management: Extraction and Transportation Models in
Africa - Kenya
LOSAI MANAGEMENT LIMITED XII
32- If Yes, for what?
……………………………………………………..
……………………………………………………..

The Bill & Melinda Gates Foundation Landscape Analysis and Business Model Assessment in Fecal Sludge Management: Extraction and Transportation Models in
Africa - Kenya
LOSAI MANAGEMENT LIMITED XIII
PART 3 : FSM IMPROVEMENT
33- Do you think that your way of managing FS has impacts on water quality, health and
environment? Yes 1
No 2
If Yes how ?
………………………………………………………………
34- What could be the benefits of improving FSM in the city?
………………………………………………………………
………………………………………………………………
35- If your present level of service is improved, how much will you be willing to pay?(Ref to
Qn 17,25)
…………………. Ksh
36- Would you accept that sludge from your sanitation facility are treated and sold?
Yes 1
No 2
37- a) Do you know any legal requirements on FSM?
Yes 1
No 2
The Bill & Melinda Gates Foundation Landscape Analysis and Business Model Assessment in Fecal Sludge Management: Extraction and Transportation Models in
Africa - Kenya
LOSAI MANAGEMENT LIMITED XIV
b) If yes, state which one
…………………………………………………………
…………………………………………………………
38- a) Do you feel these requirements are reasonable?
Yes 1
No 2
b) If No why?
…………………………………………………………
…………………………………………………………
39- What should be the role of City/Municipal Council?
…………………………………………………………
…………………………………………………………
40- What should be the role of the Water and Sanitation Utility?
…………………………………………………………
…………………………………………………………
41- a) What should be the role of NGOs?
…………………………………………………………
…………………………………………………………
b) List names of active NGO’S
…………………………………………………………
c) What should be the role of local CBOs?
…………………………………………………………
…………………………………………………………
d) List names of active CBO’S

The Bill & Melinda Gates Foundation Landscape Analysis and Business Model Assessment in Fecal Sludge Management: Extraction and Transportation Models in
Africa - Kenya
LOSAI MANAGEMENT LIMITED XV
Thanks for your support!
The Bill & Melinda Gates Foundation Landscape Analysis and Business Model Assessment in Fecal Sludge Management: Extraction and Transportation Models in
Africa - Kenya
LOSAI MANAGEMENT LIMITED XVI
APPENDIX B: DATA FOR FS CALCULATIONS

The Bill & Melinda Gates Foundation Landscape Analysis and Business Model Assessment in Fecal Sludge Management: Extraction and Transportation Models in
Africa - Kenya
LOSAI MANAGEMENT LIMITED XVII

The Bill & Melinda Gates Foundation Landscape Analysis and Business Model Assessment in Fecal Sludge Management: Extraction and Transportation Models in
Africa - Kenya
LOSAI MANAGEMENT LIMITED XVIII

The Bill & Melinda Gates Foundation Landscape Analysis and Business Model Assessment in Fecal Sludge Management: Extraction and Transportation Models in
Africa - Kenya
LOSAI MANAGEMENT LIMITED XIX