landscape and urban planning - gis.missouri.edugis.missouri.edu/pdfs/sunde et al 2014 lup.pdf ·...
TRANSCRIPT

R
Ip
Ma
b
h
•••••
a
ARR2A
KIIUUUM
1
(ctWC(
((
h0
Landscape and Urban Planning 124 (2014) 104–108
Contents lists available at ScienceDirect
Landscape and Urban Planning
j o ur na l ho me pag e: www.elsev ier .com/ locate / landurbplan
esearch Note
mperviousness Change Analysis Tool (I-CAT) for simulatingixel-level urban growth
ichael G. Sundea, Hong S. Hea,∗, Bo Zhoua, Jason A. Hubbarta, Anthony Spiccib
School of Natural Resources, University of Missouri, 203 Natural Resources Building, Columbia, MO 65211, USAResource Science Center, Missouri Department of Conservation, Columbia, MO 65211, USA
i g h l i g h t s
We present the Imperviousness Change Analysis Tool (I-CAT).I-CAT simulates urban growth in terms of pixel-based imperviousness.Future imperviousness simulated based on historical growth and an MCE approach.We predict extent of impervious surface area for Jackson County, Missouri to 2030.Results demonstrate that I-CAT is effective for quantifying future imperviousness.
r t i c l e i n f o
rticle history:eceived 5 May 2013eceived in revised form4 December 2013ccepted 10 January 2014
eywords:-CATmpervious surfacerban land cover change
a b s t r a c t
Most contemporary urban growth and land cover change models use a binary classification system (e.g.urban/non-urban) to describe urbanized areas. While some models do incorporate continuous urbandevelopment indices, they do not specifically provide quantitative information describing the amountof impervious surface within each prediction unit (e.g. pixel or parcel). Such information is essentialwhen characterizing different urban growth patterns, such as high- or low-density development. Here,we present the Imperviousness Change Analysis Tool (I-CAT), which simulates urban growth in terms ofpixel-based imperviousness. I-CAT uses common drivers of urban growth (e.g. elevation, slope, distanceto water, road networks, and urban centers), along with historic impervious surface area growth trends,to predict the future extent of impervious surface area. A multi-criteria evaluation (MCE) approach is
rban growth simulationrbanizationissouri
used to determine the respective influence (i.e. weight) of each driver of urban growth. In this study,I-CAT was applied to Jackson County, Missouri. Prediction accuracy, which was assessed by the receiveroperating characteristic (ROC) curve method, ranged from 72 to 74 area under curve (AUC). The resultsdemonstrated that I-CAT is an effective tool for providing quantitative estimates of future impervioussurface growth.
. Introduction
Most contemporary urban growth models are cellular automataCA) that generate binary (e.g. urban/non-urban) urban growthlass predictions (Sante, Garcia, Miranda, & Grecente, 2010). Addi-ionally, some CA models (Arsanjani, Helbich, & Vaz, 2013; Chen,
u, Ma, Pu, & Wang, 2010; Maithani, 2010; Wu, Huang, Yuan,ui, & Zhan, 2012) have incorporated multi-criteria evaluationMCE), a method in which an evaluation matrix comprised of
∗ Corresponding author. Tel.: +1 573 882 7717; fax: +1 573 882 1977.E-mail addresses: [email protected] (M.G. Sunde), [email protected]
H.S. He), [email protected] (J.A. Hubbart), [email protected]. Spicci).
ttp://dx.doi.org/10.1016/j.landurbplan.2014.01.007169-2046/© 2014 Elsevier B.V. All rights reserved.
© 2014 Elsevier B.V. All rights reserved.
sets of alternatives and various criteria is created to aid in siteselection (Carver, 1991). In the context of urban growth modeling,MCE is primarily used to produce suitability maps, which helpto determine where growth is likely to occur. While some of theaforementioned types of models incorporate continuous urbandevelopment indices (Li & Yeh, 2000; Liu & Phinn, 2003; Yeh &Li, 2002), none explicitly identify the amount of imperviousnesswithin a given prediction unit (e.g. pixel/parcel).
Impervious surfaces, such as roads, sidewalks, driveways,rooftops, and parking lots, are the primary indicators of urbanizedareas. Imperviousness—the ratio of impervious surface area to unit
area—has been shown to be a reliable proxy for describing the den-sity of urban development (Arnold & Gibbons, 1996). A quantitativerepresentation of imperviousness is essential for characterizinga range of urban growth patterns, such as low- to high-density
M.G. Sunde et al. / Landscape and Urban Planning 124 (2014) 104–108 105
us su
gam1igsddoiuidoici
2
agB2i(mwue
The Transition Probability Module (C) combines the outputof modules A and B into a transition probability grid by assign-ing weights to each explanatory urban growth parameter. Highertransition probability grid values represent higher likelihoods
0
1000
2000
3000 b) slope
1980-1990 1990-2000
0
600
1200
1800
Num
ber
of
pix
els
c) distance to centroids
0
1000
2000
3000 d) distance to major road
0
500
1000
1500 a) elevation
0
6000
12000
18000
0 20 40 60 80 100
e) distance to impervious
surface extent
0
400
800
1200
0 20 40 60 80 100
f) distance to w ater
Normali zed valu es
Fig. 1. Overall model structure and impervio
rowth (Reilly, Maggio, & Karp, 2004). Furthermore, quantifying themount of imperviousness makes it possible to assess the environ-ental impacts of urbanization (Arnold & Gibbons, 1996; Schueler,
994). The Imperviousness Change Analysis Tool (I-CAT) presentedn the following text is a CA model designed to predict urbanrowth in terms of pixel-based imperviousness in order to addresshortcomings associated with models that do not provide detailedescriptions of future impervious surface area. Using I-CAT, weemonstrate that it is possible to simulate pixel-based impervi-usness based on explanatory urban growth drivers and historicalmpervious surface growth. We also show that a multi-criteria eval-ation (MCE) approach can be used to determine the respective
nfluences of explanatory urban growth drivers. Weight coefficientserived using MCE were used to calibrate I-CAT, and the accuracyf simulated impervious surface growth was assessed by compar-ng simulated and actual growth for concurrent time periods. As aase study, we demonstrate an application of I-CAT by simulatingmpervious surface growth for Jackson County, Missouri.
. Methods
I-CAT is comprised of five modules (Fig. 1) that are used tonalyze urban growth drivers commonly identified in other urbanrowth analyses (Agarwal, Green, Grove, Evans, & Schweik, 2002;raimoh & Onishi, 2007; Pijanowski, Brown, Shellito, & Manik,002), as well as to determine the amount and location of future
mpervious surface growth. The Distance (A) and Terrain AnalysisB) Modules generate probability distributions of urban develop-
ent as functions of distance to water, roads, and urban centers, asell as functions of slope and elevation for each pixel. Both mod-les use normalization functions to adjust the range of values forach predictor variable from 0 to 100 (Fig. 2).
rface growth prediction approach for I-CAT.
Fig. 2. Frequency of impervious surface growth relative to normalized urban growthdrivers for the 1980s and 1990s: (a) elevation, (b) slope, (c) distance to centroids, (d)distance to major roads, (e) distance to impervious surface extent, and (f) distanceto major water bodies.
1 Urba
oriSpamc
gppAtbg
�
wtts(
r
tulrd
mtmittltwsdttienir(pis
3
sCtUs
each decade, with a potential impact area of 38.5 km2 per decade.
06 M.G. Sunde et al. / Landscape and
f non-impervious pixels transitioning to impervious, essentiallyeflecting a rank procedure, which is a common tool for determin-ng transition potential in land cover change modeling (Eastman,olorzano, & Van Fossen, 2005). Using MCE, the weights of eacharameter can be adjusted by model users through a trial-and-errorpproach, a method that has been used in other land use changeodeling studies, to increase simulation accuracy during model
alibration (Carlson, 2004; Sun, Forsythe, & Waters, 2007).The Demand and Scenario Module (D) computes total urban
rowth demand for each imperviousness class based on historicalopulation growth. Because there is a strong relationship betweenopulation and built-up impervious surface area (Azar et al., 2010;zar, Engstrom, Graesser, & Comenetz, 2013; Lu, Weng, & Li, 2006),
he expected amount (demand) of impervious surface growth isased on projected population growth/growth ratio. Total urbanrowth demand is determined as follows (Eq. (1)):
I = I1 − I0 = I0(P1 − P0)rP0
(1)
here �I is the expected impervious surface growth for a givenime interval, I1 is the ending total imperviousness, I0 is the startingotal imperviousness, P1 is the ending total population, P0 is thetarting population, and r is the growth ratio given by the formulaEq. (2)):
= (P1 − P0)/P0
(I1 − I0)/I0(2)
The growth ratio (r) describes population density with respect tootal imperviousness for the study area. Module C also allows theser to specify various urban growth scenarios, such as high and
ow density impervious surface growth, by modifying the growthatio to represent various urban growth densities (i.e. lower r = lessense, higher r = more dense).
The Urban Growth Simulation Module (E) uses output fromodules C and D and executes the overall urban growth simula-
ion. Module E is calibrated by modifying the parameter weights inodule C (Fig. 1) and by making comparisons between simulated
mpervious surface growth and historical growth during the sameime period. The module also incorporates a random componenthat allows the model to produce unique results for each simu-ation to better reflect the stochasticity of urban growth. Initially,he module uses a rank order procedure to determine which pixelsill convert from non-impervious to impervious based on the tran-
ition probability grid. An iterative process, whose upper bound isefined by the expected amount of impervious surface growth, ishen used to allocate impervious surface growth. For the alloca-ion process, the module generates a binary grid (1 = presence ofmpervious, 0 = no impervious) starting from the perimeter of thextent of historical impervious surface, then iteratively allocatesew impervious surface growth based on the transition probabil-
ty grid until the expected amount of growth (i.e. demand) has beeneached. Finally, the module assigns percent imperviousness values20–100%, by increments of 10%) for each new impervious surfaceixel based on the historical relationship between the percent of
mperviousness and explanatory urban growth drivers within thetudy area.
. Case study
We used I-CAT to predict impervious surface growth for Jack-on County, in northwestern Missouri. The topography of Jackson
ounty is comprised of rolling hills and open plains, with land coverypes that range from forested to urbanized areas (Ji, Ma, Twibell, &nderhill, 2006). According to the U.S. Census Bureau (2013), Jack-on County has a population of about 674,000; it encompasses the
n Planning 124 (2014) 104–108
majority of Kansas City, which was among the most rapidly sprawl-ing metropolitan areas in the U.S. during the 1990s (BrookingsInstitution, 2002).
Similar to previous urban growth modeling research, popula-tion growth, elevation, slope, and distance to water-bodies, roads,urban cores, and previous impervious surface growth were identi-fied as explanatory drivers of urban growth (Agarwal et al., 2002;Poelmans & Van Rompaey, 2010). Population growth for 2020 and2030 was projected based on historical population growth trends.Historical imperviousness for the years 1980, 1990, and 2000 wasderived from Landsat Thematic Mapper (TM) imagery using ERDASIMAGINE’s Subpixel classifier (Zhou, He, Nigh, & Schulz, 2012). Pixellevel imperviousness values were classified using 10% incrementsranging from 30% to 100%.
Frequency distributions for each of the normalized explanatoryurban growth parameters were derived for the periods from 1980 to1990 and 1990 to 2000 (Fig. 2). The distributions were then used tocreate transition probability grids for each urban growth parame-ter. Afterward, a combined transition probability grid was producedbased on the individual grids (Fig. 1). Impervious surface growthwas then simulated for Jackson County from 1980 to 2000 usingtwo 10-year intervals. Simulation accuracy for the model trainingperiod was assessed by comparing simulated and actual impervioussurface growth for the 1980s. Starting with all parameter weightsequal, the model was calibrated using a trial and error approachby adjusting the weights of the explanatory urban growth param-eters iteratively. After model calibration, simulation accuracy wasassessed by comparing the predicted growth for the 1990s withthe actual growth for the same time period. The receiver operatingcharacteristic (ROC) curve method (Pontius & Schneider, 2001) wasused to assess the accuracy of simulated impervious surface growthfor both time periods. Finally, the parameterized model was used tosimulate impervious surface growth from 2000 to 2030 at 10 yearintervals.
4. Results
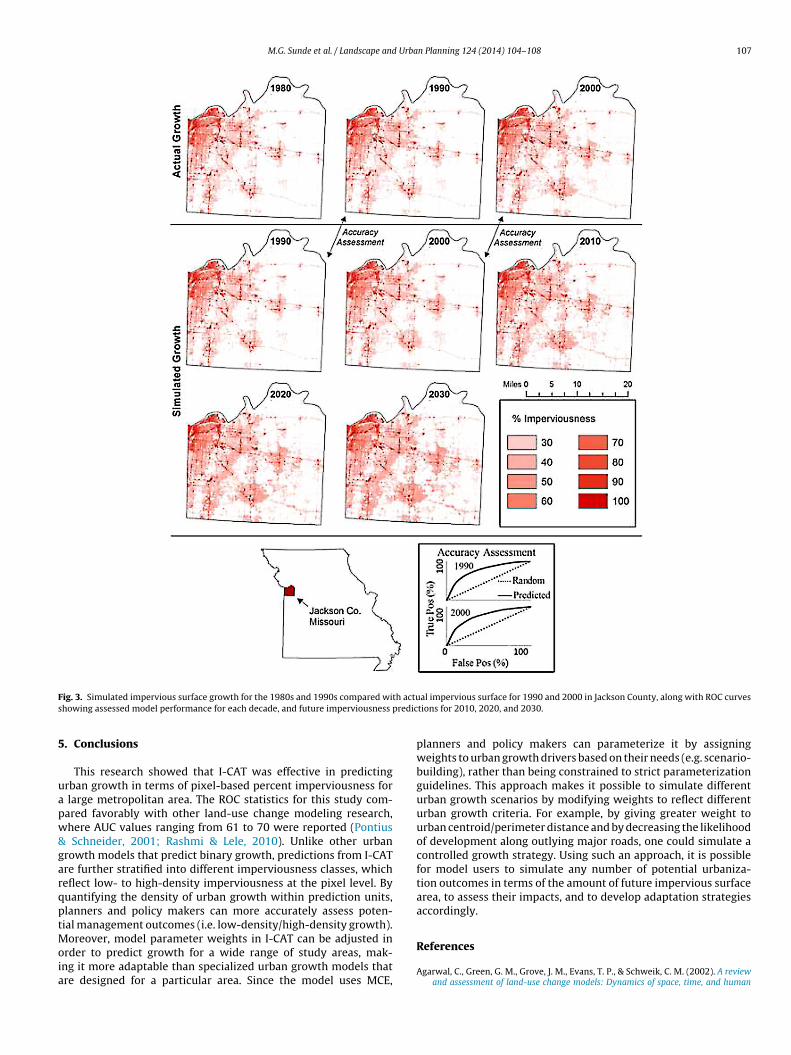
The accuracy of I-CAT’s impervious surface growth simulations,as assessed by the ROC curve method, was 72 and 74 AUC forthe 1980s training period and 1990s validation period, respec-tively (Fig. 3). The patterns seen in the frequency distributionsshowed that, in comparison to the 1980s, pixels changing fromnon-impervious to impervious of any percentage occurred withina wider range of elevations during the 1990s (Fig. 2A). Impervioussurface growth was negligible in areas with high slope gradientsduring both decades (Fig. 2B). Newly developed imperviousnesswas strongly associated with current urban centroids, an associa-tion that became weaker as the distance between urban centroidsincreased (Fig. 2C). New impervious surface growth was morelikely to occur near road networks (Fig. 2D). Minimal develop-ment was observed at distances exceeding 40 m from the roadnetwork. Additionally, the majority of new impervious surfacedevelopment occurred in close proximity to the most recentlydeveloped areas (Fig. 2E). A pattern of development associated withproximity to water bodies was also observed; impervious surfacedevelopment decreased in conjunction with decreasing distanceto major bodies of water (Fig. 2F). Projected impervious surfacegrowth in Jackson County was located primarily near satellite citieswithin the Kansas City metropolitan area (Fig. 3). Impervious sur-face growth in Jackson County was projected to be 18.5 km2 for
By 2030, total impervious surface area within Jackson County isprojected to reach 250 km2, with a potential impact area of about500 km2, or nearly one third of the total land area of JacksonCounty.
M.G. Sunde et al. / Landscape and Urban Planning 124 (2014) 104–108 107
F th actus redic
5
uapw&garqptMoia
ig. 3. Simulated impervious surface growth for the 1980s and 1990s compared wihowing assessed model performance for each decade, and future imperviousness p
. Conclusions
This research showed that I-CAT was effective in predictingrban growth in terms of pixel-based percent imperviousness for
large metropolitan area. The ROC statistics for this study com-ared favorably with other land-use change modeling research,here AUC values ranging from 61 to 70 were reported (Pontius
Schneider, 2001; Rashmi & Lele, 2010). Unlike other urbanrowth models that predict binary growth, predictions from I-CATre further stratified into different imperviousness classes, whicheflect low- to high-density imperviousness at the pixel level. Byuantifying the density of urban growth within prediction units,lanners and policy makers can more accurately assess poten-ial management outcomes (i.e. low-density/high-density growth).
oreover, model parameter weights in I-CAT can be adjusted inrder to predict growth for a wide range of study areas, mak-ng it more adaptable than specialized urban growth models thatre designed for a particular area. Since the model uses MCE,
al impervious surface for 1990 and 2000 in Jackson County, along with ROC curvestions for 2010, 2020, and 2030.
planners and policy makers can parameterize it by assigningweights to urban growth drivers based on their needs (e.g. scenario-building), rather than being constrained to strict parameterizationguidelines. This approach makes it possible to simulate differenturban growth scenarios by modifying weights to reflect differenturban growth criteria. For example, by giving greater weight tourban centroid/perimeter distance and by decreasing the likelihoodof development along outlying major roads, one could simulate acontrolled growth strategy. Using such an approach, it is possiblefor model users to simulate any number of potential urbaniza-tion outcomes in terms of the amount of future impervious surfacearea, to assess their impacts, and to develop adaptation strategiesaccordingly.
References
Agarwal, C., Green, G. M., Grove, J. M., Evans, T. P., & Schweik, C. M. (2002). A reviewand assessment of land-use change models: Dynamics of space, time, and human

1 Urba
A
A
A
A
B
B
C
C
C
E
J
L
L
431–450.
08 M.G. Sunde et al. / Landscape and
choice. Gen. Tech. Rep. NE-297. Newton Square, PA: U.S. Department of Agricul-ture, Forest Service, Northeastern Research Station., 61 p.
rnold, C. L., & Gibbons, C. J. (1996). Impervious surface coverage: The emergenceof a key environmental indicator. Journal of the American Planning Association,62(2), 243–258.
rsanjani, J., Helbich, M., & Vaz, E. (2013). Spatiotemporal simulation of urbangrowth patterns using agent-based modeling: The case of Tehran. Cities, 32,33–42.
zar, D., Engstrom, R., Graesser, J., & Comenetz, J. (2013). Generation of fine-scalepopulation layers using multi-resolution satellite imagery and geospatial data.Remote Sensing of Environment, 130, 219–232.
zar, D., Graesser, J., Engstrom, R., Comenetz, J., Leddy, R., Schechtman, N., et al.(2010). Spatial refinement of census population distribution using remotelysensed estimates of impervious surfaces in Haiti. International Journal of RemoteSensing, 31(21), 5635–5655.
raimoh, A., & Onishi, T. (2007). Spatial determinants of urban land use change inLagos, Nigeria. Land Use Policy, 24, 502–515.
rookings Institution. (2002). Growth in the heartland: Challenges and opportunitiesfor Missouri. Washington, DC, USA: Brookings Institution, Center on Urban andMetropolitan Policy.
arlson, T. N. (2004). Analysis and prediction of surface runoff in an urbanizingwatershed using satellite imagery. Journal of the American Water Resources Asso-ciation, 40(4), 1087–1098.
arver, S. J. (1991). Integrating multi-criteria evaluation with geographical infor-mation systems. International Journal of Geographical Information Systems, 5(3),321–339.
hen, G., Wu, C., Ma, J., Pu, Y., & Wang, J. (2010). An integrated approach ofmulti-criteria suitability evaluation and cellular automata modeling for urbangrowth simulation. In The 18th international conference on geoinformatics , ISBN9781424473014 (pp. 1–4).
astman, J., Solorzano, L., & Van Fossen, M. (2005). Transition potential modeling forland-cover change. GIS, spatial analysis, and modeling. CA: ESRI Press., 357-385.
i, W., Ma, J., Twibell, R. W., & Underhill, K. (2006). Characterizing urban sprawlusing multi-stage remote sensing images and landscape metrics. Computers,Environment and Urban Systems, 30, 861–879.
i, X., & Yeh, G. (2000). Modelling sustainable urban development by the integra-
tion of constrained cellular automata and GIS. International Journal of GeographicInformation Science, 14(2), 131–152.iu, Y., & Phinn, S. R. (2003). Modelling urban development with cellular automataincorporating fuzzy-set approaches. Computers, Environment and Urban Systems,27(6), 637–658.
n Planning 124 (2014) 104–108
Lu, D., Weng, Q., & Li, G. (2006). Residential population estimation using a remotesensing derived impervious surface approach. International Journal of RemoteSensing, 27(16), 3553–3570.
Maithani, S. (2010). Cellular automata based model of urban spatial growth. Journalof the Indian Society of Remote Sensing, 38(4), 604–610.
Pijanowski, B., Brown, D., Shellito, A., & Manik, G. (2002). Using neural networksand GIS to forecast land use changes: A land transformation model. Computers,Environment and Urban Systems, 26, 553–575.
Poelmans, L., & Van Rompaey, A. (2010). Complexity and performance ofurban expansion models. Computers, Environment and Urban Systems, 34,17–27.
Pontius, R. G., Jr., & Schneider, L. C. (2001). Land-cover change model validationby an ROC method for the Ipswich watershed, Massachusetts, USA. Agriculture,Ecosystems & Environment, 85, 239–248.
Rashmi, M. K., & Lele, N. (2010). Spatial modeling and validation of forest coverchange in Kanakapura region using GEOMOD. Journal of the Indian Society ofRemote Sensing, 38, 45–54.
Reilly, J., Maggio, P., & Karp, S. (2004). A model to predict impervious surface forregional and municipal land use planning purposes. Environment Impact Assess-ment Review, 24, 363–382.
Sante, I., Garcia, A. M., Miranda, D., & Grecente, R. (2010). Cellular automata mod-els for the simulation of real-world urban processes: A review and analysis.Landscape and Urban Planning, 96, 108–122.
Schueler, T. R. (1994). The importance of imperviousness. Watershed Protection Tech-niques, 1(3), 100–111.
Sun, H., Forsythe, W., & Waters, N. (2007). Modeling urban land use change andurban sprawl: Calgary, Alberta, Canada. Networks and Spatial Economics, 7(4),353–376.
U.S. Census Bureau. (2013). State and County QuickFacts: Jackson County, Missouri.http://quickfacts.census.gov, Retrieved November 13, 2013
Wu, Y., Huang, J., Yuan, Y., Cui, W., & Zhan, Y. (2012). Simulation of land use/coverchange for Wuhan City based on GIS and CA. Journal of Convergence InformationTechnology, 7(1), 253–260.
Yeh, G., & Li, X. (2002). A cellular automata model to simulate development den-sity for urban planning. Environment and Planning B: Planning and Design, 29(3),
Zhou, B., He, H. S., Nigh, T. A., & Schulz, J. H. (2012). Mapping and analyzing changeof impervious surface for two decades using multi-temporal Landsat imagery inMissouri. International Journal of Applied Earth Observation and Geoinformation,18, 195–206.