landscape report nielsen digital
TRANSCRIPT
1Copyright © 2020 The Nielsen Company (US), LLC. Confidential and proprietary. Do not distribute.At Nielsen, data drives everything we do—even art. That’s why we used real data to create this image.Copyright © 2021 The Nielsen Company (US), LLC. Confidential and proprietary. Do not distribute.
NIELSEN DIGITAL LANDSCAPE REPORTJuly 2021
2Copyright © 2020 The Nielsen Company (US), LLC. Confidential and proprietary. Do not distribute.
CONTENTS
Device Usage Behaviour………….…………...…….4Trend of Total Online Audiences
How Many Australians are Reached Online
Trend of Time Spent Online
How Much Time Australian are Spending Online
Device Ownership in Australia
Surfing Audience Behaviour by Age Groups
Browsing and Streaming Behaviour ….….…………..12Top Ten Media Media Owners - All Categories
Top Brands That Audiences Are Browsing - All Categories
Where Are Audience Spending Their Online Time
Streaming Audience Behaviour by Age Groups
Top Streaming Brands with Greatest Video Consumption
3Copyright © 2020 The Nielsen Company (US), LLC. Confidential and proprietary. Do not distribute.
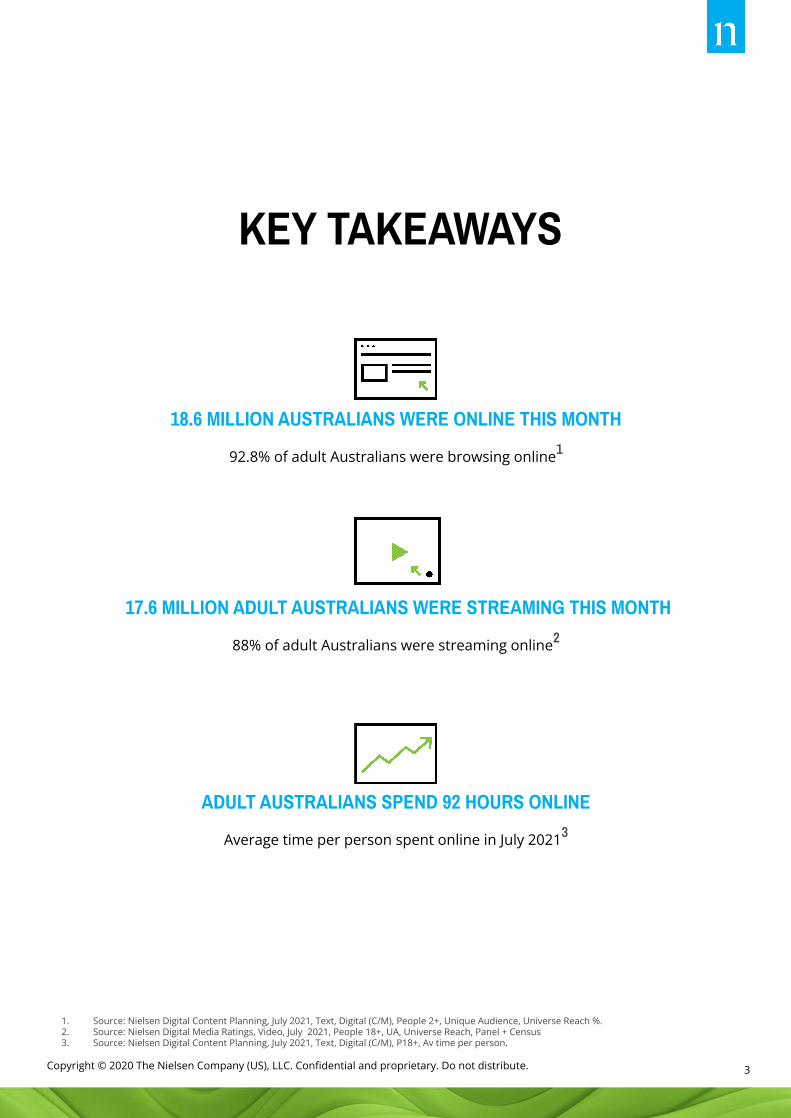
18.6 MILLION AUSTRALIANS WERE ONLINE THIS MONTH
92.8% of adult Australians were browsing online1
17.6 MILLION ADULT AUSTRALIANS WERE STREAMING THIS MONTH
88% of adult Australians were streaming online2
ADULT AUSTRALIANS SPEND 92 HOURS ONLINE
Average time per person spent online in July 20213
KEY TAKEAWAYS
1. Source: Nielsen Digital Content Planning, July 2021, Text, Digital (C/M), People 2+, Unique Audience, Universe Reach %.2. Source: Nielsen Digital Media Ratings, Video, July 2021, People 18+, UA, Universe Reach, Panel + Census3. Source: Nielsen Digital Content Planning, July 2021, Text, Digital (C/M), P18+, Av time per person.

At Nielsen, data drives everything we do—even art. That’s why we used real data to create this image.Copyright © 2020 The Nielsen Company (US), LLC. Confidential and proprietary. Do not distribute.
AUDIENCE AND DEVICE BEHAVIOUR
5Copyright © 2020 The Nielsen Company (US), LLC. Confidential and proprietary. Do not distribute.
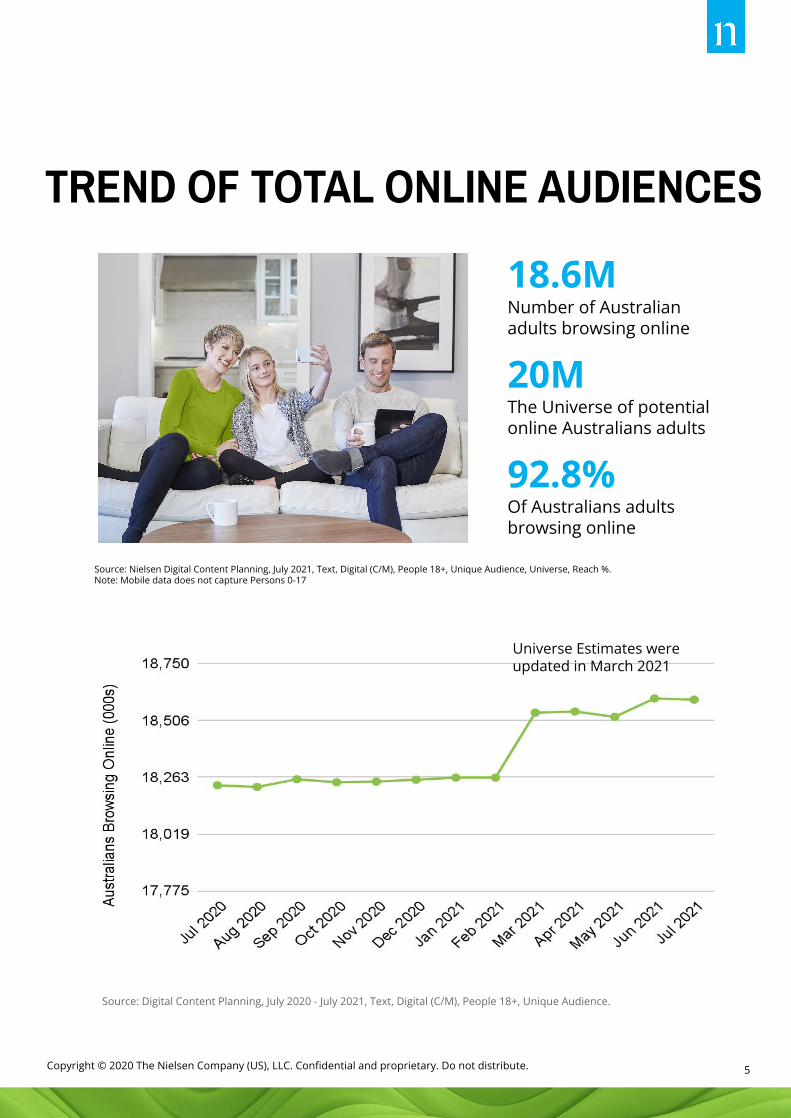
TREND OF TOTAL ONLINE AUDIENCES
Source: Digital Content Planning, July 2020 - July 2021, Text, Digital (C/M), People 18+, Unique Audience.
18.6MNumber of Australian adults browsing online
20MThe Universe of potential online Australians adults
92.8%Of Australians adults browsing online
Source: Nielsen Digital Content Planning, July 2021, Text, Digital (C/M), People 18+, Unique Audience, Universe, Reach %.Note: Mobile data does not capture Persons 0-17
Universe Estimates were updated in March 2021

6Copyright © 2020 The Nielsen Company (US), LLC. Confidential and proprietary. Do not distribute.
1. Source: Nielsen Digital Content Planning, July 2021, Text, Digital (C/M), P18+, Unique Audience, Universe Reach %,2. Source: Nielsen Digital Content Planning, July 2021, Text, Computer, P18+, Unique Audience, Universe Reach %,3. Source: Nielsen Digital Content Planning, July 2021, Text, Mobile, P18+, Unique Audience, Universe Reach %,
HOW MANY ADULT AUSTRALIANS ARE REACHED ONLINE
93% on any digital deviceOver 9 in 10 adult Australians (92.8%) or 18,596,000 Australian audiences canbe reached online on any digital devices.1
88% on mobileNearly 9 in 10 adult Australians (87.9%) or 17,622,000 Australian audiences canbe reached online on mobile device.3
79% on computerNearly 4 in 5 adult Australians (79.1%) or 15,860,000 Australian audiences can be reached online on computer device.2

7Copyright © 2020 The Nielsen Company (US), LLC. Confidential and proprietary. Do not distribute.
TREND OF TIME SPENT ONLINE
Source: Nielsen Digital Media Ratings, Monthly Total, July 2020 - July 2021, Desktop, Smartphone, Tablet, P 18+, % of Total Time Spent, Text.Please note from May 2020 an improvement was applied to android crediting for our mobile panleists which more precisely captures user intended behaviour versus background activity such as notifications. This has resulted in a trend break.
1. Source: Nielsen Digital Media Ratings, Monthly Total, July 2021, Mobile, P18+, % of Total Time Spent, Text.2. Source: Nielsen Digital Media Ratings, Monthly Total, July 2021, Tablet, P18+, % of Total Time Spent, Text.
73%1of adult Australians online time is spent on mobile
devices
26%2
of adult Australians online time is spent on a computer

8Copyright © 2020 The Nielsen Company (US), LLC. Confidential and proprietary. Do not distribute.
1. Source: Nielsen Digital Content Planning, July 2021, Text, Digital (C/M), P18+, Total Time Spent, Time Spent per Person (text).2. Source: Nielsen Digital Content Planning, July 2021, Text, Computer, P18+, Total Time Spent, Time Spent per Person (text).3. Source: Nielsen Digital Content Planning, July 2021, Text, Mobile, P18+, Total Time Spent, Time Spent per Person (text).
HOW MUCH TIME ARE ADULT AUSTRALIANS SPENDING ONLINE
92 hrs per person on any deviceAustralian adults spend a total of 1.7 billion hours on any digital device, which averages to 92 hrs 28 mins per person in a month.1
69 hrs per person on mobileAustralian adults spend a total of 1.2 billion hours on any mobile devices, which averages to 68hrs 47mins per person in a month.3
32 hrs per person on computerAustralian adults spend a total of 507 million hours on computer devices, which averages to 31hrs 59mins per person in a month.2

9Copyright © 2020 The Nielsen Company (US), LLC. Confidential and proprietary. Do not distribute.
DEVICE OWNERSHIP IN AUSTRALIA
88%of Australians
own a Computer
56%of Australians
own a Tablet
93%of Australians
own a Smartphone
Source: IAB Australia, Nielsen Digital Enumeration Survey, May - July 2021, People 14+, Device Ownership & Trends, n=3000 per quarter
21%of Australians
own a Smartspeaker

10Copyright © 2020 The Nielsen Company (US), LLC. Confidential and proprietary. Do not distribute.
ADULT AUDIENCE BEHAVIOUR BY AGE GROUPS
UNIQUE AUDIENCE
Source: Digital Content Planning, July 2021, Text, Computer, Mobile, P18-24, P25,34, P35-44, P45-54, P54-65, P65+, Unique Audience.
TIME SPENT PER PERSON
Source: Digital Content Planning, July 2021, Text, Computer, Mobile, P18-24, P25,34, P35-44, P45-54, P54-65, P65+, Time Spent per Person (text).

At Nielsen, data drives everything we do—even art. That’s why we used real data to create this image.Copyright © 2020 The Nielsen Company (US), LLC. Confidential and proprietary. Do not distribute.
SURFING AND STREAMING BEHAVIOUR

12Copyright © 2020 The Nielsen Company (US), LLC. Confidential and proprietary. Do not distribute.
AUTOMOTIVE8.6M Adult Australians consumed auto content, spending on average about 28 minutes per person.6
18.0M Adult Australians consumed news content, spending on average about 3 hours and 3 minutes per person.1
FAMILY & LIFESTYLE12.3M Adults Australians consumed lifestyle content, spending on about average 13 minutes per person.4
REAL ESTATE14.9M Adult Australians consumed real estate content, spending on average 52 minutes per person.5
SPORTS15.2M Adult Australians consumed sport content, spending on average about 1 hour and 36 minutes per person.2
WHERE ARE ADULT AUDIENCES SPENDING THEIR ONLINE TIME?
1. Source: Nielsen Digital Content Planning, July 2021, Text, Digital (C/M), Person 18+, Current Events & Global News subcategory, UA, Time Spent per Person.2. Source: Nielsen Digital Content Planning, July 2021, Text, Digital (C/M), Person 18+, Sports subcategory, UA, Time Spent per Person.3. Source: Nielsen Digital Content Planning, July 2021, Text, Digital (C/M), Person 18+, Home & Garden subcategory, UA, Time Spent per Person.4. Source: Nielsen Digital Content Planning, July 2021, Text, Digital (C/M), Person 18+, Multi-category Family & Lifestyles subcategory, UA, Time spent per Person.5. Source: Nielsen Digital Content Planning, July 2021, Text, Digital (C/M), Person 18+, Real Estate/Apartments subcategory, UA, Times Spent per Person.6. Source: Nielsen Digital Content Planning, July 2021, Text, Digital (C/M), Person 18+, Automotive Category, UA, Times Spent per Person.
CURRENT EVENTS & GLOBAL NEWS
HOME & GARDEN12.1M Adult Australians consumed home content, spending on average about 21 minutes per person.3
13Copyright © 2020 The Nielsen Company (US), LLC. Confidential and proprietary. Do not distribute.
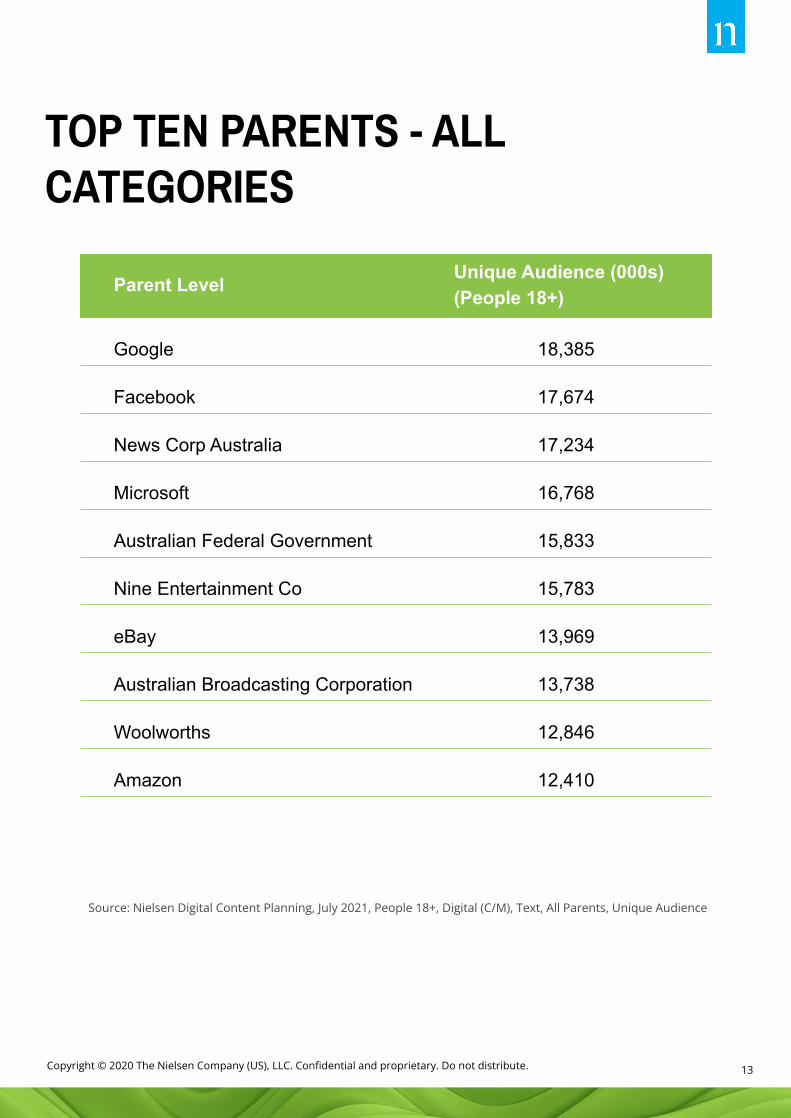
Source: Nielsen Digital Content Planning, July 2021, People 18+, Digital (C/M), Text, All Parents, Unique Audience
TOP TEN PARENTS - ALL CATEGORIES
Parent Level Unique Audience (000s)(People 18+)
Google 18,385
Facebook 17,674
News Corp Australia 17,234
Microsoft 16,768
Australian Federal Government 15,833
Nine Entertainment Co 15,783
eBay 13,969
Australian Broadcasting Corporation 13,738
Woolworths 12,846
Amazon 12,410

14Copyright © 2020 The Nielsen Company (US), LLC. Confidential and proprietary. Do not distribute.
*Brands marked with an asterisk represent metrics from tagged methodology.⇧⇩ Indicates Brand moved up or down ranking Source: Digital Media Ratings, Monthly Total, Text, July 2021, People 18+, Unique Audience, Avg Time Spent.
TOP BRANDS ADULT AUDIENCES ARE BROWSING - ALL CATEGORIES
Brand Name UniqueAudience
Avg Time Spent (hh:mm:ss)
Google 18,323,583 9:49:08
Facebook 17,242,113 15:46:06
MSN/Outlook/Bing/Skype 14,213,082 3:31:32
Instagram 13,858,534 3:18:33
ABC Online Network 13,748,436 1:46:22
Microsoft 13,294,177 1:49:14
realestate.com.au 12,680,254 0:42:59
Department of Human Services ⇧
12,383,040 0:26:40
news.com.au ⇧ 12,275,102 0:37:12
eBay ⇩ 12,226,377 1:21:08

15Copyright © 2020 The Nielsen Company (US), LLC. Confidential and proprietary. Do not distribute.
STREAMING ADULT AUDIENCE BEHAVIOUR BY AGE GROUPS
POPULATION BASE | 20,061,87717,647,586 or 88% of adult Australians were streaming online.Source: Nielsen Digital Media Ratings, Video, July 2021, People 18+, Universe, UA, Universe Reach, Panel + Census
TIME SPENT PER PERSON
Source: Nielsen Digital Media Ratings, Video, July 2021, People 18+, Avg Time Spent, Panel + Census

16Copyright © 2020 The Nielsen Company (US), LLC. Confidential and proprietary. Do not distribute.
TOP STREAMING BRANDS WITH GREATEST VIDEO CONSUMPTION
⇧⇩ Indicates UA MoM growth or decline greater | ⇨ Indicates no UA MoM growth.Source: Nielsen Digital Media Ratings, Monthly Volumetrics, Video, 2 secs Qualified, Total Ad Supported, July 2021, People 2+, Digital (C/M), Total Time Spent (minutes).
Chart displays the top brands for tagged with the Nielsen SDK and 2 secs qualifier for people 2+, ranked by total time spent.
Name Total Time Spent
YouTube ⇧ 510,234,507
7plus ⇧ 15,283,294
9Now ⇧ 7,961,834
nine.com.au ⇧ 1,292,577
news.com.au ⇧ 570,876
7NEWS ⇧ 313,063
Daily Mail Australia ⇧ 262,463
skynews.com.au 60,914
The West Australian ⇧ 57,847
taste.com.au ⇧ 32,112

17Copyright © 2020 The Nielsen Company (US), LLC. Confidential and proprietary. Do not distribute.At Nielsen, data drives everything we do—even art. That’s why we used real data to create this image.Copyright © 2020 The Nielsen Company (US), LLC. Confidential and proprietary. Do not distribute.