langley holdings plc annual report & accounts 2016 · langley holdings plc is a diverse,...
TRANSCRIPT

Langley Holdings PLC Annual Report & Accounts 2016
langleyholdings.com
Group ProfileGroup ............................................................................... 3
Manroland Sheetfed ......................................................... 4
Piller ................................................................................. 7
ARO ................................................................................. 8
Claudius Peters .............................................................. 11
Other Businesses ........................................................... 12
Global Locations ............................................................. 14
IFRS Annual Report and Accounts 2016Company Information ..................................................... 17
Key Highlights................................................................. 18
Chairman’s Review ......................................................... 19
Geographical Distribution ................................................ 26
Directors’ Report ............................................................ 28
Strategic Report ............................................................. 29
Independent Auditor’s Report to the Member ................. 31
Consolidated Income Statement ..................................... 33
Consolidated Statement of Comprehensive Income ........ 34
Consolidated Statement of Financial Position .................. 35
Consolidated Statement of Changes in Equity ................ 36
Company Statement of Financial Position ....................... 37
Company Statement of Changes in Equity ...................... 38
Consolidated Statement of Cash Flows .......................... 39
Company Statement of Cash Flows ................................ 40
Notes to the Accounts .................................................... 41
Contents
11GROUP PROFILE 2016
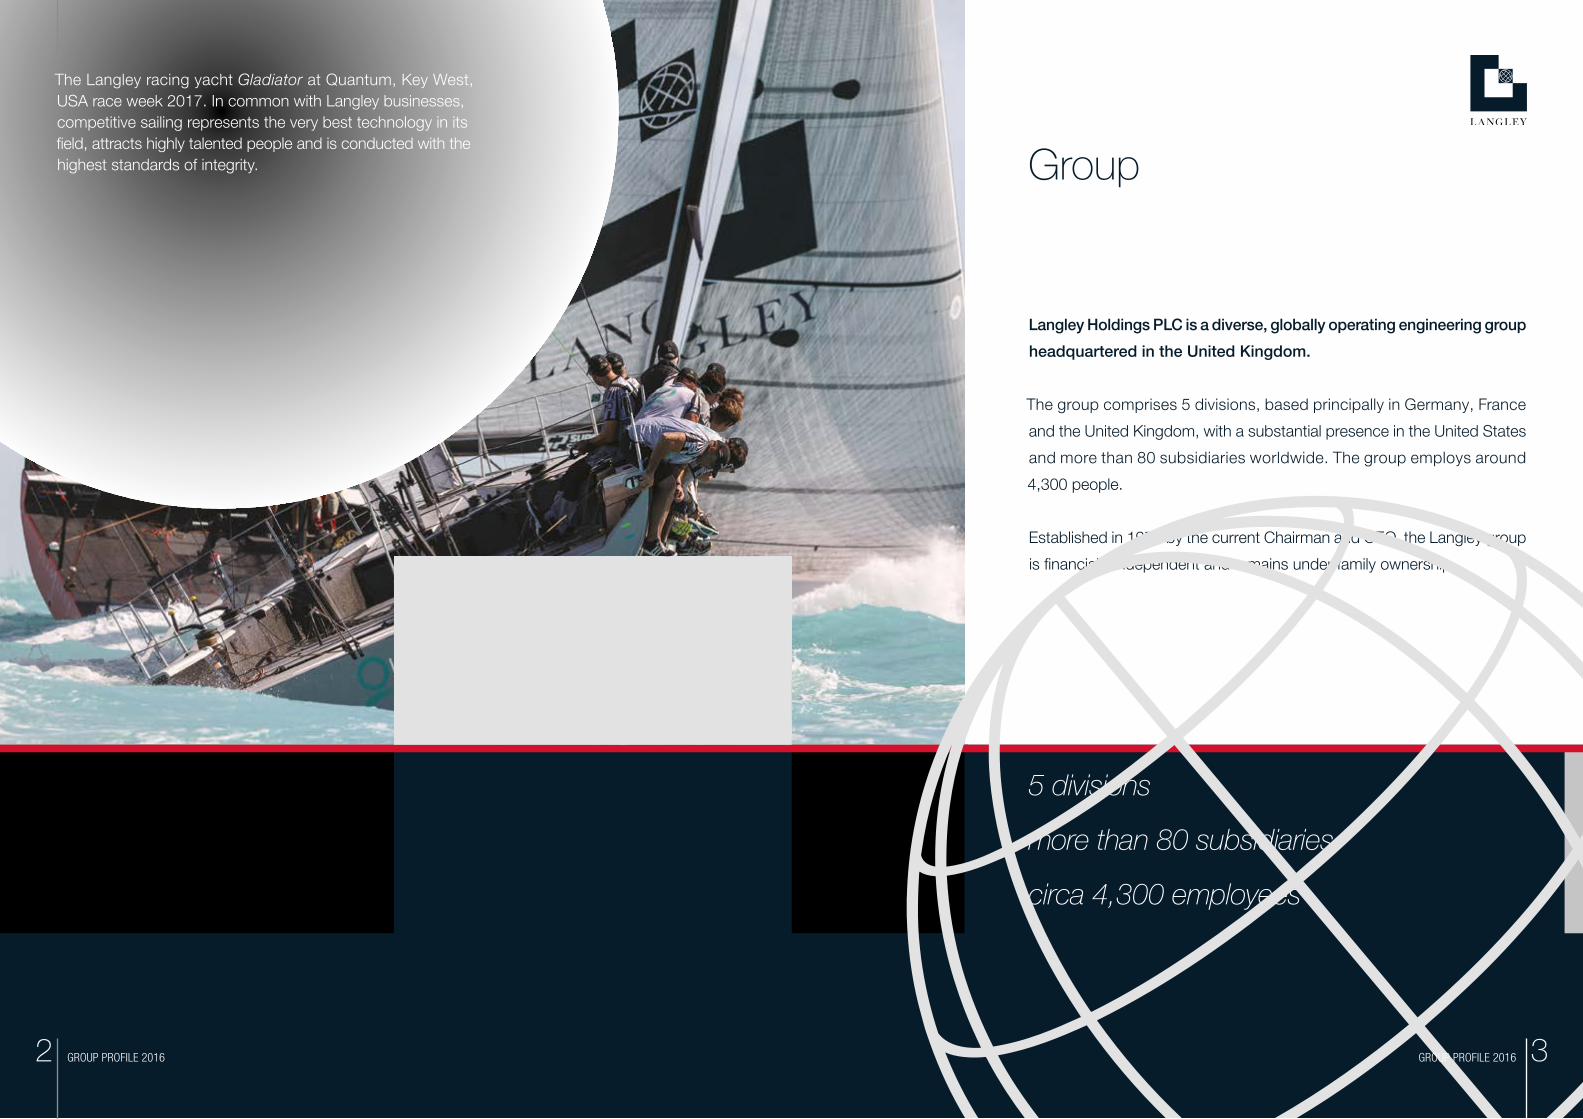
Langley Holdings PLC is a diverse, globally operating engineering group
headquartered in the United Kingdom.
The group comprises 5 divisions, based principally in Germany, France
and the United Kingdom, with a substantial presence in the United States
and more than 80 subsidiaries worldwide. The group employs around
4,300 people.
Established in 1975 by the current Chairman and CEO, the Langley group
is financially independent and remains under family ownership.
Group
The Langley racing yacht Gladiator at Quantum, Key West, USA race week 2017. In common with Langley businesses, competitive sailing represents the very best technology in its field, attracts highly talented people and is conducted with the highest standards of integrity.
5 divisions
more than 80 subsidiaries
circa 4,300 employees
GROUP PROFILE 2016 GROUP PROFILE 2016 32
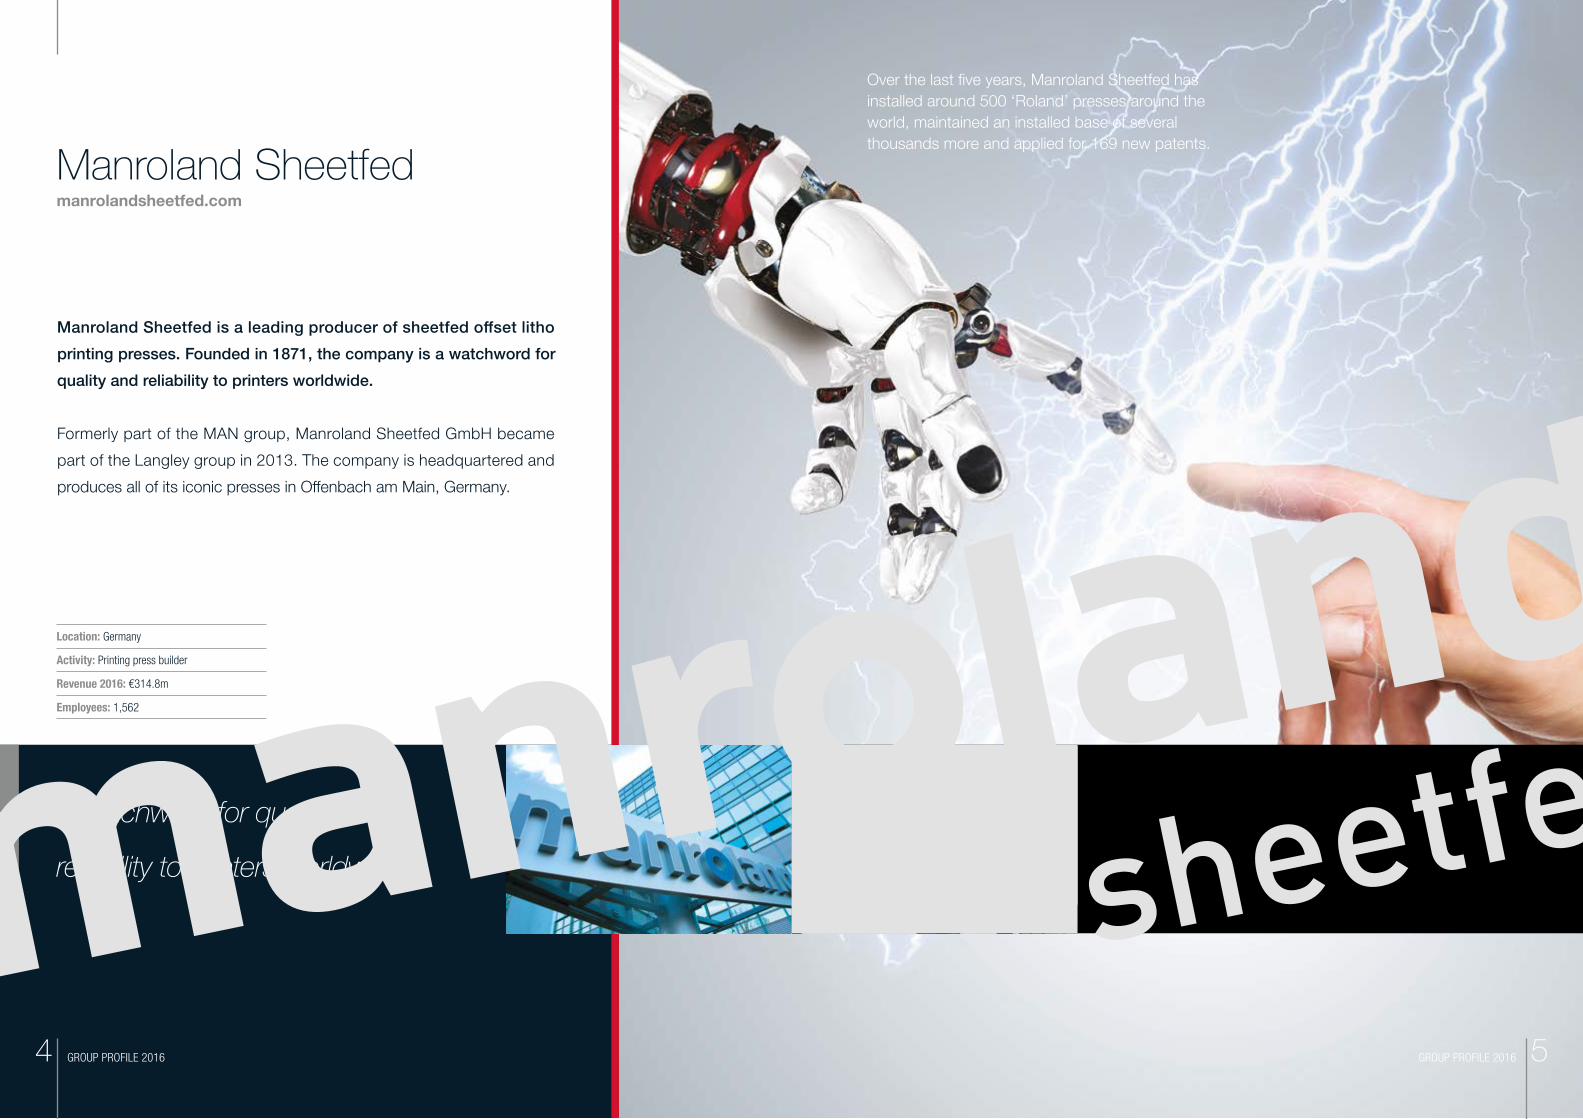
Manroland Sheetfed is a leading producer of sheetfed offset litho
printing presses. Founded in 1871, the company is a watchword for
quality and reliability to printers worldwide.
Formerly part of the MAN group, Manroland Sheetfed GmbH became
part of the Langley group in 2013. The company is headquartered and
produces all of its iconic presses in Offenbach am Main, Germany.
Manroland Sheetfedmanrolandsheetfed.com
Location: Germany
Activity: Printing press builder
Revenue 2016: €314.8m
Employees: 1,562
a watchword for quality and
reliability to printers worldwide
Over the last five years, Manroland Sheetfed has installed around 500 ‘Roland’ presses around the world, maintained an installed base of several thousands more and applied for 169 new patents.
GROUP PROFILE 2016 GROUP PROFILE 2016 54

Frankfurt’s financial district by night, in the foreground the European Central Bank headquarters building – Piller protected.
Piller is Europe’s leading producer of uninterruptable power supply
(UPS) systems for high-end data centres. Piller also manufactures
ground power systems for civil and military airports and on-board
electrical systems for naval vessels.
The company was founded in 1909 and acquired by Langley from the
German utility, RWE AG, in 2004. Piller is headquartered at Osterode am
Harz, near Hanover, in Germany.
In 2016, Piller acquired the business and assets of Active Power Inc. the
kinetic energy storage specialist.
Pillerpiller.com
Location: Germany
Activity: Power protection systems, airport ground power systems, naval military systems
Revenue 2016: €225.8m
Employees: 956
global leaders in mission
critical power protection
GROUP PROFILE 2016 GROUP PROFILE 2016 76
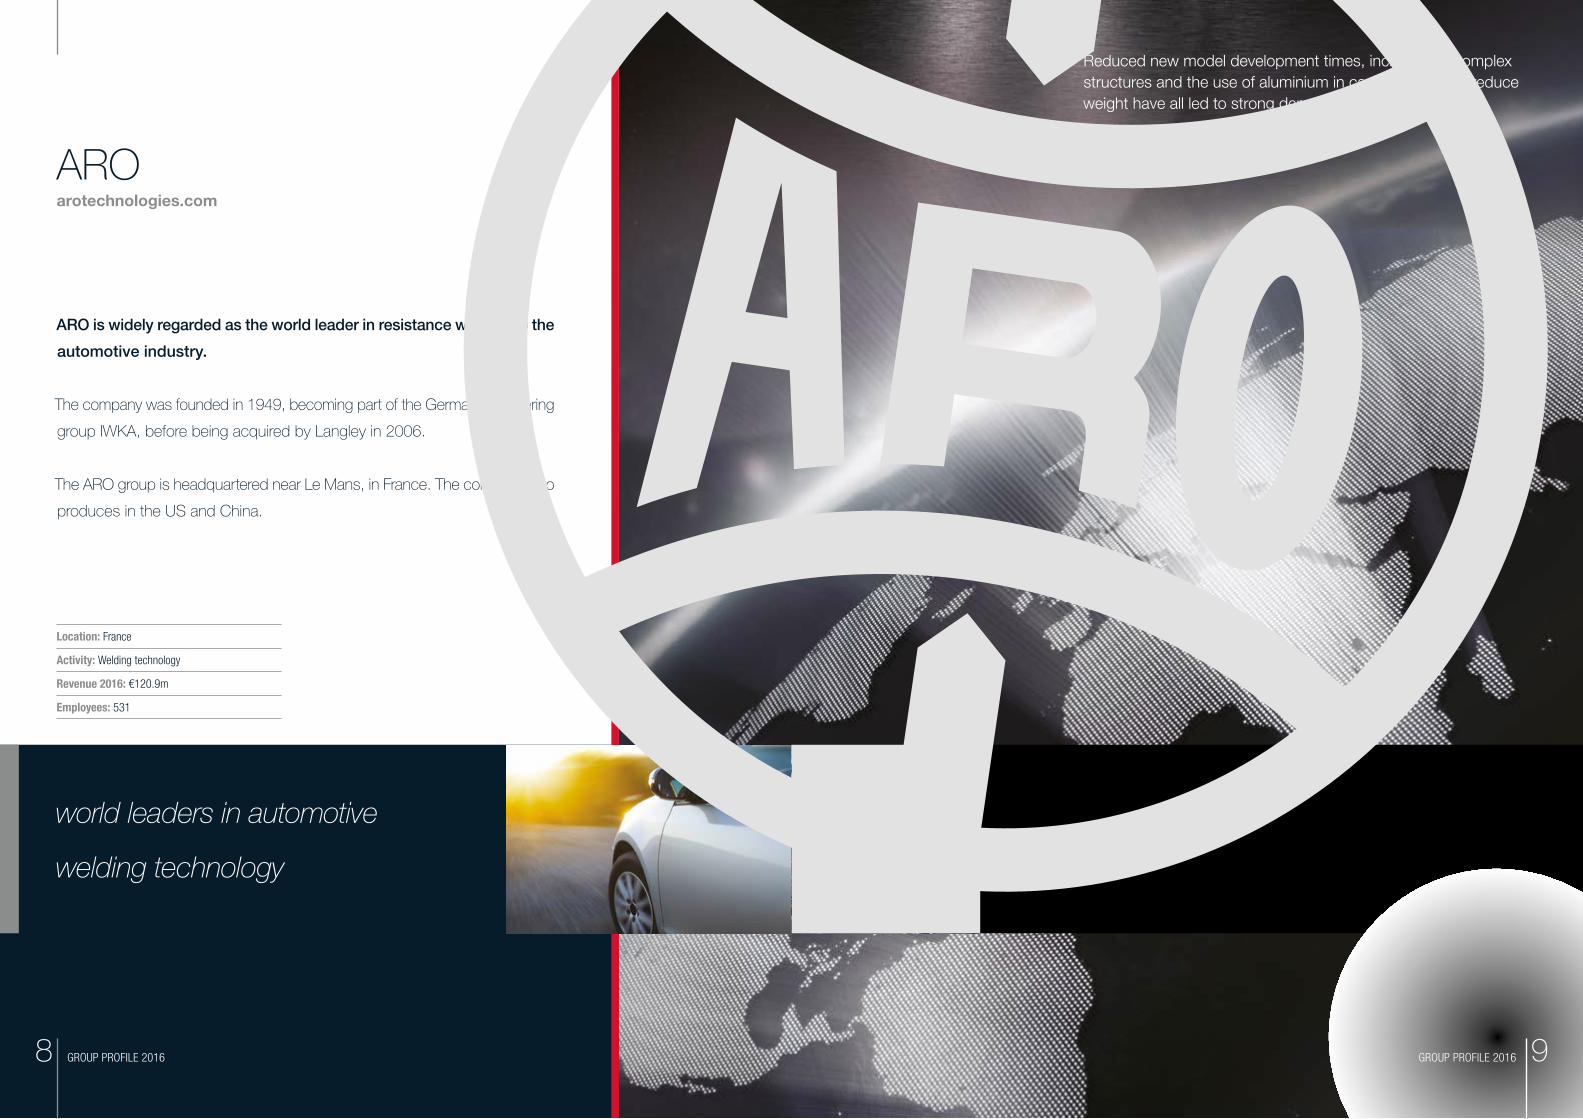
ARO is widely regarded as the world leader in resistance welding to the
automotive industry.
The company was founded in 1949, becoming part of the German engineering
group IWKA, before being acquired by Langley in 2006.
The ARO group is headquartered near Le Mans, in France. The company also
produces in the US and China.
AROarotechnologies.com
world leaders in automotive
welding technology
Reduced new model development times, increasingly complex structures and the use of aluminium in car production to reduce weight have all led to strong demand for ARO’s products.
Location: France
Activity: Welding technology
Revenue 2016: €120.9m
Employees: 531
GROUP PROFILE 2016 GROUP PROFILE 2016 98

For more than a century Claudius Peters has produced innovative
materials handling and processing systems for the global cement,
gypsum, steel and alumina industries.
The company’s aerospace division manufactures aircraft stringers, several
kilometres are found in every Airbus built.
Established in 1906, Claudius Peters was a member of the British Babcock
group from the mid 20th century. The company headquartered near
Hamburg, was acquired by Langley in 2001.
Claudius Petersclaudiuspeters.com
process technology for cement,
gypsum, steel and alumina
Claudius Peters, our plant machinery specialist, produces equipment for cement plants like the one below.
Location: Germany
Activity: Plant machinery, aerospace components
Revenue 2016: €106.3m
Employees: 536
GROUP PROFILE 2016 GROUP PROFILE 2016 1110
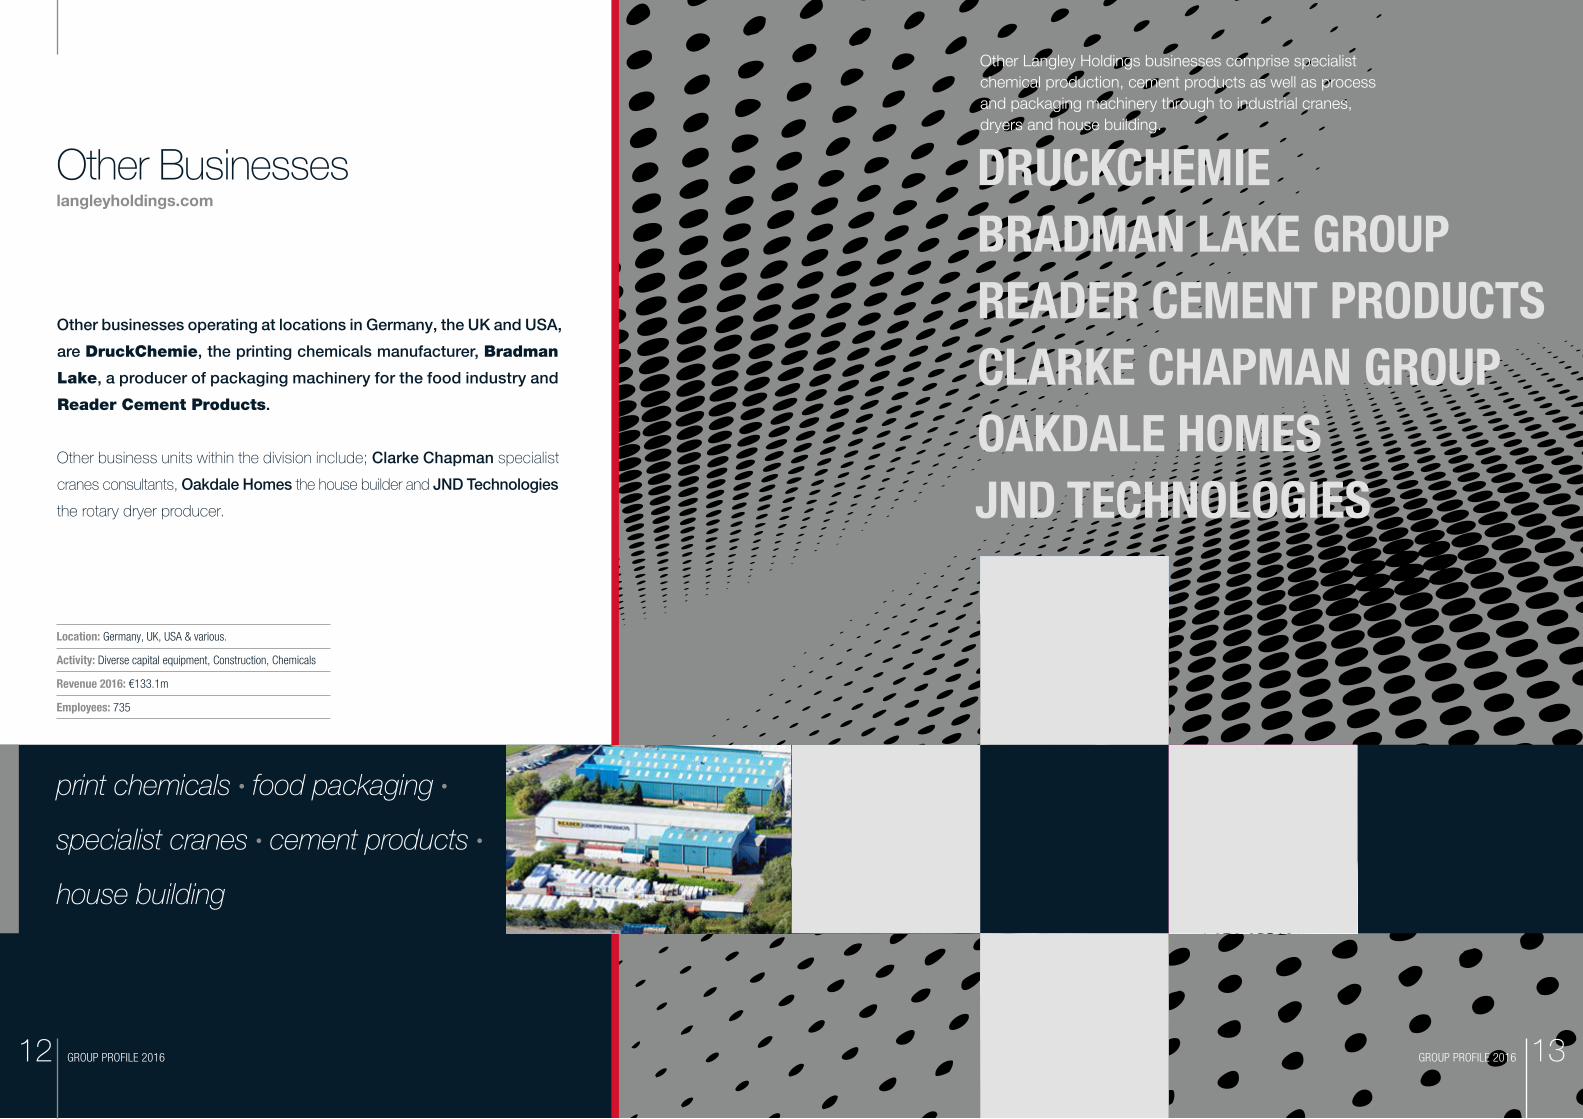
Other businesses operating at locations in Germany, the UK and USA,
are DruckChemie, the printing chemicals manufacturer, Bradman
Lake, a producer of packaging machinery for the food industry and
Reader Cement Products.
Other business units within the division include; Clarke Chapman specialist
cranes consultants, Oakdale Homes the house builder and JND Technologies
the rotary dryer producer.
Other Businesseslangleyholdings.com
Other Langley Holdings businesses comprise specialist chemical production, cement products as well as process and packaging machinery through to industrial cranes, dryers and house building.
print chemicals • food packaging •
specialist cranes • cement products •
house building
Location: Germany, UK, USA & various.
Activity: Diverse capital equipment, Construction, Chemicals
Revenue 2016: €133.1m
Employees: 735
DRUCKCHEMIEBRADMAN LAKE GROUPREADER CEMENT PRODUCTSCLARKE CHAPMAN GROUPOAKDALE HOMESJND TECHNOLOGIES
GROUP PROFILE 2016 GROUP PROFILE 2016 1312

Dallas, USAOffenbach, Germany New York, USA Detroit, USA Le Mans, France Hamburg, Germany Mulhouse, France Stuttgart, GermanyHanover, Germany Retford, UK
ARGENTINA BUENOS AIRES I ASIA PACIFIC SINGAPORE I AUSTRALIA SYDNEY
I AUSTRIA WIENER NEUDORF I BELGIUM BRUSSELS, WEMMEL I BRAZIL SÃO
PAULO I BULGARIA SOFIA I CANADA TORONTO I CHILE SANTIAGO I CHINA
BEIJING, CHENGDU, GUANGZHOU, HONG KONG, SHANGHAI, SHENZHEN, WUHAN
I COLUMBIA BOGOTA I CROATIA ZAGREB I CZECH REPUBLIC PRAGUE, KUŘIM
I DENMARK BALLERUP I FINLAND VANTAA I FRANCE LE MANS, MULHOUSE,
PARIS, SOPPE LE BAS I GERMANY FRANKFURT, HAMBURG, HANOVER,
AUGSBURG, STUTTGART I HUNGARY BUDAPEST I INDIA MUMBAI INDONESIA
JAKARTA I IRELAND DUBLIN I ITALY BERGAMO, MILAN I JAPAN SAITAMA I
MALAYSIA SELANGOR I MEXICO PUEBL I NETHERLANDS AMSTERDAM,
HELMOND I PERU LIMA I POLAND NADARZYN, GNIEZNO I PORTUGAL
SINTRA I ROMANIA BUCHAREST, SIBIU I RUSSIA MOSCOW I SLOVAKIA
BRATISLAVA I SLOVENIA LJUBLJANA I SOUTH AFRICA CAPE TOWN
I SPAIN BARCELONA, MADRID I SWEDEN FJÄRÅS, TROLLHÄTTAN I
SWITZERLAND KIRCHBERG, ROGGLISWIL I TAIWAN NEW TAIPEI CITY
I THAILAND BANGKOK I UNITED KINGDOM VARIOUS LOCATIONS I
USA DALLAS, DETROIT, NEW YORK, ROCK HILL (SOUTH CAROLINA),
WESTMONT I VENEZUELA CARACAS
Global Locations
• Principal subsidiary locations
over 80 subsidiaries worldwide
GROUP PROFILE 2016 GROUP PROFILE 2016 1514
DIRECTORS: A J Langley – Chairman
B J Langley
B A Watson
SECRETARY: B A Watson
REGISTERED OFFICE: Enterprise Way
Retford
Nottinghamshire
DN22 7HH
England
REGISTERED IN ENGLAND NUMBER: 1321615
AUDITOR: Nexia Smith & Williamson
Chartered Accountants
Statutory Auditor
Portwall Place
Bristol
BS1 6NA
England
PRINCIPAL BANKERS: Barclays Bank PLC
PO Box 3333
Snowhill Queensway
Birmingham
B4 6GN
England
Deutsche Bank AG
Adolphsplatz 7
20457 Hamburg
Germany
Commerzbank AG
Sand 5-7
21073 Hamburg
Germany
LANGLEY HOLDINGS PLC
Company InformationYEAR ENDED 31 DECEMBER 2016
IFRS Annual Report and Accounts 2016
IFRS ANNUAL REPORT & ACCOUNTS 2016 1716
LANGLEY HOLDINGS PLC
Key HighlightsYEAR ENDED 31 DECEMBER 2016
In the year to 31 December 2016 the group recorded revenues of €900.9 million (2015: €874.5 million) and generated an operating profit of €121.5 million (2015: €104.9 million), resulting in a profit before tax of €122.7 million (2015: €106.7 million). A shareholder dividend of €90.0 million was paid in April. The group has nil debt (2015: nil) and at year end the consolidated cash balance stood at €296.9 million (2015: €329.6 million). Orders on hand were €288.6 million (2015: €301.2 million) at the year end and the group’s net assets, €587.4 million (2015: €623.6 million).
2016 saw profits before tax increase by 15%, when compared with 2015, to set a new record. Earnings from our businesses in the US accounted for approximately 20% of the group’s profits before tax in 2016. The UK also accounted for about 20%, although only a quarter of that was derived from the UK based businesses, the majority coming from the UK subsidiaries of our German and French divisions. Earnings in other currencies accounted for some 15% of profits, but with 45%, euros remained the principal currency in which the group generated its profits and is the principal reason we report in euros.
Year ended
31 December
2016
€’000
Year ended
31 December
2015
€’000
REVENUE 900,925 874,506
OPERATING PROFIT 121,472 104,866
PROFIT BEFORE TAXATION 122,730 106,688
NET ASSETS 587,377 623,639
CASH AND CASH EQUIVALENTS 296,923 329,634
ORDERS ON HAND 288,589 301,221
No. No.
EMPLOYEES 4,320 4,266
Chairman’s ReviewYEAR ENDED 31 DECEMBER 2016
IFRS ANNUAL REPORT & ACCOUNTS 2016IFRS ANNUAL REPORT & ACCOUNTS 2016
Pre-tax profits up 15% to €122.7m – a new record.
1918
LANGLEY HOLDINGS PLC
CHAIRMAN’S REVIEW (CONTINUED) YEAR ENDED 31 DECEMBER 2016 CHAIRMAN’S REVIEW (CONTINUED) YEAR ENDED 31 DECEMBER 2016
BREXIT AND TRUMPIn 2016, much was made in the UK and Europe and beyond, of the UK’s decision to leave the European Union (EU) and I am often asked how the so-called ‘Brexit’ will impact our businesses. Immediately following the Brexit decision in June, the value of sterling fell significantly against all major currencies and currently remains at relatively low levels, particularly so against the US dollar. This must be seen as good news for UK exporters, such as Bradman Lake. The other side of the equation of course is that a weaker pound will ultimately fuel inflation in the UK, as imported goods become more expensive in pound terms, but it is not so long ago that the pound / euro was last at the current level – and lower.
Although the majority of the group’s UK profits arose from the UK subsidiaries of our German and French divisions, those businesses compete entirely with other EU based companies, so their relative competitiveness remains unchanged and I think it unlikely that the UK will impose import tariffs on the EU, post Brexit. Even if this did happen there are other more fundamental factors affecting investment decisions, not least business confidence and so far this has remained high in the UK since last June.
The other significant political event in 2016, the election of Donald Trump as 45th President of the United States of America, does have some potential to negatively impact our group’s performance going forward, if protectionist rhetoric materialises in the form of trade barriers with the EU. Our US manufacturing operations would no doubt lessen any impact, and as the equipment manufactured by our European companies is market leading for technological reasons, I do expect our earnings in the US to remain reasonably robust in the Trump era.
NEW ACQUISITIONThe group today is largely defined by a series of acquisitions completed over the previous fifteen years and since 2001 these have been focused on continental European capital equipment producers. In 2016 we widened the search for further potential targets to the US and in September agreed terms to acquire the business and assets of Active Power Inc, a NASDAQ listed company. This was the group’s first transaction effectively taking over a listed company and was completed in November, following regulatory and shareholder approvals. Active Power operates in a similar, but essentially non-competing area, to our Piller division and has been merged into Piller’s US subsidiary. Based in Austin, Texas, Active Power produces kinetic energy storage devices, an area with significant growth potential.
MANROLAND SHEETFED DIVISIONRevenue: €314.8m. (2015: €291.9m). Orders on hand: €52.8m. (2015: €79.5m).Headquarters: Germany. Employees: 1,562.February 2017 marks the fifth anniversary of our acquiring the sheetfed division of German printing press builder, Manroland AG, together with its worldwide network of more than forty sales and service subsidiaries. Much has been achieved under our stewardship and rather than commenting only on 2016, I would like to also reflect a little on the last five years:
During this period, the business has gone through a deep process of transformation, changing the company’s structure, processes and, most importantly, its culture. None of the former Manroland AG board were retained and more than half of the managing directors of the forty-plus sales and service subsidiaries have been replaced. All committees, boards, working groups, steering meetings etc at the headquarters were eliminated on day one and substituted by direct responsibilities from department heads, thereby creating a more direct and streamlined decision making process. Satellite locations have been closed and sold off and production rationalised on to a single site. This has greatly improved efficiency and, although significant headcount reductions have been made, the training of apprentices and graduate intake has continued annually, steadily improving the age profile of the workforce.
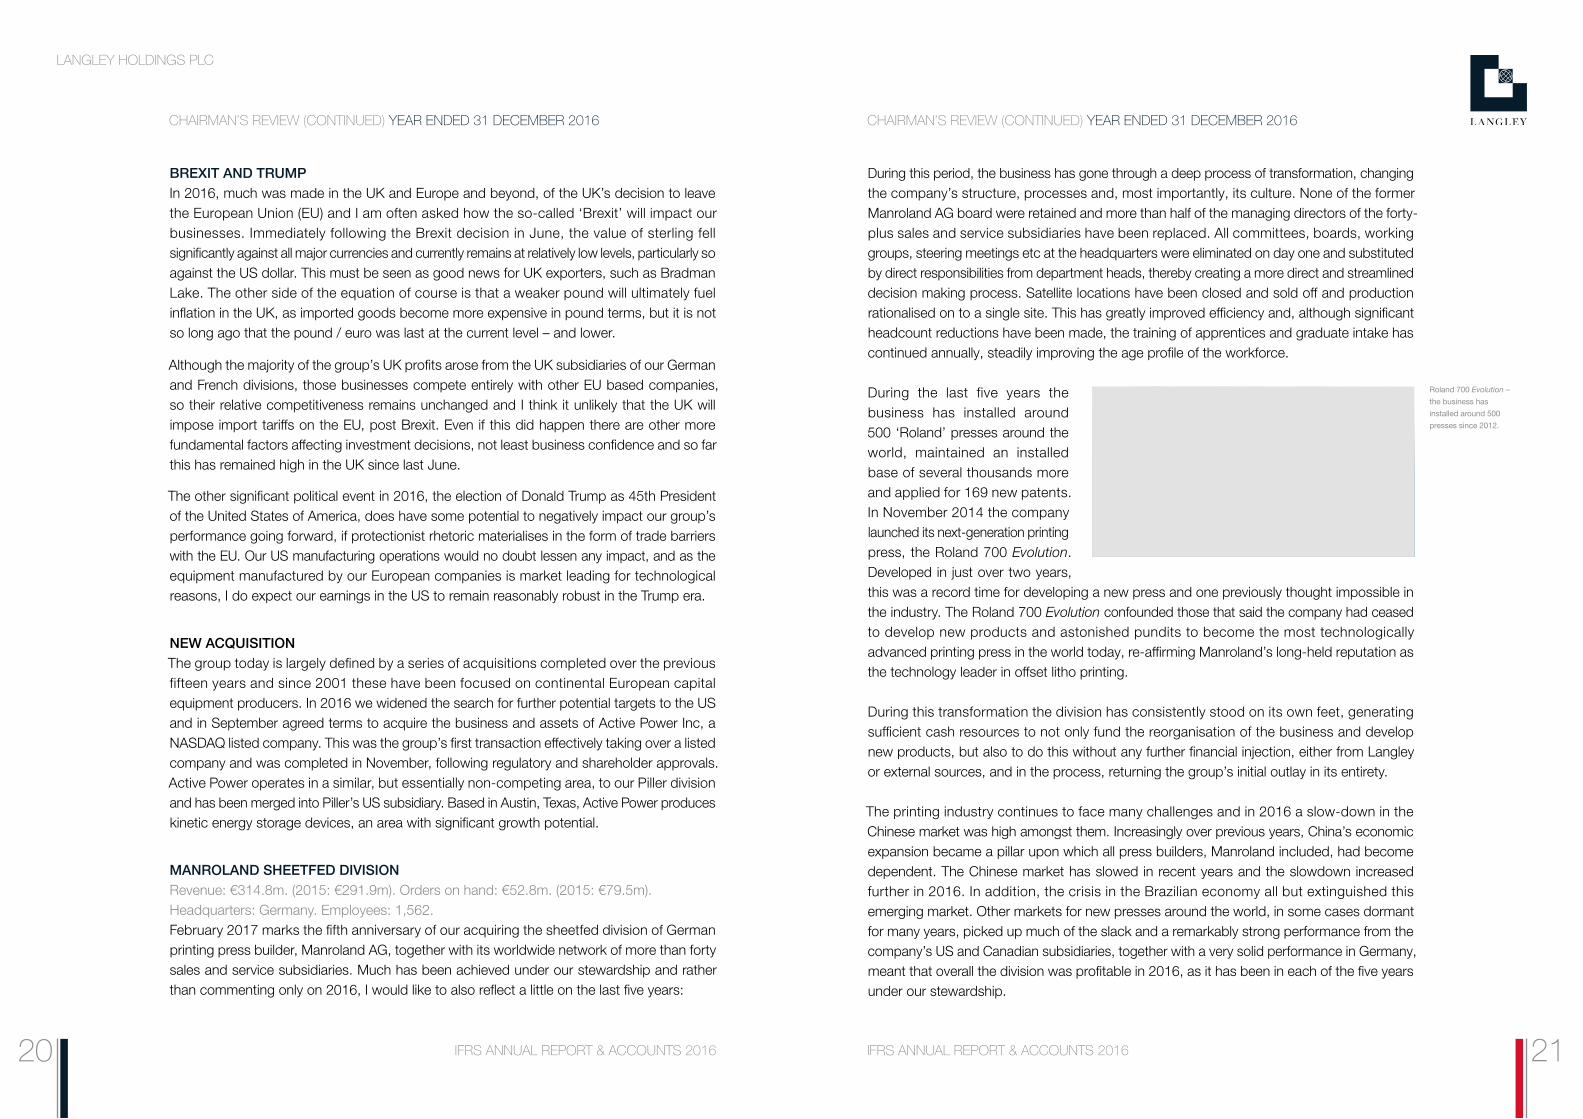
During the last five years the business has installed around 500 ‘Roland’ presses around the world, maintained an installed base of several thousands more and applied for 169 new patents. In November 2014 the company launched its next-generation printing press, the Roland 700 Evolution. Developed in just over two years, this was a record time for developing a new press and one previously thought impossible in the industry. The Roland 700 Evolution confounded those that said the company had ceased to develop new products and astonished pundits to become the most technologically advanced printing press in the world today, re-affirming Manroland’s long-held reputation as the technology leader in offset litho printing.
During this transformation the division has consistently stood on its own feet, generating sufficient cash resources to not only fund the reorganisation of the business and develop new products, but also to do this without any further financial injection, either from Langley or external sources, and in the process, returning the group’s initial outlay in its entirety.
The printing industry continues to face many challenges and in 2016 a slow-down in the Chinese market was high amongst them. Increasingly over previous years, China’s economic expansion became a pillar upon which all press builders, Manroland included, had become dependent. The Chinese market has slowed in recent years and the slowdown increased further in 2016. In addition, the crisis in the Brazilian economy all but extinguished this emerging market. Other markets for new presses around the world, in some cases dormant for many years, picked up much of the slack and a remarkably strong performance from the company’s US and Canadian subsidiaries, together with a very solid performance in Germany, meant that overall the division was profitable in 2016, as it has been in each of the five years under our stewardship.
IFRS ANNUAL REPORT & ACCOUNTS 2016IFRS ANNUAL REPORT & ACCOUNTS 2016
Roland 700 Evolution – the business has installed around 500 presses since 2012.
2120

LANGLEY HOLDINGS PLC
IFRS ANNUAL REPORT & ACCOUNTS 2016
CHAIRMAN’S REVIEW (CONTINUED) YEAR ENDED 31 DECEMBER 2016 CHAIRMAN’S REVIEW (CONTINUED) YEAR ENDED 31 DECEMBER 2016
PILLER DIVISIONRevenue: €225.8m (2015: €190.8m). Orders on hand: €112.7m. (2015: €100.5m).Headquarters: Germany. Employees: 956.Piller, our German producer of uninterruptible power supply (UPS) systems, principally for major data centers, was once again the strongest contributor to the group’s result. The division, which also produces aircraft ground power equipment and naval military electrical systems, recorded its strongest year, not only since we acquired the business in 2004, but also in its more than 100 years history. Revenues climbed from €190.8 million in 2015 to €225.8 million in 2016 and profits increased accordingly. The division’s production facilities in Osterode and Bilshausen were heavily loaded throughout the year. The Bilshausen factory, which received substantial investment a few years ago to increase its capacity for the assembly and test of the very largest UPS systems, fulfilled much of its potential in 2016. Piller’s largest markets, Europe and the USA, continued to see strong growth whereas Russia, the Middle East and Brazil languished. Piller UK did less well than previously, citing a slow down in IT investment in the banking sector, its traditional main-stay. However, Piller Australia had a remarkably strong year and the recently formed subsidiary in India, completed its first large-scale data center project.
The data center sector globally was at its most lively before the crash of 2008, with much of the activity focused on IT hosting and the Cloud. Over half of 2016 projects were in this area and there is some concern amongst Piller management that the sector may be heading towards a correction.
Towards the end of the year Piller acquired Active Power a producer of similar technology, which has an established outpost in China and going forward as part of the Piller group, the Chinese market will continue to be developed and serviced through this subsidiary.
Piller’s successes to date have been without any material level of business from China, the UPS market there, being served mainly by local producers and relatively crude equipment. However, there is an increasing trend in China to invest in leading technology and in 2016 the company secured a cornerstone project to install its UPS technology at the Shanghai Stock Exchange, via its Piller Singapore subsidiary.
In March last year the division launched its new Critical Power Module product in the USA and Europe simultaneously at trade fairs in Las Vegas and Hannover. Healthcare projects also featured in 2016, with a major installation in Sweden, whilst ground power and naval military performed profitably in line with expectations.
In all it was a monumental year for Piller, but it is sensible to have concerns that the IT sector may be heading towards another Dot-Com style bubble. We acquired the loss making business in the aftermath of the last bubble burst and it took quite some reorganising to restore Piller to good health. However, the division today is not the same as then and much of Piller’s success since 2004, is that it has not increased overhead costs unnecessarily as the business has expanded. From today’s perspective, 2017 looks set to be another successful year, whether it is quite as monumental as 2016 remains to be seen, but if not, and a market correction does come, I am confident that the business would manage any slow down efficiently.
ARO DIVISION Revenue: €120.9m. (2015: €127.3m). Orders on hand: €44.0m. (2015: €32.4m). Headquarters: France. Employees: 531.ARO is the leading producer of automotive welding equipment in Europe and the US. Based near Le Mans in France and Detroit in the US, this division also experienced another remarkably successful year in 2016, with both European and US automobile producers continuing to invest heavily in new production lines. ARO’s presence in China also went from strength to strength and the factories in France, the US and China were all heavily loaded in 2016. Other ARO subsidiaries in Germany, Belgium, Slovakia, Spain and Mexico all contributed to the excellent division result, only ARO Brazil recording a small loss.
So far a downturn in demand for ARO’s products has not yet materialised and the division has experienced strong demand for its technology since the early part of the decade. No doubt at some point the investment cycle will turn but there is an increasing trend amongst automobile manufacturers to shorten new model development times and, in striving to reduce vehicle weight, to design in more complex structural assemblies. Aluminium is also increasingly being used in the quest to reduce vehicle weight. Traditionally aluminium components are joined by riveting rather than welding, the metal being notoriously difficult to weld. ARO have been developing aluminium welding technology for several years and 2016 the process was used in full production.
During our tenure of ARO since 2007 this has all translated into strong demand for welding stations. If there is a downturn, ARO is structured such that capacity can be adjusted quickly and without major cost implications. In the meantime the business continues to enjoy remarkable success.
IFRS ANNUAL REPORT & ACCOUNTS 2016
Data centers were Piller’s main driver in 2016. Healthcare projects also featured: Karolinska in Stockholm is Europe’s largest university hospital.
Shanghai Stock Exchange: Piller protected.
2322
IFRS ANNUAL REPORT & ACCOUNTS 2016
CHAIRMAN’S REVIEW (CONTINUED) YEAR ENDED 31 DECEMBER 2016 CHAIRMAN’S REVIEW (CONTINUED) YEAR ENDED 31 DECEMBER 2016
CLAUDIUS PETERS DIVISIONRevenue: €106.3m. (2015: €123.7m). Orders on hand: €50.3m (2015: €57.7m).Headquarters: Germany. Employees: 536.Claudius Peters, our German plant machinery specialist, performed profitably in line with expectations, albeit on a relatively low level of activity. The sectors in which it operates, principally cement, gypsum, steel and alumina, remain at a low point in their cycle and there is generally a dearth of capital investment in these sectors. A malaise in Brazil and Russia and a slowing of the Chinese economy also continue to affect the division. However, Claudius Peters China performed quite well, buoyed by export projects with Chinese contractors. Claudius Peters France, with projects in North Africa, also performed satisfactorily, Claudius Peters in the US did well and the smaller outposts in the UK, Spain and Italy all generated small profits with only the Brazilian outpost in negative territory. The division’s order intake did improve in the final quarter and with commodity prices coming off the bottom there are signs that the climate is improving, although it is too early to call a recovery. In all, the results were satisfactorily in a still much subdued sector.
Claudius Peters’ aerospace division, which produces stringers for the Airbus programme, also performed in line with expectations. The company has produced these components for Airbus for over 35 years and is currently discussing a renewed contract.
OTHER BUSINESSES (OBD)Revenue: €133.1m. (2015: €140.8). Orders on hand: €28.8m. (2015: €31.1m).Located: United Kingdom, Europe & United States. Employees: 735.OBD comprises principally of: DruckChemie, the German print chemicals producer; Bradman Lake, the UK/US food packaging specialist; Clarke Chapman, a UK specialist crane builder, Reader, a blender and packer of cementitious products in the UK and Oakdale Homes, a small UK house builder.
DruckChemie (DC), which accounts for roughly half of OBD in revenue terms, had a satisfactory year overall, it’s subsidiaries in Belgium, Italy, Switzerland, the Czech Republic and Poland all in positive territory. DC in the UK was just short of break even and DC Brazil made a small loss.
Bradman Lake, which represents 25% of OBD revenues, also had a good year overall, although the US operation has consecutively underperformed and management was changed towards the end of the year. Until the Brexit decision in June, Bradman Lake’s UK business had struggled somewhat with a strong pound against its mainly European competitors and the second half saw a marked improvement in order intake, following sterling’s fall against the euro. The company operates from two locations in the UK and one in the US. The UK location in Bristol has long been inadequate for the business’s growing needs and in December a larger factory, just a few miles away, was acquired by the group. The business will move mid-2017, following refurbishment works.
Clarke Chapman, had another satisfactory year on the back of a major nuclear order secured in 2015, whilst Reader stepped up volumes significantly at its new three hectares location, where state-of-the-art plant was commissioned in June. Oakdale Homes was just short of an operating break-even.
OUR PEOPLEAs is customary, no review would be complete without mention of our employees, at year end numbering 4,320 worldwide and I would like to take this opportunity to welcome the good people of Active Power who joined our group in November, together with all other newcomers, to our family of businesses. It is the hard work and diligence of all our employees, that makes the group the success it is today. The results produced by our companies, often substantially exceeding corporate and private equity owned peers, are no accident. They come about by our community knowing that the Langley culture is forged not from short-term profits, or from creating ‘shareholder value’ by buying and selling companies, but from long-term development of our businesses. I believe that this not only gives our people the will to excel, but also fosters confidence amongst our many customers, suppliers and other stakeholders.
In 2015 we introduced a policy whereby the group equally match any charitable donations made by employees. During the year the divisions matched €60,637 of employee donations to a variety of causes. I have now extended the match funding to include money raised for charity by the immediate family of our employees.
I reported last year, that Manroland in Germany had been approached by the local government to house refugees from Syria, in surplus office accommodation adjacent to the facility. It was a delicate situation: If I agreed to, or declined the request, there were always going to be those who disagreed with my decision. Therefore, I instructed a ballot to be held of all 800 people working at the location. 75% voted in favour and last year the accommodation was modified and the company welcomed 80 refugees displaced by conflict in their home country, to a place of safety. CONCLUSION & OUTLOOK2016 was the best performing year since I founded the group in 1975 and is stronger now than at any time in its history. We will continue to operate our existing businesses for the long term, and will continue to seek out acquisition opportunities to develop the group further. Identifying fundamentally good businesses, that for one reason or another, are under-performing and nurturing them to good health has been the recipe for the group’s success so far and I see no reason to change the formula.
Although in 2016 the group derived around a fifth of its profits from operations in the US, these operations are all subsidiaries of our European divisions. Last year we extended the search area for acquisition opportunities to include, as well as Europe, the US.
Whether we secure suitable additions in 2017 remains to be seen. In the meantime I am optimistic that 2017 will be another very satisfactory trading year for the group.
Anthony J LangleyChairman
9 February 2017
IFRS ANNUAL REPORT & ACCOUNTS 2016
LANGLEY HOLDINGS PLC
2524
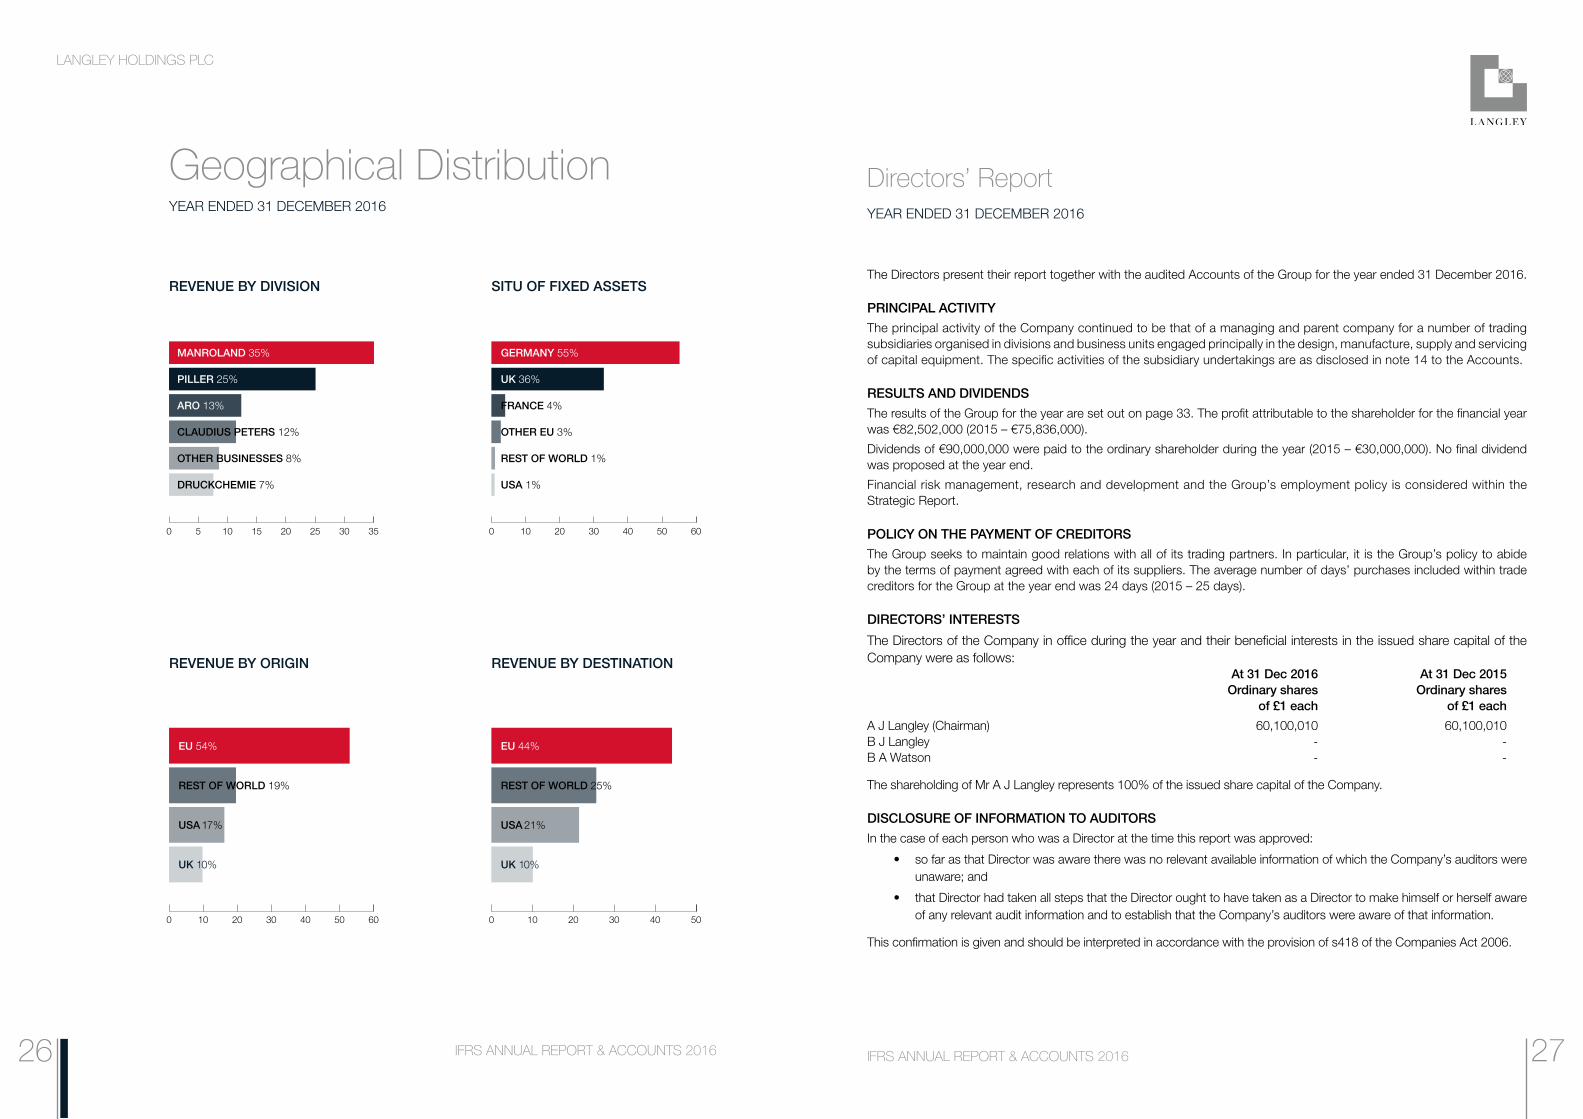
EU 44%
REST OF WORLD 25%
UK 10%
USA 21%
LANGLEY HOLDINGS PLC
Geographical DistributionYEAR ENDED 31 DECEMBER 2016
REVENUE BY DIVISION
REVENUE BY ORIGIN
SITU OF FIXED ASSETS
REVENUE BY DESTINATION
MANROLAND 35%
OTHER BUSINESSES 8%
ARO 13%
CLAUDIUS PETERS 12%
DRUCKCHEMIE 7%
PILLER 25%
GERMANY 55%
FRANCE 4%
OTHER EU 3%
USA 1%
REST OF WORLD 1%
UK 36%
EU 54%
REST OF WORLD 19%
UK 10%
USA 17%
IFRS ANNUAL REPORT & ACCOUNTS 2016
0 5 10 15 20 25 30 35 0 10 20 30 40 50 60
0 10 20 30 40 50 60 0 10 20 30 40 50
GROUP PROFILE 2016 GROUP PROFILE 2016 272626 IFRS ANNUAL REPORT & ACCOUNTS 2016
The Directors present their report together with the audited Accounts of the Group for the year ended 31 December 2016.
PRINCIPAL ACTIVITYThe principal activity of the Company continued to be that of a managing and parent company for a number of trading subsidiaries organised in divisions and business units engaged principally in the design, manufacture, supply and servicing of capital equipment. The specific activities of the subsidiary undertakings are as disclosed in note 14 to the Accounts.
RESULTS AND DIVIDENDSThe results of the Group for the year are set out on page 33. The profit attributable to the shareholder for the financial year was €82,502,000 (2015 – €75,836,000).
Dividends of €90,000,000 were paid to the ordinary shareholder during the year (2015 – €30,000,000). No final dividend was proposed at the year end.
Financial risk management, research and development and the Group’s employment policy is considered within the Strategic Report.
POLICY ON THE PAYMENT OF CREDITORSThe Group seeks to maintain good relations with all of its trading partners. In particular, it is the Group’s policy to abide by the terms of payment agreed with each of its suppliers. The average number of days’ purchases included within trade creditors for the Group at the year end was 24 days (2015 – 25 days).
DIRECTORS’ INTERESTS
The Directors of the Company in office during the year and their beneficial interests in the issued share capital of the Company were as follows: At 31 Dec 2016 At 31 Dec 2015 Ordinary shares Ordinary shares of £1 each of £1 each
A J Langley (Chairman) 60,100,010 60,100,010B J Langley - -B A Watson - -
The shareholding of Mr A J Langley represents 100% of the issued share capital of the Company.
DISCLOSURE OF INFORMATION TO AUDITORSIn the case of each person who was a Director at the time this report was approved:
• so far as that Director was aware there was no relevant available information of which the Company’s auditors were unaware; and
• that Director had taken all steps that the Director ought to have taken as a Director to make himself or herself aware of any relevant audit information and to establish that the Company’s auditors were aware of that information.
This confirmation is given and should be interpreted in accordance with the provision of s418 of the Companies Act 2006.
Directors’ ReportYEAR ENDED 31 DECEMBER 2016
LANGLEY HOLDINGS PLC
IFRS ANNUAL REPORT & ACCOUNTS 2016IFRS ANNUAL REPORT & ACCOUNTS 2016
STATEMENT OF DIRECTORS’ RESPONSIBILITIES
The Directors are responsible for preparing the Strategic Report, Directors’ Report and the Accounts in accordance
with applicable law and regulations.
Company law requires the directors to prepare Accounts for each financial year. Under that law the Directors have
elected to prepare the Group and Parent Company Accounts in accordance with applicable law and International
Financial Reporting Standards (IFRSs) as adopted by the European Union, and as regards the Parent Company
Accounts, as applied in accordance with the provisions of the Companies Act 2006. Under company law the Directors
must not approve the Accounts unless they are satisfied that they give a true and fair view of the state of affairs of the
Company and of the Group and of the profit or loss of the Group for that period.
In preparing these Accounts, the Directors are required to:
• select suitable accounting policies and then apply them consistently;
• make judgments and accounting estimates that are reasonable and prudent;
• state whether applicable IFRSs as adopted by the European Union have been followed subject to any material
departures disclosed and explained in the Accounts; and;
• prepare the Accounts on the going concern basis unless it is inappropriate to presume that the Group will
continue in business.
The Directors are responsible for keeping adequate accounting records that are sufficient to show and explain the Company’s
transactions and disclose with reasonable accuracy at any time the financial position of the Company and enable them to
ensure that the Accounts comply with the Companies Act 2006. They are also responsible for safeguarding the assets of the
Company and the Group and hence for taking reasonable steps for the prevention and detection of fraud and other irregularities.
The Directors are responsible for the maintenance and integrity of the corporate and financial information included on the
Group’s website. Legislation in the United Kingdom governing the preparation and dissemination of financial statements may
differ from legislation in other jurisdictions.
By order of the Board
B A WATSON
Company Secretary
Langley Holdings PLC
Registered in England and Wales
Company number 01321615
9 February 2017
The Directors present their Strategic Report for the year ended 31 December 2016 to provide a review of the Group’s business,
principal risks and uncertainties and performance and position alongside key performance indicators.
(a) Development performance and position
The Directors are satisfied with the trading results of the Group for the year. The Chairman’s Review on pages 19 to
25 contains an analysis of the development and performance of the Group during the year and its position at the end
of the year.
(b) Principal risks and uncertainties
There are a number of risks and uncertainties which may affect the Group’s performance. A risk assessment process
is in place and is designed to identify, manage and mitigate business risks. However it is recognised that to identify,
manage and mitigate risks is not the same as to eliminate them entirely. The Group ensures that it limits its exposure to
any downturn in its traditional trading sector by continuing to diversify its activities, identifying opportunities for existing
product offerings into new markets and for new products for all markets. The Group has a wide range of customers
which limits exposure to any material loss of revenue. The Group’s exposure to the volatility of exchange rates is
mitigated through its geographical spread of operations.
(c) Going Concern
The Group’s business activities, together with the factors likely to affect its future development, performance and position
are set out in the Chairman’s Review on pages 19 to 25. The financial position of the Group, its cash flows and liquidity
position are also described in the Chairman’s Review. In addition, note 30 to the Accounts includes the Group’s policies
and processes for managing its capital; its financial risk management objectives; details of its financial instruments, and its
exposures to credit risk, interest rate risk and liquidity risk.
The Group’s subsidiaries are for the most part either market leaders or niche operators in their particular field and operate
across numerous different geographic areas and industries. None of the subsidiaries are reliant on any individual supplier
or customer and the Group has considerable financial resources. Consequently, the Directors believe that the Group is well
placed to manage its business risks successfully and thus they continue to adopt the going concern basis of accounting
in preparing the annual Accounts.
(d) Financial Risk Management
Prudent liquidity risk management implies maintaining sufficient cash on deposit and the availability of funding through
an adequate amount of committed credit facilities. The Directors are satisfied that cash levels retained in the business,
committed credit facilities and surety lines are more than adequate for future foreseeable requirements. Further details are
set out in note 30 to the Accounts.
Strategic Report YEAR ENDED 31 DECEMBER 2016
Directors’ Report (continued)YEAR ENDED 31 DECEMBER 2016
2928
LANGLEY HOLDINGS PLC
IFRS ANNUAL REPORT & ACCOUNTS 2016IFRS ANNUAL REPORT & ACCOUNTS 2016
(e) Key performance indicators (KPI’s)
The Board uses a number of tools to monitor the Group’s performance including a review of key performance indicators
(KPI’s) on a regular and consistent basis across the Group. Examples of KPI’s currently used include:
Targets
• Regular monthly monitoring of sold and developed contract margins
• Orders on hand
• Cash held
2016 2015 €’000 €’000
Orders on hand 288,589 301,221Cash held 296,923 329,634
The Board also considers the following non-financial key performance indicator:
• Staff turnover
These are reviewed monthly on information provided to the Board and details are shown on page 18.
(f) Research and development
The Group is committed to innovation and technical excellence. The Group, through its divisions, maintains a programme
of research and development to ensure that it remains at the forefront of respective technologies in its key sectors.
(g) Employment Policy
The Group is committed to a policy of recruitment and promotion on the basis of aptitude and ability, without discrimination
of any kind, and to training for the existing and likely needs of the business.
It is the Group’s policy to keep its employees informed on matters affecting them and actively encourage their involvement
in the performance of the Group.
By order of the Board
B A WATSON
Company Secretary
Langley Holdings PLC
Registered in England and Wales
Company number 01321615
9 February 2017
We have audited the Accounts of Langley Holdings PLC for the year ended 31 December 2016 which comprise the
Consolidated Income Statement, Consolidated Statement of Comprehensive Income, the Consolidated and Parent Company
Statements of Financial Position, the Consolidated and Parent Company Statements of Changes in Equity, the Consolidated
and Parent Company Statements of Cash Flows and the related notes 1 to 39. The financial reporting framework that has
been applied in their preparation is applicable law and International Financial Reporting Standards (IFRSs) as adopted by
the European Union and, as regards the Parent Company Accounts, as applied in accordance with the provisions of the
Companies Act 2006.
This report is made solely to the Company’s member, in accordance with Chapter 3 of Part 16 of the Companies Act 2006.
Our audit work has been undertaken so that we might state to the Company’s member those matters we are required to state
to them in an auditor’s report and for no other purpose. To the fullest extent permitted by law, we do not accept or assume
responsibility to anyone other than the Company and the Company’s member, for our audit work, for this report, or for the
opinions we have formed.
RESPECTIVE RESPONSIBILITIES OF DIRECTORS AND AUDITOR
As explained more fully in the Directors’ Responsibilities Statement set out on page 28, the directors are responsible for the
preparation of the Accounts and for being satisfied that they give a true and fair view. Our responsibility is to audit and express
an opinion on the Accounts in accordance with applicable law and International Standards on Auditing (UK and Ireland). Those
standards require us to comply with the Financial Reporting Council’s (FRC’s) Ethical Standards for Auditors.
SCOPE OF THE AUDIT OF THE ACCOUNTS
A description of the scope of an audit of Accounts is provided on the FRC’s website at www.frc.org.uk/auditscopeukprivate.
OPINION ON ACCOUNTS
In our opinion:
• the Accounts give a true and fair view of the state of the Group’s and of the Parent Company’s affairs as at 31
December 2016 and of the Group’s profit for the year then ended;
• the Group Accounts have been properly prepared in accordance with IFRSs as adopted by the European Union;
• the Parent Company Accounts have been properly prepared in accordance with IFRSs as adopted by the
European Union and as applied in accordance with the provisions of the Companies Act 2006; and
• the Accounts have been prepared in accordance with the requirements of the Companies Act 2006.
Independent Auditor’s Report to the MemberYEAR ENDED 31 DECEMBER 2016
Strategic Report (continued)YEAR ENDED 31 DECEMBER 2016
3130
LANGLEY HOLDINGS PLC
IFRS ANNUAL REPORT & ACCOUNTS 2016IFRS ANNUAL REPORT & ACCOUNTS 2016
OPINION ON OTHER MATTER PRESCRIBED BY THE COMPANIES ACT 2006
In our opinion, based on the work undertaken in the course of the audit:
• the information given in the Strategic Report and the Directors’ Report for the financial year for which the Accounts
are prepared is consistent with those Accounts, and
• the Strategic Report and the Directors’ Report have been prepared in accordance with applicable legal requirements.
In the light of the knowledge and understanding of the company and its environment obtained in the course of the audit we
have not identified material misstatements in the Strategic Report or the Directors’ Report.
MATTERS ON WHICH WE ARE REQUIRED TO REPORT BY EXCEPTION
We have nothing to report in respect of the following matters where the Companies Act 2006 requires us to report to you
if, in our opinion:
• adequate accounting records have not been kept by the Parent Company, or returns adequate for our audit
have not been received from branches not visited by us; or
• the Parent Company Accounts are not in agreement with the accounting records and returns; or
• certain disclosures of directors’ remuneration specified by law are not made; or
• we have not received all the information and explanations we require for our audit.
Jonathan Talbot Portwall Place
Senior Statutory Auditor, for and on behalf of Portwall Lane
Nexia Smith & Williamson Bristol BS1 6NA
Statutory Auditor
Chartered Accountants 9 February 2017
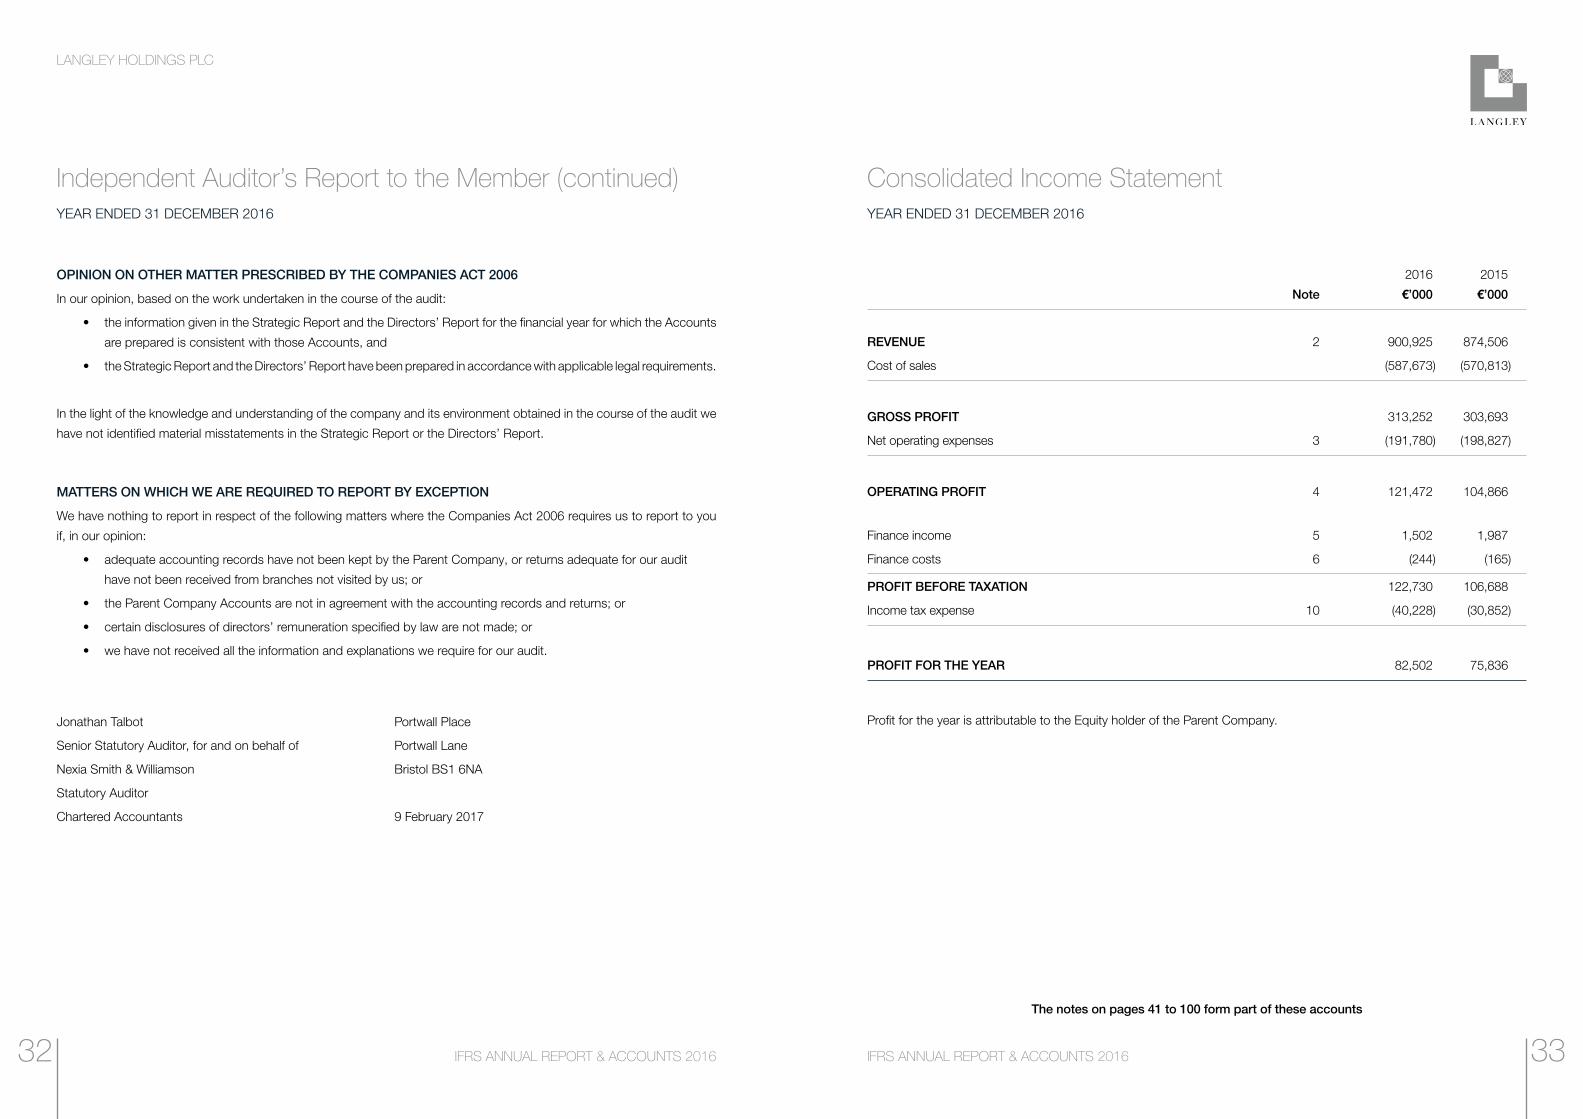
2016 2015
Note €’000 €’000
REVENUE 2 900,925 874,506
Cost of sales (587,673) (570,813)
GROSS PROFIT 313,252 303,693
Net operating expenses 3 (191,780) (198,827)
OPERATING PROFIT 4 121,472 104,866
Finance income 5 1,502 1,987
Finance costs 6 (244) (165)
PROFIT BEFORE TAXATION 122,730 106,688
Income tax expense 10 (40,228) (30,852)
PROFIT FOR THE YEAR 82,502 75,836
Profit for the year is attributable to the Equity holder of the Parent Company.
Independent Auditor’s Report to the Member (continued)YEAR ENDED 31 DECEMBER 2016
Consolidated Income StatementYEAR ENDED 31 DECEMBER 2016
The notes on pages 41 to 100 form part of these accounts
3332
LANGLEY HOLDINGS PLC
IFRS ANNUAL REPORT & ACCOUNTS 2016IFRS ANNUAL REPORT & ACCOUNTS 2016
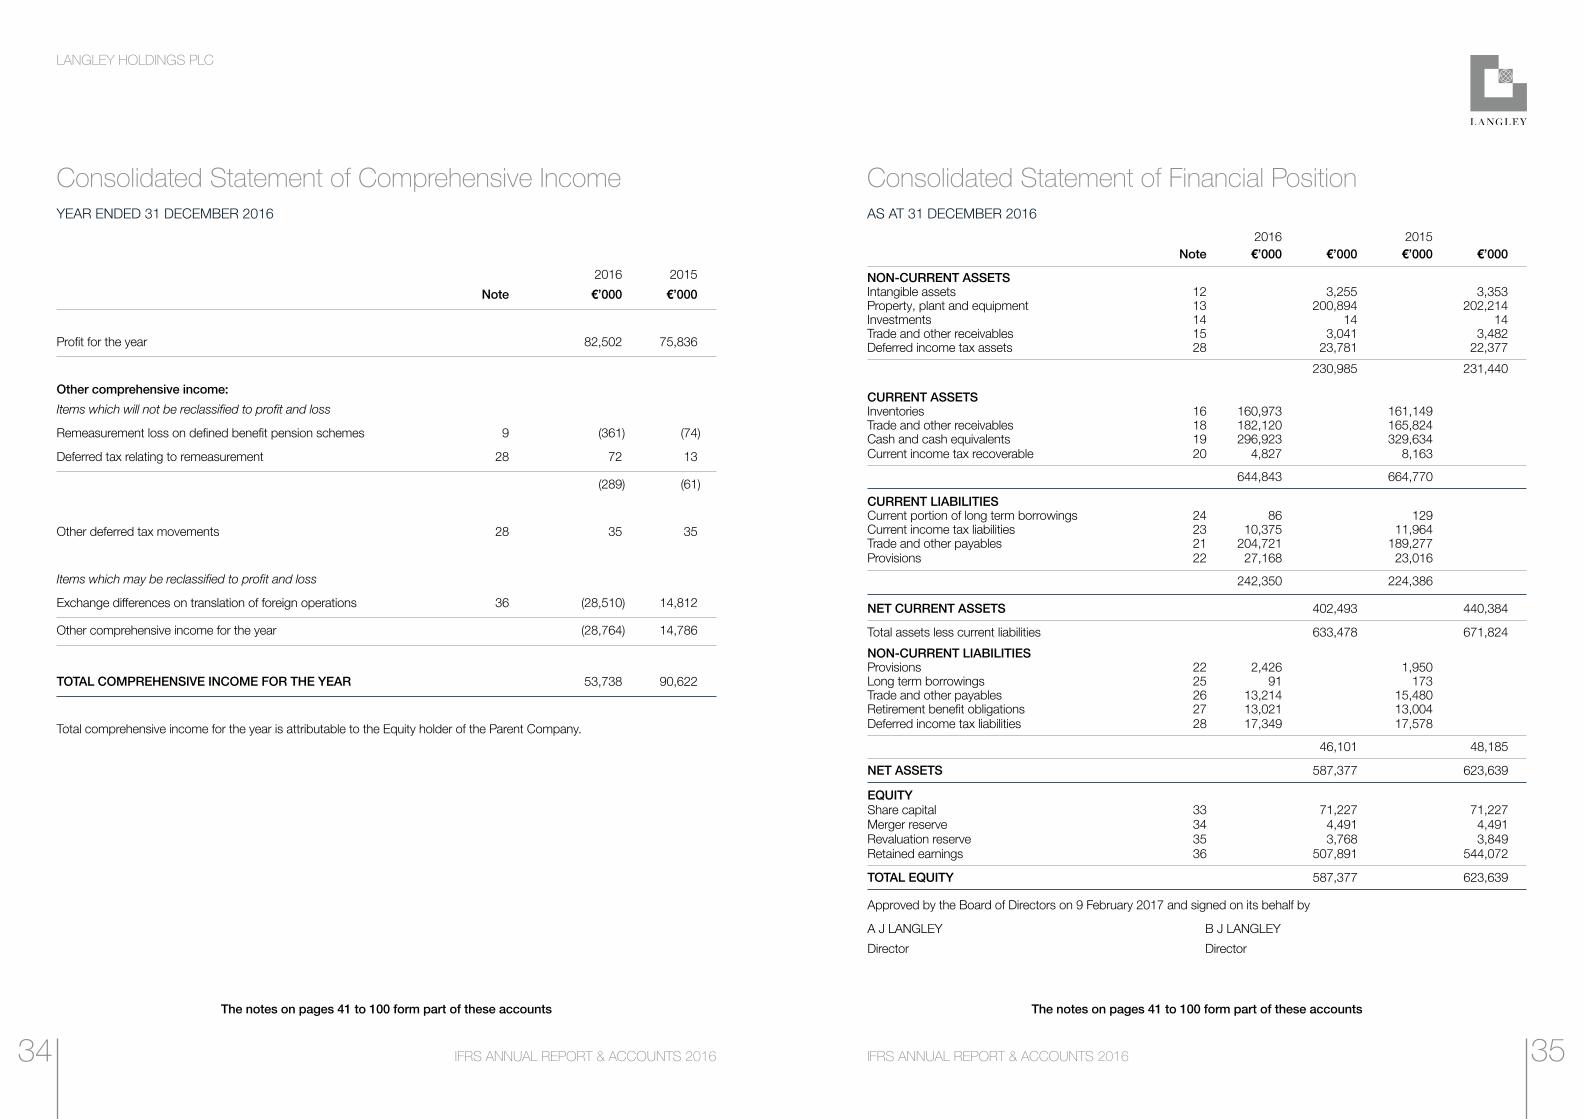
2016 2015
Note €’000 €’000
Profit for the year 82,502 75,836
Other comprehensive income:
Items which will not be reclassified to profit and loss
Remeasurement loss on defined benefit pension schemes 9 (361) (74)
Deferred tax relating to remeasurement 28 72 13
(289) (61)
Other deferred tax movements 28 35 35
Items which may be reclassified to profit and loss
Exchange differences on translation of foreign operations 36 (28,510) 14,812
Other comprehensive income for the year (28,764) 14,786
TOTAL COMPREHENSIVE INCOME FOR THE YEAR 53,738 90,622
Total comprehensive income for the year is attributable to the Equity holder of the Parent Company.
2016 2015 Note €’000 €’000 €’000 €’000
NON-CURRENT ASSETS Intangible assets 12 3,255 3,353Property, plant and equipment 13 200,894 202,214Investments 14 14 14Trade and other receivables 15 3,041 3,482Deferred income tax assets 28 23,781 22,377
230,985 231,440
CURRENT ASSETS Inventories 16 160,973 161,149 Trade and other receivables 18 182,120 165,824 Cash and cash equivalents 19 296,923 329,634 Current income tax recoverable 20 4,827 8,163
644,843 664,770
CURRENT LIABILITIES Current portion of long term borrowings 24 86 129 Current income tax liabilities 23 10,375 11,964 Trade and other payables 21 204,721 189,277 Provisions 22 27,168 23,016
242,350 224,386
NET CURRENT ASSETS 402,493 440,384
Total assets less current liabilities 633,478 671,824
NON-CURRENT LIABILITIES Provisions 22 2,426 1,950Long term borrowings 25 91 173Trade and other payables 26 13,214 15,480Retirement benefit obligations 27 13,021 13,004Deferred income tax liabilities 28 17,349 17,578
46,101 48,185
NET ASSETS 587,377 623,639
EQUITY Share capital 33 71,227 71,227Merger reserve 34 4,491 4,491Revaluation reserve 35 3,768 3,849Retained earnings 36 507,891 544,072
TOTAL EQUITY 587,377 623,639
Approved by the Board of Directors on 9 February 2017 and signed on its behalf by
A J LANGLEY B J LANGLEY
Director Director
Consolidated Statement of Comprehensive IncomeYEAR ENDED 31 DECEMBER 2016
Consolidated Statement of Financial PositionAS AT 31 DECEMBER 2016
The notes on pages 41 to 100 form part of these accounts The notes on pages 41 to 100 form part of these accounts
3534
LANGLEY HOLDINGS PLC
IFRS ANNUAL REPORT & ACCOUNTS 2016IFRS ANNUAL REPORT & ACCOUNTS 2016
Consolidated Statement of Changes in EquityYEAR ENDED 31 DECEMBER 2016
Company Statement of Financial PositionAS AT 31 DECEMBER 2016
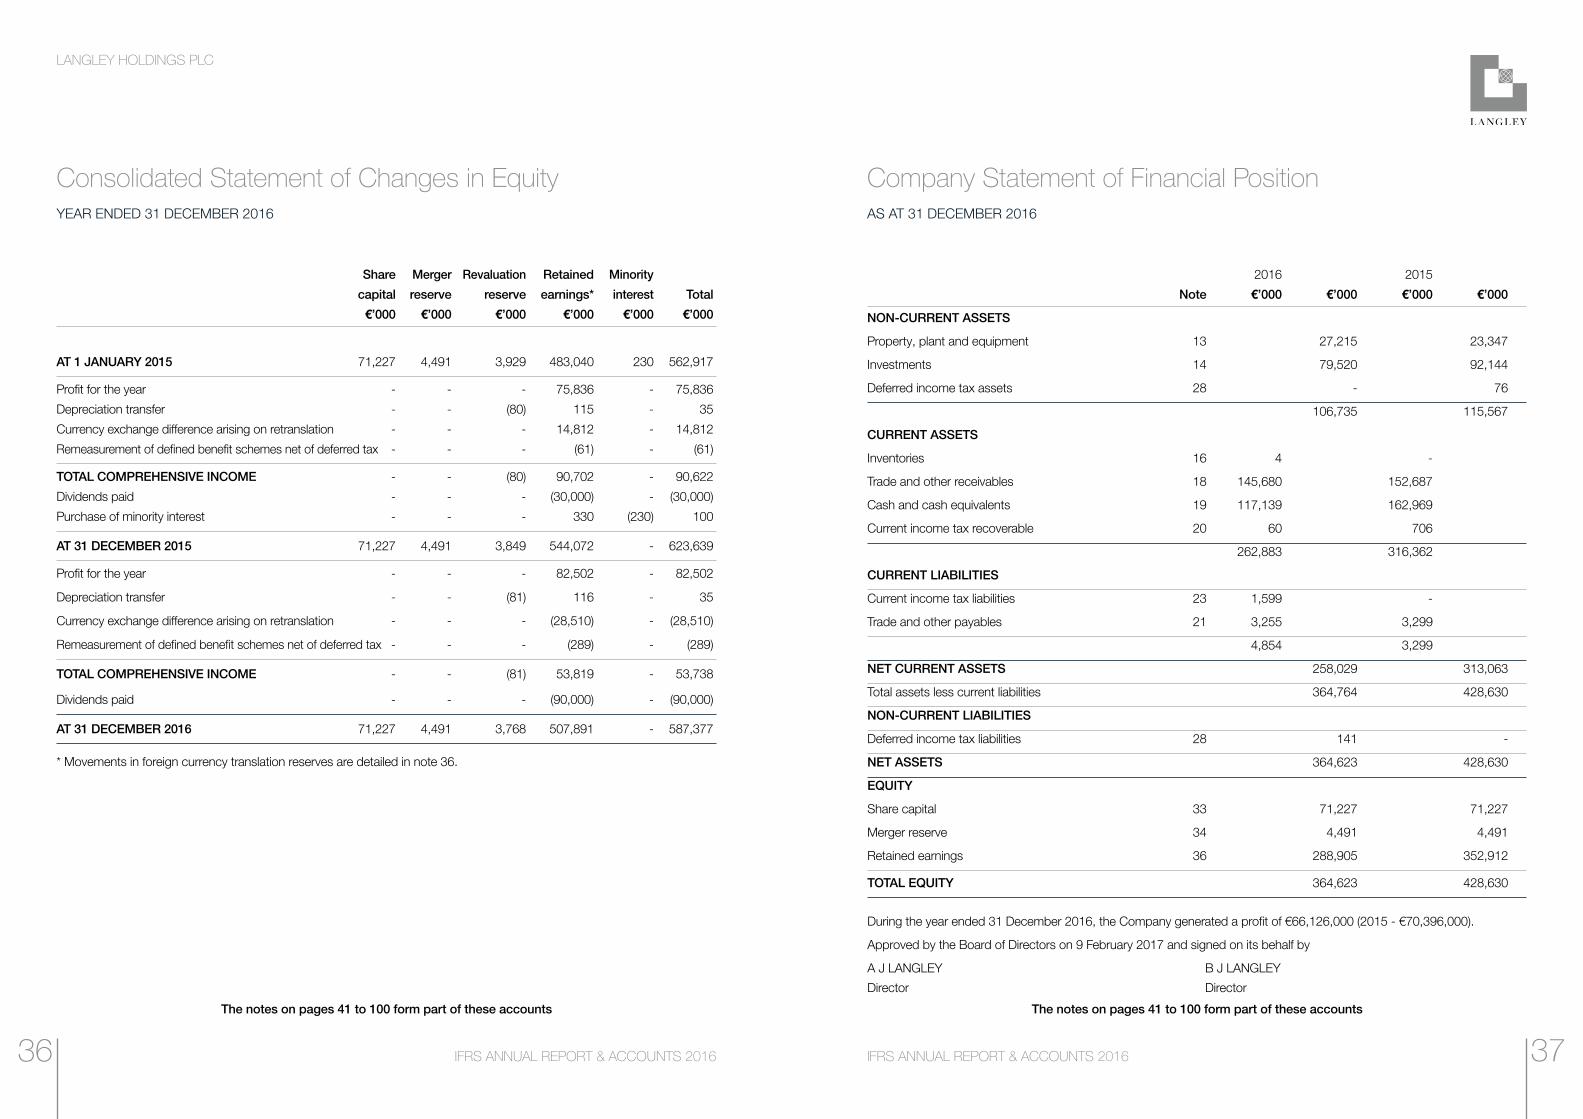
Share Merger Revaluation Retained Minority
capital reserve reserve earnings* interest Total
€’000 €’000 €’000 €’000 €’000 €’000
AT 1 JANUARY 2015 71,227 4,491 3,929 483,040 230 562,917
Profit for the year - - - 75,836 - 75,836
Depreciation transfer - - (80) 115 - 35
Currency exchange difference arising on retranslation - - - 14,812 - 14,812
Remeasurement of defined benefit schemes net of deferred tax - - - (61) - (61)
TOTAL COMPREHENSIVE INCOME - - (80) 90,702 - 90,622
Dividends paid - - - (30,000) - (30,000)
Purchase of minority interest - - - 330 (230) 100
AT 31 DECEMBER 2015 71,227 4,491 3,849 544,072 - 623,639
Profit for the year - - - 82,502 - 82,502
Depreciation transfer - - (81) 116 - 35
Currency exchange difference arising on retranslation - - - (28,510) - (28,510)
Remeasurement of defined benefit schemes net of deferred tax - - - (289) - (289)
TOTAL COMPREHENSIVE INCOME - - (81) 53,819 - 53,738
Dividends paid - - - (90,000) - (90,000)
AT 31 DECEMBER 2016 71,227 4,491 3,768 507,891 - 587,377
* Movements in foreign currency translation reserves are detailed in note 36.
2016 2015
Note €’000 €’000 €’000 €’000
NON-CURRENT ASSETS
Property, plant and equipment 13 27,215 23,347
Investments 14 79,520 92,144
Deferred income tax assets 28 - 76
106,735 115,567
CURRENT ASSETS
Inventories 16 4 -
Trade and other receivables 18 145,680 152,687
Cash and cash equivalents 19 117,139 162,969
Current income tax recoverable 20 60 706
262,883 316,362
CURRENT LIABILITIES
Current income tax liabilities 23 1,599 -
Trade and other payables 21 3,255 3,299
4,854 3,299
NET CURRENT ASSETS 258,029 313,063
Total assets less current liabilities 364,764 428,630
NON-CURRENT LIABILITIES
Deferred income tax liabilities 28 141 -
NET ASSETS 364,623 428,630
EQUITY
Share capital 33 71,227 71,227
Merger reserve 34 4,491 4,491
Retained earnings 36 288,905 352,912
TOTAL EQUITY 364,623 428,630
During the year ended 31 December 2016, the Company generated a profit of €66,126,000 (2015 - €70,396,000).
Approved by the Board of Directors on 9 February 2017 and signed on its behalf by
A J LANGLEY B J LANGLEY
Director Director
The notes on pages 41 to 100 form part of these accounts The notes on pages 41 to 100 form part of these accounts
3736
LANGLEY HOLDINGS PLC
IFRS ANNUAL REPORT & ACCOUNTS 2016IFRS ANNUAL REPORT & ACCOUNTS 2016
Company Statement of Changes in EquityYEAR ENDED 31 DECEMBER 2016
Consolidated Statement of Cash FlowsYEAR ENDED 31 DECEMBER 2016
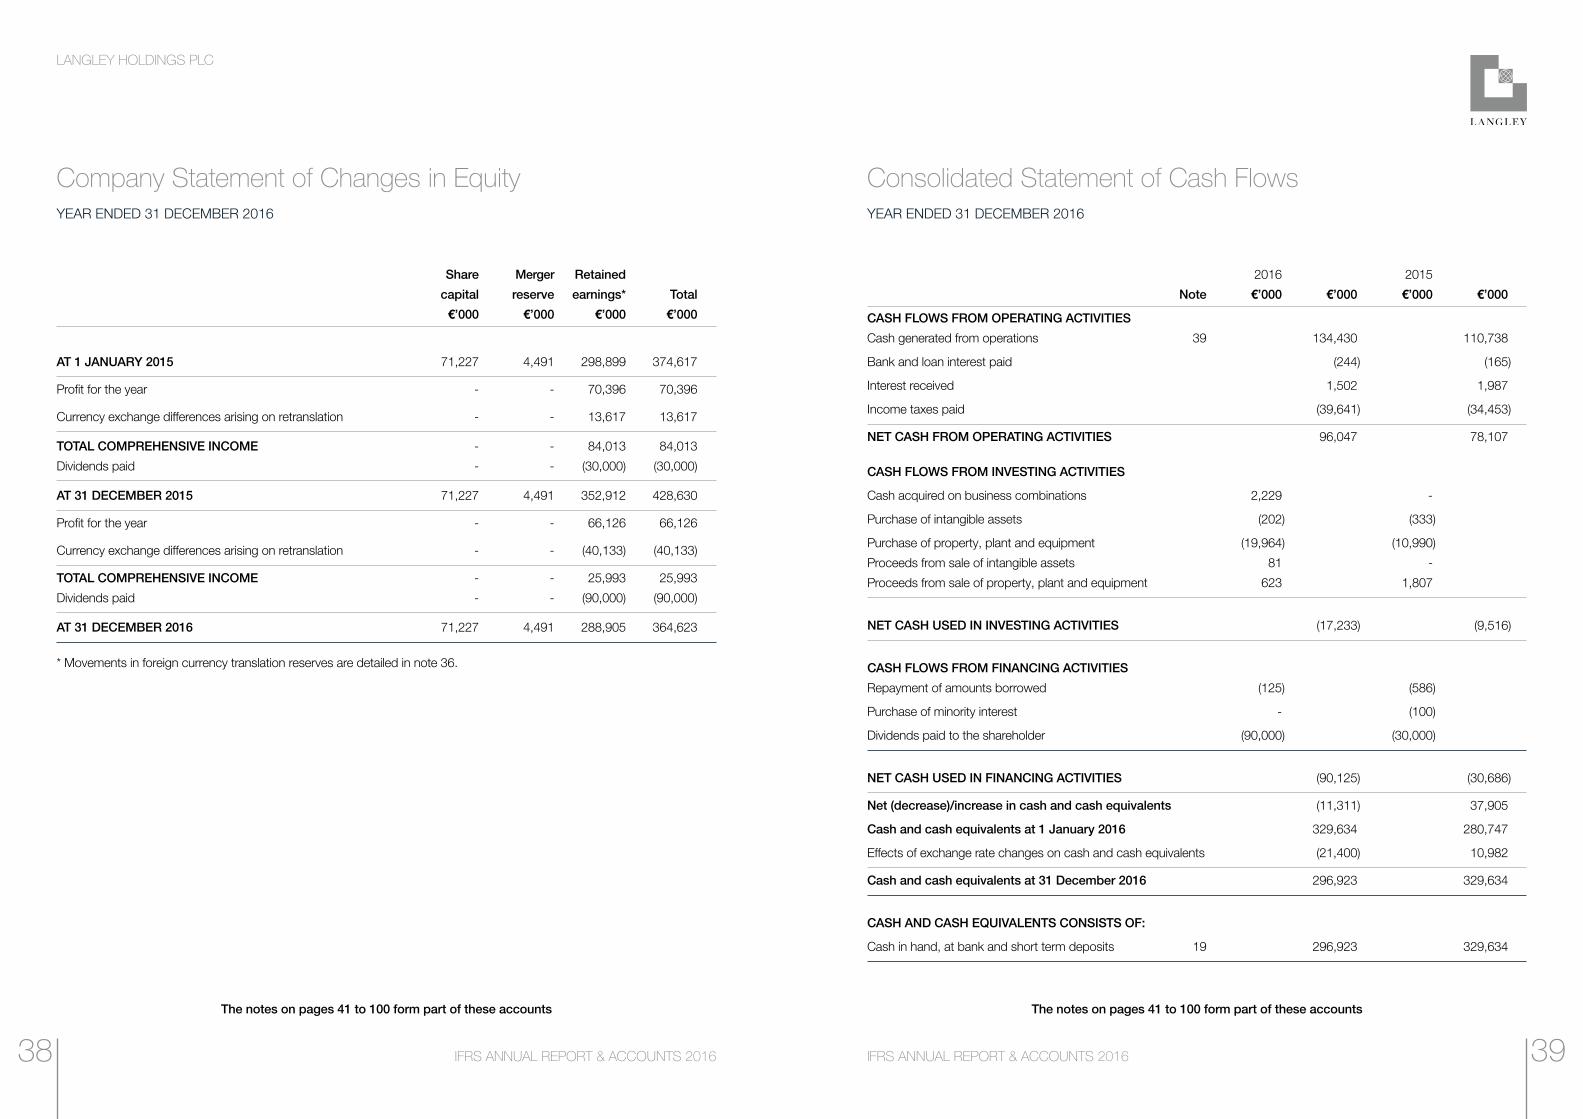
Share Merger Retained
capital reserve earnings* Total
€’000 €’000 €’000 €’000
AT 1 JANUARY 2015 71,227 4,491 298,899 374,617
Profit for the year - - 70,396 70,396
Currency exchange differences arising on retranslation - - 13,617 13,617
TOTAL COMPREHENSIVE INCOME - - 84,013 84,013
Dividends paid - - (30,000) (30,000)
AT 31 DECEMBER 2015 71,227 4,491 352,912 428,630
Profit for the year - - 66,126 66,126
Currency exchange differences arising on retranslation - - (40,133) (40,133)
TOTAL COMPREHENSIVE INCOME - - 25,993 25,993
Dividends paid - - (90,000) (90,000)
AT 31 DECEMBER 2016 71,227 4,491 288,905 364,623
* Movements in foreign currency translation reserves are detailed in note 36.
2016 2015
Note €’000 €’000 €’000 €’000
CASH FLOWS FROM OPERATING ACTIVITIES
Cash generated from operations 39 134,430 110,738
Bank and loan interest paid (244) (165)
Interest received 1,502 1,987
Income taxes paid (39,641) (34,453)
NET CASH FROM OPERATING ACTIVITIES 96,047 78,107
CASH FLOWS FROM INVESTING ACTIVITIES
Cash acquired on business combinations 2,229 -
Purchase of intangible assets (202) (333)
Purchase of property, plant and equipment (19,964) (10,990)
Proceeds from sale of intangible assets 81 -
Proceeds from sale of property, plant and equipment 623 1,807
NET CASH USED IN INVESTING ACTIVITIES (17,233) (9,516)
CASH FLOWS FROM FINANCING ACTIVITIES
Repayment of amounts borrowed (125) (586)
Purchase of minority interest - (100)
Dividends paid to the shareholder (90,000) (30,000)
NET CASH USED IN FINANCING ACTIVITIES (90,125) (30,686)
Net (decrease)/increase in cash and cash equivalents (11,311) 37,905
Cash and cash equivalents at 1 January 2016 329,634 280,747
Effects of exchange rate changes on cash and cash equivalents (21,400) 10,982
Cash and cash equivalents at 31 December 2016 296,923 329,634
CASH AND CASH EQUIVALENTS CONSISTS OF:
Cash in hand, at bank and short term deposits 19 296,923 329,634
The notes on pages 41 to 100 form part of these accounts The notes on pages 41 to 100 form part of these accounts
3938

LANGLEY HOLDINGS PLC
IFRS ANNUAL REPORT & ACCOUNTS 2016IFRS ANNUAL REPORT & ACCOUNTS 2016
Company Statement of Cash FlowsYEAR ENDED 31 DECEMBER 2016
Notes to the AccountsYEAR ENDED 31 DECEMBER 2016
2016 2015
Note €’000 €’000 €’000 €’000
CASH FLOWS FROM OPERATING ACTIVITIES
Cash generated from operations 39 11,995 7,786
Interest paid - (11)
Interest received 5,921 6,688
Income taxes paid (3,409) (683)
NET CASH FROM OPERATING ACTIVITIES 14,507 13,780
CASH FLOWS FROM INVESTING ACTIVITIES
Dividends received 54,902 62,810
Purchase of property, plant and equipment (8,738) (2,487)
Proceeds from sale of property, plant and equipment 26 185
NET CASH FROM INVESTING ACTIVITIES 46,190 60,508
CASH FLOWS FROM FINANCING ACTIVITIES
Dividends paid to the shareholder (90,000) (30,000)
NET CASH USED IN FINANCING ACTIVITIES (90,000) (30,000)
Net (decrease)/increase in cash and cash equivalents (29,303) 44,288
Cash and cash equivalents at 1 January 2016 162,969 113,426
Effects of exchange rate changes on cash and cash equivalents (16,527) 5,255
Cash and cash equivalents at 31 December 2016 117,139 162,969
CASH AND CASH EQUIVALENTS CONSISTS OF:
Cash in hand, at bank and short term deposits 19 117,139 162,969
1 ACCOUNTING POLICIES
a Basis of preparation
Langley Holdings PLC (registered number 01321615) is a public limited Company incorporated in the United Kingdom
and limited by shares. The address of its registered office is Enterprise Way, Retford, Nottinghamshire, DN22 7HH.
The Accounts have been prepared in accordance with International Financial Reporting Standards (IFRS) as approved for
use in the European Union applied in accordance with the provisions of the Companies Act 2006.
The Accounts have been prepared on a historical cost basis, except for the revaluation of property, plant and equipment
and measurement of defined benefit pension schemes.
New and amended standards which became effective during the year
There were a number of Amendments to Standards adopted in the current year, but none of these had a material impact
on the Group in the current period.
New and amended standards which are not effective for the current period
IFRS 9, Financial Instruments, IFRS 15, Revenue from Contracts with Customers and IFRS 16, Leases are in issue but
are not yet effective so the Group has not adopted these standards in these Accounts.
A number of Amendments and Improvements have also been issued but are not yet effective including dealing with
recognition of deferred tax assets and treatment of foreign exchange when receiving advance consideration. The directors
are currently assessing the impact of these new Standards, Improvements and Amendments on the Group’s Accounts.
The notes on pages 41 to 100 form part of these accounts
4140
LANGLEY HOLDINGS PLC
IFRS ANNUAL REPORT & ACCOUNTS 2016IFRS ANNUAL REPORT & ACCOUNTS 2016
Notes to the Accounts (continued)YEAR ENDED 31 DECEMBER 2016
Notes to the Accounts (continued)YEAR ENDED 31 DECEMBER 2016
1 ACCOUNTING POLICIES (continued)
b Consolidation
The Consolidated Accounts incorporate the Accounts of the Company and all of its subsidiary undertakings for the
year ended 31 December 2016 using the acquisition method, except for common control transactions, and exclude
all intra-group transactions. Assets, liabilities and contingent liabilities of acquired companies are measured at fair
value at the date of acquisition.
Minority interests, presented as part of equity, represent the portion of a subsidiary’s profit or loss and net assets that
is not held by the Group.
Any excess or deficiency between the cost of acquisition and fair value is treated as positive goodwill or a gain on
bargain purchase as described below. Where subsidiary undertakings are acquired or disposed of during the year,
the results and turnover are included in the Consolidated Income Statement from, or up to, the date control passes.
The Company has taken advantage of the exemption granted by Section 408 of the Companies Act 2006 from
presenting its own Income Statement.
c Goodwill
When the fair value of the consideration for an acquired undertaking exceeds the fair value of its separable net assets,
the difference is treated as purchased goodwill and is recognised as an asset at cost and reviewed for impairment
annually. Any impairment is recognised immediately in the Consolidated Income Statement and is not reversed in
subsequent years.
Where the fair value of the separable net assets exceeds the fair value of the consideration for an acquired undertaking
the difference is credited to the Consolidated Income Statement in the year of acquisition.
1 ACCOUNTING POLICIES (continued)
d Impairment of intangible assets
Assets that have an indefinite useful life are not subject to amortisation and are reviewed for impairment annually and
when there are indications that the carrying value may not be recoverable. Assets that are subject to amortisation are
reviewed for impairment wherever events or changes in circumstances indicate that the carrying amount may not be
recoverable. An impairment loss is recognised for the amount by which the carrying amount of the asset exceeds its
recoverable amount. The recoverable amount is the higher of the fair value less costs to sell and value in use. For the
purposes of assessing impairment, assets are grouped at the lowest levels for which there are separately identifiable
cash flows (cash-generating units).
The amortisation charged on those intangible assets that do not have an indefinite useful life is calculated as follows:
Patents and licenses - 2 to 10 years straight line
e Property, plant and equipment
Property, plant and equipment is stated at cost of purchase or valuation, net of depreciation and any impairment
provision.
Freehold land - not depreciated
Freehold buildings - 50 years straight line
Vehicles - 4 to 20 years straight line
Plant and machinery - 4 to 20 years straight line
Computers - 3 to 8 years straight line
Revaluations of land and buildings are made with sufficient regularity to ensure that the carrying amount does not
differ materially from that which would be determined using fair value at the year end.
4342

LANGLEY HOLDINGS PLC
IFRS ANNUAL REPORT & ACCOUNTS 2016IFRS ANNUAL REPORT & ACCOUNTS 2016
1 ACCOUNTING POLICIES (continued)
f Financial instruments
Financial assets and financial liabilities are recognised in the Consolidated Statement of Financial Position when the
Group becomes a party to the contractual provisions of the instrument.
Trade receivables
Trade receivables do not carry any interest and are initially measured at their fair value, and subsequently at their
amortised cost, as reduced by appropriate allowances for estimated irrecoverable amounts.
Borrowings
Interest-bearing loans and overdrafts are recorded initially when the proceeds are received. Finance charges are
accounted for at amortised cost using the effective interest rate method.
Trade payables
Trade payables are non-interest bearing and are initially measured at their fair value and subsequently at their
amortised cost.
g Investments
Investments represent the Parent Company’s holdings in its subsidiaries and are presented as non-current assets
and stated at cost less any impairment in value. Any impairment is charged to the Company Income Statement.
h Inventories and work in progress
Inventories are valued at the lower of cost and net realisable value. Cost is calculated as follows:
Raw materials and consumables - cost of purchase on first in, first out basis.
Finished goods - cost of raw materials and labour together with attributable overheads.
Work in progress - cost of raw materials and labour together with attributable overheads.
Net realisable value is based on estimated selling price less further costs to completion and disposal.
1 ACCOUNTING POLICIES (continued)
i Construction contracts
Contract costs are recognised when incurred. When the outcome of a construction contract can be estimated reliably
and it is probable that the contract will be profitable, contract revenue is recognised over the period of the contract.
When the outcome of a construction contract cannot be estimated reliably, contract revenue is recognised only to the
extent of contract costs incurred that it is probable will be recoverable. When it is probable that total contract costs
will exceed total contract revenue, the expected loss is recognised as an expense immediately.
The Group uses the ‘percentage of completion method’ to determine the appropriate amount to recognise in a given
period. The stage of completion is measured by reference to either the contract costs incurred up to the year end
as a percentage of total estimated costs for each contract, or by reference to milestone conditions as defined in the
contracts, as appropriate to the circumstances of the particular contract. Costs incurred in the year in connection
with future activity on a contract are excluded from contract costs in determining the stage of completion, and are
presented as inventories, prepayments or other assets, depending on their nature.
The Group presents as an asset the gross amount due from customers for contract work for all contracts in progress
for which costs incurred plus recognised profits (less recognised losses) exceeds progress billings. Progress billings
not yet paid by customers and retentions are included within ‘trade and other receivables’.
The Group presents as a liability the gross amount due to customers for contract work for all contracts in progress
for which progress billings exceed costs incurred plus recognised profits (less recognised losses).
j Taxes
Income tax expense represents the sum of the income tax currently payable and deferred income tax.
Deferred income tax is provided, using the liability method, on temporary differences between the tax bases of assets
and liabilities and their carrying amounts in the Accounts. Deferred income tax assets are recognised to the extent
that it is probable that future taxable profits will be available against which the deductible temporary differences can
be utilised. Deferred tax has been calculated at the rate expected to apply at the time at which temporary differences
are forecast to reverse, based on tax rates which have been substantially enacted at the balance sheet date.
Current and deferred income tax assets and liabilities are offset when the income taxes are levied by the same
taxation authority and when there is a legally enforceable right to offset them.
Notes to the Accounts (continued)YEAR ENDED 31 DECEMBER 2016
Notes to the Accounts (continued)YEAR ENDED 31 DECEMBER 2016
4544
LANGLEY HOLDINGS PLC
IFRS ANNUAL REPORT & ACCOUNTS 2016IFRS ANNUAL REPORT & ACCOUNTS 2016
1 ACCOUNTING POLICIES (continued)
k Foreign currencies
(a) Transactions and balances
Transactions in currencies other than euro are recorded at the rates of exchange prevailing on the dates of the transactions. At each year end, monetary assets and liabilities that are denominated in foreign currencies are retranslated at the rates prevailing at the year end. Non-monetary assets and liabilities carried at fair value that are denominated in foreign currencies are translated at the rates prevailing at the date when the fair value was determined. Gains and losses arising on retranslation are included in net profit or loss for the period, except for exchange differences arising on non-monetary assets and liabilities where the changes in fair value are recognised directly in equity.
(b) Accounts of overseas operations
On consolidation, exchange differences arising from the translation of the net investment in foreign operations are taken to other comprehensive income.
Goodwill and fair value adjustments arising on the acquisition of a foreign entity are treated as assets and liabilities of the foreign entity and translated at the closing rate.
(c) Preparation of accounts
These Accounts have been presented in euro because the majority of the Group’s trade is conducted in this currency. Income and expense items are translated at the average exchange rates for the period unless exchange rates fluctuate significantly. Exchange differences arising, if any, are classified as equity and transferred to a separate component of equity.
The average exchange rate during the year was €1.22 (2015 - €1.38) to the Pound Sterling. The opening exchange rate was €1.36 (2015 - €1.28) to the Pound Sterling and the closing exchange rate was €1.17 (2015 - €1.36) to the Pound Sterling.
l Revenue recognition
Revenue from sale of goods is recognised when the Group has delivered the products and the customer has accepted them, and is measured at the fair value of the consideration received or receivable and represents amounts receivable for goods and services provided in the normal course of business, net of discounts, VAT and other sales related taxes.
Revenue from construction contracts is recognised in accordance with the Group’s accounting policy on construction contracts.
1 ACCOUNTING POLICIES (continued)
m Cash and cash equivalents
Cash and cash equivalents comprise cash in hand, cash at bank and short-term deposits with banks and similar
financial institutions with a maturity of six months or less, and bank overdrafts.
n Post-employment benefit obligations
For defined benefit post-employment schemes, the difference between the fair value of the scheme assets (if any) and
the present value of the scheme liabilities is recognised as an asset or liability in the Statement of Financial Position.
Any asset recognised is restricted, if appropriate, to the present value of any amounts the Group expects to recover
by way of refunds from the plan or reductions in future contributions. Remeasurements of the net surplus / deficit
arising in the year are taken to the Statement of Comprehensive Income.
Other movements in the net surplus or deficit are recognised in the Income Statement, including the current service
cost and any past service cost. The net interest cost on the net defined benefit liability is also charged to the Income
Statement. The amount charged to the Income Statement in respect of these schemes is included within operating
costs.
The most significant assumptions used in accounting for pension schemes are the discount rate and the mortality
assumptions. The discount rate is used to determine the interest cost and net present value of future liabilities. The
discount rate used is the yield on high quality corporate bonds with maturity and terms that match those of the post
employment obligations as closely as possible. Where there is no developed corporate bond market in a country,
the rate on government bonds is used. Each year, the unwinding of the discount on the net liabilities is charged to
the Group’s Income Statement as the interest cost. The mortality assumption is used to project the future stream of
benefit payments, which is then discounted to arrive at a net present value of liabilities.
Valuations of liabilities are carried out using the projected unit method.
The values attributed to scheme liabilities are assessed in accordance with the advice of independent qualified
actuaries.
The Group’s contributions to defined contribution pension schemes are charged to the Income Statement in the
period to which the contributions relate.
o Leased assets
All leases are “operating leases” and the relevant annual rentals are charged to the Consolidated Income Statement
on a straight line basis over the lease term.
Notes to the Accounts (continued)YEAR ENDED 31 DECEMBER 2016
Notes to the Accounts (continued)YEAR ENDED 31 DECEMBER 2016
4746
LANGLEY HOLDINGS PLC
IFRS ANNUAL REPORT & ACCOUNTS 2016IFRS ANNUAL REPORT & ACCOUNTS 2016
Notes to the Accounts (continued)YEAR ENDED 31 DECEMBER 2016
Notes to the Accounts (continued)YEAR ENDED 31 DECEMBER 2016
1 ACCOUNTING POLICIES (continued)
p Dividend policy
Dividend distribution to the Company’s Shareholder is recognised as a liability in the Group’s Accounts in the period
in which the dividends are approved by the Company’s Shareholder.
q Key assumptions and significant judgements
The preparation of the Accounts in conformity with IFRS requires management to make estimates and assumptions
that affect the reported amounts of revenues, expenses, assets and liabilities, and the disclosure of contingent
liabilities at the date of the Accounts. The areas where the most judgement is required are highlighted below:
i Pensions
The determination of the pension cost and defined benefit obligation of the Group’s defined benefit pension
schemes depends on the selection of certain assumptions which include the discount rate, inflation rate,
salary growth and mortality. Differences arising from actual experiences or future changes in assumptions
will be reflected in subsequent periods. See note 9 for further details.
ii Property, plant and equipment
The property, plant and equipment used within the Group have estimated service lives of between 3 and 20
years, with the exception of property which has an estimated service life of 50 years, and the depreciation
charge is clearly sensitive to the lives allocated to the various types of asset. Asset lives are reviewed
regularly and changed where necessary to reflect the current view on their remaining lives in light of the
technological change, prospective economic utilisation and the physical condition of the assets.
iii Revenue recognition
Revenue and profit are recognised for contracts undertaken based on estimates of the stage of completion
of the contract activity. The Group’s policies for the recognition of revenue and profit are set out above.
1 ACCOUNTING POLICIES (continued)
q Key assumptions and significant judgements (continued)
iv Impairment of assets
Property, plant and equipment, and intangible assets are reviewed for impairment if events or changes in
circumstances indicate that the carrying amount may not be recoverable. When a review for impairment is
conducted, the recoverable amount of an asset or a cash-generating unit is determined based on value-in-
use calculations prepared on the basis of management’s assumptions and estimates.
v Income taxes
The Group is subject to income taxes in numerous jurisdictions. Significant judgement is required in
determining the provision for income taxes in each territory. There are many transactions and calculations
for which the ultimate tax determination is uncertain during the ordinary course of business. The Group
recognises liabilities for anticipated tax audit issues based on estimates of whether additional taxes will
be due. Where the final tax outcome of these matters is different from the amounts which were initially
recorded, such differences will impact the income tax and deferred tax provision in the period to which
such determination is made. See notes 10 and 28 for further information.
vi Provisions
Provision is made for liabilities that are uncertain in timing or amount of settlement. These include provision
for rectification and warranty claims. Calculations of these provisions are based on cash flows relating to
these costs estimated by management supported by the use of external consultants where needed and
discounted at an appropriate rate where the impact of discounting is material.
r Research and development
Research expenditure is charged to the Income Statement in the period in which it is incurred. Development expenditure is capitalised when the criteria for recognising an asset is met. Other development expenditure is recognised in the Income Statement as incurred.
4948
LANGLEY HOLDINGS PLC
IFRS ANNUAL REPORT & ACCOUNTS 2016IFRS ANNUAL REPORT & ACCOUNTS 2016
Notes to the Accounts (continued)YEAR ENDED 31 DECEMBER 2016
Notes to the Accounts (continued)YEAR ENDED 31 DECEMBER 2016
2 REVENUE
An analysis of the Group’s revenue between each significant category is as follows:
2016 2015
€’000 €’000
Revenue from construction contracts 186,075 190,988
Sale of goods 714,850 683,518
900,925 874,506
3 ANALYSIS OF NET OPERATING EXPENSES 2016 2015
€’000 €’000
Distribution costs 49,709 52,093
Administrative expenses 147,760 153,914
Other operating income (5,689) (7,180)
Net operating expenses 191,780 198,827
4 OPERATING PROFIT 2016 2015
€’000 €’000
Operating profit has been arrived at after charging:
Directors’ emoluments (note 7) 3,245 2,932
Depreciation of owned assets (note 13) 13,369 13,639
Impairment of owned assets (note 13) 146 1,726
Amortisation of intangibles (note 12) 527 388
Research and development costs 7,179 7,484
Profit on sale of property, plant and equipment (95) (1,226)
Fees payable to the Group’s auditor for the audit of the Group’s Accounts 179 186
Fees payable to the Group’s auditor and its associates for other services
- the auditing of Subsidiary Accounts 1,163 1,158
- other services relating to taxation compliance 133 225
- all other services 165 363
Operating leases
- land and buildings 4,749 5,600
- other 924 1,114
Impairment of trade receivables 1,356 534
Cost of inventories recognised as an expense (included in cost of sales) 403,555 389,210
Net (profit)/loss on foreign currency translation (306) 1,682
Write down of inventories - 2,620
5150

LANGLEY HOLDINGS PLC
IFRS ANNUAL REPORT & ACCOUNTS 2016IFRS ANNUAL REPORT & ACCOUNTS 2016
Notes to the Accounts (continued)YEAR ENDED 31 DECEMBER 2016
Notes to the Accounts (continued)YEAR ENDED 31 DECEMBER 2016
5 FINANCE INCOME 2016 2015
€’000 €’000
Bank interest receivable 1,281 1,425
Other interest receivable 221 562
1,502 1,987
6 FINANCE COSTS 2016 2015
€’000 €’000
Other interest 244 165
7 KEY MANAGEMENT PERSONNEL COMPENSATION 2016 2015
€’000 €’000
Salaries and short-term employee benefits 3,654 3,271
Post-employment benefits 31 55
3,685 3,326
All of the above key management personnel compensation relates to Directors.
Directors’ emoluments
2016 2015
€’000 €’000
Aggregate emoluments as Directors of the Company 3,214 2,877
Value of Group pension contributions to money purchase schemes 31 55
3,245 2,932
Emoluments of the highest paid Director 2,683 2,036
No. No.
Number of Directors who are accruing benefits under money purchase pension schemes 2 3
5352
LANGLEY HOLDINGS PLC
IFRS ANNUAL REPORT & ACCOUNTS 2016IFRS ANNUAL REPORT & ACCOUNTS 2016
Notes to the Accounts (continued)YEAR ENDED 31 DECEMBER 2016
Notes to the Accounts (continued)YEAR ENDED 31 DECEMBER 2016
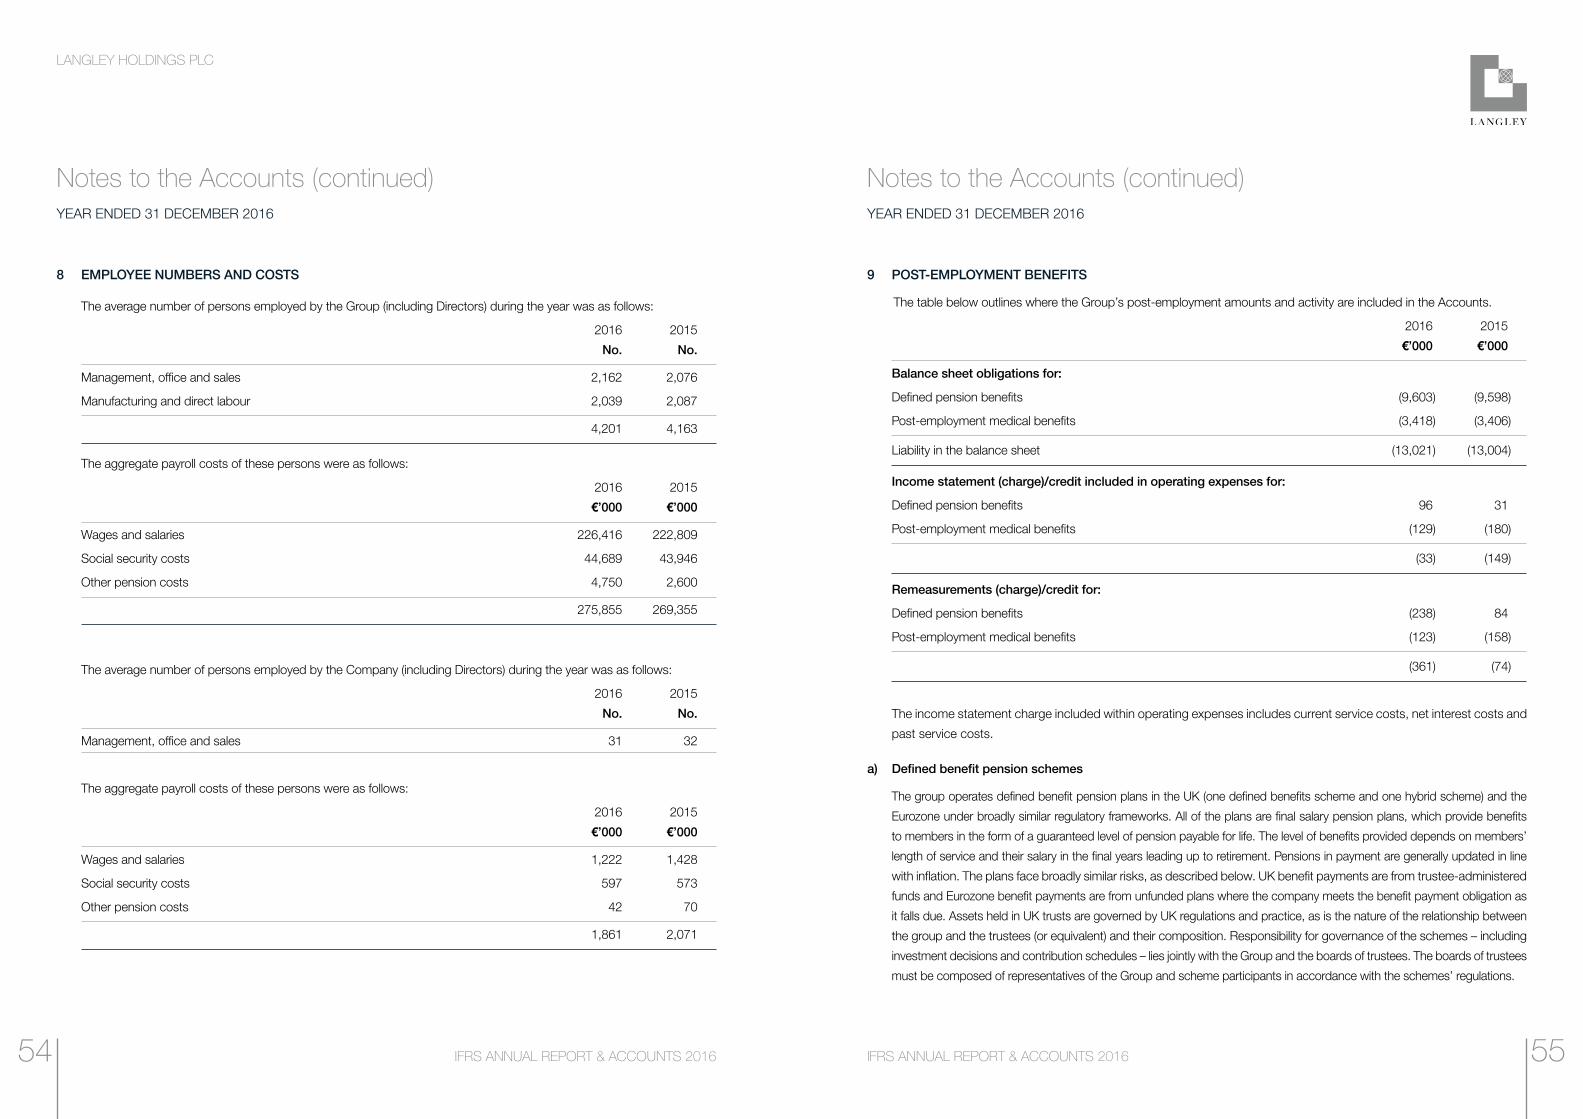
8 EMPLOYEE NUMBERS AND COSTS
The average number of persons employed by the Group (including Directors) during the year was as follows:
2016 2015
No. No.
Management, office and sales 2,162 2,076
Manufacturing and direct labour 2,039 2,087
4,201 4,163
The aggregate payroll costs of these persons were as follows:
2016 2015
€’000 €’000
Wages and salaries 226,416 222,809
Social security costs 44,689 43,946
Other pension costs 4,750 2,600
275,855 269,355
The average number of persons employed by the Company (including Directors) during the year was as follows:
2016 2015
No. No.
Management, office and sales 31 32
The aggregate payroll costs of these persons were as follows:
2016 2015
€’000 €’000
Wages and salaries 1,222 1,428
Social security costs 597 573
Other pension costs 42 70
1,861 2,071
9 POST-EMPLOYMENT BENEFITS
The table below outlines where the Group’s post-employment amounts and activity are included in the Accounts.
2016 2015
€’000 €’000
Balance sheet obligations for:
Defined pension benefits (9,603) (9,598)
Post-employment medical benefits (3,418) (3,406)
Liability in the balance sheet (13,021) (13,004)
Income statement (charge)/credit included in operating expenses for:
Defined pension benefits 96 31
Post-employment medical benefits (129) (180)
(33) (149)
Remeasurements (charge)/credit for:
Defined pension benefits (238) 84
Post-employment medical benefits (123) (158)
(361) (74)
The income statement charge included within operating expenses includes current service costs, net interest costs and
past service costs.
a) Defined benefit pension schemes
The group operates defined benefit pension plans in the UK (one defined benefits scheme and one hybrid scheme) and the
Eurozone under broadly similar regulatory frameworks. All of the plans are final salary pension plans, which provide benefits
to members in the form of a guaranteed level of pension payable for life. The level of benefits provided depends on members’
length of service and their salary in the final years leading up to retirement. Pensions in payment are generally updated in line
with inflation. The plans face broadly similar risks, as described below. UK benefit payments are from trustee-administered
funds and Eurozone benefit payments are from unfunded plans where the company meets the benefit payment obligation as
it falls due. Assets held in UK trusts are governed by UK regulations and practice, as is the nature of the relationship between
the group and the trustees (or equivalent) and their composition. Responsibility for governance of the schemes – including
investment decisions and contribution schedules – lies jointly with the Group and the boards of trustees. The boards of trustees
must be composed of representatives of the Group and scheme participants in accordance with the schemes’ regulations.
5554
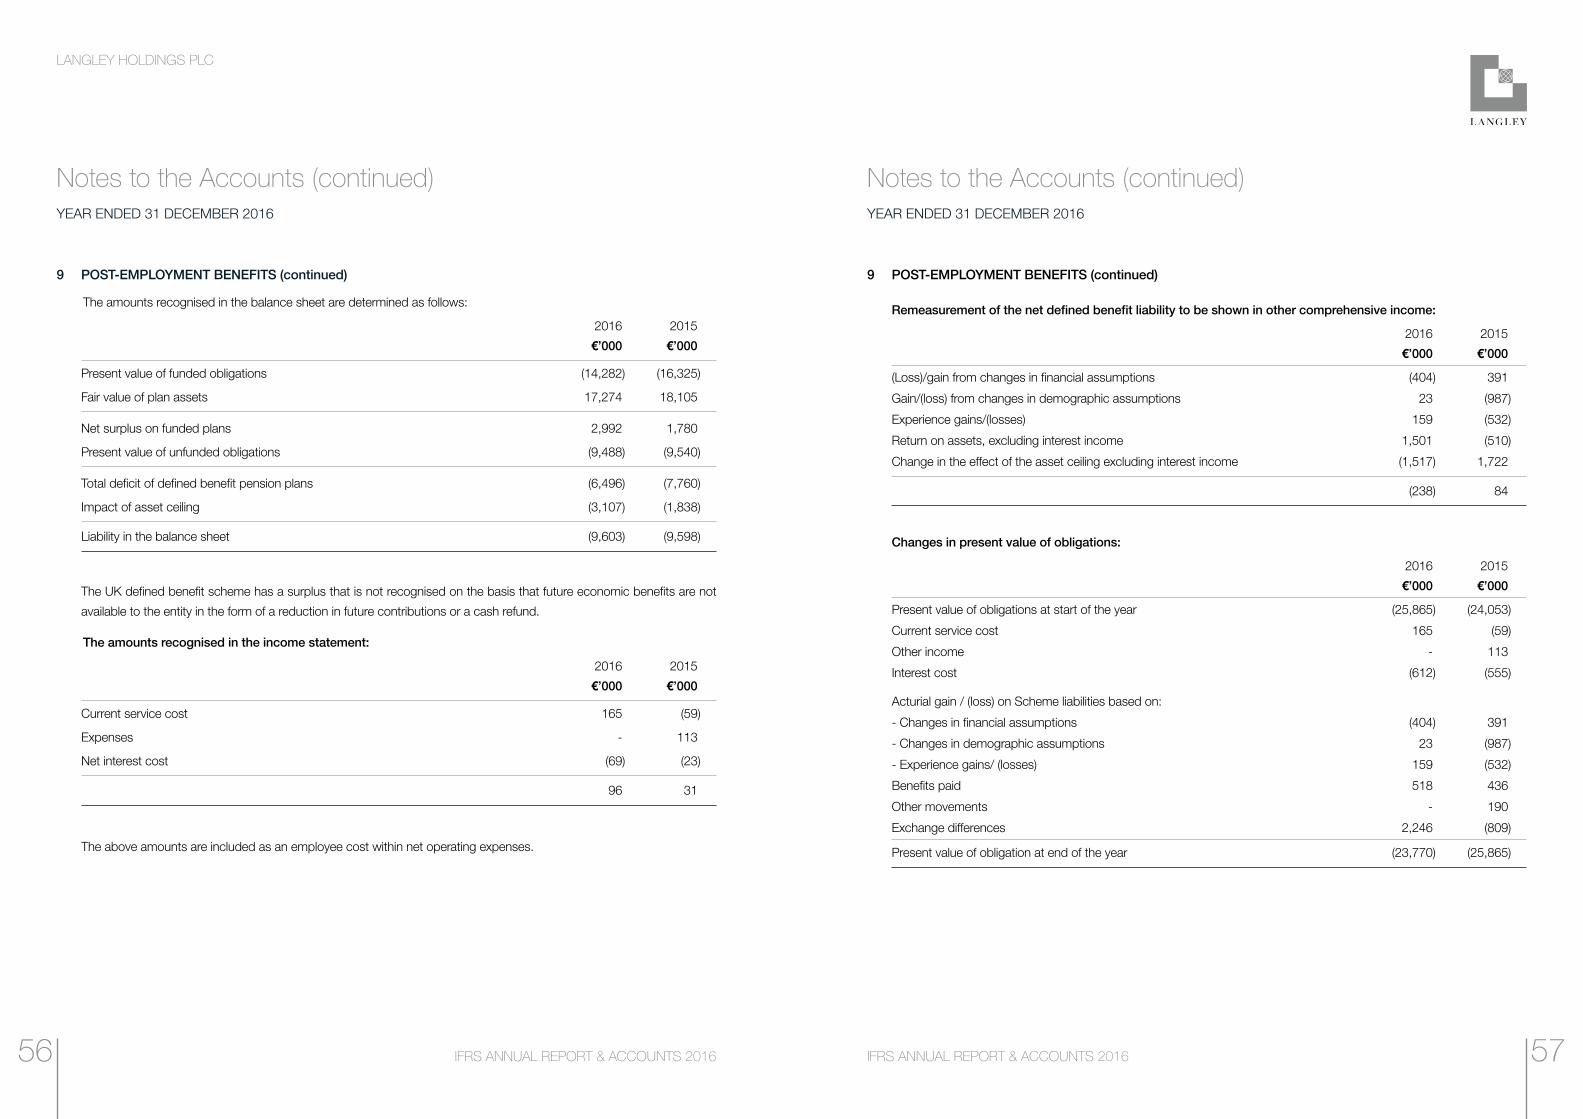
LANGLEY HOLDINGS PLC
IFRS ANNUAL REPORT & ACCOUNTS 2016IFRS ANNUAL REPORT & ACCOUNTS 2016
Notes to the Accounts (continued)YEAR ENDED 31 DECEMBER 2016
Notes to the Accounts (continued)YEAR ENDED 31 DECEMBER 2016
9 POST-EMPLOYMENT BENEFITS (continued)
The amounts recognised in the balance sheet are determined as follows:
2016 2015
€’000 €’000
Present value of funded obligations (14,282) (16,325)
Fair value of plan assets 17,274 18,105
Net surplus on funded plans 2,992 1,780
Present value of unfunded obligations (9,488) (9,540)
Total deficit of defined benefit pension plans (6,496) (7,760)
Impact of asset ceiling (3,107) (1,838)
Liability in the balance sheet (9,603) (9,598)
The UK defined benefit scheme has a surplus that is not recognised on the basis that future economic benefits are not
available to the entity in the form of a reduction in future contributions or a cash refund.
The amounts recognised in the income statement:
2016 2015
€’000 €’000
Current service cost 165 (59)
Expenses - 113
Net interest cost (69) (23)
96 31
The above amounts are included as an employee cost within net operating expenses.
9 POST-EMPLOYMENT BENEFITS (continued)
Remeasurement of the net defined benefit liability to be shown in other comprehensive income:
2016 2015
€’000 €’000
(Loss)/gain from changes in financial assumptions (404) 391
Gain/(loss) from changes in demographic assumptions 23 (987)
Experience gains/(losses) 159 (532)
Return on assets, excluding interest income 1,501 (510)
Change in the effect of the asset ceiling excluding interest income (1,517) 1,722
(238) 84
Changes in present value of obligations:
2016 2015
€’000 €’000
Present value of obligations at start of the year (25,865) (24,053)
Current service cost 165 (59)
Other income - 113
Interest cost (612) (555)
Acturial gain / (loss) on Scheme liabilities based on:
- Changes in financial assumptions (404) 391
- Changes in demographic assumptions 23 (987)
- Experience gains/ (losses) 159 (532)
Benefits paid 518 436
Other movements - 190
Exchange differences 2,246 (809)
Present value of obligation at end of the year (23,770) (25,865)
5756
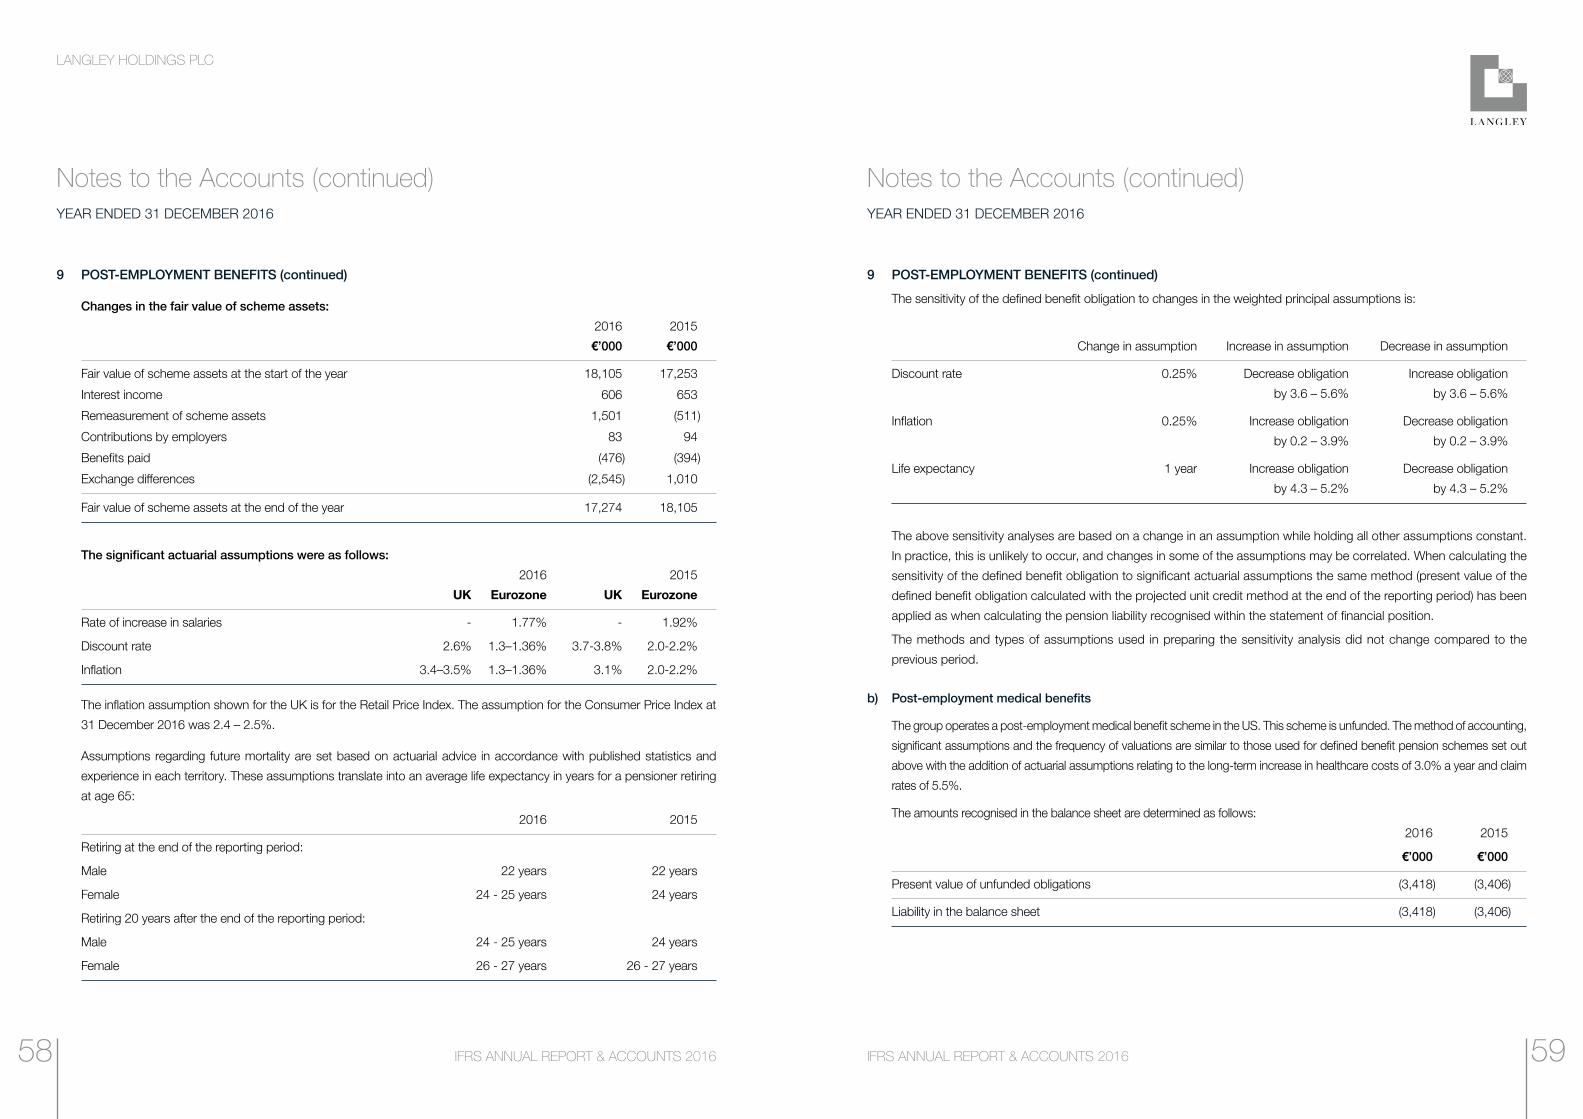
LANGLEY HOLDINGS PLC
IFRS ANNUAL REPORT & ACCOUNTS 2016IFRS ANNUAL REPORT & ACCOUNTS 2016
Notes to the Accounts (continued)YEAR ENDED 31 DECEMBER 2016
Notes to the Accounts (continued)YEAR ENDED 31 DECEMBER 2016
9 POST-EMPLOYMENT BENEFITS (continued)
Changes in the fair value of scheme assets:
2016 2015
€’000 €’000
Fair value of scheme assets at the start of the year 18,105 17,253
Interest income 606 653
Remeasurement of scheme assets 1,501 (511)
Contributions by employers 83 94
Benefits paid (476) (394)
Exchange differences (2,545) 1,010
Fair value of scheme assets at the end of the year 17,274 18,105
The significant actuarial assumptions were as follows:
2016 2015
UK Eurozone UK Eurozone
Rate of increase in salaries - 1.77% - 1.92%
Discount rate 2.6% 1.3–1.36% 3.7-3.8% 2.0-2.2%
Inflation 3.4–3.5% 1.3–1.36% 3.1% 2.0-2.2%
The inflation assumption shown for the UK is for the Retail Price Index. The assumption for the Consumer Price Index at
31 December 2016 was 2.4 – 2.5%.
Assumptions regarding future mortality are set based on actuarial advice in accordance with published statistics and
experience in each territory. These assumptions translate into an average life expectancy in years for a pensioner retiring
at age 65:
2016 2015
Retiring at the end of the reporting period:
Male 22 years 22 years
Female 24 - 25 years 24 years
Retiring 20 years after the end of the reporting period:
Male 24 - 25 years 24 years
Female 26 - 27 years 26 - 27 years
9 POST-EMPLOYMENT BENEFITS (continued)
The sensitivity of the defined benefit obligation to changes in the weighted principal assumptions is:
Change in assumption Increase in assumption Decrease in assumption
Discount rate 0.25% Decrease obligation Increase obligation
by 3.6 – 5.6% by 3.6 – 5.6%
Inflation 0.25% Increase obligation Decrease obligation
by 0.2 – 3.9% by 0.2 – 3.9%
Life expectancy 1 year Increase obligation Decrease obligation
by 4.3 – 5.2% by 4.3 – 5.2%
The above sensitivity analyses are based on a change in an assumption while holding all other assumptions constant.
In practice, this is unlikely to occur, and changes in some of the assumptions may be correlated. When calculating the
sensitivity of the defined benefit obligation to significant actuarial assumptions the same method (present value of the
defined benefit obligation calculated with the projected unit credit method at the end of the reporting period) has been
applied as when calculating the pension liability recognised within the statement of financial position.
The methods and types of assumptions used in preparing the sensitivity analysis did not change compared to the
previous period.
b) Post-employment medical benefits
The group operates a post-employment medical benefit scheme in the US. This scheme is unfunded. The method of accounting,
significant assumptions and the frequency of valuations are similar to those used for defined benefit pension schemes set out
above with the addition of actuarial assumptions relating to the long-term increase in healthcare costs of 3.0% a year and claim
rates of 5.5%.
The amounts recognised in the balance sheet are determined as follows:
2016 2015
€’000 €’000
Present value of unfunded obligations (3,418) (3,406)
Liability in the balance sheet (3,418) (3,406)
5958

LANGLEY HOLDINGS PLC
IFRS ANNUAL REPORT & ACCOUNTS 2016IFRS ANNUAL REPORT & ACCOUNTS 2016
Notes to the Accounts (continued)YEAR ENDED 31 DECEMBER 2016
Notes to the Accounts (continued)YEAR ENDED 31 DECEMBER 2016
9 POST-EMPLOYMENT BENEFITS (continued)
Changes in the present value of defined benefit obligations: 2016 2015
€’000 €’000
Present value of obligation at the start of the year (3,406) (2,853)
The amount recognised in the income statement:
Current service cost (168) (175)
Past service cost 48 -
Interest expense (9) (5)
(129) (180)
Remeasurements of the defined benefit liability to be shown in other comprehensive income:
Loss from change in demographic assumptions (49) -
Loss from change in financial assumptions (74) (157)
(123) (157)
Other movement 40 49
Payments from scheme contributions - benefit payments 312 243
Exchange differences (112) (508)
Present value of obligations at the end of the year (3,418) (3,406)
c) Post-employment benefits (pension and medical)
Schemes’ assets are comprised as follows: 2016 2015 Total % Total %
€’000 €’000
Equity instruments 11,223 65% 11,982 66%
Equities and equity funds 4,655 4,643 Diversified growth fund 6,568 7,339
Debt instruments 5,787 34% 5,714 32%
Government 3,926 3,885 Corporate bonds (investment grade) 1,861 1,829
Property 198 1% 328 2% Cash and cash equivalents 66 - 81 -
Total 17,274 100% 18,105 100%
9 POST-EMPLOYMENT BENEFITS (continued)
Through its defined benefit pension schemes and post-employment medical plans, the Group is exposed to a number of risks, most of which are detailed below:
Asset volatility The schemes’ liabilities are calculated using a discount rate set with reference to corporate bond yields; if scheme assets underperform this yield, this will create a deficit. The UK schemes hold a significant proportion of equity instruments, which are expected to outperform corporate bonds in the long-term while providing volatility and risk in the short-term.
The Group has reduced the level of investment risk by investing in assets that better match the liabilities. This has been done by the purchase of a mixture of government and corporate bonds. The government bonds represent investments in UK government securities only. The corporate bonds are global securities with an emphasis on the UK.
Changes in bond yield A decrease in corporate bond yields will increase scheme liabilities, although this will be partially offset by an increase in the value of the schemes’ bond holdings.
Inflation risk Some of the Group pension obligations are linked to inflation, and higher inflation will lead to higher liabilities (although, in most cases, caps on the level of inflationary increases are in place to protect the schemes against extreme inflation). The majority of the schemes’ assets are either unaffected by (fixed interest bonds) or loosely correlated with (equities) inflation, meaning that an increase in inflation will also increase the deficit.
Life expectancy The majority of the schemes’ obligations are to provide benefits for the life of the member, so increase in life expectancy will result in an increase in the schemes’ liabilities. This is particularly significant in the UK schemes, where inflationary increases result in higher sensitivity to changes in life expectancy.
In case of the Eurozone defined benefit scheme, the Group ensures that the investment positions are managed within an asset-liability matching (ALM) framework that has been developed to achieve long-term investments that are in line with the obligations under the scheme. Within this framework, the Group’s ALM objective is to match assets to the pension obligations by investing in long-term fixed interest securities with maturities that match the benefit payments as they fall due. The UK hybrid scheme currently has no asset-liability matching strategy. The Group has not changed the processes used to manage its risks from previous periods. The Group does not use derivatives to manage its risk. Investments are well diversified, such that the failure of any single investment would not have a material impact on the overall level of assets. A large portion of assets in 2016 consist of equities and bonds, although the Group also invests in property and cash.
The Group has agreed that it will aim to eliminate the deficit in the hybrid scheme over the next 15 years. There is no deficit in the defined benefits scheme. The next triennial valuations are due to be completed as at 5 April 2018 and 31 July 2018 for the defined benefits scheme and hybrid scheme respectively. The Group considers that the contribution rates set at the last valuation date are sufficient to eliminate the deficit over the agreed period.
Expected contributions to post-employment benefit schemes for the year ending 31 December 2017 are €239,030.
The weighted average duration of the defined benefit obligation is 16.4 years.
6160

LANGLEY HOLDINGS PLC
IFRS ANNUAL REPORT & ACCOUNTS 2016IFRS ANNUAL REPORT & ACCOUNTS 2016
10 INCOME TAX EXPENSE
(a) Charge for the year 2016 2015
€’000 €’000
Current income tax:
UK corporation tax at 20% (2015 – 20.25%) 7,686 3,109
Overseas tax 32,317 28,849
Adjustments to prior year UK tax (100) (111)
Adjustments to prior year overseas tax 1,495 (738)
Total current taxation 41,398 31,109
Deferred income tax:
Movement in overseas deferred tax (1,484) (593)
Movement in UK deferred tax 314 336
Total deferred taxation (1,170) (257)
Income tax expense 40,228 30,852
(b) Factors affecting tax expense 2016 2015
€’000 €’000
Profit before taxation 122,730 106,688
Profit before taxation multiplied by the standard rate of tax of 20% (2015 – 20.25%) 24,546 21,604
Expenses not deductible for tax purposes 4,449 733
Income not taxable (285) (1,576)
Timing differences (1,362) (629)
Effect of foreign tax rates 11,726 12,910
Utilisation of losses brought forward (2,652) (3,984)
Deferred tax assets not recognised 1,666 2,124
Exchange adjustment 745 519
Adjustment to tax charge in previous period 1,395 (849)
Tax expense 40,228 30,852
Notes to the Accounts (continued)YEAR ENDED 31 DECEMBER 2016
Notes to the Accounts (continued)YEAR ENDED 31 DECEMBER 2016
10 INCOME TAX EXPENSE (continued)
(c) Factors that may affect future tax charges
The Group had UK tax losses of approximately €1,860,000 at 31 December 2016 (2015 - €1,755,000) available for carry
forward against future trading profits. In addition the Claudius Peters Group had overseas tax losses of approximately
€600,000 at 31 December 2016 (2015 - €548,000), the Manroland Group €139,461,000 (2015 - €139,001,000), the
DruckChemie Group €7,013,000 (2015 - €10,512,000), the Bradman Lake Group €1,793,000 (2015 - €131,000) and
the Active Power Group €1,641,000 (2015 - €nil) available for carry forward against future trading profits of that Group.
(d) Impact of future tax rate changes
Finance Act 2016, which received Royal Assent on 15 September 2016, includes legislation to reduce the main rate of
corporation tax from 20% to 19% from 1 April 2017 and to 17% from 1 April 2020.
11 ACQUISITIONS DURING THE PERIOD
The Active Power Group was acquired on 18 November 2016 by Piller Inc, a company in which Langley Holdings PLC
indirectly holds 100% of the share capital.
On this date, Piller Inc purchased the trade and substantially all of the assets and liabilities of Active Power Inc. The
holdings in other Active Power companies listed in note 14 were acquired indirectly through this transaction.
The Active Power Group specialises in the development, manufacture and supply of flywheel energy and power technology.
Further details of the group’s investments are provided in note 14.
The acquisition of the Active Power Group enables the Group to provide complementary goods and services to the
Group’s existing offering in uninterruptable power supplies.
6362
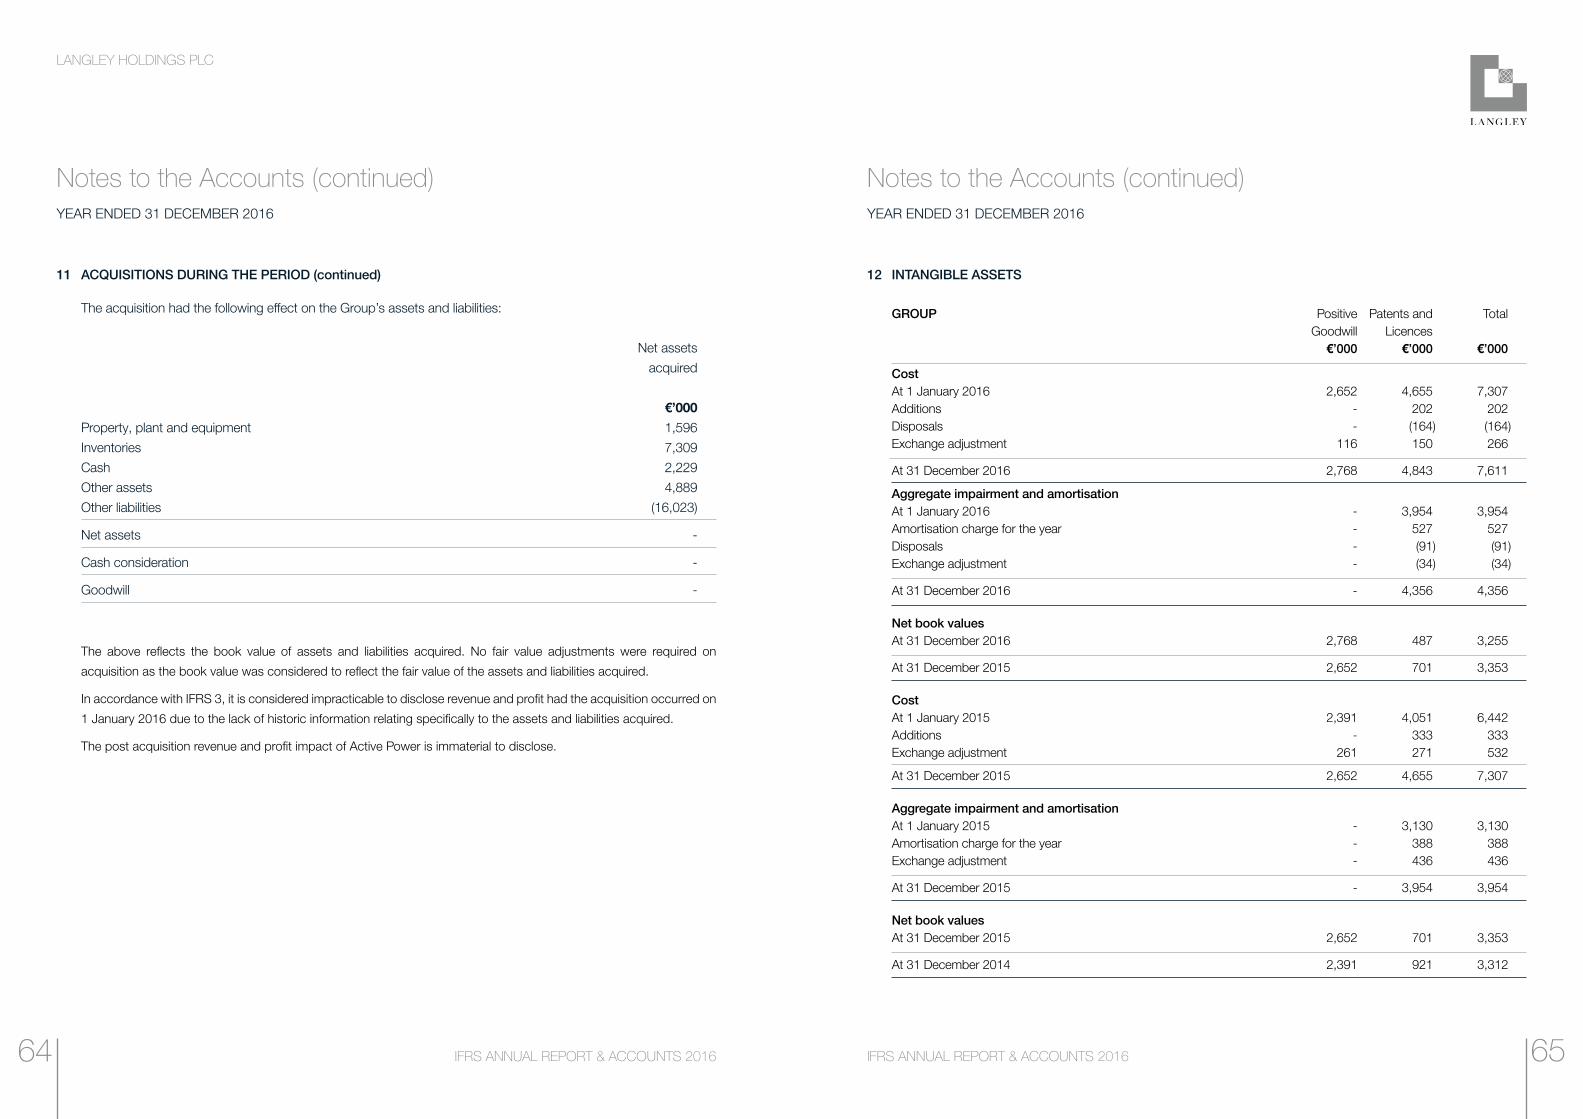
LANGLEY HOLDINGS PLC
IFRS ANNUAL REPORT & ACCOUNTS 2016IFRS ANNUAL REPORT & ACCOUNTS 2016
Notes to the Accounts (continued)YEAR ENDED 31 DECEMBER 2016
Notes to the Accounts (continued)YEAR ENDED 31 DECEMBER 2016
11 ACQUISITIONS DURING THE PERIOD (continued)
The acquisition had the following effect on the Group’s assets and liabilities:
Net assets acquired
€’000 Property, plant and equipment 1,596 Inventories 7,309 Cash 2,229 Other assets 4,889 Other liabilities (16,023)
Net assets -
Cash consideration -
Goodwill -
The above reflects the book value of assets and liabilities acquired. No fair value adjustments were required on
acquisition as the book value was considered to reflect the fair value of the assets and liabilities acquired.
In accordance with IFRS 3, it is considered impracticable to disclose revenue and profit had the acquisition occurred on
1 January 2016 due to the lack of historic information relating specifically to the assets and liabilities acquired.
The post acquisition revenue and profit impact of Active Power is immaterial to disclose.
12 INTANGIBLE ASSETS
GROUP Positive Patents and Total Goodwill Licences
€’000 €’000 €’000
Cost At 1 January 2016 2,652 4,655 7,307 Additions - 202 202 Disposals - (164) (164) Exchange adjustment 116 150 266
At 31 December 2016 2,768 4,843 7,611
Aggregate impairment and amortisation At 1 January 2016 - 3,954 3,954 Amortisation charge for the year - 527 527 Disposals - (91) (91)
Exchange adjustment - (34) (34)
At 31 December 2016 - 4,356 4,356
Net book values At 31 December 2016 2,768 487 3,255
At 31 December 2015 2,652 701 3,353
Cost At 1 January 2015 2,391 4,051 6,442 Additions - 333 333
Exchange adjustment 261 271 532
At 31 December 2015 2,652 4,655 7,307
Aggregate impairment and amortisation At 1 January 2015 - 3,130 3,130 Amortisation charge for the year - 388 388
Exchange adjustment - 436 436
At 31 December 2015 - 3,954 3,954
Net book values At 31 December 2015 2,652 701 3,353
At 31 December 2014 2,391 921 3,312
6564
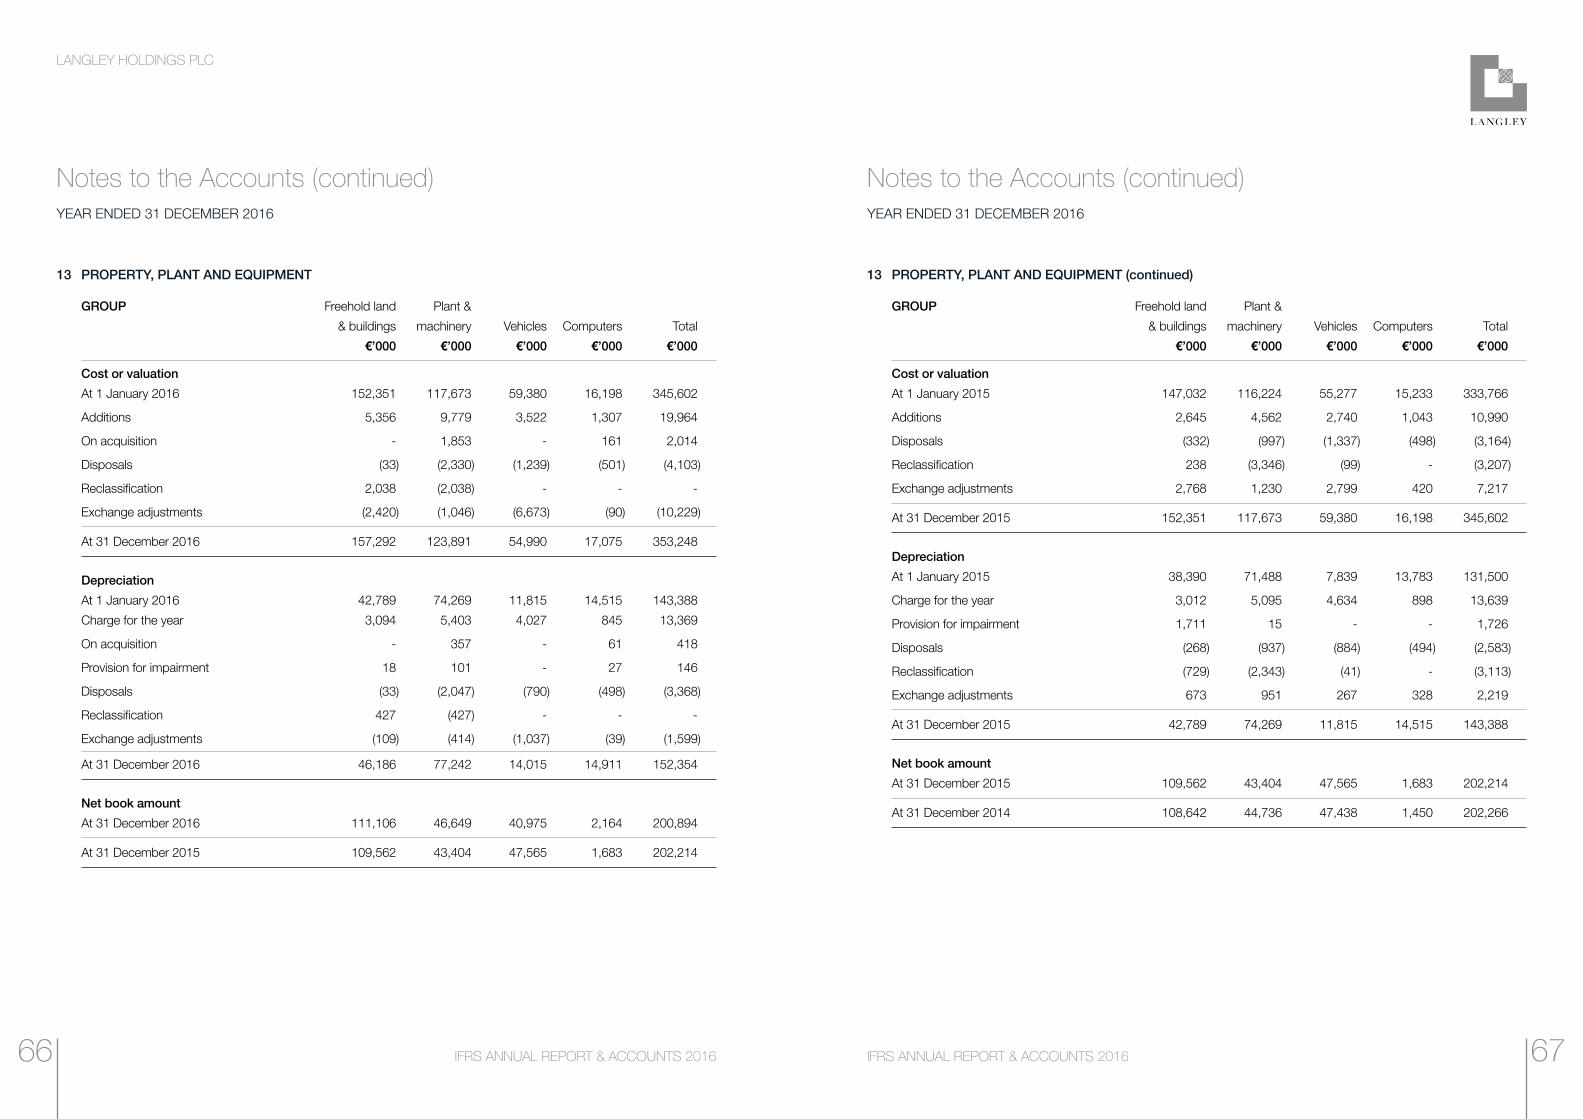
LANGLEY HOLDINGS PLC
IFRS ANNUAL REPORT & ACCOUNTS 2016IFRS ANNUAL REPORT & ACCOUNTS 2016
Notes to the Accounts (continued)YEAR ENDED 31 DECEMBER 2016
Notes to the Accounts (continued)YEAR ENDED 31 DECEMBER 2016
13 PROPERTY, PLANT AND EQUIPMENT
GROUP Freehold land Plant &
& buildings machinery Vehicles Computers Total
€’000 €’000 €’000 €’000 €’000
Cost or valuation
At 1 January 2016 152,351 117,673 59,380 16,198 345,602
Additions 5,356 9,779 3,522 1,307 19,964
On acquisition - 1,853 - 161 2,014
Disposals (33) (2,330) (1,239) (501) (4,103)
Reclassification 2,038 (2,038) - - -
Exchange adjustments (2,420) (1,046) (6,673) (90) (10,229)
At 31 December 2016 157,292 123,891 54,990 17,075 353,248
Depreciation
At 1 January 2016 42,789 74,269 11,815 14,515 143,388
Charge for the year 3,094 5,403 4,027 845 13,369
On acquisition - 357 - 61 418
Provision for impairment 18 101 - 27 146
Disposals (33) (2,047) (790) (498) (3,368)
Reclassification 427 (427) - - -
Exchange adjustments (109) (414) (1,037) (39) (1,599)
At 31 December 2016 46,186 77,242 14,015 14,911 152,354
Net book amount
At 31 December 2016 111,106 46,649 40,975 2,164 200,894
At 31 December 2015 109,562 43,404 47,565 1,683 202,214
13 PROPERTY, PLANT AND EQUIPMENT (continued)
GROUP Freehold land Plant &
& buildings machinery Vehicles Computers Total
€’000 €’000 €’000 €’000 €’000
Cost or valuation
At 1 January 2015 147,032 116,224 55,277 15,233 333,766
Additions 2,645 4,562 2,740 1,043 10,990
Disposals (332) (997) (1,337) (498) (3,164)
Reclassification 238 (3,346) (99) - (3,207)
Exchange adjustments 2,768 1,230 2,799 420 7,217
At 31 December 2015 152,351 117,673 59,380 16,198 345,602
Depreciation
At 1 January 2015 38,390 71,488 7,839 13,783 131,500
Charge for the year 3,012 5,095 4,634 898 13,639
Provision for impairment 1,711 15 - - 1,726
Disposals (268) (937) (884) (494) (2,583)
Reclassification (729) (2,343) (41) - (3,113)
Exchange adjustments 673 951 267 328 2,219
At 31 December 2015 42,789 74,269 11,815 14,515 143,388
Net book amount
At 31 December 2015 109,562 43,404 47,565 1,683 202,214
At 31 December 2014 108,642 44,736 47,438 1,450 202,266
6766

LANGLEY HOLDINGS PLC
IFRS ANNUAL REPORT & ACCOUNTS 2016IFRS ANNUAL REPORT & ACCOUNTS 2016
Notes to the Accounts (continued)YEAR ENDED 31 DECEMBER 2016
Notes to the Accounts (continued)YEAR ENDED 31 DECEMBER 2016
13 PROPERTY, PLANT AND EQUIPMENT (continued)
COMPANY Freehold land Plant &
& buildings machinery Vehicles Computers Total
€’000 €’000 €’000 €’000 €’000
Cost or valuation
At 1 January 2016 23,175 2,769 2,486 500 28,930
Additions 3,638 4,761 330 9 8,738
Disposals - - (220) - (220)
Exchange adjustments (3,311) (558) (345) (68) (4,282)
At 31 December 2016 23,502 6,972 2,251 441 33,166
Depreciation
At 1 January 2016 1,311 2,005 1,827 440 5,583
Disposals - - (219) - (219)
Charge for the year 687 366 303 41 1,397
Exchange adjustments (205) (288) (254) (63) (810)
At 31 December 2016 1,793 2,083 1,657 418 5,951
Net book amount
At 31 December 2016 21,709 4,889 594 23 27,215
At 31 December 2015 21,864 764 659 60 23,347
13 PROPERTY, PLANT AND EQUIPMENT (continued)
COMPANY Freehold land Plant &
& buildings machinery Vehicles Computers Total
€’000 €’000 €’000 €’000 €’000
Cost or valuation
At 1 January 2015 19,882 2,503 2,496 467 25,348
Additions 2,171 129 182 5 2,487
Disposals - (7) (341) - (348)
Exchange adjustments 1,122 144 149 28 1,443
At 31 December 2015 23,175 2,769 2,486 500 28,930
Depreciation
At 1 January 2015 596 1,755 1,473 367 4,191
Disposals - (7) (165) - (172)
Charge for the year 693 156 438 52 1,339
Exchange adjustments 22 101 81 21 225
At 31 December 2015 1,311 2,005 1,827 440 5,583
Net book amount
At 31 December 2015 21,864 764 659 60 23,347
At 31 December 2014 19,286 748 1,023 100 21,157
6968
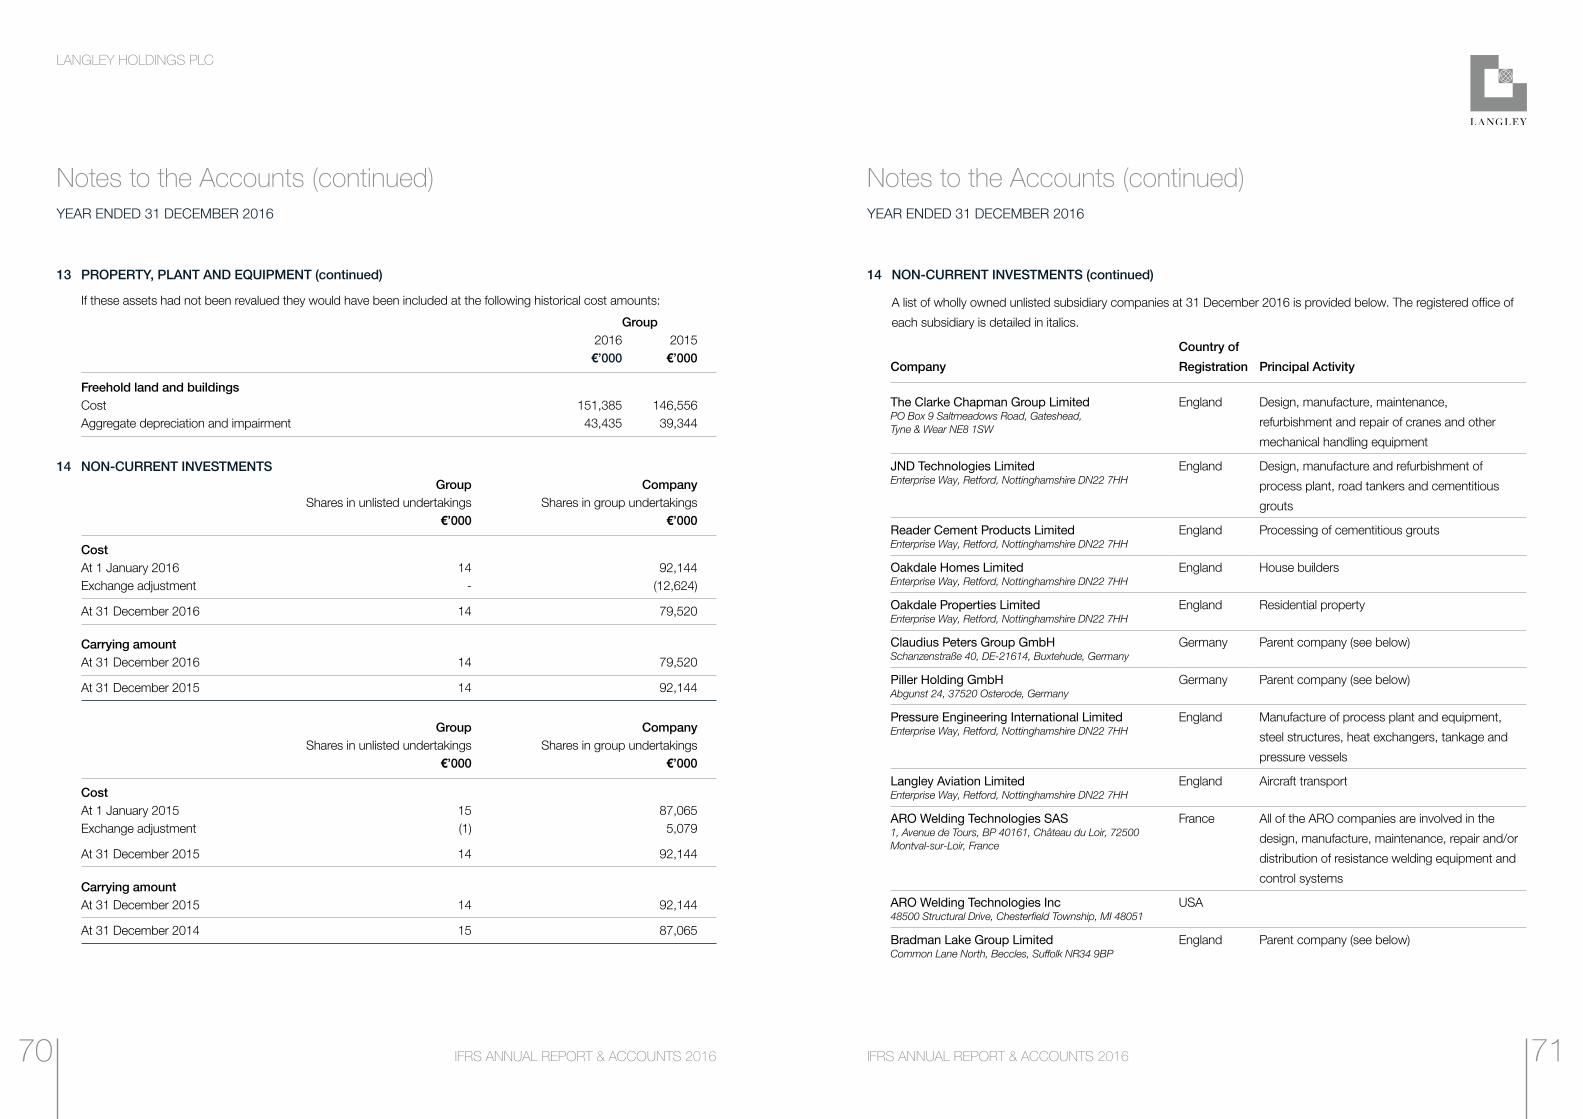
LANGLEY HOLDINGS PLC
IFRS ANNUAL REPORT & ACCOUNTS 2016IFRS ANNUAL REPORT & ACCOUNTS 2016
Notes to the Accounts (continued)YEAR ENDED 31 DECEMBER 2016
Notes to the Accounts (continued)YEAR ENDED 31 DECEMBER 2016
13 PROPERTY, PLANT AND EQUIPMENT (continued)
If these assets had not been revalued they would have been included at the following historical cost amounts:
Group 2016 2015 €’000 €’000
Freehold land and buildings Cost 151,385 146,556 Aggregate depreciation and impairment 43,435 39,344
14 NON-CURRENT INVESTMENTS Group Company Shares in unlisted undertakings Shares in group undertakings €’000 €’000
Cost At 1 January 2016 14 92,144
Exchange adjustment - (12,624)
At 31 December 2016 14 79,520
Carrying amount At 31 December 2016 14 79,520
At 31 December 2015 14 92,144
Group Company Shares in unlisted undertakings Shares in group undertakings €’000 €’000
Cost At 1 January 2015 15 87,065
Exchange adjustment (1) 5,079
At 31 December 2015 14 92,144
Carrying amount At 31 December 2015 14 92,144
At 31 December 2014 15 87,065
14 NON-CURRENT INVESTMENTS (continued)
A list of wholly owned unlisted subsidiary companies at 31 December 2016 is provided below. The registered office of
each subsidiary is detailed in italics.
Company
Country of
Registration Principal Activity
The Clarke Chapman Group Limited PO Box 9 Saltmeadows Road, Gateshead, Tyne & Wear NE8 1SW
England Design, manufacture, maintenance,
refurbishment and repair of cranes and other
mechanical handling equipment
JND Technologies Limited Enterprise Way, Retford, Nottinghamshire DN22 7HH
England Design, manufacture and refurbishment of
process plant, road tankers and cementitious
grouts
Reader Cement Products Limited Enterprise Way, Retford, Nottinghamshire DN22 7HH
England Processing of cementitious grouts
Oakdale Homes Limited Enterprise Way, Retford, Nottinghamshire DN22 7HH
England House builders
Oakdale Properties Limited Enterprise Way, Retford, Nottinghamshire DN22 7HH
England Residential property
Claudius Peters Group GmbH Schanzenstraße 40, DE-21614, Buxtehude, Germany
Germany Parent company (see below)
Piller Holding GmbH Abgunst 24, 37520 Osterode, Germany
Germany Parent company (see below)
Pressure Engineering International Limited Enterprise Way, Retford, Nottinghamshire DN22 7HH
England Manufacture of process plant and equipment,
steel structures, heat exchangers, tankage and
pressure vessels
Langley Aviation Limited Enterprise Way, Retford, Nottinghamshire DN22 7HH
England Aircraft transport
ARO Welding Technologies SAS 1, Avenue de Tours, BP 40161, Château du Loir, 72500 Montval-sur-Loir, France
France All of the ARO companies are involved in the
design, manufacture, maintenance, repair and/or
distribution of resistance welding equipment and
control systems
ARO Welding Technologies Inc 48500 Structural Drive, Chesterfield Township, MI 48051
USA
Bradman Lake Group Limited Common Lane North, Beccles, Suffolk NR34 9BP
England Parent company (see below)
7170

LANGLEY HOLDINGS PLC
IFRS ANNUAL REPORT & ACCOUNTS 2016IFRS ANNUAL REPORT & ACCOUNTS 2016
Notes to the Accounts (continued)YEAR ENDED 31 DECEMBER 2016
Notes to the Accounts (continued)YEAR ENDED 31 DECEMBER 2016
Company
Country of
Registration Principal Activity
Retford Investments LLC 3050 Southcross Blvd Rock Hill, SC 29730
USA Holder of real estate for other group companies
CPVA GmbH Muehlheimer Strasse 341, 63075 Offenbach am Main
Germany Property rental
Sheetfed Holdings Limited Enterprise Way, Retford, Nottinghamshire DN22 7HH
England Parent company (see below)
Mikenboard Limited England Dormant subsidiary
H Q Engineers Limited England Dormant subsidiary
JND Wefco Limited All of the above: Enterprise Way, Retford, Nottinghamshire DN22 7HH
England Dormant subsidiary
Sail Cruising Limited 13 Church Street, St Johns, Antigua
Antigua Dormant subsidiary
Company
Country of
Registration Principal Activity
ARO Welding Technologies AB AB Timotejvägen, 7 439 71, Fjärås
Sweden All of the companies are involved in the design,
manufacture, maintenance, repair and/or
distribution of resistance welding equipment and
control systems.
ARO Welding Technologies SA de CV 43B Sur 4720 Estrella del Sur C.P. 72190 Puebla, Pue
Mexico
ARO Welding Technologies SAU C/ Cuzco, 26-28, nave 2 08030 Barcelona
Spain
ARO Welding Technologies Limited Unit 15, Planetary Industrial Estate, Planetary Road, Willenhall, Wolverhampton, WV13 3XA
England
ARO Welding Technologies SA-NV Koningin Astridlaan 61, 1780 Wemmel
Belgium
ARO Welding Technologies s.r.o Karloveská 63 84104 Bratislava
Slovakia
ARO Welding Technologies GmbH Senefelderstraße 4 86368 Gersthofen
Germany
ARO Welding Technologies (Wuhan) Ltd M Building - West District, MinYing Industry Park, 81 CheChengNan Road, Economic & Technology Developing Zone 430056 WUHAN
China
ARO Welding Technologias Ltda. Rua das Figueiras 474 – 3° andar Bairro Jardim, 09080-300 – Santo André SP São Paulo
Brazil
14 NON-CURRENT INVESTMENTS (continued) 14 NON-CURRENT INVESTMENTS (continued)
The following companies are wholly owned unlisted subsidiaries of ARO Welding Technologies SAS,
at 31 December 2016:
7372
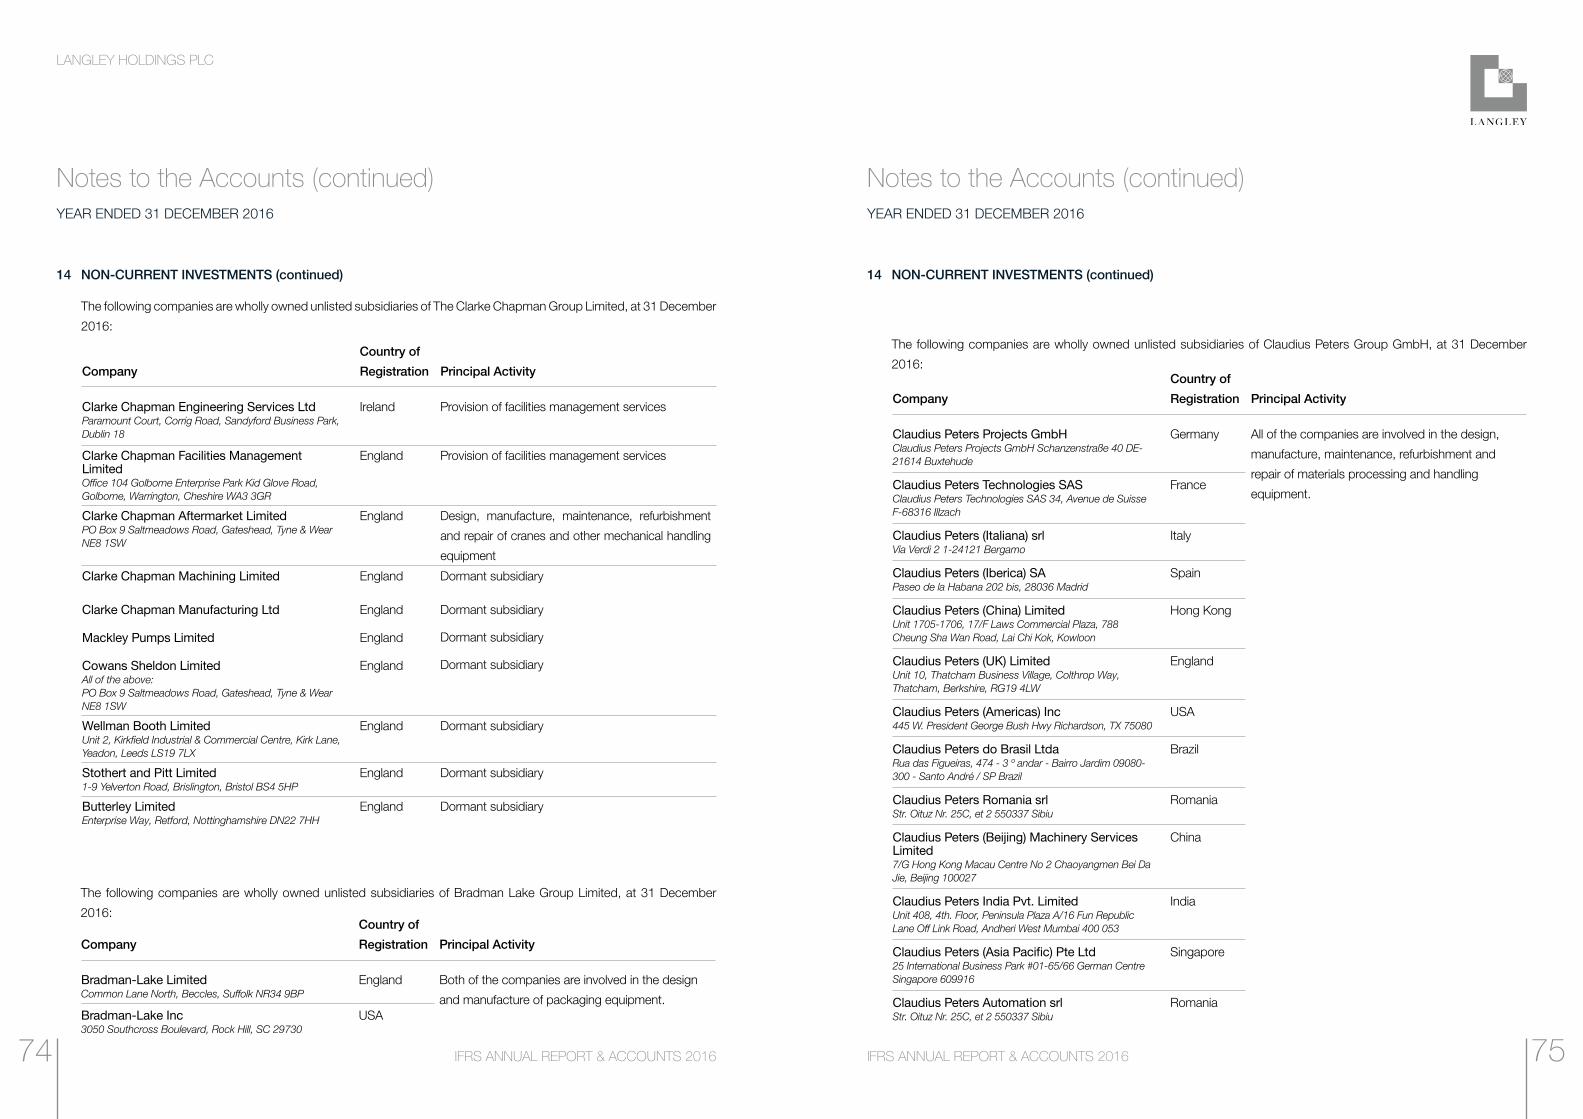
LANGLEY HOLDINGS PLC
IFRS ANNUAL REPORT & ACCOUNTS 2016IFRS ANNUAL REPORT & ACCOUNTS 2016
Notes to the Accounts (continued)YEAR ENDED 31 DECEMBER 2016
Notes to the Accounts (continued)YEAR ENDED 31 DECEMBER 2016
14 NON-CURRENT INVESTMENTS (continued)
The following companies are wholly owned unlisted subsidiaries of The Clarke Chapman Group Limited, at 31 December
2016:
14 NON-CURRENT INVESTMENTS (continued)
The following companies are wholly owned unlisted subsidiaries of Claudius Peters Group GmbH, at 31 December
2016:Company
Country of
Registration Principal Activity
Clarke Chapman Engineering Services Ltd Paramount Court, Corrig Road, Sandyford Business Park, Dublin 18
Ireland Provision of facilities management services
Clarke Chapman Facilities Management Limited Office 104 Golborne Enterprise Park Kid Glove Road, Golborne, Warrington, Cheshire WA3 3GR
England Provision of facilities management services
Clarke Chapman Aftermarket Limited PO Box 9 Saltmeadows Road, Gateshead, Tyne & Wear NE8 1SW
England Design, manufacture, maintenance, refurbishment
and repair of cranes and other mechanical handling
equipment
Clarke Chapman Machining Limited England Dormant subsidiary
Clarke Chapman Manufacturing Ltd England Dormant subsidiary
Dormant subsidiary
Dormant subsidiary
Mackley Pumps Limited England
Cowans Sheldon LimitedAll of the above: PO Box 9 Saltmeadows Road, Gateshead, Tyne & Wear NE8 1SW
England
Wellman Booth Limited Unit 2, Kirkfield Industrial & Commercial Centre, Kirk Lane, Yeadon, Leeds LS19 7LX
England Dormant subsidiary
Stothert and Pitt Limited 1-9 Yelverton Road, Brislington, Bristol BS4 5HP
England Dormant subsidiary
Butterley Limited Enterprise Way, Retford, Nottinghamshire DN22 7HH
England Dormant subsidiary
Company
Country of
Registration Principal Activity
Bradman-Lake Limited Common Lane North, Beccles, Suffolk NR34 9BP
England Both of the companies are involved in the design
and manufacture of packaging equipment.Bradman-Lake Inc 3050 Southcross Boulevard, Rock Hill, SC 29730
USA
Company
Country of
Registration Principal Activity
Claudius Peters Projects GmbH Claudius Peters Projects GmbH Schanzenstraße 40 DE-21614 Buxtehude
Germany All of the companies are involved in the design,
manufacture, maintenance, refurbishment and
repair of materials processing and handling
equipment.Claudius Peters Technologies SAS Claudius Peters Technologies SAS 34, Avenue de SuisseF-68316 Illzach
France
Claudius Peters (Italiana) srl Via Verdi 2 1-24121 Bergamo
Italy
Claudius Peters (Iberica) SA Paseo de la Habana 202 bis, 28036 Madrid
Spain
Claudius Peters (China) Limited Unit 1705-1706, 17/F Laws Commercial Plaza, 788 Cheung Sha Wan Road, Lai Chi Kok, Kowloon
Hong Kong
Claudius Peters (UK) Limited Unit 10, Thatcham Business Village, Colthrop Way, Thatcham, Berkshire, RG19 4LW
England
Claudius Peters (Americas) Inc 445 W. President George Bush Hwy Richardson, TX 75080
USA
Claudius Peters do Brasil Ltda Rua das Figueiras, 474 - 3 º andar - Bairro Jardim 09080-300 - Santo André / SP Brazil
Brazil
Claudius Peters Romania srl Str. Oituz Nr. 25C, et 2 550337 Sibiu
Romania
Claudius Peters (Beijing) Machinery Services Limited 7/G Hong Kong Macau Centre No 2 Chaoyangmen Bei Da Jie, Beijing 100027
China
Claudius Peters India Pvt. Limited Unit 408, 4th. Floor, Peninsula Plaza A/16 Fun Republic Lane Off Link Road, Andheri West Mumbai 400 053
India
Claudius Peters (Asia Pacific) Pte Ltd 25 International Business Park #01-65/66 German Centre Singapore 609916
Singapore
Claudius Peters Automation srl Str. Oituz Nr. 25C, et 2 550337 Sibiu
Romania
The following companies are wholly owned unlisted subsidiaries of Bradman Lake Group Limited, at 31 December
2016:
7574

LANGLEY HOLDINGS PLC
IFRS ANNUAL REPORT & ACCOUNTS 2016IFRS ANNUAL REPORT & ACCOUNTS 2016
Notes to the Accounts (continued)YEAR ENDED 31 DECEMBER 2016
Notes to the Accounts (continued)YEAR ENDED 31 DECEMBER 2016
14 NON-CURRENT INVESTMENTS (continued)
The following company is a wholly owned unlisted subsidiary of Piller Holding GmbH, at 31 December 2016:
14 NON-CURRENT INVESTMENTS (continued)
The following companies are wholly owned unlisted subsidiaries of Piller Group GmbH and its subsidiaries at 31
December 2016:
Company
Country of
Registration Principal Activity
Piller Australia Pty Limited 2/3 Salisbury Road, Castle Hill, NSW 2154 Sydney
Australia All of the companies are involved in producing
electrical machinery, specialising in high capacity
uninterruptible power supply (UPS) systems.
The Group is also involved in the production of
converters for aircraft ground power and naval
military applications.
Piller France SAS 1 Avenue du Président Pompidou CS 70073 – BAT A F-92508 Rueil-Malmaison cedex
France
Piller USA Inc 45 Wes Warren Drive, Middletown, New York 10941-2047 USA
USA
Piller UK Limited Westgate, Phoenix Way, Cirencester, GloucestershireGL7 1RY
England
Piller Italia Srl Centro Direzionale Colleoni Palazzo Pegaso 3 Viale Colleoni 25 20864 Agrate Brianza (MB)
Italy
Piller Iberica SL U, Paseo de la Habana, 202 Bis Bj E-28036 Madrid
Spain
Piller Power Singapore Pte. Limited 25 International Business Park #01-65/66 German Centre Singapore 609916
Singapore
Piller Germany GmbH & Co KG Abgunst 24 37520 Osterode
Germany
Piller Management GmbH Abgunst 24 37520 Osterode
Germany
Company
Country of
Registration Principal Activity
Endurance Power Protection Pvt Ltd B-4, 2nd Floor, Plot No. 422, Nav Bhavana Premises, Co-op Society Ltd, S V Savarkar Marg, Prabhadevi Mumbai, Maharashtra India 400025
India
Active Power Beijing Rm 506-7, Tower A, COFCO Plaza, 8 Jianguomen Nei Ave, Beijing, China
China
Active Power HongKong (Holding) A95, Unit A, s/F, Hung To Centre, 94-96 How Ming Street, Kwun Tong, Kowloon
Hong Kong
Active Power Swiss (Holding) Schöneich 1,6265 Roggliswil
Switzerland
Active Power Germany An der Leege 22, 37520 Osterode am Harz, Osterode
Germany
Active Power UK Ltd. Unit 1.2, Lauriston Business Park, Pitchill, Evesham, Worcestershire WR11 8SN
England
Company
Country of
Registration Principal Activity
Piller Group GmbH Abgunst 24 37520 Osterode Germany
Germany See below
7776
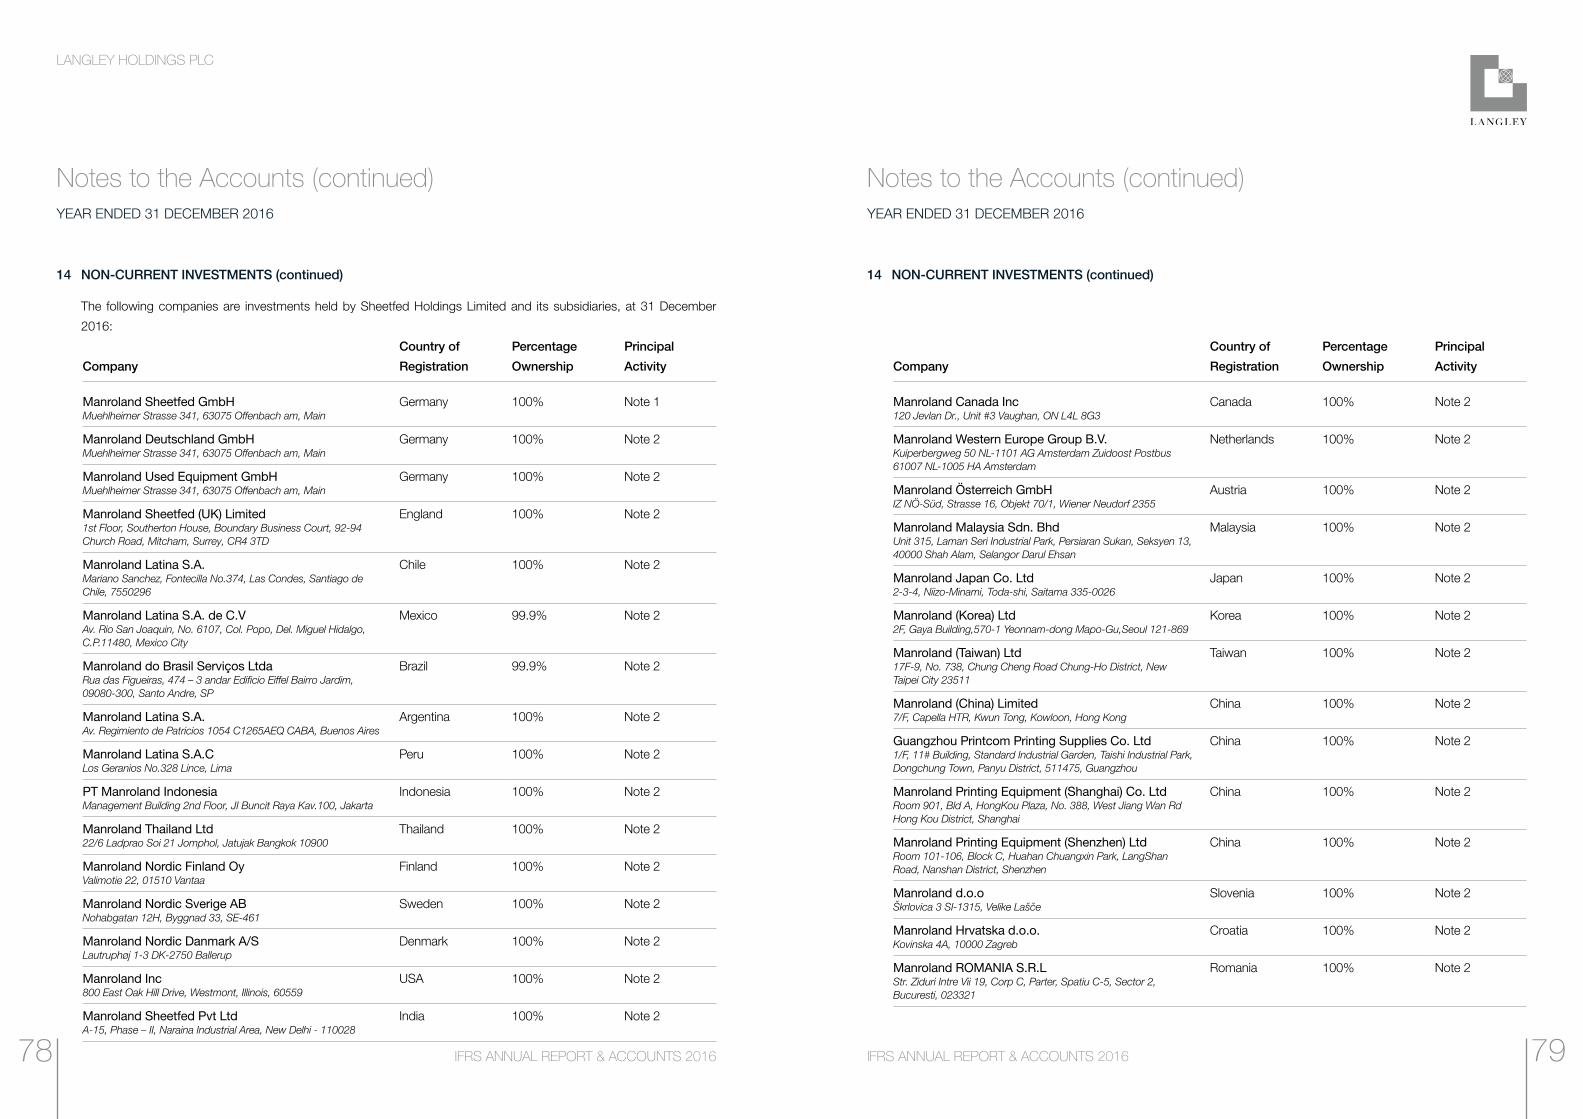
LANGLEY HOLDINGS PLC
IFRS ANNUAL REPORT & ACCOUNTS 2016IFRS ANNUAL REPORT & ACCOUNTS 2016
Notes to the Accounts (continued)YEAR ENDED 31 DECEMBER 2016
Notes to the Accounts (continued)YEAR ENDED 31 DECEMBER 2016
14 NON-CURRENT INVESTMENTS (continued)
The following companies are investments held by Sheetfed Holdings Limited and its subsidiaries, at 31 December
2016:
14 NON-CURRENT INVESTMENTS (continued)
Company
Country of
Registration
Percentage
Ownership
Principal
Activity
Manroland Sheetfed GmbH Muehlheimer Strasse 341, 63075 Offenbach am, Main
Germany 100% Note 1
Manroland Deutschland GmbH Muehlheimer Strasse 341, 63075 Offenbach am, Main
Germany 100% Note 2
Manroland Used Equipment GmbH Muehlheimer Strasse 341, 63075 Offenbach am, Main
Germany 100% Note 2
Manroland Sheetfed (UK) Limited 1st Floor, Southerton House, Boundary Business Court, 92-94 Church Road, Mitcham, Surrey, CR4 3TD
England 100% Note 2
Manroland Latina S.A. Mariano Sanchez, Fontecilla No.374, Las Condes, Santiago de Chile, 7550296
Chile 100% Note 2
Manroland Latina S.A. de C.V Av. Rio San Joaquin, No. 6107, Col. Popo, Del. Miguel Hidalgo, C.P.11480, Mexico City
Mexico 99.9% Note 2
Manroland do Brasil Serviços Ltda Rua das Figueiras, 474 – 3 andar Edificio Eiffel Bairro Jardim, 09080-300, Santo Andre, SP
Brazil 99.9% Note 2
Manroland Latina S.A. Av. Regimiento de Patricios 1054 C1265AEQ CABA, Buenos Aires
Argentina 100% Note 2
Manroland Latina S.A.C Los Geranios No.328 Lince, Lima
Peru 100% Note 2
PT Manroland Indonesia Management Building 2nd Floor, JI Buncit Raya Kav.100, Jakarta
Indonesia 100% Note 2
Manroland Thailand Ltd 22/6 Ladprao Soi 21 Jomphol, Jatujak Bangkok 10900
Thailand 100% Note 2
Manroland Nordic Finland Oy Valimotie 22, 01510 Vantaa
Finland 100% Note 2
Manroland Nordic Sverige AB Nohabgatan 12H, Byggnad 33, SE-461
Sweden 100% Note 2
Manroland Nordic Danmark A/S Lautruphøj 1-3 DK-2750 Ballerup
Denmark 100% Note 2
Manroland Inc 800 East Oak Hill Drive, Westmont, Illinois, 60559
USA 100% Note 2
Manroland Sheetfed Pvt Ltd A-15, Phase – II, Naraina Industrial Area, New Delhi - 110028
India 100% Note 2
Company
Country of
Registration
Percentage
Ownership
Principal
Activity
Manroland Canada Inc 120 Jevlan Dr., Unit #3 Vaughan, ON L4L 8G3
Canada 100% Note 2
Manroland Western Europe Group B.V. Kuiperbergweg 50 NL-1101 AG Amsterdam Zuidoost Postbus 61007 NL-1005 HA Amsterdam
Netherlands 100% Note 2
Manroland Österreich GmbH IZ NÖ-Süd, Strasse 16, Objekt 70/1, Wiener Neudorf 2355
Austria 100% Note 2
Manroland Malaysia Sdn. Bhd Unit 315, Laman Seri Industrial Park, Persiaran Sukan, Seksyen 13, 40000 Shah Alam, Selangor Darul Ehsan
Malaysia 100% Note 2
Manroland Japan Co. Ltd 2-3-4, Niizo-Minami, Toda-shi, Saitama 335-0026
Japan 100% Note 2
Manroland (Korea) Ltd 2F, Gaya Building,570-1 Yeonnam-dong Mapo-Gu,Seoul 121-869
Korea 100% Note 2
Manroland (Taiwan) Ltd 17F-9, No. 738, Chung Cheng Road Chung-Ho District, New Taipei City 23511
Taiwan 100% Note 2
Manroland (China) Limited 7/F, Capella HTR, Kwun Tong, Kowloon, Hong Kong
China 100% Note 2
Guangzhou Printcom Printing Supplies Co. Ltd 1/F, 11# Building, Standard Industrial Garden, Taishi Industrial Park, Dongchung Town, Panyu District, 511475, Guangzhou
China 100% Note 2
Manroland Printing Equipment (Shanghai) Co. Ltd Room 901, Bld A, HongKou Plaza, No. 388, West Jiang Wan Rd Hong Kou District, Shanghai
China 100% Note 2
Manroland Printing Equipment (Shenzhen) Ltd Room 101-106, Block C, Huahan Chuangxin Park, LangShan Road, Nanshan District, Shenzhen
China 100% Note 2
Manroland d.o.o Škrlovica 3 SI-1315, Velike Lašče
Slovenia 100% Note 2
Manroland Hrvatska d.o.o. Kovinska 4A, 10000 Zagreb
Croatia 100% Note 2
Manroland ROMANIA S.R.L Str. Ziduri Intre Vii 19, Corp C, Parter, Spatiu C-5, Sector 2, Bucuresti, 023321
Romania 100% Note 2
7978
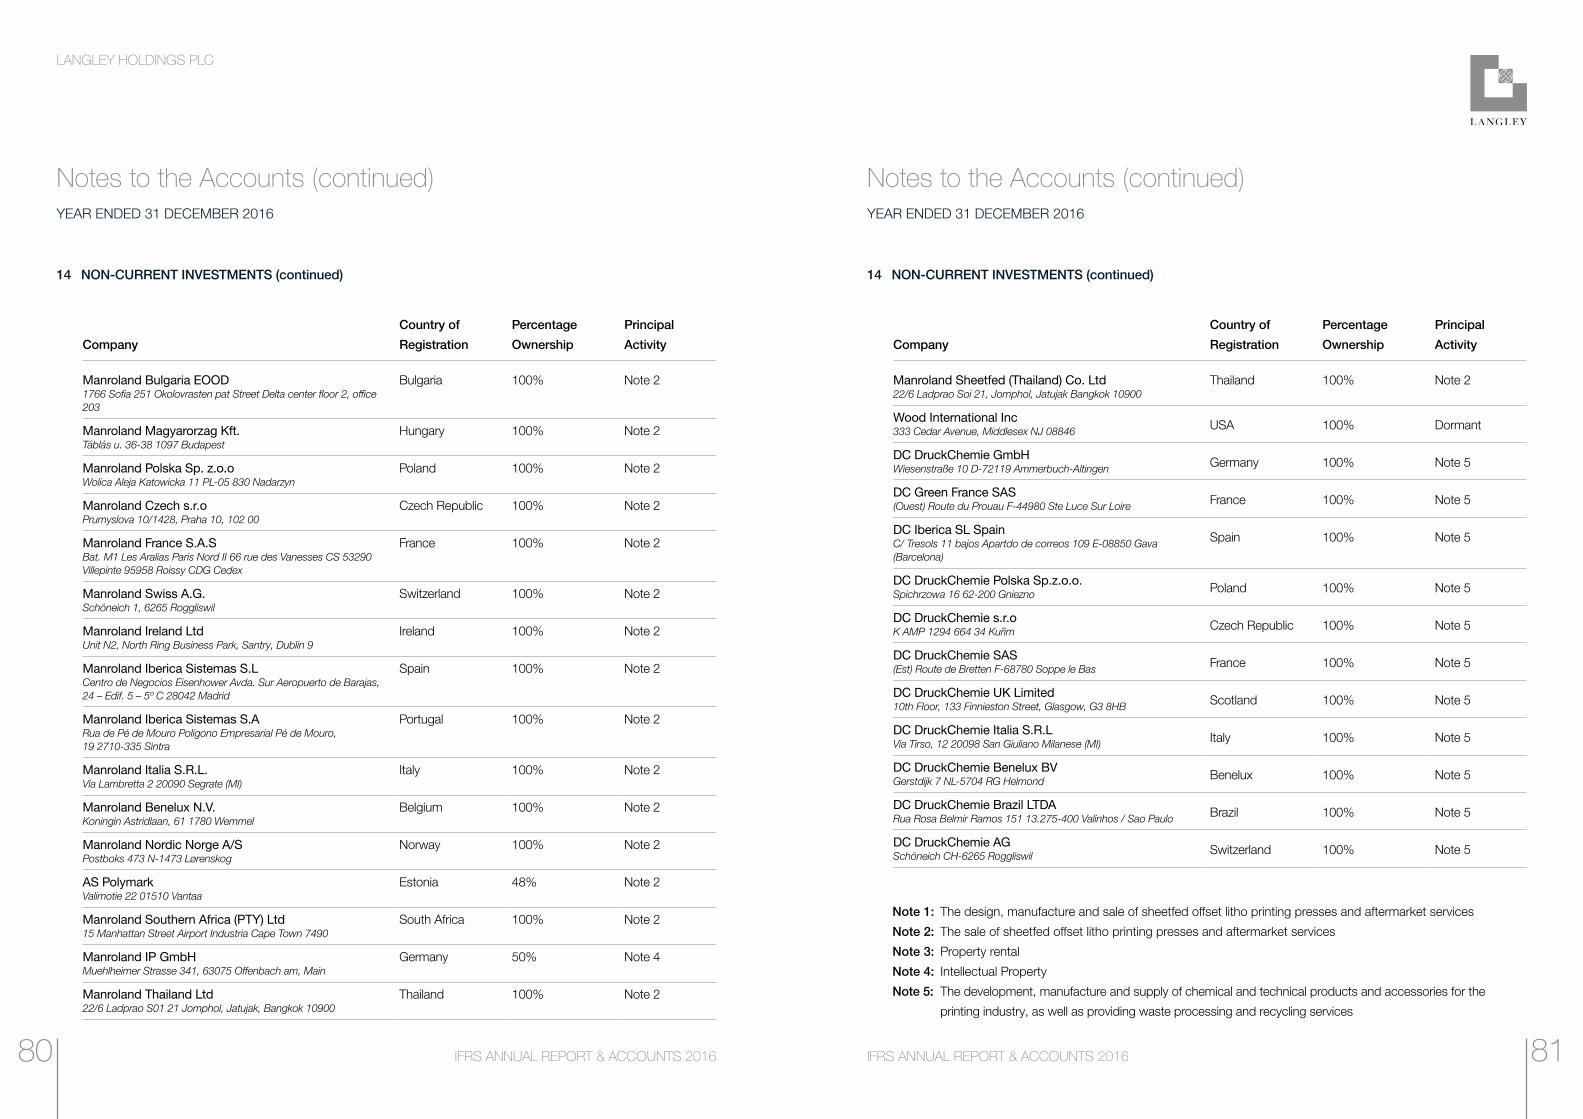
LANGLEY HOLDINGS PLC
IFRS ANNUAL REPORT & ACCOUNTS 2016IFRS ANNUAL REPORT & ACCOUNTS 2016
Notes to the Accounts (continued)YEAR ENDED 31 DECEMBER 2016
Notes to the Accounts (continued)YEAR ENDED 31 DECEMBER 2016
14 NON-CURRENT INVESTMENTS (continued) 14 NON-CURRENT INVESTMENTS (continued)
Company
Country of
Registration
Percentage
Ownership
Principal
Activity
Manroland Bulgaria EOOD 1766 Sofia 251 Okolovrasten pat Street Delta center floor 2, office 203
Bulgaria 100% Note 2
Manroland Magyarorzag Kft. Táblás u. 36-38 1097 Budapest
Hungary 100% Note 2
Manroland Polska Sp. z.o.o Wolica Aleja Katowicka 11 PL-05 830 Nadarzyn
Poland 100% Note 2
Manroland Czech s.r.o Prumyslova 10/1428, Praha 10, 102 00
Czech Republic 100% Note 2
Manroland France S.A.S Bat. M1 Les Aralias Paris Nord II 66 rue des Vanesses CS 53290 Villepinte 95958 Roissy CDG Cedex
France 100% Note 2
Manroland Swiss A.G. Schöneich 1, 6265 Roggliswil
Switzerland 100% Note 2
Manroland Ireland Ltd Unit N2, North Ring Business Park, Santry, Dublin 9
Ireland 100% Note 2
Manroland Iberica Sistemas S.L Centro de Negocios Eisenhower Avda. Sur Aeropuerto de Barajas, 24 – Edif. 5 – 5º C 28042 Madrid
Spain 100% Note 2
Manroland Iberica Sistemas S.A Rua de Pé de Mouro Polígono Empresarial Pé de Mouro, 19 2710-335 Sintra
Portugal 100% Note 2
Manroland Italia S.R.L. Via Lambretta 2 20090 Segrate (MI)
Italy 100% Note 2
Manroland Benelux N.V. Koningin Astridlaan, 61 1780 Wemmel
Belgium 100% Note 2
Manroland Nordic Norge A/S Postboks 473 N-1473 Lørenskog
Norway 100% Note 2
AS Polymark Valimotie 22 01510 Vantaa
Estonia 48% Note 2
Manroland Southern Africa (PTY) Ltd 15 Manhattan Street Airport Industria Cape Town 7490
South Africa 100% Note 2
Manroland IP GmbH Muehlheimer Strasse 341, 63075 Offenbach am, Main
Germany 50% Note 4
Manroland Thailand Ltd 22/6 Ladprao S01 21 Jomphol, Jatujak, Bangkok 10900
Thailand 100% Note 2
Company
Country of
Registration
Percentage
Ownership
Principal
Activity
Manroland Sheetfed (Thailand) Co. Ltd 22/6 Ladprao Soi 21, Jomphol, Jatujak Bangkok 10900
Thailand 100% Note 2
Wood International Inc 333 Cedar Avenue, Middlesex NJ 08846 USA 100% Dormant
DC DruckChemie GmbH Wiesenstraße 10 D-72119 Ammerbuch-Altingen Germany 100% Note 5
DC Green France SAS (Ouest) Route du Prouau F-44980 Ste Luce Sur Loire France 100% Note 5
DC Iberica SL Spain C/ Tresols 11 bajos Apartdo de correos 109 E-08850 Gava (Barcelona)
Spain 100% Note 5
DC DruckChemie Polska Sp.z.o.o. Spichrzowa 16 62-200 Gniezno Poland 100% Note 5
DC DruckChemie s.r.o K AMP 1294 664 34 Kuřim Czech Republic 100% Note 5
DC DruckChemie SAS (Est) Route de Bretten F-68780 Soppe le Bas France 100% Note 5
DC DruckChemie UK Limited 10th Floor, 133 Finnieston Street, Glasgow, G3 8HB Scotland 100% Note 5
DC DruckChemie Italia S.R.L Via Tirso, 12 20098 San Giuliano Milanese (MI) Italy 100% Note 5
DC DruckChemie Benelux BV Gerstdijk 7 NL-5704 RG Helmond Benelux 100% Note 5
DC DruckChemie Brazil LTDA Rua Rosa Belmir Ramos 151 13.275-400 Valinhos / Sao Paulo Brazil 100% Note 5
DC DruckChemie AG Schöneich CH-6265 Roggliswil Switzerland 100% Note 5
Note 1: The design, manufacture and sale of sheetfed offset litho printing presses and aftermarket services
Note 2: The sale of sheetfed offset litho printing presses and aftermarket services
Note 3: Property rental
Note 4: Intellectual Property
Note 5: The development, manufacture and supply of chemical and technical products and accessories for the
printing industry, as well as providing waste processing and recycling services
8180
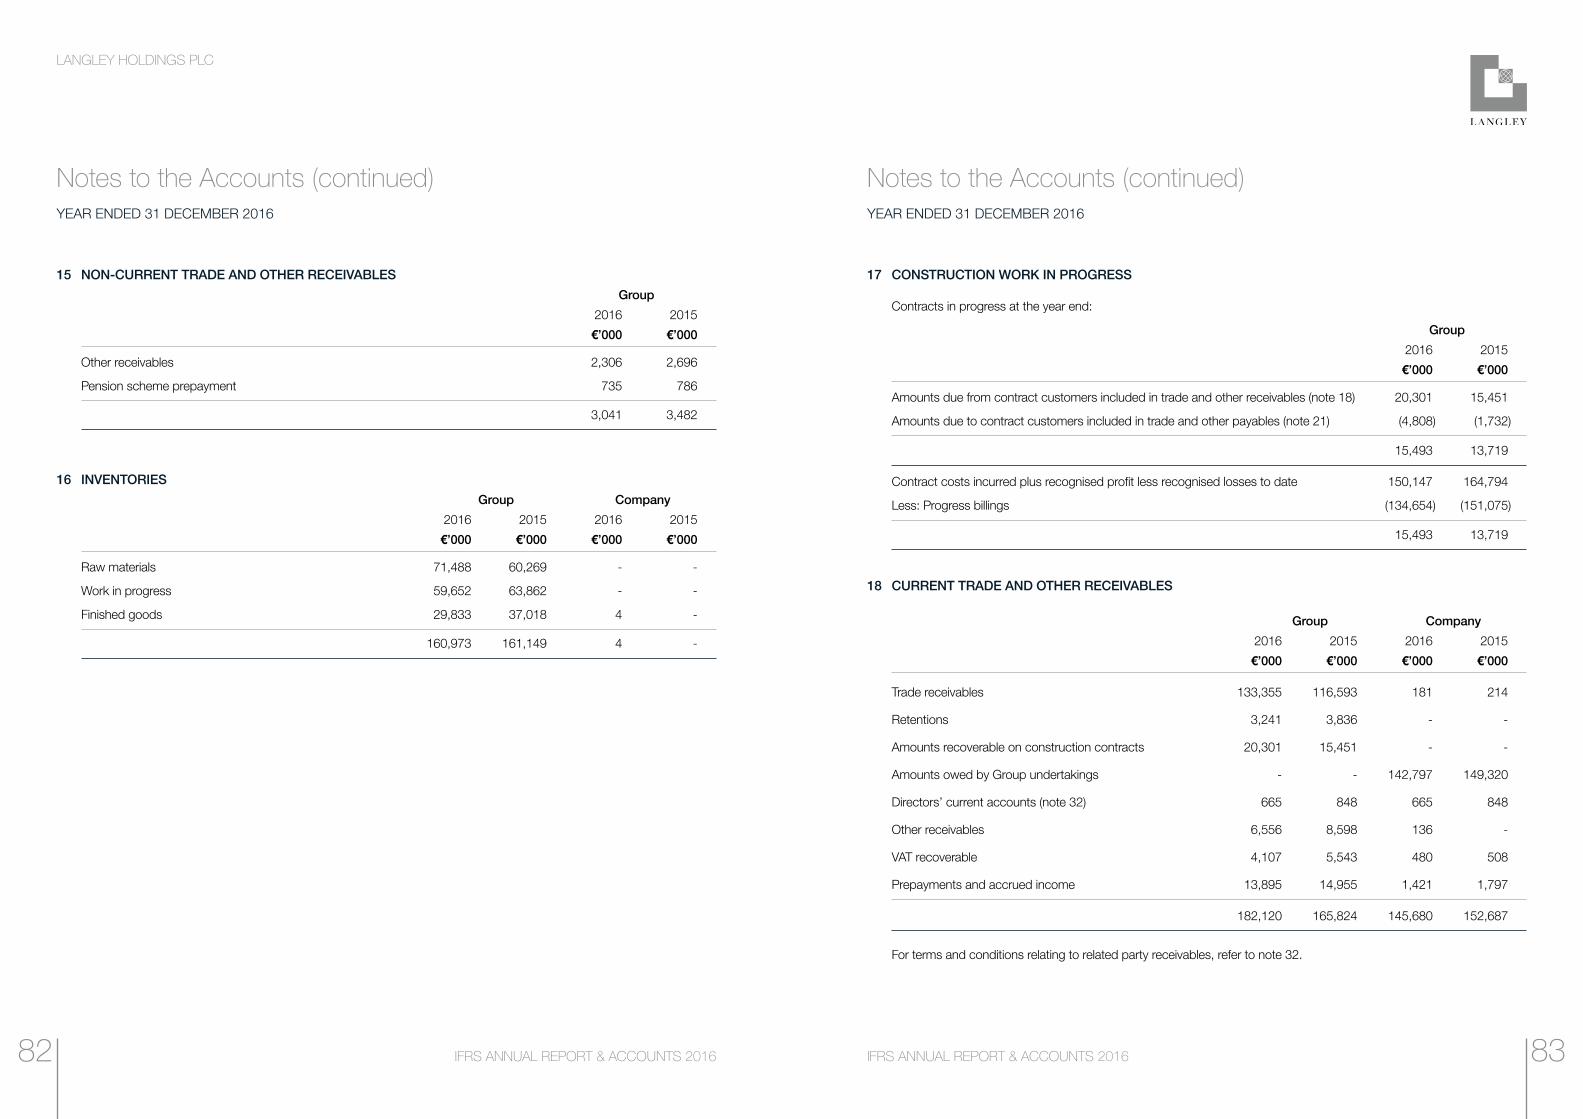
LANGLEY HOLDINGS PLC
IFRS ANNUAL REPORT & ACCOUNTS 2016IFRS ANNUAL REPORT & ACCOUNTS 2016
Notes to the Accounts (continued)YEAR ENDED 31 DECEMBER 2016
Notes to the Accounts (continued)YEAR ENDED 31 DECEMBER 2016
15 NON-CURRENT TRADE AND OTHER RECEIVABLES Group
2016 2015
€’000 €’000
Other receivables 2,306 2,696
Pension scheme prepayment 735 786
3,041 3,482
16 INVENTORIES Group Company
2016 2015 2016 2015
€’000 €’000 €’000 €’000
Raw materials 71,488 60,269 - -
Work in progress 59,652 63,862 - -
Finished goods 29,833 37,018 4 -
160,973 161,149 4 -
17 CONSTRUCTION WORK IN PROGRESS
Contracts in progress at the year end:
Group
2016 2015
€’000 €’000
Amounts due from contract customers included in trade and other receivables (note 18) 20,301 15,451
Amounts due to contract customers included in trade and other payables (note 21) (4,808) (1,732)
15,493 13,719
Contract costs incurred plus recognised profit less recognised losses to date 150,147 164,794
Less: Progress billings (134,654) (151,075)
15,493 13,719
18 CURRENT TRADE AND OTHER RECEIVABLES
Group Company
2016 2015 2016 2015
€’000 €’000 €’000 €’000
Trade receivables 133,355 116,593 181 214
Retentions 3,241 3,836 - -
Amounts recoverable on construction contracts 20,301 15,451 - -
Amounts owed by Group undertakings - - 142,797 149,320
Directors’ current accounts (note 32) 665 848 665 848
Other receivables 6,556 8,598 136 -
VAT recoverable 4,107 5,543 480 508
Prepayments and accrued income 13,895 14,955 1,421 1,797
182,120 165,824 145,680 152,687
For terms and conditions relating to related party receivables, refer to note 32.
8382
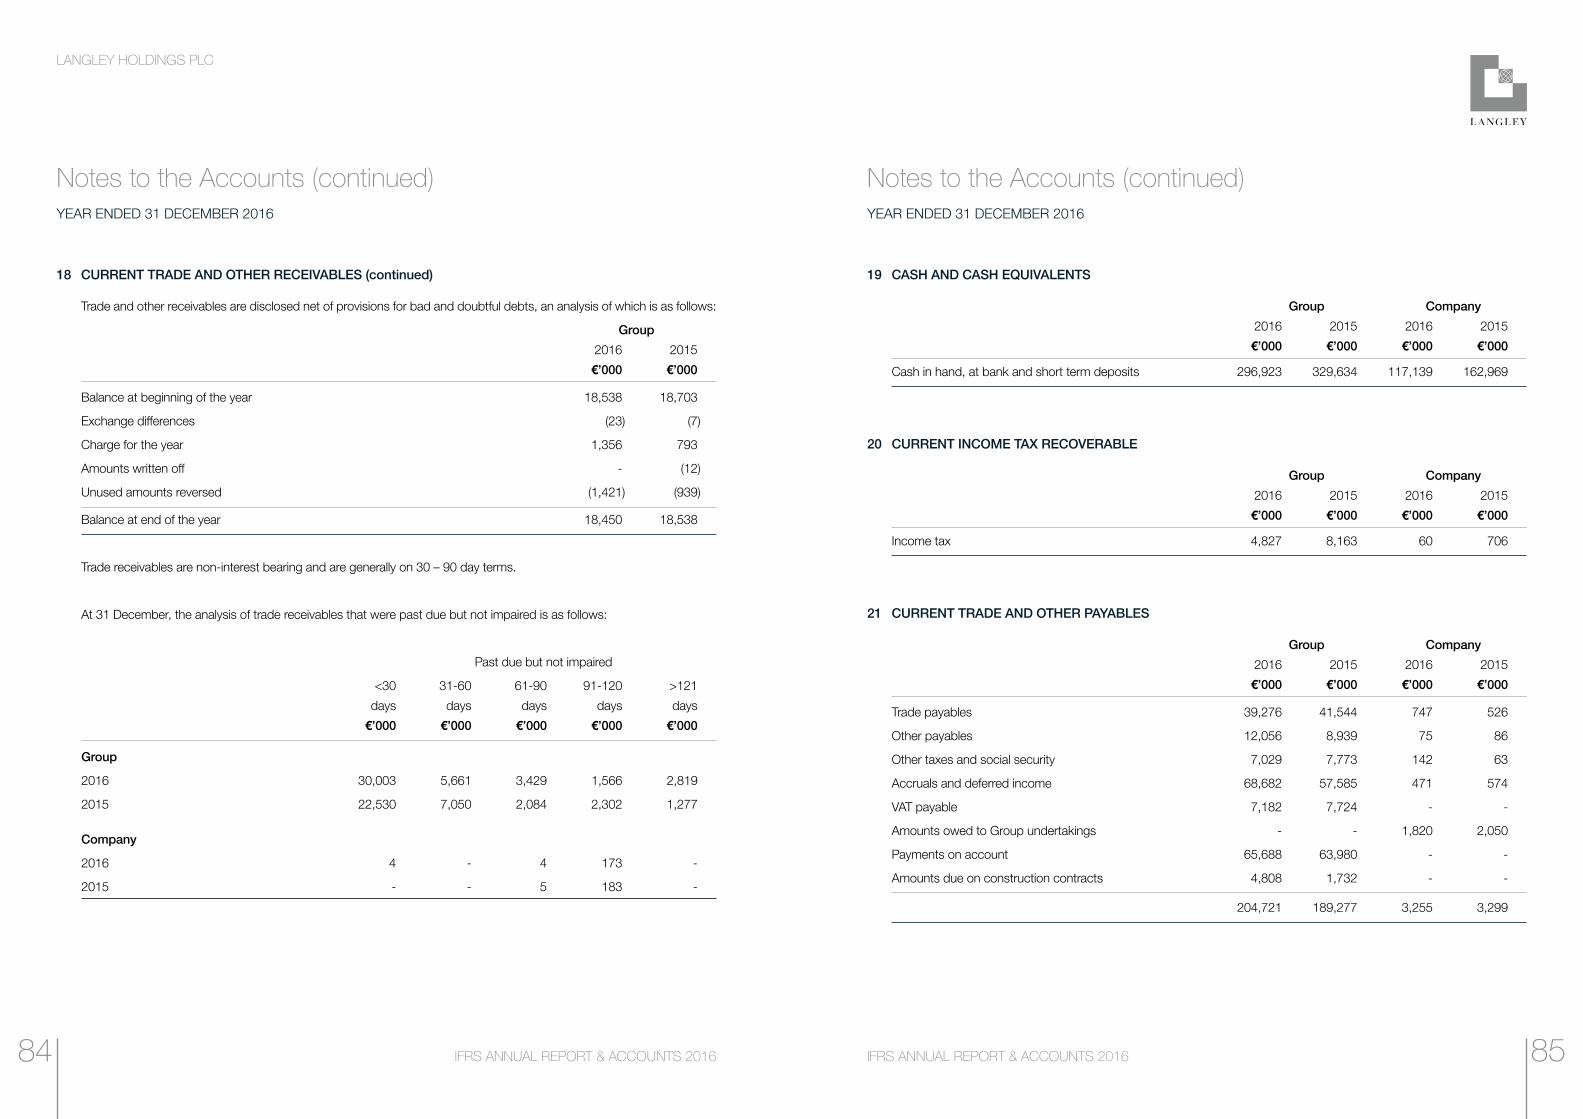
LANGLEY HOLDINGS PLC
IFRS ANNUAL REPORT & ACCOUNTS 2016IFRS ANNUAL REPORT & ACCOUNTS 2016
Notes to the Accounts (continued)YEAR ENDED 31 DECEMBER 2016
Notes to the Accounts (continued)YEAR ENDED 31 DECEMBER 2016
18 CURRENT TRADE AND OTHER RECEIVABLES (continued)
Trade and other receivables are disclosed net of provisions for bad and doubtful debts, an analysis of which is as follows:
Group
2016 2015
€’000 €’000
Balance at beginning of the year 18,538 18,703
Exchange differences (23) (7)
Charge for the year 1,356 793
Amounts written off - (12)
Unused amounts reversed (1,421) (939)
Balance at end of the year 18,450 18,538
Trade receivables are non-interest bearing and are generally on 30 – 90 day terms.
At 31 December, the analysis of trade receivables that were past due but not impaired is as follows:
Past due but not impaired
<30 31-60 61-90 91-120 >121
days days days days days
€’000 €’000 €’000 €’000 €’000
Group
2016 30,003 5,661 3,429 1,566 2,819
2015 22,530 7,050 2,084 2,302 1,277
Company
2016 4 - 4 173 -
2015 - - 5 183 -
19 CASH AND CASH EQUIVALENTS
Group Company
2016 2015 2016 2015
€’000 €’000 €’000 €’000
Cash in hand, at bank and short term deposits 296,923 329,634 117,139 162,969
20 CURRENT INCOME TAX RECOVERABLE
Group Company
2016 2015 2016 2015
€’000 €’000 €’000 €’000
Income tax 4,827 8,163 60 706
21 CURRENT TRADE AND OTHER PAYABLES
Group Company
2016 2015 2016 2015
€’000 €’000 €’000 €’000
Trade payables 39,276 41,544 747 526
Other payables 12,056 8,939 75 86
Other taxes and social security 7,029 7,773 142 63
Accruals and deferred income 68,682 57,585 471 574
VAT payable 7,182 7,724 - -
Amounts owed to Group undertakings - - 1,820 2,050
Payments on account 65,688 63,980 - -
Amounts due on construction contracts 4,808 1,732 - -
204,721 189,277 3,255 3,299
8584
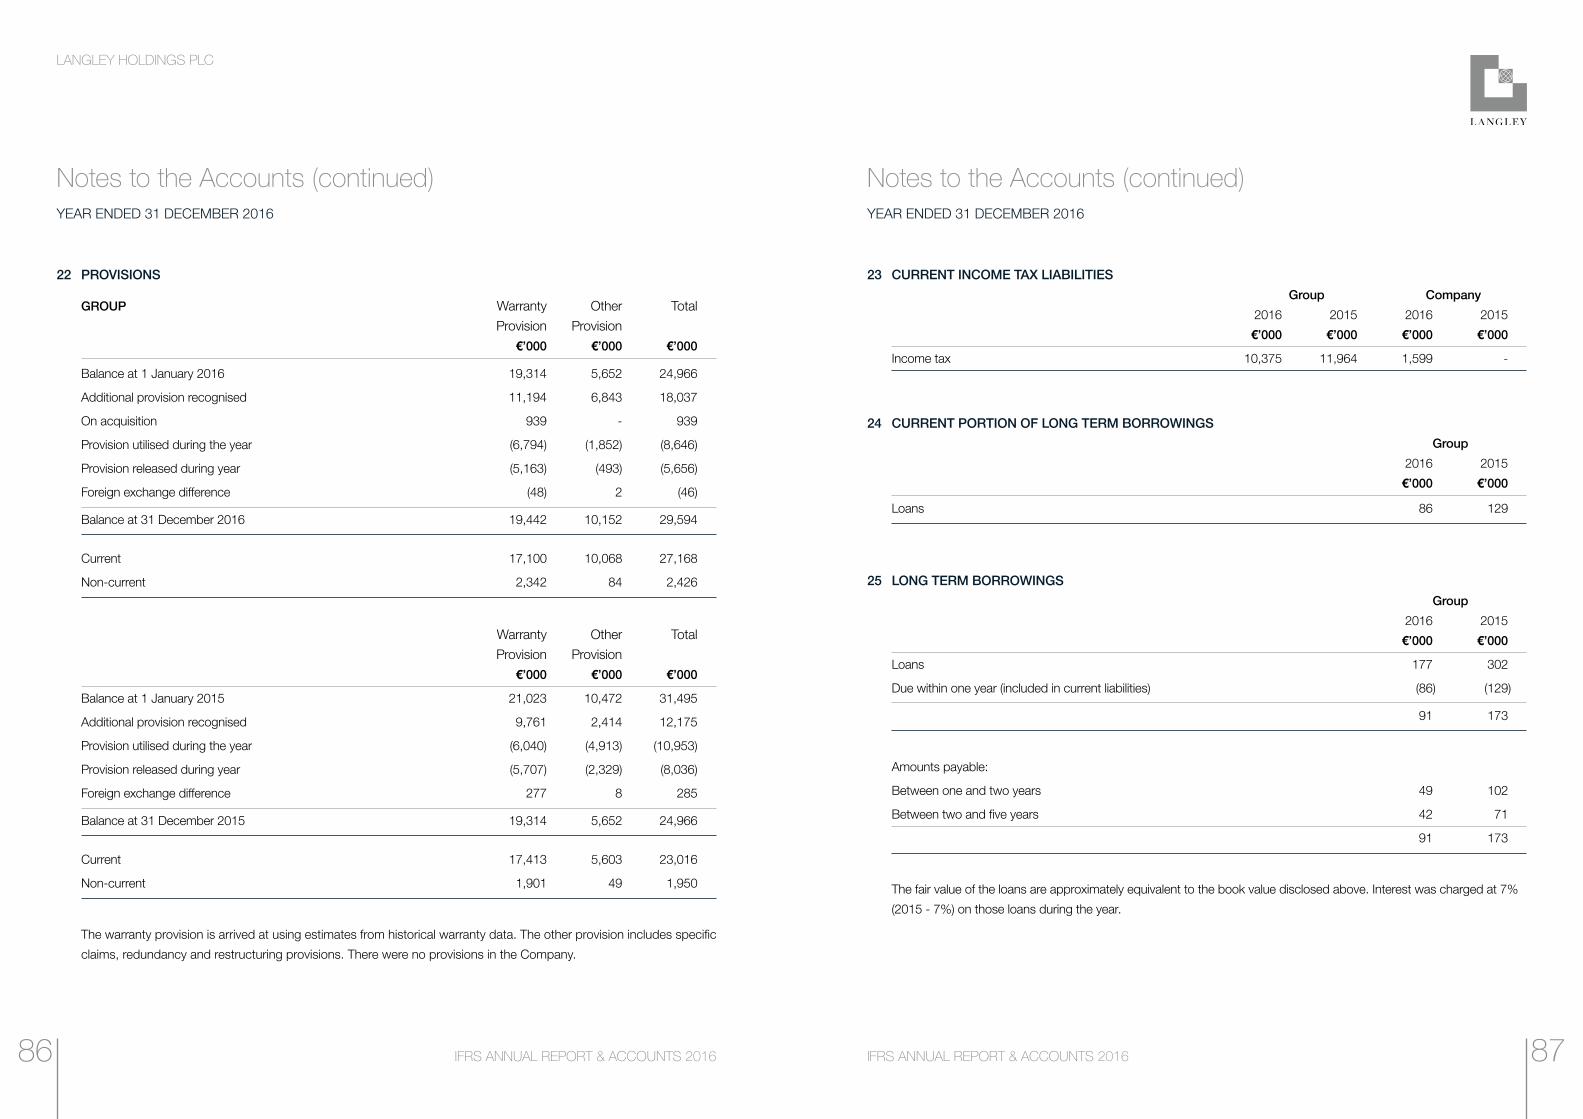
LANGLEY HOLDINGS PLC
IFRS ANNUAL REPORT & ACCOUNTS 2016IFRS ANNUAL REPORT & ACCOUNTS 2016
Notes to the Accounts (continued)YEAR ENDED 31 DECEMBER 2016
Notes to the Accounts (continued)YEAR ENDED 31 DECEMBER 2016
22 PROVISIONS
GROUP Warranty Other Total Provision Provision
€’000 €’000 €’000
Balance at 1 January 2016 19,314 5,652 24,966
Additional provision recognised 11,194 6,843 18,037
On acquisition 939 - 939
Provision utilised during the year (6,794) (1,852) (8,646)
Provision released during year (5,163) (493) (5,656)
Foreign exchange difference (48) 2 (46)
Balance at 31 December 2016 19,442 10,152 29,594
Current 17,100 10,068 27,168
Non-current 2,342 84 2,426
Warranty Other Total Provision Provision
€’000 €’000 €’000
Balance at 1 January 2015 21,023 10,472 31,495
Additional provision recognised 9,761 2,414 12,175
Provision utilised during the year (6,040) (4,913) (10,953)
Provision released during year (5,707) (2,329) (8,036)
Foreign exchange difference 277 8 285
Balance at 31 December 2015 19,314 5,652 24,966
Current 17,413 5,603 23,016
Non-current 1,901 49 1,950
The warranty provision is arrived at using estimates from historical warranty data. The other provision includes specific
claims, redundancy and restructuring provisions. There were no provisions in the Company.
23 CURRENT INCOME TAX LIABILITIES Group Company
2016 2015 2016 2015
€’000 €’000 €’000 €’000
Income tax 10,375 11,964 1,599 -
24 CURRENT PORTION OF LONG TERM BORROWINGS Group
2016 2015
€’000 €’000
Loans 86 129
25 LONG TERM BORROWINGS Group
2016 2015
€’000 €’000
Loans 177 302
Due within one year (included in current liabilities) (86) (129)
91 173
Amounts payable:
Between one and two years 49 102
Between two and five years 42 71
91 173
The fair value of the loans are approximately equivalent to the book value disclosed above. Interest was charged at 7%
(2015 - 7%) on those loans during the year.
8786

LANGLEY HOLDINGS PLC
IFRS ANNUAL REPORT & ACCOUNTS 2016IFRS ANNUAL REPORT & ACCOUNTS 2016
Notes to the Accounts (continued)YEAR ENDED 31 DECEMBER 2016
Notes to the Accounts (continued)YEAR ENDED 31 DECEMBER 2016
26 NON-CURRENT TRADE AND OTHER PAYABLES Group
2016 2015
€’000 €’000
Trade payables 263 366
Accruals and deferred income 12,951 15,114
13,214 15,480
27 RETIREMENT BENEFIT OBLIGATIONS
GROUP 2016 2015
€’000 €’000
At 1 January 2016 13,004 12,874
Total expense recognised in the Income Statement in the year 33 149
Actuarial losses/(gains) – financial assumptions 478 (234)
Actuarial losses – demographic assumptions 26 987
Actuarial (gains)/losses – experience (1,661) 1,043
Changes in the effect of asset ceiling 1,517 (1,722)
Contributions paid (123) (94)
Payments from the plan (354) (285)
Exchange differences 101 524
Other movement - (238)
At 31 December 2016 13,021 13,004
UK defined benefit pension schemes 115 58
Overseas unfunded defined benefit pension obligations 9,488 9,540
Overseas unfunded medical benefits obligations 3,418 3,406
Retirement benefit obligation in balance sheet 13,021 13,004
28 DEFERRED INCOME TAX
Deferred income tax assets and liabilities are offset when there is a legally enforceable right to offset current tax assets
against current tax liabilities and when the deferred income taxes relate to the same fiscal authority.
Group Company
2016 2015 2016 2015
€’000 €’000 €’000 €’000
Deferred tax assets 23,781 22,377 - 76
Deferred tax liabilities (17,349) (17,578) (141) -
6,432 4,799 (141) 76
The net movement on the deferred income tax account is as follows:
Group Company
2016 2015 2016 2015
€’000 €’000 €’000 €’000
At 1 January 2016 (4,799) (4,052) (76) (45)
Transfer to revaluation reserve (35) (35) - -
Exchange differences (356) (442) 4 (3)
Income Statement charge (note 10) (1,170) (257) 213 (28)
Release to equity on actuarial loss (72) (13) - -
At 31 December 2016 (6,432) (4,799) 141 (76)
8988
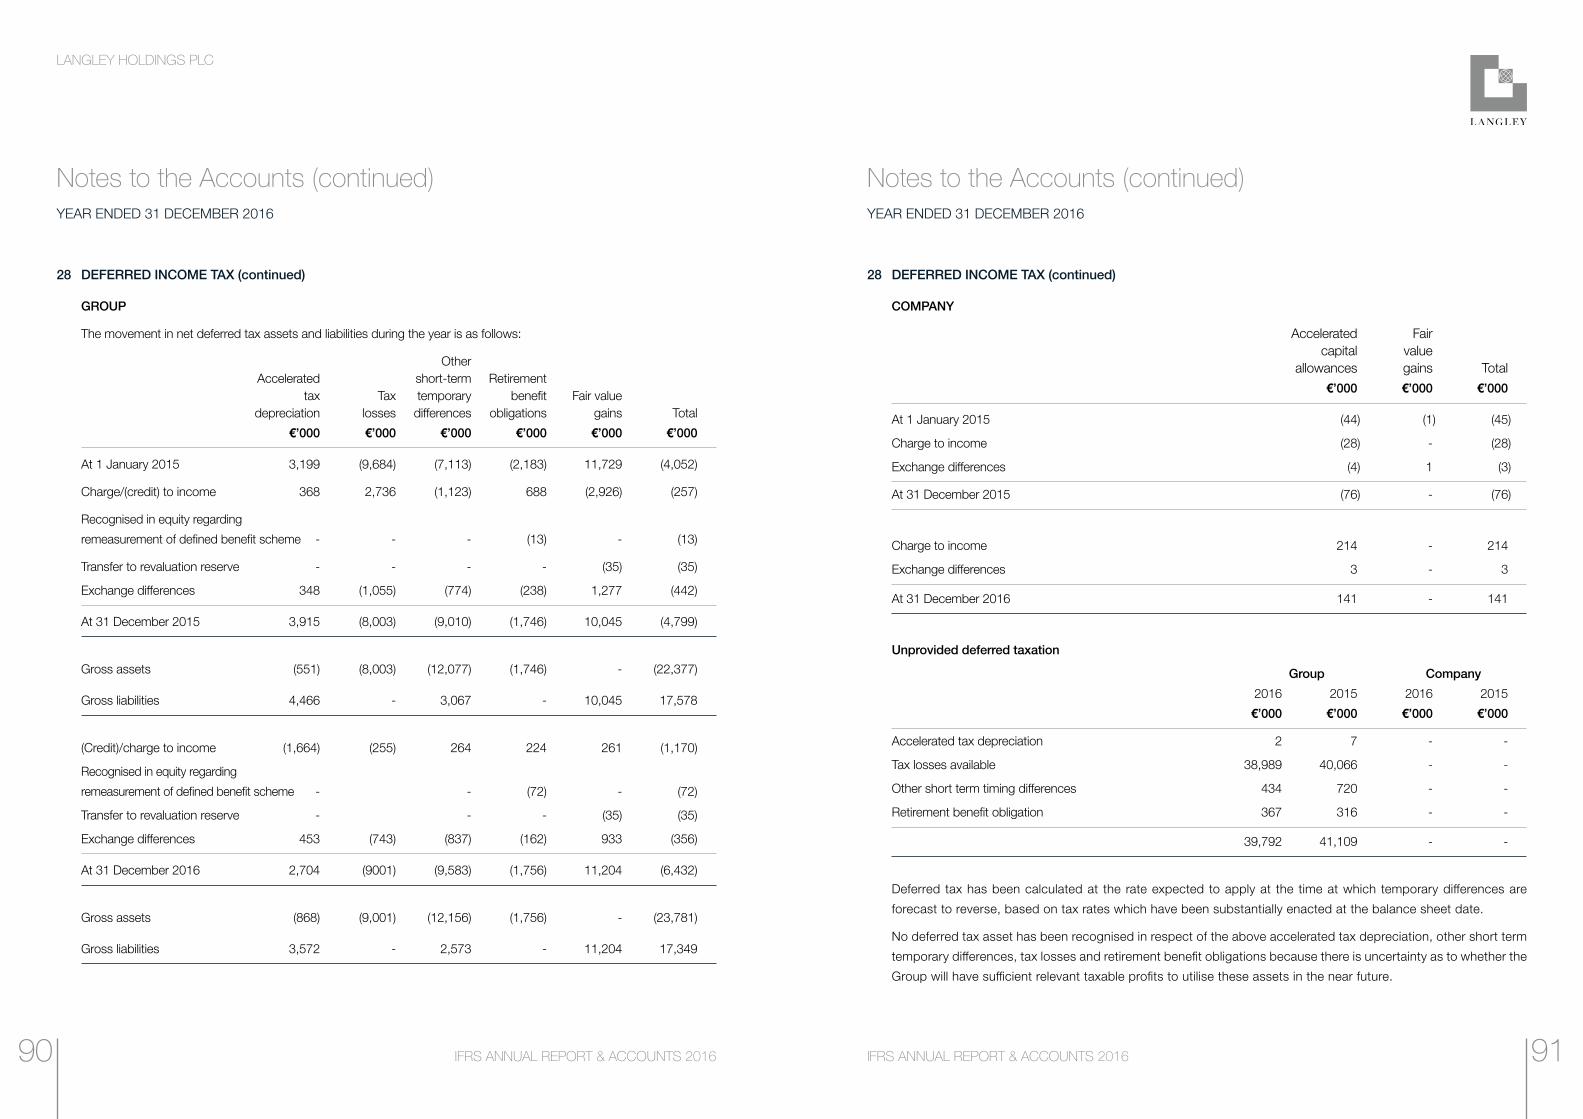
LANGLEY HOLDINGS PLC
IFRS ANNUAL REPORT & ACCOUNTS 2016IFRS ANNUAL REPORT & ACCOUNTS 2016
Notes to the Accounts (continued)YEAR ENDED 31 DECEMBER 2016
28 DEFERRED INCOME TAX (continued)
GROUP
The movement in net deferred tax assets and liabilities during the year is as follows:
Other Accelerated short-term Retirement tax Tax temporary benefit Fair value
depreciation losses differences obligations gains Total
€’000 €’000 €’000 €’000 €’000 €’000
At 1 January 2015 3,199 (9,684) (7,113) (2,183) 11,729 (4,052)
Charge/(credit) to income 368 2,736 (1,123) 688 (2,926) (257)
Recognised in equity regarding
remeasurement of defined benefit scheme - - - (13) - (13)
Transfer to revaluation reserve - - - - (35) (35)
Exchange differences 348 (1,055) (774) (238) 1,277 (442)
At 31 December 2015 3,915 (8,003) (9,010) (1,746) 10,045 (4,799)
Gross assets (551) (8,003) (12,077) (1,746) - (22,377)
Gross liabilities 4,466 - 3,067 - 10,045 17,578
(Credit)/charge to income (1,664) (255) 264 224 261 (1,170)
Recognised in equity regarding
remeasurement of defined benefit scheme - - (72) - (72)
Transfer to revaluation reserve - - - (35) (35)
Exchange differences 453 (743) (837) (162) 933 (356)
At 31 December 2016 2,704 (9001) (9,583) (1,756) 11,204 (6,432)
Gross assets (868) (9,001) (12,156) (1,756) - (23,781)
Gross liabilities 3,572 - 2,573 - 11,204 17,349
Notes to the Accounts (continued)YEAR ENDED 31 DECEMBER 2016
28 DEFERRED INCOME TAX (continued)
COMPANY
Accelerated Fair capital value allowances gains Total
€’000 €’000 €’000
At 1 January 2015 (44) (1) (45)
Charge to income (28) - (28)
Exchange differences (4) 1 (3)
At 31 December 2015 (76) - (76)
Charge to income 214 - 214
Exchange differences 3 - 3
At 31 December 2016 141 - 141
Unprovided deferred taxation
Group Company
2016 2015 2016 2015
€’000 €’000 €’000 €’000
Accelerated tax depreciation 2 7 - -
Tax losses available 38,989 40,066 - -
Other short term timing differences 434 720 - -
Retirement benefit obligation 367 316 - -
39,792 41,109 - -
Deferred tax has been calculated at the rate expected to apply at the time at which temporary differences are
forecast to reverse, based on tax rates which have been substantially enacted at the balance sheet date.
No deferred tax asset has been recognised in respect of the above accelerated tax depreciation, other short term
temporary differences, tax losses and retirement benefit obligations because there is uncertainty as to whether the
Group will have sufficient relevant taxable profits to utilise these assets in the near future.
9190
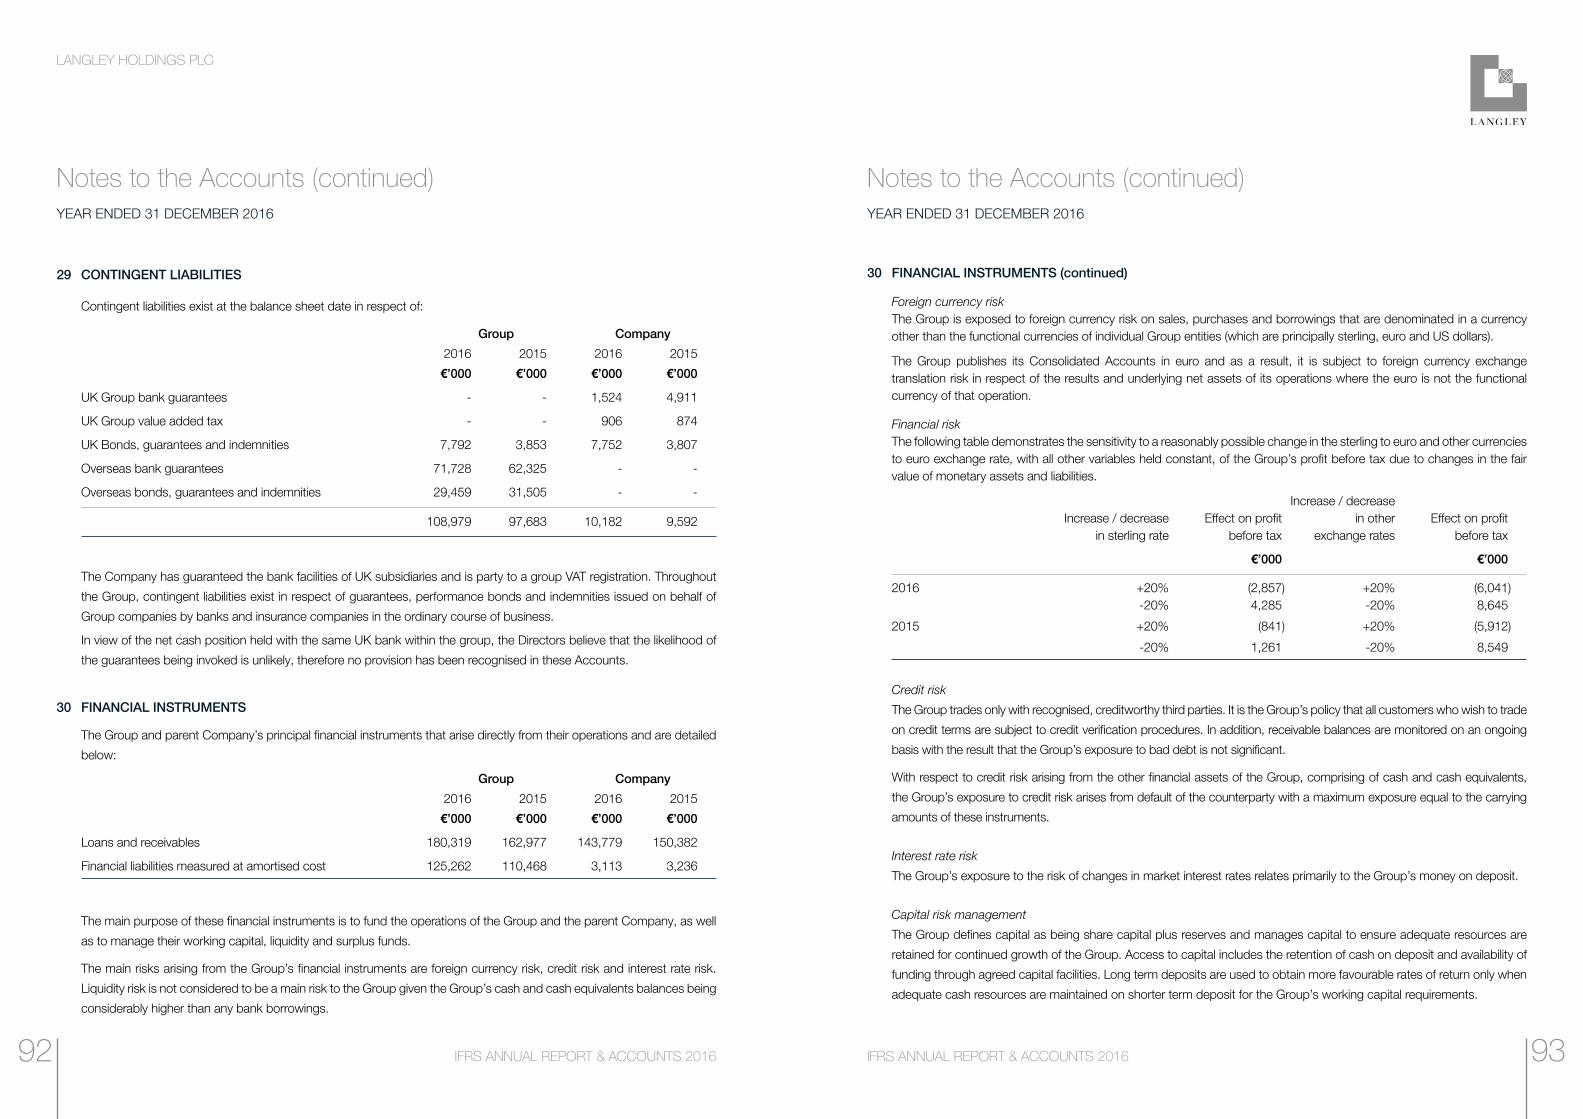
LANGLEY HOLDINGS PLC
IFRS ANNUAL REPORT & ACCOUNTS 2016IFRS ANNUAL REPORT & ACCOUNTS 2016
29 CONTINGENT LIABILITIES
Contingent liabilities exist at the balance sheet date in respect of:
Group Company
2016 2015 2016 2015
€’000 €’000 €’000 €’000
UK Group bank guarantees - - 1,524 4,911
UK Group value added tax - - 906 874
UK Bonds, guarantees and indemnities 7,792 3,853 7,752 3,807
Overseas bank guarantees 71,728 62,325 - -
Overseas bonds, guarantees and indemnities 29,459 31,505 - -
108,979 97,683 10,182 9,592
The Company has guaranteed the bank facilities of UK subsidiaries and is party to a group VAT registration. Throughout
the Group, contingent liabilities exist in respect of guarantees, performance bonds and indemnities issued on behalf of
Group companies by banks and insurance companies in the ordinary course of business.
In view of the net cash position held with the same UK bank within the group, the Directors believe that the likelihood of
the guarantees being invoked is unlikely, therefore no provision has been recognised in these Accounts.
30 FINANCIAL INSTRUMENTS
The Group and parent Company’s principal financial instruments that arise directly from their operations and are detailed
below:
Group Company
2016 2015 2016 2015
€’000 €’000 €’000 €’000
Loans and receivables 180,319 162,977 143,779 150,382
Financial liabilities measured at amortised cost 125,262 110,468 3,113 3,236
The main purpose of these financial instruments is to fund the operations of the Group and the parent Company, as well
as to manage their working capital, liquidity and surplus funds.
The main risks arising from the Group’s financial instruments are foreign currency risk, credit risk and interest rate risk.
Liquidity risk is not considered to be a main risk to the Group given the Group’s cash and cash equivalents balances being
considerably higher than any bank borrowings.
30 FINANCIAL INSTRUMENTS (continued)
Foreign currency riskThe Group is exposed to foreign currency risk on sales, purchases and borrowings that are denominated in a currency other than the functional currencies of individual Group entities (which are principally sterling, euro and US dollars).
The Group publishes its Consolidated Accounts in euro and as a result, it is subject to foreign currency exchange translation risk in respect of the results and underlying net assets of its operations where the euro is not the functional currency of that operation.
Financial riskThe following table demonstrates the sensitivity to a reasonably possible change in the sterling to euro and other currencies to euro exchange rate, with all other variables held constant, of the Group’s profit before tax due to changes in the fair value of monetary assets and liabilities.
Increase / decrease Increase / decrease Effect on profit in other Effect on profit in sterling rate before tax exchange rates before tax
€’000 €’000
2016 +20% (2,857) +20% (6,041) -20% 4,285 -20% 8,645
2015 +20% (841) +20% (5,912)
-20% 1,261 -20% 8,549
Credit risk
The Group trades only with recognised, creditworthy third parties. It is the Group’s policy that all customers who wish to trade
on credit terms are subject to credit verification procedures. In addition, receivable balances are monitored on an ongoing
basis with the result that the Group’s exposure to bad debt is not significant.
With respect to credit risk arising from the other financial assets of the Group, comprising of cash and cash equivalents,
the Group’s exposure to credit risk arises from default of the counterparty with a maximum exposure equal to the carrying
amounts of these instruments.
Interest rate risk
The Group’s exposure to the risk of changes in market interest rates relates primarily to the Group’s money on deposit.
Capital risk management
The Group defines capital as being share capital plus reserves and manages capital to ensure adequate resources are
retained for continued growth of the Group. Access to capital includes the retention of cash on deposit and availability of
funding through agreed capital facilities. Long term deposits are used to obtain more favourable rates of return only when
adequate cash resources are maintained on shorter term deposit for the Group’s working capital requirements.
Notes to the Accounts (continued)YEAR ENDED 31 DECEMBER 2016
Notes to the Accounts (continued)YEAR ENDED 31 DECEMBER 2016
9392
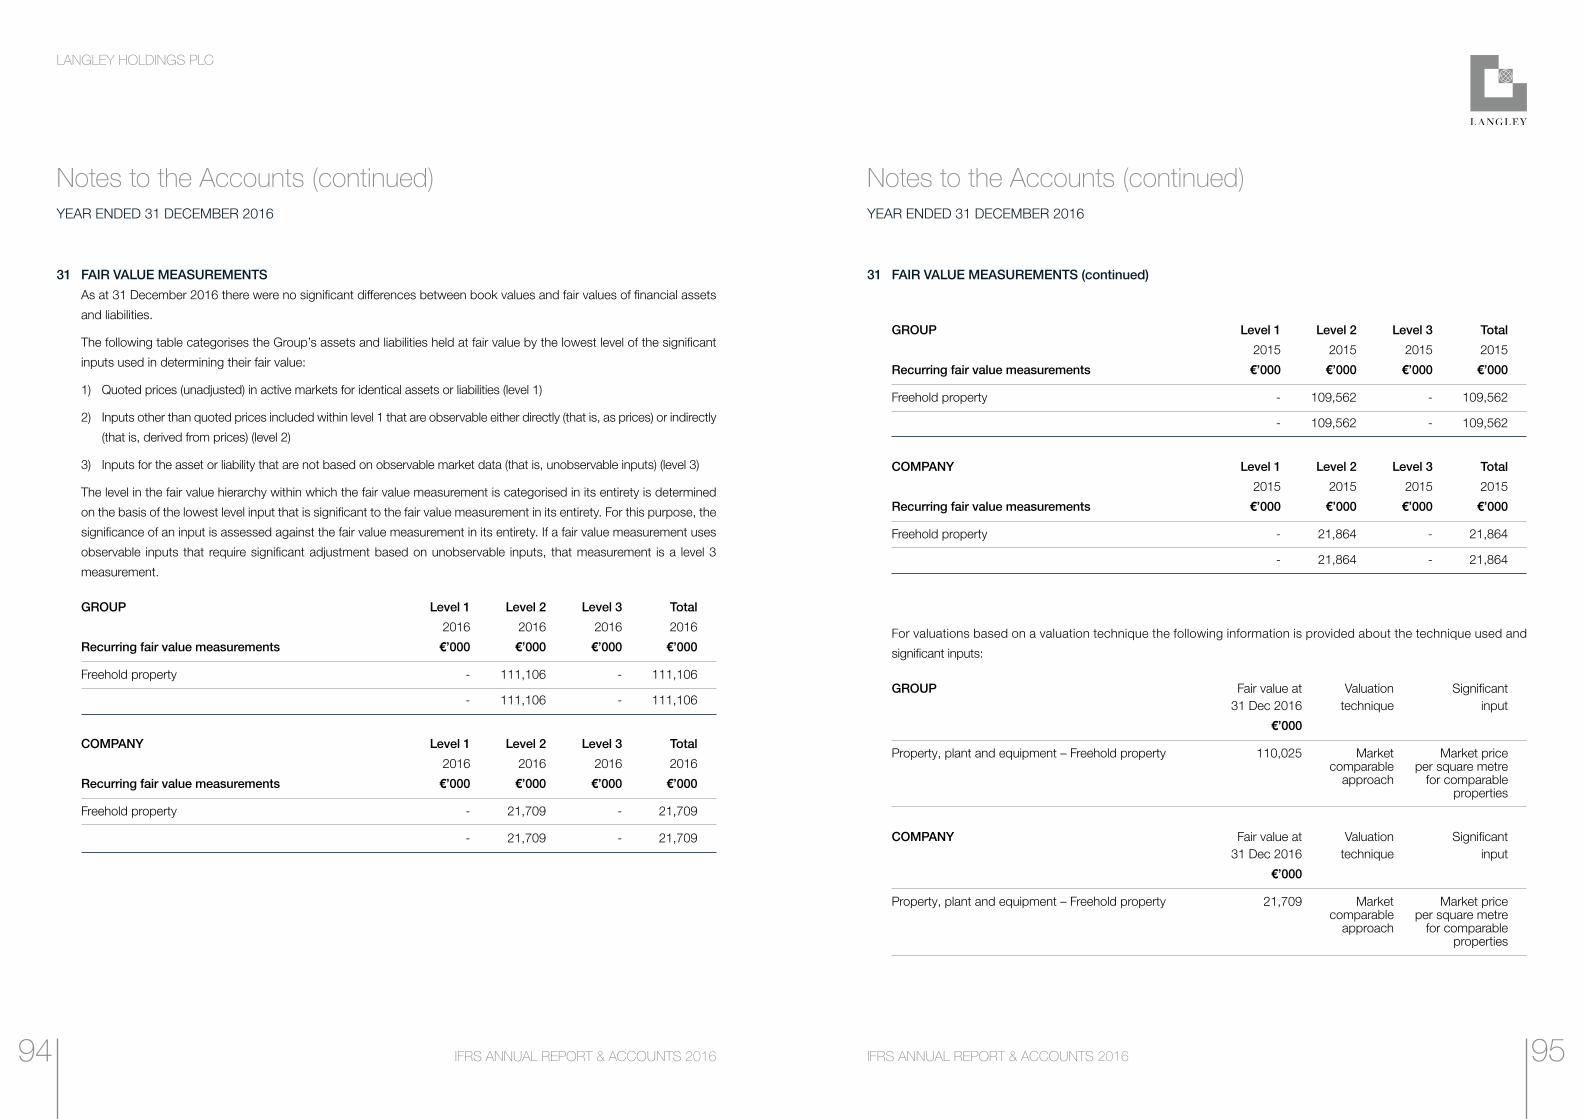
LANGLEY HOLDINGS PLC
IFRS ANNUAL REPORT & ACCOUNTS 2016IFRS ANNUAL REPORT & ACCOUNTS 2016
Notes to the Accounts (continued)YEAR ENDED 31 DECEMBER 2016
Notes to the Accounts (continued)YEAR ENDED 31 DECEMBER 2016
31 FAIR VALUE MEASUREMENTS (continued)
GROUP Level 1 Level 2 Level 3 Total
2015 2015 2015 2015
Recurring fair value measurements €’000 €’000 €’000 €’000
Freehold property - 109,562 - 109,562
- 109,562 - 109,562
COMPANY Level 1 Level 2 Level 3 Total
2015 2015 2015 2015
Recurring fair value measurements €’000 €’000 €’000 €’000
Freehold property - 21,864 - 21,864
- 21,864 - 21,864
For valuations based on a valuation technique the following information is provided about the technique used and
significant inputs:
GROUP Fair value at Valuation Significant 31 Dec 2016 technique input
€’000
Property, plant and equipment – Freehold property 110,025 Market Market price comparable per square metre approach for comparable properties
COMPANY Fair value at Valuation Significant 31 Dec 2016 technique input
€’000
Property, plant and equipment – Freehold property 21,709 Market Market price comparable per square metre approach for comparable properties
31 FAIR VALUE MEASUREMENTSAs at 31 December 2016 there were no significant differences between book values and fair values of financial assets
and liabilities.
The following table categorises the Group’s assets and liabilities held at fair value by the lowest level of the significant
inputs used in determining their fair value:
1) Quoted prices (unadjusted) in active markets for identical assets or liabilities (level 1)
2) Inputs other than quoted prices included within level 1 that are observable either directly (that is, as prices) or indirectly
(that is, derived from prices) (level 2)
3) Inputs for the asset or liability that are not based on observable market data (that is, unobservable inputs) (level 3)
The level in the fair value hierarchy within which the fair value measurement is categorised in its entirety is determined
on the basis of the lowest level input that is significant to the fair value measurement in its entirety. For this purpose, the
significance of an input is assessed against the fair value measurement in its entirety. If a fair value measurement uses
observable inputs that require significant adjustment based on unobservable inputs, that measurement is a level 3
measurement.
GROUP Level 1 Level 2 Level 3 Total
2016 2016 2016 2016
Recurring fair value measurements €’000 €’000 €’000 €’000
Freehold property - 111,106 - 111,106
- 111,106 - 111,106
COMPANY Level 1 Level 2 Level 3 Total
2016 2016 2016 2016
Recurring fair value measurements €’000 €’000 €’000 €’000
Freehold property - 21,709 - 21,709
- 21,709 - 21,709
9594
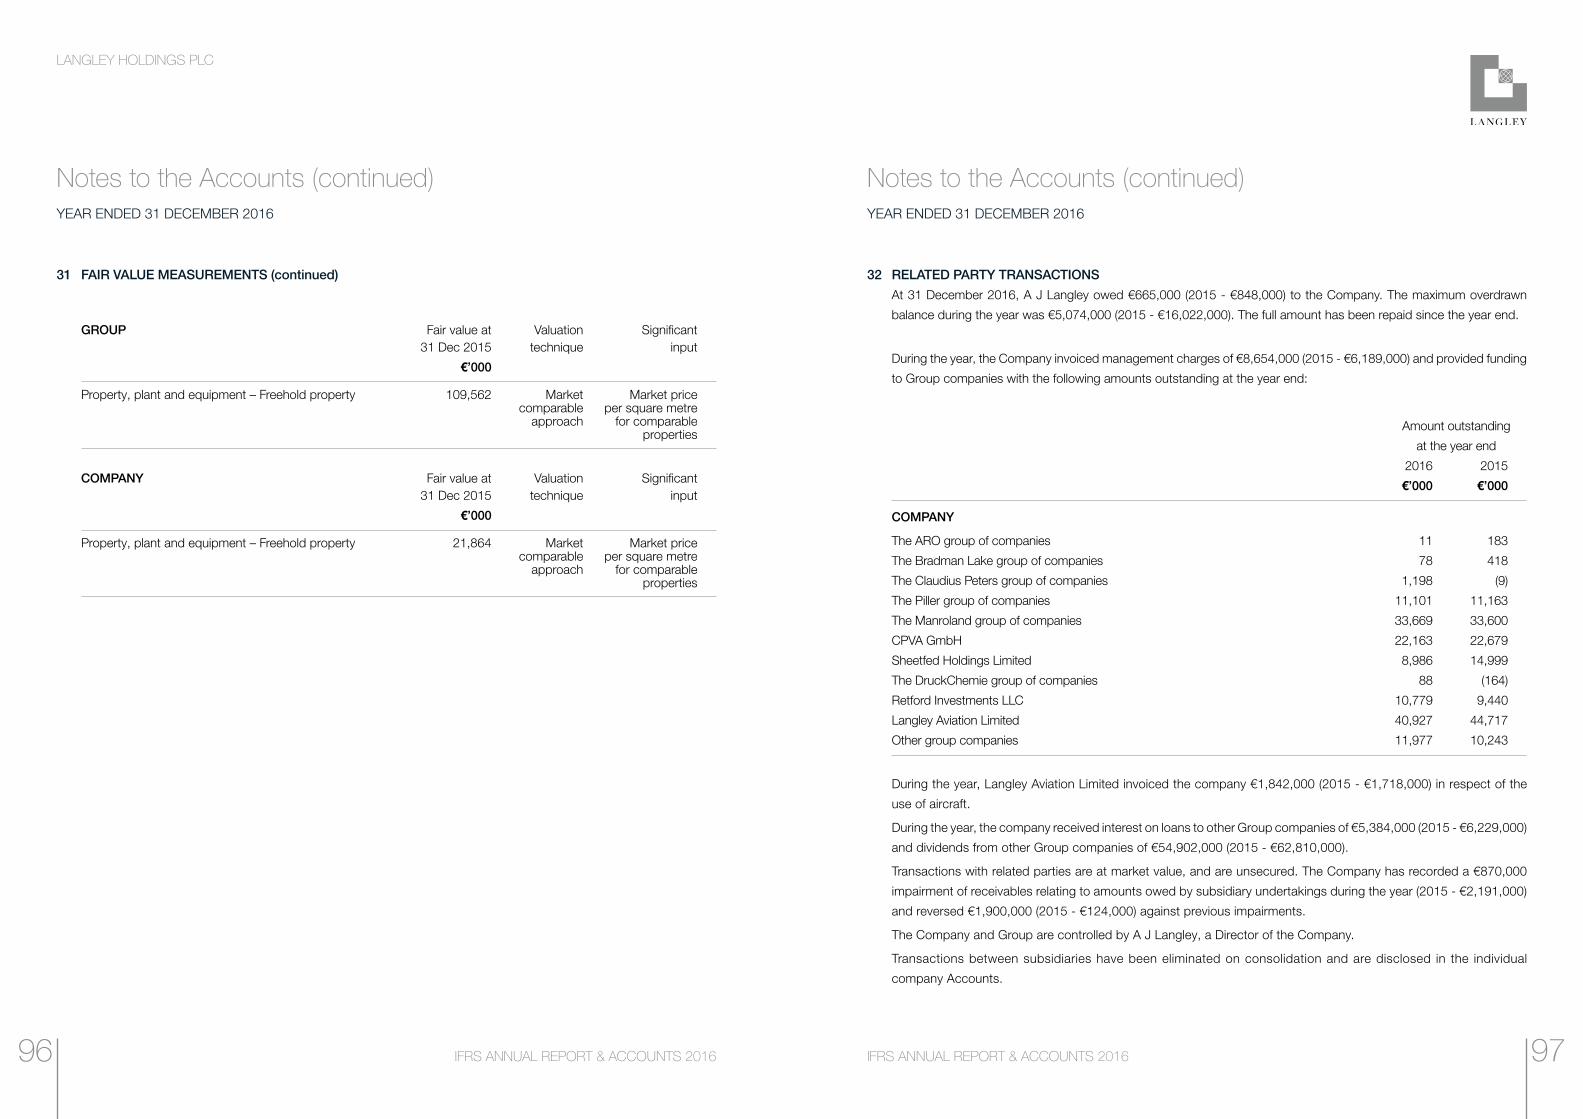
LANGLEY HOLDINGS PLC
IFRS ANNUAL REPORT & ACCOUNTS 2016IFRS ANNUAL REPORT & ACCOUNTS 2016
Notes to the Accounts (continued)YEAR ENDED 31 DECEMBER 2016
Notes to the Accounts (continued)YEAR ENDED 31 DECEMBER 2016
32 RELATED PARTY TRANSACTIONS At 31 December 2016, A J Langley owed €665,000 (2015 - €848,000) to the Company. The maximum overdrawn
balance during the year was €5,074,000 (2015 - €16,022,000). The full amount has been repaid since the year end.
During the year, the Company invoiced management charges of €8,654,000 (2015 - €6,189,000) and provided funding
to Group companies with the following amounts outstanding at the year end:
Amount outstanding
at the year end
2016 2015
€’000 €’000
COMPANY
The ARO group of companies 11 183
The Bradman Lake group of companies 78 418
The Claudius Peters group of companies 1,198 (9)
The Piller group of companies 11,101 11,163
The Manroland group of companies 33,669 33,600
CPVA GmbH 22,163 22,679
Sheetfed Holdings Limited 8,986 14,999
The DruckChemie group of companies 88 (164)
Retford Investments LLC 10,779 9,440
Langley Aviation Limited 40,927 44,717
Other group companies 11,977 10,243
During the year, Langley Aviation Limited invoiced the company €1,842,000 (2015 - €1,718,000) in respect of the
use of aircraft.
During the year, the company received interest on loans to other Group companies of €5,384,000 (2015 - €6,229,000)
and dividends from other Group companies of €54,902,000 (2015 - €62,810,000).
Transactions with related parties are at market value, and are unsecured. The Company has recorded a €870,000
impairment of receivables relating to amounts owed by subsidiary undertakings during the year (2015 - €2,191,000)
and reversed €1,900,000 (2015 - €124,000) against previous impairments.
The Company and Group are controlled by A J Langley, a Director of the Company.
Transactions between subsidiaries have been eliminated on consolidation and are disclosed in the individual
company Accounts.
31 FAIR VALUE MEASUREMENTS (continued)
GROUP Fair value at Valuation Significant 31 Dec 2015 technique input
€’000
Property, plant and equipment – Freehold property 109,562 Market Market price comparable per square metre approach for comparable properties
COMPANY Fair value at Valuation Significant 31 Dec 2015 technique input
€’000
Property, plant and equipment – Freehold property 21,864 Market Market price comparable per square metre approach for comparable properties
9796
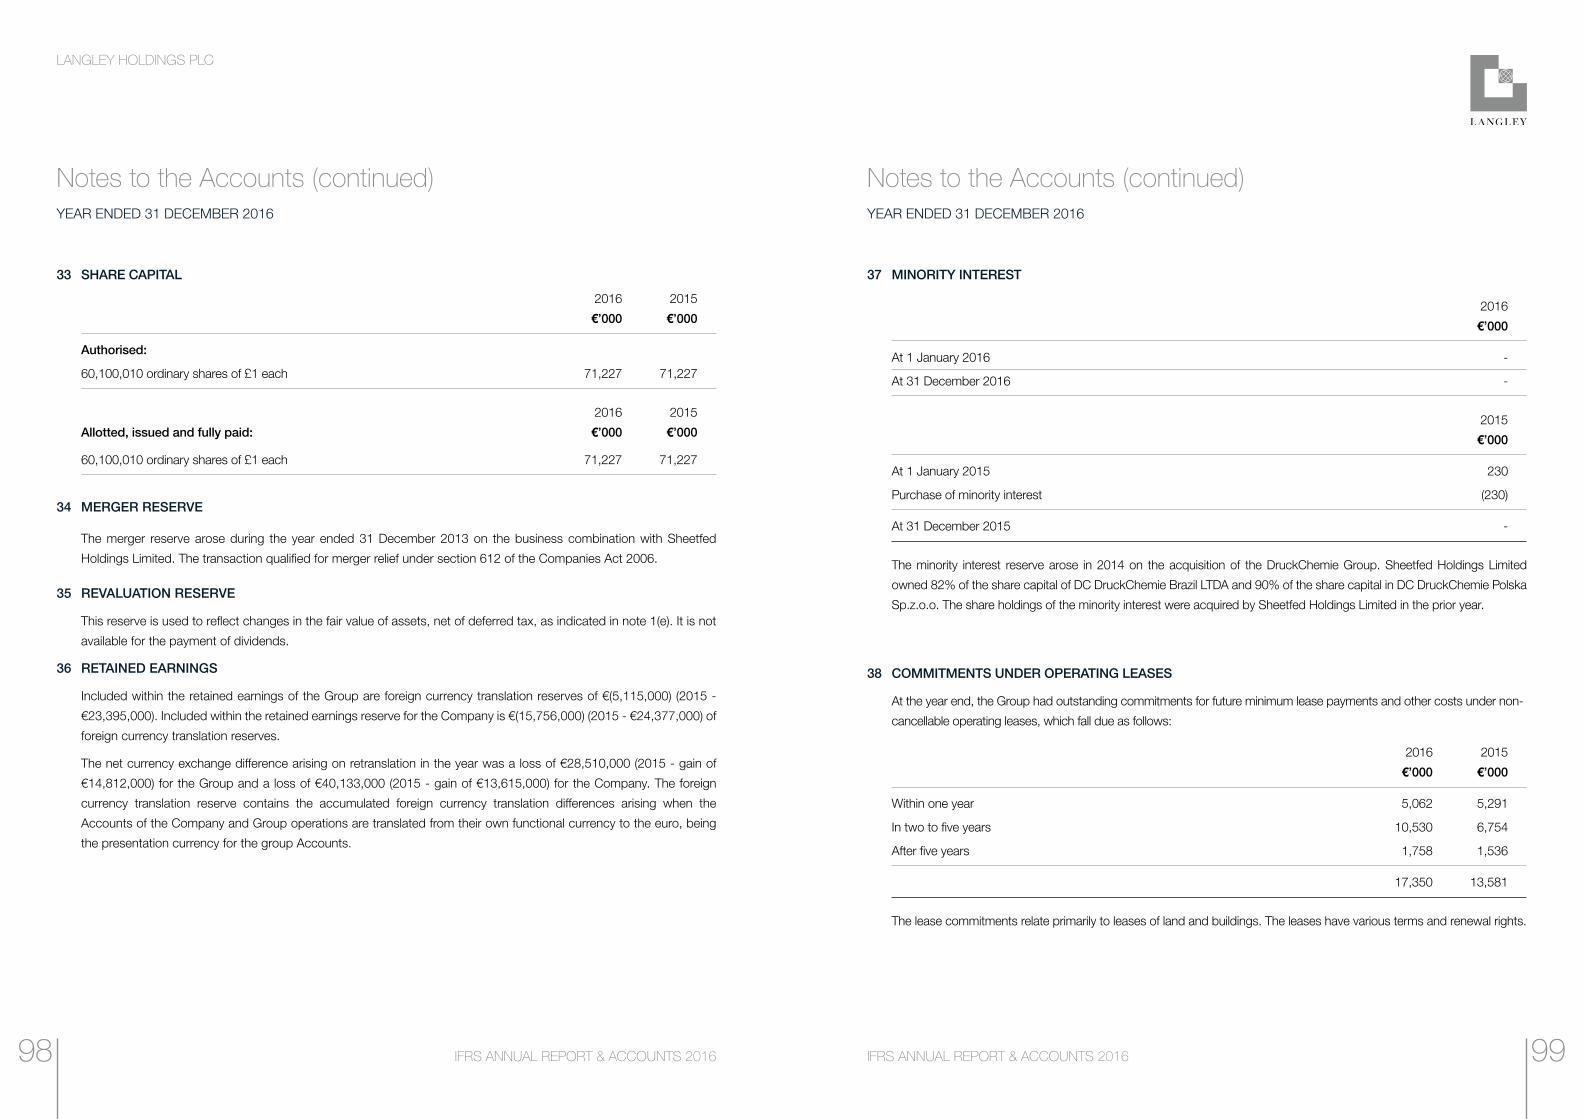
LANGLEY HOLDINGS PLC
IFRS ANNUAL REPORT & ACCOUNTS 2016IFRS ANNUAL REPORT & ACCOUNTS 2016
Notes to the Accounts (continued)YEAR ENDED 31 DECEMBER 2016
Notes to the Accounts (continued)YEAR ENDED 31 DECEMBER 2016
37 MINORITY INTEREST
2016
€’000
At 1 January 2016 -
At 31 December 2016 -
2015
€’000
At 1 January 2015 230
Purchase of minority interest (230)
At 31 December 2015 -
The minority interest reserve arose in 2014 on the acquisition of the DruckChemie Group. Sheetfed Holdings Limited
owned 82% of the share capital of DC DruckChemie Brazil LTDA and 90% of the share capital in DC DruckChemie Polska
Sp.z.o.o. The share holdings of the minority interest were acquired by Sheetfed Holdings Limited in the prior year.
38 COMMITMENTS UNDER OPERATING LEASES
At the year end, the Group had outstanding commitments for future minimum lease payments and other costs under non-
cancellable operating leases, which fall due as follows:
2016 2015
€’000 €’000
Within one year 5,062 5,291
In two to five years 10,530 6,754
After five years 1,758 1,536
17,350 13,581
The lease commitments relate primarily to leases of land and buildings. The leases have various terms and renewal rights.
33 SHARE CAPITAL
2016 2015
€’000 €’000
Authorised:
60,100,010 ordinary shares of £1 each 71,227 71,227
2016 2015
Allotted, issued and fully paid: €’000 €’000
60,100,010 ordinary shares of £1 each 71,227 71,227
34 MERGER RESERVE
The merger reserve arose during the year ended 31 December 2013 on the business combination with Sheetfed
Holdings Limited. The transaction qualified for merger relief under section 612 of the Companies Act 2006.
35 REVALUATION RESERVE
This reserve is used to reflect changes in the fair value of assets, net of deferred tax, as indicated in note 1(e). It is not
available for the payment of dividends.
36 RETAINED EARNINGS
Included within the retained earnings of the Group are foreign currency translation reserves of €(5,115,000) (2015 -
€23,395,000). Included within the retained earnings reserve for the Company is €(15,756,000) (2015 - €24,377,000) of
foreign currency translation reserves.
The net currency exchange difference arising on retranslation in the year was a loss of €28,510,000 (2015 - gain of
€14,812,000) for the Group and a loss of €40,133,000 (2015 - gain of €13,615,000) for the Company. The foreign
currency translation reserve contains the accumulated foreign currency translation differences arising when the
Accounts of the Company and Group operations are translated from their own functional currency to the euro, being
the presentation currency for the group Accounts.
9998
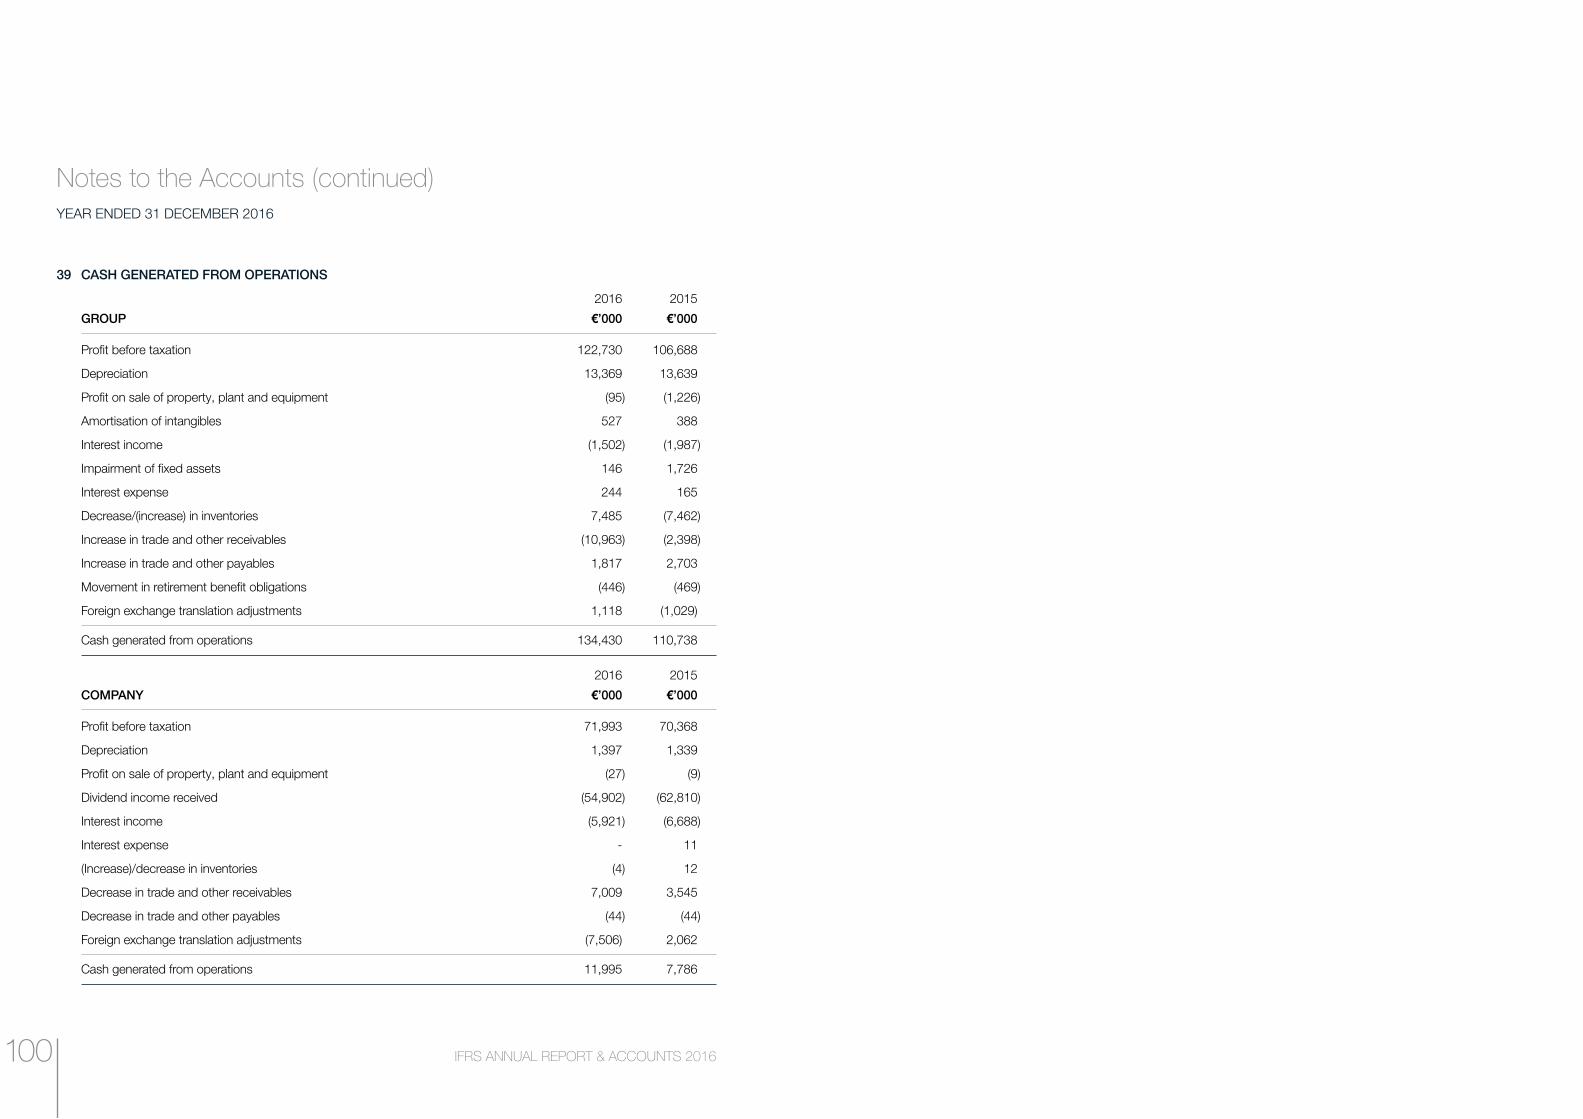
Notes to the Accounts (continued)YEAR ENDED 31 DECEMBER 2016
39 CASH GENERATED FROM OPERATIONS
2016 2015
GROUP €’000 €’000
Profit before taxation 122,730 106,688
Depreciation 13,369 13,639
Profit on sale of property, plant and equipment (95) (1,226)
Amortisation of intangibles 527 388
Interest income (1,502) (1,987)
Impairment of fixed assets 146 1,726
Interest expense 244 165
Decrease/(increase) in inventories 7,485 (7,462)
Increase in trade and other receivables (10,963) (2,398)
Increase in trade and other payables 1,817 2,703
Movement in retirement benefit obligations (446) (469)
Foreign exchange translation adjustments 1,118 (1,029)
Cash generated from operations 134,430 110,738
2016 2015
COMPANY €’000 €’000
Profit before taxation 71,993 70,368
Depreciation 1,397 1,339
Profit on sale of property, plant and equipment (27) (9)
Dividend income received (54,902) (62,810)
Interest income (5,921) (6,688)
Interest expense - 11
(Increase)/decrease in inventories (4) 12
Decrease in trade and other receivables 7,009 3,545
Decrease in trade and other payables (44) (44)
Foreign exchange translation adjustments (7,506) 2,062
Cash generated from operations 11,995 7,786
IFRS ANNUAL REPORT & ACCOUNTS 2016100

langleyholdings.com
Annual R
eport & A
ccounts 2016Langley H
oldings plc