lao it service market 2012
TRANSCRIPT

Vientiane Capital, March 2013
Lao IT Service Market 2012 Prepared for
The Project on Human Resource Development in the IT Service Industry at the NUOL Project, JICA By
Lao ICT Commerce Association (LICA)

2 | P a g e
© Japan International Cooperation Agency Prepared by:
LAO ICT COMMERCE ASSOCIATION (LICA)
Mr. Thanongsinh Kanlaya Mr. Thanousone Phonamat Mr. Anousa Souannavong Mr. Keovisouk Dalasane DISCLAIMER The views and opinions expressed in this publication do not necessarily reflect the views of the Japan International Cooperation Agency or of the Government of Japan.

3 | P a g e
TABLE OF CONTENTS
LIST OF FIGURES ................................................................................................................................................. 4 LIST OF TABLES .............................................................................................................................................. 4
ABBREVIATIONS AND ACRONYMS ................................................................................................... 6 EXECUTIVE SUMMARY ................................................................................................................................... 7
CHAPTER 1 : INTRODUCTION ............................................................................................................ 9 1.1 BACKGROUND ................................................................................................................................. 9 1.2 OBJECTIVES ..................................................................................................................................... 9 1.3 RESEARCH QUESTIONS .................................................................................................................... 9 1.4 DEFINITION OF KEY TERMS ........................................................................................................... 10 1.5 METHODOLOGY AND QUESTIONNAIRE .......................................................................................... 12 1.6 SURVEY FIELDWORK AND THE PARTICIPANTS ........................................................................................... 12
CHAPTER 2 : LAO IT INDUSTRY OVERVIEW ................................................................................. 14 2.1 LAO ECONOMIC OVERVIEW ........................................................................................................... 14 2.2 OVERVIEW OF TELECOMMUNICATIONS INFRASTRUCTURE IN THE LAO PDR. ................................................... 15
2.2.1 Telecom Sector ............................................................................................................................... 15 2.2.2 Internet Sector ................................................................................................................................ 15
2.3 REGULATORY ENVIRONMENT AND RELATED UPDATED ACTIVITIES ................................................................ 18 2.4 LAO IT BUSINESS INCUBATION CENTER (LIBIC) ........................................................................................ 19
2.4.1 Objectives of Lao IT Business Incubation Center (LIBIC) ............................................................. 20 2.4.2 Latest Development of LIBIC ......................................................................................................... 20
CHAPTER 3 : SURVEY FINDING FOR LAO IT SERVICE PROVIDERS ........................................ 21 3.1 CURRENT IT SERVICE LINE UP ....................................................................................................... 21 3.2 REVENUE OF RESPONDENT IT SERVICE PROVIDERS .................................................................................... 22 3.3 HUMAN RESOURCE OF IT SERVICE PROVIDERS ......................................................................................... 23
3.3.1 Age and Gender of IT Staffs at IT Service Providers ..................................................................... 23 3.3.2 Salary of IT Staffs at IT Service Providers ..................................................................................... 24
3.4 PROBLEMS AND CHALLENGES ....................................................................................................... 25 CHAPTER 4 : SURVEY FINDING FOR LAO IT SERVICE RECIPIENTS ....................................... 27
4.1 CURRENT IT SPENDING BY THE SERVICE RECIPIENTS .................................................................................. 27 4.2 HUMAN RESOURCE IN IT SERVICE RECIPIENTS .......................................................................................... 28
4.2.1 Age and Gender of IT Staffs at IT Service Recipients .................................................................... 28 4.2.2 Salary of IT Staff at IT Service Recipients ..................................................................................... 29
4.3 PROBLEMS AND CHALLENGES OF IT SERVICE RECIPIENTS ............................................................................ 30 CHAPTER 5 : INDUSTRY ESTIMATE AND FUTURE TREND ......................................................... 32
5.1 MARKET SIZE ESTIMATE FOR LAO IT SERVICE INDUSTRY ............................................................................. 32 5.2 DIRECTION OF IT SPENDING IN LAOS ...................................................................................................... 34 5.3 DIRECTION OF IT HUMAN RESOURCE ..................................................................................................... 35
CHAPTER 6 : LAO IT SERVICE INDUSTRY - A PROVINCIAL PROSPECTIVE ........................... 37 6.1 BACKGROUND INFORMATION ABOUT SAVANNAKHET ................................................................................. 37 6.2 BACKGROUND INFORMATION ABOUT PAKSE, CHAMPASAK ......................................................................... 38 6.3 DATA COLLECTION WORKSHOP ............................................................................................................. 39

4 | P a g e
6.4 BASIC FINDINGS ................................................................................................................................. 39 6.4.1 Situation of IT Human Resource in Savannakhet and Champasak ................................................. 39 6.4.2 IT Service Market in Savannakhet and Champasak ........................................................................ 40 6.4.3 Problems and Challenges in Savannakhet and Champasak ............................................................ 40
CHAPTER 7 : RECOMMENDATIONS ................................................................................................ 42 REFERENCES ....................................................................................................................................... 44 APPENDIX ............................................................................................................................................. 45
APPENDIX A: RESPONDENT IT SERVICE PROVIDERS – COMPANY AND CONTACT INFORMATION ........................................ 45 APPENDIX B: RESPONDENT IT SERVICE PROVIDERS – SERVICES OFFERING .................................................................... 48 APPENDIX C: LIST OF WORKSHOP PARTICIPANTS (COMMITTEE MEMBERS) .................................................................. 50 APPENDIX D: INTRODUCING LICA ........................................................................................................................ 51
List of Figures Figure 1 Composition of Participants at the Savannakhet Workshop ................................................................ 13 Figure 2 Nominal GDP, GDP Growth and Inflation Rates, 2007-2012 ............................................................ 14 Figure 3 Internet Gateway, as at January 2013 .................................................................................................. 17 Figure 4 Website of Phetsarath Font .................................................................................................................. 18 Figure 5 Google Added Lao Language to its Google Translate ........................................................................ 19 Figure 6 - Service Line up: Offering in 2012 and Planned for the Next Three Year ......................................... 21 Figure 7 Average Total Revenue and its Growth Rate of IT Service Provider Respondents ............................ 22 Figure 8 Problems and Challenges faced by IT Service Providers, 2010-2012 ................................................. 26 Figure 9 IT Service Spending by Service Recipient Respondents ..................................................................... 27 Figure 10 Problems and Challenges faced by IT Service Recipients, 2010-2012 ............................................. 31 Figure 11 Dynamics of Revenue of the IT Service Providers, 2012-2014 ........................................................ 32 Figure 12 Market Size Estimated with IT Service Providers’ Revenue ............................................................ 34 Figure 13 IT Spending Share by the IT Service Recipient Respondents, 2012-2014 ........................................ 35 Figure 14 Number of IT Professionals Working in IT Industry, 2009-2014 ..................................................... 36 Figure 15 Ratio of IT Professionals working for Service Provider vs. Total .................................................... 36 Figure 16 Problems and Challenges of IT Service Recipient in Savannakhet and Champasak, 2012 .............. 41
List of Tables Table 1 Survey Respondents classified by Types in 2009, 2010, 2011 and 2012 ............................................. 12 Table 2 Telephone Subscribers and Trends in the Lao PDR, 2008-2012 .......................................................... 15 Table 3 Internet Price, User and Subscriber Trend, 2008-2012 ......................................................................... 16 Table 4 Ratio of IT and Non-IT Employees of the IT Service Provider Respondents ...................................... 23 Table 5 Ratio of Sr. and Jr. IT Employees within IT Service Provider Respondents ........................................ 23 Table 6 Average Age of IT Staffs in IT Service Providers by Job Functions, 2010-2012 ................................ 23 Table 7 Ratio of Female and Foreigner IT Staffs at IT Service Provider .......................................................... 24 Table 8 Monthly Average Salary of IT Staffs in IT Service Providers by Job Functions, 2010-2012 .............. 25 Table 9 Ratio of IT and Non-IT Employees of the IT Service Recipient Respondents ..................................... 28 Table 10 Ratio of Sr. and Jr. IT Employees within IT Service Recipient Respondents .................................... 28 Table 11 Average Age of IT Staffs in IT Service Recipients By Job Functions, 2010-2012 ............................ 29 Table 12 Ratio of Female and Foreigner IT Staffs at IT Service Recipients ..................................................... 29 Table 13 Monthly Average Salary of IT Staffs in IT Service Recipients by Job Functions, 2010-2012 .......... 30 Table 14 Market Size Calculation for the Year 2012 ........................................................................................ 33

5 | P a g e
Table 15 Average No. of IT Staff in Service Recipient, Savannakhet + Champasak vs. Vientiane Capital in 2012 .................................................................................................................................................................... 39 Table 16 Ratio of Senior vs. Junior IT Staff, Savannakhet + Champasak vs. Vientiane Capital in 2012 ......... 40 Table 17 Ratio of Female IT Staff to Total IT Staff, Savannakhet + Champasak vs. Vientiane Capital, 2012 40

6 | P a g e
Abbreviations and Acronyms AEC ARPU ccTLD
ASEAN Economic Community Average Revenue Per User Country Code Top Level Domain
CCTV Closed-Circuit Television FDI Foreign Direct Investment GDP Gross Domestic Product GPS Global Positioning System ICT Information and Communication Technology IT Information Technology ITU International Telecommunication Union JICA LAK
Japan International Cooperation Agency Lao Kip
LANIC Lao National Internet Committee / Lao National Internet Center Lao PDR Lao People's Democratic Republic LIBIC Laos IT Business Incubation Center LICA Lao ICT Commerce Association MoST Ministry of Science and Technology MPT Ministry of Posts and Telecommunications NAST National Authority of Science and Technology NGO Non-Governmental Organization NUOL National University of Laos SNS Social Network Service USD United States Dollar
Exchange Rate
1 USD = 8,000 LAK (As at December 31, 2012)

7 | P a g e
Executive Summary The Government of Lao PDR and the Japan International Cooperation Agency (JICA) have been implementing a technical cooperation project, the Project on Human Resource Development for IT Service Industry at National University of Laos (hereinafter referred as ‘ITSD Project’), over the period between December 2008 and November 2013. The project consists of three components. (1) establishing a practical IT training course to develop ‘ready-made’ IT engineers; (2) establishing an ‘on-campus company’ to set up a business environment in the National University of Laos (NUOL); and (3) establishing an industry-academia-government circle to contribute to the environment for expanding local and foreign IT markets.
As part of its ‘on the ground’ activities, the ITSD Project needs to continuously understand and gauge the current situation of the local IT service market in Laos with the main purpose being to clarify the necessary measures to expand local IT market and to reflect the real market needed skills to the curriculum of the IT training courses. The current survey is the fourth consecutive one, following those done in 2009, 2010, and 2011. Besides Vientiane Capital, this year’s survey started to look into the IT service situation in the provinces by taking Savannakhet as a case study. The total number of completed survey participants is 185 in Vientiane and 29 in Savannakhet province. The Lao economy has been growing smoothly over the past several years. Overall improvement in the infrastructure of the country has also been evident, especially in the telecommunications sector. Mobile phone and internet services are improving both in terms of coverage and price performance. Access to 512Kbps internet connection has dropped from an average of $80/month in 2008 to $22/month in 2012. An e-transaction law has been approved by the National Assembly, Phetsarath Lao fonts are actively in use and Google kindly added Lao language to its Google Translate facility. A national CERT called LaoCERT was established in February 2012 under the Ministry of Post and Telecommunications (MPT) to deal with network and information security and coordinate with international certification bodies. The Lao IT Business Incubation Center (LIBIC), which was initiated and managed by the Project within the campus of Faculty of Engineering, National University of Laos, has been making progress in terms of inviting incubatees. It is now housing four incubatees working to deliver IT-related services to the community and creating positions for IT graduates. Most IT service providers are continuing to focus on the hardware business but the trend shows that in the next three years attention will be given to system development and web-based services. The revenue of IT service providers continues to grow at the pace of 15% to 20% per year. Around 1/3 of IT professionals working for the service providers are female. Foreign IT workers account for 4% of total IT workers in the service providers. Salary continues to grow, but not evenly, across each job function. Database and website related staff are getting paid better, reflecting the increasing demand in these tasks.
8 | P a g e
Price competition among the service providers, that was considered the most serious challenge back in 2010, has gradually been improved – at least from the point of view of the service providers. The price competition might remain but it is becoming a perceived factor among the providers. However, concern over the quality of employees (IT staff) has been growing over time. When the qualified human resources are limited, higher turnover rates could naturally follow. From the IT service recipient side, the biggest IT spending sector is financial services, resulting from growing number of commercial bank and financial related services. In general, the IT workers working in the service recipient side are offered higher pay than their counterparts in the provider side. Over the past three years most of the concerns have eased for the service recipients. Each of the challenges remain but at lesser levels. However, the issue of ‘insufficient qualified IT staff’ remains of high concern among the service recipients. For the overall view of the market, Lao IT services were estimated to be worth USD118 million in 2012 and projected to be worth USD124 million and USD131 million in 2013 and 2014 respectively. The main areas that the IT service recipients will spend their IT budget on are system integration and system maintenance. Numbers of total IT professionals were estimated at 4,439 in 2012. The number will climb to 4,854 and 5,493 in 2013 and 2014 respectively. Out of which about 1/4 are working in the service provider side. In order to attain an ideal situation in the next three to five years, a set of recommendations are presented for all stake holders in the IT service industry.

9 | P a g e
Chapter 1 : Introduction
1.1 Background The Government of Lao PDR and the Japan International Cooperation Agency (JICA) have been implementing a technical cooperation project, the Project on Human Resource Development for IT Service Industry at National University of Laos (hereinafter referred as the ‘ITSD Project’), between December 2008 and November 2013. The ITSD Project consists of the following three components: 1. Establishing a practical IT training course to develop ‘ready-made’ IT engineers; 2. Establishing an ‘on-campus company’ to set up a business environment in the National
University of Laos; 3. Establishing an industry-academia-government circle to contribute to the environment for
expanding the local and foreign IT market.
As part of its ‘on the ground’ activities, the ITSD Project needs to continuously understand and gauge the current situation within the local IT service market in Laos, with the main intention of:
• Clarifying necessary measures to expand local IT market; and • Reflecting real market-needed skills for the curriculum of the IT training courses.
The ITSD Project, therefore, has carried out IT service market research annually in 2009, 2010 and 2011. This current round of research in 2012 will mark the fourth of this series. Major expected outcomes were (1) to discover the market size of the IT service industry in Laos and its sales trend, (2) to understand the current situation with IT human resourcing in both the service provider and recipient sides, and, (3) last but not least, to understand the obstacles and challenges in expanding the IT service business or deploying IT systems.
1.2 Objectives Key objectives of this survey have, since the first one in 2009, been as follows:
• Clarifying the current situation of the Lao domestic IT service market, including the local outsourcing market, where possible;
• Reflecting the situation in the provinces is one of this year’s objectives. Therefore, the case of Savannakhet shall be discussed in the main findings;
• Analyzing the current situation and indicating the ideal situation in the near future (3-5 years); and
• Clarifying the necessary measures needed to realize the future ideal situation. (e.g. IT human resource needs, preferential tax treatment, cyber laws, etc.)
1.3 Research Questions

10 | P a g e
To address the above goals and objectives, and especially to capture the trends set in 2012 in comparison to the previous studies in 2009, 2010 and 2011, the study has continued its original attempts to answer the following questions:
• What services are the IT service providers in Laos currently concentrating on and planning for in the next few years?
• What are the dynamics in the IT human resource trends (number of professionals, average age, and salary classified by different tasks) for the Lao IT service industry?
• What is the current estimated size of Lao IT service market? • What are the major problems and challenges being encountered by the market participants,
i.e. IT service providers and IT service recipients? • What should be the best set of recommended policies and measures for various players in
the IT service industry ecology to further enhance the value of IT for the benefits of all?
1.4 Definition of Key Terms The following terms represent the main categories of tasks referred to in the questionnaires for both IT service providers and IT service recipients. To reflect the most practical tasks practiced by IT professionals in Laos, the list of tasks was simplified and grouped for the purpose of this survey. For the staff who might be involved in multiple tasks, only the one task that he/she was mostly involved with is suggested to be indicated. IT staffs’ skills are defined as followed: Programming - is the skills of designing, writing, testing, debugging/troubleshooting, and maintaining the source code of computer programs. The source code is written in a programming language. The code may be a modification of an existing source or something completely new. The purpose of programming is to create a program that exhibits a certain desired behavior (customization). The process of writing source codes often requires expertise in many different subjects, including knowledge of the application domain, specialized algorithms and formal logic. Web-based application development also falls under this category. Networking – the skills that entails the use of a network of computers and computer terminals by individuals at various locations to interact with each other by entering data into the computer system. Database Administration – covers the design, implementation, maintenance and repair of an organization’s database. The role of persons responsible include the development and design of database strategies, monitoring and improving database performance and capacity, and planning for future expansion requirements. The role may also involve planning, co-ordination and implementation of security measures to safeguard the database. Hardware and Software Support – includes works providing service support for systems and application issues for the day-to-day functioning of equipment, encompassing PCs, laptops, mobile devices, printers, peripherals, servers, networking and communications equipment.
11 | P a g e
Multimedia – involves the use of different media to convey information; text together with audio, graphics and animation, often packaged on CD-ROM but can be used in other environment such as internet, television and mobile devices as well. Web and Online Content- skills to design, development and maintenance of websites as well as the creation of mobile and online content which will be delivered to mobile and computer devices via mobile networks and the internet.
The service line up of the IT Service Providers are defined as followed:
IT consulting - This service focuses on advising businesses on how best to use information technology to meet their business objectives. This includes, but not limited to, business process analysis, system design, implementation planning, and system performance evaluation. IT education, training - This service involves tranfering IT know-hows in the areas of usage (for end users) and development (for IT developers).
Systems integration - The process of linking together different computing systems (hardware and networking devices known as infrastructure) and software applications physically or functionally to make them act as a coordinated whole. SW application: client-server - This involves the development of software application to be used in network environment where there is at least a central processing and storage system serving multiple client devices. Data center service - Data center services encompass all of the technology and facility-related components or activities that support the projects and operation of a data center, which is an environment that provides processing, storage, networking, management and the distribution of data within an enterprise. IT system maintenance and support - Maintenance service means those preventive, diagnostic, updating, replacement, and repair procedures that a service provider will perform for their clients' IT equipment. Support service denotes activities that keep users working or help users improve the ways they work. IT hardware and service – This involves selling of hardware equipment and providing service related to those hardware that have been sold.
Website and online contents- Design and development of websites using various technologies including web-based applications (software running on HTTP) such as content management systems.
IT security - This can be a subset of IT consulting service but more specific to security aspects of an IT system. Some examples of this service lineup are risk analysis and management of an IT system, some aspects include virus threats, intrusion detection and prevention, physical security, data encryption, etc.

12 | P a g e
Furthermore, the terms junior and senior IT staff are used in the study to refer to those staff who have total working experience of less than 3 years (< 3yrs) and of equal to or more than 3 years (≥ 3yrs) respectively.
1.5 Methodology and Questionnaire Since the first survey took place in 2009, there has not been any other publicly available comparable data. This year, therefore, the study team continues to deploy a method of field data collections from the IT service providers and recipients. However, what makes this year’s survey difference is the inclusion of a study of Savannakhet province through a data collection workshop conducted on 10th December, 2012. To meet the goal of updating statistical data gathered in the previous surveys (2009, 2010, and 2011), the survey team continued to use the same approach and same time period of the year, but where possible tried to maximize the number of samples. Two sets of different questionnaires were designed – one for IT service provider and another one for IT service recipient - in both Lao and English languages. Both traditional paper-based and online forms of questionnaires were prepared. To reflect a series of advice obtained from the previous years’ workshops, additional questions on IT human resources, such as the number of foreign IT staff and the number of female IT staff, were included in this year’s questionnaires.
1.6 Survey Fieldwork and the Participants In Vientiane Capital, totally, 85 IT service providers and 315 IT service recipients from different industry sectors were approached by the survey team during the period from 1st November 2012 to 30th December 2012. The outcome was that 35 and 150 respondents replied to the questionnaire from provider side and recipient side respectively. Table 1 shows how the respondents have changed over the past four years. Table 1 Survey Respondents classified by Types in 2009, 2010, 2011 and 2012
Type of Respondents 2009 2010
2011
2012
Vientiane Capital
2012 Savannakhet and Champasak
IT Service Recipients 14 122 147 150 29 IT Service Providers 21 31 33 35
IT Educational Institutes 5 Total
40 153 180 185
29

13 | P a g e
Source: Lao IT Service Market Reports for year 2009, 2010, and 2011 In year 2009, IT educational institutes had their own category. However, in subsequent years they were included in the provider side being regarded as a kind of IT training service. In general, over the past years the number of survey respondents has increased from both provider and recipient sides. In Savannakhet Province our first ever data collection workshop was held on 10th December 2012. As a result, 29 companies and organizations from Savannakhet and Champasak provinces took part in the workshop. A detailed breakdown of the 29 participants is presented in Figure 1.
Figure 1 Composition of Participants at the Savannakhet Workshop

14 | P a g e
Chapter 2 : Lao IT Industry Overview
2.1 Lao Economic Overview According to the World Bank’s Lao Economic Monitor, November 2012, the Lao economy is expected to grow at 8.2 percent in 2012 to USD9.43 billion, as noted in Figure 2, the national economy benefiting from growth in the construction, manufacturing, mining and service sectors. One key driver for this performance on the demand side is the surge in investment this year in infrastructure and housing, some of which are related to preparation for the 9th Asia-Europe Meeting (ASEM9) convened in Vientiane Capital. On the supply side, this development has a positive spillover to the manufacturing sector through increased demand for cement and construction materials. In addition, food and beverages benefit from greater domestic demand. Furthermore, higher wholesale and retail trading as well as transport and telecommunications will drive the service sector this year. Agricultural output also rebounded from the impact of floods in the previous year. In the mining sector, increased resource extraction as a result of the current copper-gold project upgrades and the operation of a new gold-silver project will offer a higher contribution to growth compared to the previous year. Inflation has trended downward driven by lower rates of food and energy inflation. Food inflation significantly declined from 8.2 percent in March to 3.6 percent in October driven by the continued fall in rice prices, resulting from government controls of rice exports. Falling rice prices have led to some farmers switching to other more profitable cash crops or alternatively moving to non-farm employment.
Figure 2 Nominal GDP, GDP Growth and Inflation Rates, 2007-2012 Source: Lao PDR Economic Monitor – all data are the latest revised for November 2012, World Bank * Note: (e) for estimate.

15 | P a g e
2.2 Overview of Telecommunications Infrastructure in the Lao PDR.
2.2.1 Telecom Sector Lao PDR has made significant progress in strengthening its telecommunication infrastructure, attracting more foreign investment into the sector and introducing the latest telecom technologies. The sector is still dominated by mobile telecommunications. Fixed line services are limited and are in less demand. Internet users have been growing very fast for the last two years thanks to the nation-wide deployment and network expansion of 3G and 4G networks. The mobile market has been surging in a particularly sustained fashion, especially since 2004/05. Coming into 2013, mobile penetration was estimated to have passed the 75% mark. It is estimated that there were around 5 million subscribers. In 2012, the government introduced and enforced the requirement that mobile prepaid users needed to be registered before their SIM cards could be activated. This process has helped making the statistics of mobile user numbers more accurate. If we compare with our last year’s report, we notice a significant drop in the number of mobile subscriber numbers as they have been adjusted and corrected. 3G Mobile Services - Lao Telecom launched 3G mobile services in the year 2008, followed by Unitel. ETL and Beeline (formerly Tigo) then followed with their 3G services in 2011. LTE / 4G Services – A number of operators launched advanced wireless services from 2011 onwards. ISP Planet launched a 4G WiMAX service. This was followed by Beeline launching what was described as a 4G service. In October 2012 LTC launched a 4G LTE service specifically to provide 4G broadband services during the ASEM9 meeting. Fixed line services have not been growing much as they are mainly used for corporates, organizations and some households. It is estimated that the number of fixed subscribers had increased by 5,000 per year or less than 5% annually. This growth includes the Wireless Local Loop (WLL) subscribers. Table 2 Telephone Subscribers and Trends in the Lao PDR, 2008-2012
2008 2009 2010 2011 2012 (E) Fixed Line Subscribers 106,400 119,200 126,200 140,000 150,000
Growth Rate
12% 6% 11% 7% Mobile Subscribers 1,943,100 3,234,600 4,003,400 4,600,000 5,000,000
Growth Rate
66% 24% 15% 9% Source: Ministry of Post and Telecommunications, BuddeComm and ITU
2.2.2 Internet Sector The number of internet users in Laos is growing quickly and had passed the 10% penetration mark by the end of 2012. It is interesting to note, according to IWS – the Internet World Stat – there are more than 250,000 Lao people subscribing to Facebook accounts as at the end of 2012, representing a Facebook user penetration of 3.9%.
16 | P a g e
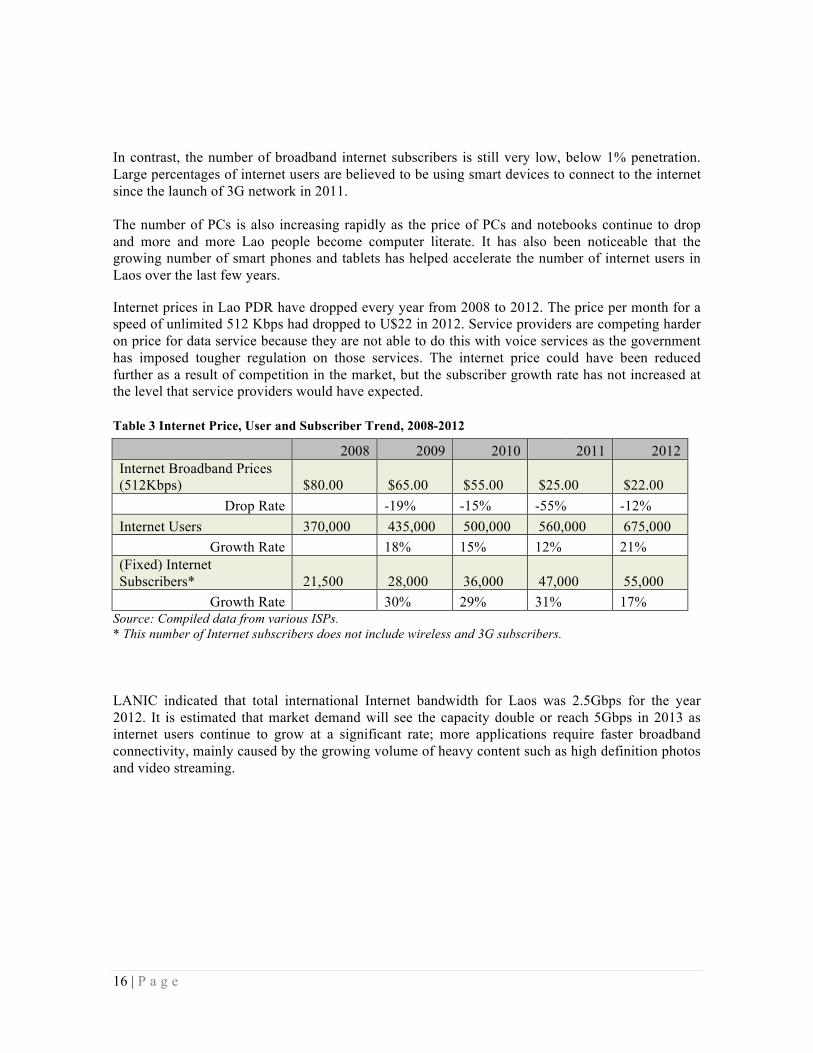
In contrast, the number of broadband internet subscribers is still very low, below 1% penetration. Large percentages of internet users are believed to be using smart devices to connect to the internet since the launch of 3G network in 2011. The number of PCs is also increasing rapidly as the price of PCs and notebooks continue to drop and more and more Lao people become computer literate. It has also been noticeable that the growing number of smart phones and tablets has helped accelerate the number of internet users in Laos over the last few years. Internet prices in Lao PDR have dropped every year from 2008 to 2012. The price per month for a speed of unlimited 512 Kbps had dropped to U$22 in 2012. Service providers are competing harder on price for data service because they are not able to do this with voice services as the government has imposed tougher regulation on those services. The internet price could have been reduced further as a result of competition in the market, but the subscriber growth rate has not increased at the level that service providers would have expected. Table 3 Internet Price, User and Subscriber Trend, 2008-2012
2008 2009 2010 2011 2012 Internet Broadband Prices (512Kbps) $80.00 $65.00 $55.00 $25.00 $22.00
Drop Rate -19% -15% -55% -12% Internet Users 370,000 435,000 500,000 560,000 675,000
Growth Rate 18% 15% 12% 21% (Fixed) Internet Subscribers* 21,500 28,000 36,000 47,000 55,000
Growth Rate 30% 29% 31% 17% Source: Compiled data from various ISPs. * This number of Internet subscribers does not include wireless and 3G subscribers. LANIC indicated that total international Internet bandwidth for Laos was 2.5Gbps for the year 2012. It is estimated that market demand will see the capacity double or reach 5Gbps in 2013 as internet users continue to grow at a significant rate; more applications require faster broadband connectivity, mainly caused by the growing volume of heavy content such as high definition photos and video streaming.

17 | P a g e
Figure 3 Internet Gateway, as at January 2013 Source: LANIC, Ministry of Posts and Telecommunication *Abbreviations in Figure 3 are listed as per follows: CAT: CAT Telecom (Thailand) True: True International Gateway (Thailand) Viettel: Viettel Telecom (Vietnam) CT: China Telecom (China) LTC: Lao Telecom Company (Laos) ETL: ETL Public Company (Laos) VLL: VimpelCom Lao (Laos) STL: Star Telecom Lao (Laos) LANIC: Lao National Internet Center E-Gov: E-Government Center (Laos) Planet: Planet Computers (Laos) SKY: Sky Telecom (Laos)

18 | P a g e
2.3 Regulatory Environment and Related Updated Activities The Ministry of Posts and Telecommunications (MPT, http://www.mpt.gov.la), was established in June 2011 to administer the ICT sector, thereby replacing the NAPT in the performance of this role. The e-government center has also been transferred from the National Authority of Science and Technology (NAST) to be operating under the MPT. The MPT was one of four new ministries approved during the first session of the National Assembly in 2011. The newly created ministry committed itself to managing a range of important issues including ‘making sure that more people in rural areas can access the internet and obtain information they can use to improve their livelihoods.’ The ministry also aimed to expand the use of the Lao language option on mobile phones and incorporate mobiles in areas such as mobile banking. In December 2011, the ministry officially launched the Phetsarath font1 as the national standard for Lao. This font can be used with both computers and mobile devices.
Figure 4 Website of Phetsarath Font Source: http://phetsarath.gov.la/ In September 2012, Google announced that it had added Lao language to the Google Translate as its 65th language. It is still designated with an “alpha” status, because the translation quality is still low compared to that of other languages. The Google Translate team is constantly working to improve the quality. The official font ‘Phetsarath OT’ was included in the Google web-font and a virtual Lao keyboard has also been incorporated into the Google system.
1 An official site of Phetsarath font is available at http://phetsarath.gov.la/

19 | P a g e
Figure 5 Google Added Lao Language to its Google Translate Source: http://thenextweb.com/google/2012/09/13/google-adds-lao-translate-grand-total-65-languages/ The draft law on electronic transactions was approved by the Government of Laos in October 2012 and was discussed by members of the National Assembly in December 2012. Once it is approved, it is expected to help boost e-commerce and related businesses in Laos. In response to the approval of the electronic transaction law, we can start to see some IT service providers gaining Certificate Authority (CA) status by join venture with foreign service providers such as those from Vietnam.
2.4 Lao IT Business Incubation Center (LIBIC) Laos IT Business Incubation Center (LIBIC) is one of main activities of the Project on Human Resource Development in IT Service Industry at the Department of Computer Engineering and Information Technology, the Faculty of Engineering, National University of Laos supported by JICA. This activity has become the first of such business incubation centers in Lao PDR and is designed to promote entrepreneurial leadership across all disciplines, facilitate entrepreneurial activity amongst incubatees, and invite entrepreneurs to use incubator services so as to develop end-products for commercialization. LIBIC will enable, not only new graduates from the universities, but also members of the general public who are keen to become an IT entrepreneurs, to start such business applications very quickly but with sound business practices through proper support from existing IT business operators, faculties and the National University of Laos.

20 | P a g e
2.4.1 Objectives of Lao IT Business Incubation Center (LIBIC) LIBIC was established with objectives:
a. To create an environment for developing sustainable IT businesses in Laos; b. To build up a community of information technology and innovation in Laos; c. To become the national benchmark (model) for the University Business Incubator
nationwide; and d. To create an impact on the development of Lao PDR in terms of establishing value added
jobs and IT business services.
2.4.2 Latest Development of LIBIC Since its inauguration in 2012, LIBIC has successfully accepted the following four incubatees into its program:
a. Laosangfanh Co., Ltd. b. LaoDiGi Co., Ltd. c. AMZ CRESCERE Co., Ltd. d. Champapa International Trade eCommerce Co., Ltd.
This initiative will definitely promote and encourage more young Lao IT entrepreneurs to start new IT businesses and eventually contribute to the overall development of the IT service industry.

21 | P a g e
Chapter 3 : Survey Finding for Lao IT Service Providers This chapter reports survey findings from the respondent IT service providers. Findings from the providers largely contained information on current and planned service offerings, human resources data on average age, salary, rough estimation of income generated among the respondent firms, as well as problems and challenges encountered by the service providers.
3.1 Current IT Service Line up From Figure 6, one can see that almost 60 percent of IT service provider respondents are currently offering ‘IT system maintenance & support’ and ‘IT hardware and service’. Interestingly, all service segments except ‘IT system maintenance & support’ and ‘IT hardware & service’ will be expanding over the next 3 years, especially ‘Mobile Application’ and ‘Website Content Development’ segments promise significant increases. More details on the service lineup of the IT service providers who participated in this survey are enclosed in Appendix B of this report.
Figure 6 - Service Line up: Offering in 2012 and Planned for the Next Three Year Note: CCTV is Closed-Circuit Television; GPS is Global Positioning System

22 | P a g e
3.2 Revenue of Respondent IT Service Providers From the perspective of a big picture, when combining revenues collected from the survey participants, one can see that revenue is expected to increase from 2012 to 2014 with a growth rate of 40 percent in 2013 compared to the previous year. However, even though the revenue figure is expected to reach almost USD 50 million in 2014, its growth rate will drop to 36 percent compared to 2013. (Millions USD)
Figure 7 Average Total Revenue and its Growth Rate of IT Service Provider Respondents If one carefully looks at the Figure 6 and Figure 7 together it would not be difficult to identify, at least from the IT service providers’ perspective, where the growing demand will coming from. Over the next three years, growth segments seem to be with IT consulting, training and education. Software application and mobile application together with website contents and security as a whole will be experiencing relatively robust growth as well. Whether this will turn out to be the actual picture for the IT service industry over the next three years or not remains to be seen, with the demand determinants like IT service recipients playing a key role in supporting this growth proposition.

23 | P a g e
3.3 Human Resource of IT Service Providers Table 4 shows that the number IT staff within service provider companies has accounted for about 36 percent of total employees in 2012. Comparing the figure with the previous year’s survey (2011), we can see an increase of 6 percent. This is possibly explained by the fact that when business grows the requirement for technical staff to perform tasks follow suit. As a result, there is a slight decrease in number of non-IT staff within IT companies. But this in turn could have been because the increase in non-IT staff in previous years was more than enough to offset the demand in the following years. Table 4 Ratio of IT and Non-IT Employees of the IT Service Provider Respondents
2010 2011 2012 Number of IT Staff 214 (33%) 216 (30%) 281 (36%) Number of Non-IT Staff 443 (67%) 503 (70%) 499 (64%) The study shows that about one third of IT staff are categorized as Senior IT staff whereas the rest are juniors. This ratio has remained more or less unchanged since 2010 – with a little swing of 4 percent. Please also note that the meaning of Senior IT staff is not relevant to age, but more about experience in a particular field and being employed by the company for more than 3 years. as depicted in Table 5. Table 5 Ratio of Sr. and Jr. IT Employees within IT Service Provider Respondents 2010 2011 2012 Senior IT Staff (32%) (28%) (32%) Junior IT Staff (68%) (72%) (68%)
3.3.1 Age and Gender of IT Staffs at IT Service Providers In relation to the age of IT staff, as it can be seen from the following Figure, one can see that the oldest of average age of Senior IT staff is 34.3 years old and being involved in Database Administration. Youngest Junior IT staff has average age of almost 23.8 years old. This is probably right after they have graduated from a university and have entered the labor market. Table 6 Average Age of IT Staffs in IT Service Providers by Job Functions, 2010-2012
Senior IT Staff Junior IT Staff
Job Functions 2010 2011 2012 2010 2011 2012
Programming 28.5
28.9
30.1
23.6
23.5
23.8
Networking 30.3
29.7
31.0
25.9
26.0
25.7
Database Administration 34.8
33.0
34.3
26.0
25.9
26.6

24 | P a g e
Hardware and Software Support
31.5
33.2
33.2
27.2
26.3
26.6
Multimedia
25.6
28.0
29.5
22.0
26.2
24.8
Website and Online Contents
29.7
30.5
30.0
23.6
25.5
25.0
Others 32.5
33.0
33.0
30.4
33.0
28.9
After running this survey for a number of consecutive years, we are luckly enough to be able to compile some small time series data on the changing average age of IT staff when considered by job functions. For the past three years, Table 6 indicates that the trends is non-linear but rather shows that the Senior staff are aged around 30 years, while the Junior ones are around 25 years old. Following some useful comments from previous workshop participants, this year the survey included questions on ratio of female IT staff and of foreign IT staff. The results yield interesting figures. Table 6 illustrates the fact that Female IT staff account for as much as one third of total IT staff in IT service providers. An equally interesting fact is the ratio of foreign IT staff working in Lao IT service providers currently stands at 4%. This number is not that big, but certainly it presents some facts about the excess demand of IT human resources that is not being filled by the local IT professionals. Table 7 Ratio of Female and Foreigner IT Staffs at IT Service Provider
2012 Ratio of Female IT Staffs 32% Ratio of IT Staffs with Foreign Nationality 4%
3.3.2 Salary of IT Staffs at IT Service Providers IT staff salary is one of the issues that IT company managers are interested in because it is considered a major reason for ‘job hopping.’ The study shows that the highest average salary of senior IT staff is more than $550 per month for a Database Administrator (Table 8). This may be because of limited number of people with this kind of specialization. Furthermore, this kind of expertise is backed up by internationally recognized certification, which makes this occupation unique and privileged. The second highest average salary for senior IT staff is for those involved in the networking segment, amounting to more than $464 per month. For juniors, one can see that the highest salary is for those working in the website and online content segment and multimedia. These segments are considerably new, thus quickly embraced by the younger staff. But this is in fact also the most underserved demand in the IT human resource market. Some providers do import skillful website and online contents staff from neighboring countries.

25 | P a g e
Table 8 Monthly Average Salary of IT Staffs in IT Service Providers by Job Functions, 2010-2012
Senior IT Staff Junior IT Staff
Job Functions 2010 2011 2012 2010 2011 2012 Programming $357 $330 $342 $165 $177 $180 Networking $483 $464 $464 $197 $215 $215 Database Administration $595 $560 $554 $150 $192 $245 Hardware and Software Support $256 $336 $348 $150 $181 $205 Multimedia n.a $325 $399 n.a $217 $298 Website and Online Contents $325 $350 $400 $188 $153 $318 Others $400 $350 $350 $267 $150 $180
The figures for the monthly average salary of IT staff in the IT service provider side present a mixed picture. They dynamically change over time, reflecting the changing technology and skills needed on one hand; the growing supply of new graduates and job hopping on the other hand explains what we witness in Table 8: the monthly average salary of IT staff in IT service providers classified by job functions over the past three years.
3.4 Problems and Challenges Having run the same surveys over the past years, the attempt to capture the sentiments of how the service providers see their problems and challenges is showing very clear trends, as illustrated in Figure 7 below. Price competition among the service providers, considered the most serious challenge back in 2010, has gradually been improved – at least from the point of view of the service providers. Price competition might remain but it is becoming a less significant factor among the providers. Concerns regarding too limited support from the government continue to worry the service providers. Especially, when competition goes beyond national borders: it not only the competitors among the domestic providers but providers from other countries that are making their way into local market. Another observation is that the concern over the quality of employees (IT staff) has been growing over time. When the qualified human resources are limited, higher turnover rates could naturally follow.

26 | P a g e
Figure 8 Problems and Challenges faced by IT Service Providers, 2010-2012

27 | P a g e
Chapter 4 : Survey Finding for Lao IT Service Recipients This chapter reports survey findings from the respondent IT service recipients, therefore on the current situation of their IT spending, a snapshot of IT human resource, and problems and challenges the IT service recipients are facing. With 150 IT service recipients responded to the survey, the study team was able to reach some meaningful finding as follows.
4.1 Current IT Spending by the Service Recipients Figure 8 shows continuous growth in IT spending by all sub-groups of recipients, namely financial services, energy and mining, telecom, government, and others. (In Thousand USD)
Figure 9 IT Service Spending by Service Recipient Respondents

28 | P a g e
Survey found that the ongoing and growing amount of IT spending is underpinned by the following: • New and fresh investment in hardware and network expansion by the growing number of
new investors in Laos, especially the commercial banks; • Hardware replacement or upgraded investment by some existing commercial banks and
mining companies; and • Some recipients in trading and service sectors starting to embrace the power of IT by
directing some budget into investment in new complex IT system, the upgrading of existing IT systems and deciding on certain application development to improve their operations.
4.2 Human Resource in IT Service Recipients The ratio of IT vs. non-IT staff within the IT service recipient respondents in Table 9 below shows almost no change at all when the 2012 results are compared to those of year 2010 and 2011. The IT staff account for 3% to 4% of total workforces. Table 9 Ratio of IT and Non-IT Employees of the IT Service Recipient Respondents 2010 2011 2012 Number of IT Staff 1,026 (4%) 943 (3%) 1,105 (4%) Number of Non-IT Staff 25,296 (96%) 29,921 (97%) 30,082 (96%) Within the IT employee category, Table 10 shows that the ratio of Senior to Junior is again almost unchanged from year 2010 to 2011. It is Senior/Junior ration of 1:1.5. Table 10 Ratio of Sr. and Jr. IT Employees within IT Service Recipient Respondents 2010 2011 2012 Senior IT Staff 39% 37% 38% Junior IT Staff 61% 63% 62%
4.2.1 Age and Gender of IT Staffs at IT Service Recipients The average age of IT staff working for IT service recipients, as indicated in Figure 11, are no different from those working at IT service providers. The highest average was 34 years old for those in charge of Database Administration and Hardware, while the youngest average was in the areas of creativity like Multimedia and Website content. When we look into the three year data in Table 11, the trend has been consistent, showing that the senior position of Database Administration and Hardware are by average older than other tasks. And at the junior end, the Multimedia, Website Content and Programming are by the average the youngest groups among the IT staff within the organizations of the IT service recipient.

29 | P a g e
Table 11 Average Age of IT Staffs in IT Service Recipients By Job Functions, 2010-2012
Senior IT Staff Junior IT Staff
Job Functions 2010 2011 2012 2010 2011 2012
Programming 29.8
31.2
31.3
24.3
25.6
24.8
Networking 31.1
31.0
32.3
26.2
26.2
28.3
Database Administration 33.9
32.0
34.1
26.9
26.0
27.0
Hardware and Software Support 31.8
32.0
34.2
27.3
25.9
27.0
Multimedia 28.2
29.4
29.8
26.5
25.5
25.4
Website and Online Content 29.9
30.8
31.0
25.5
26.1
26.0
Others 33.0
33.5
32.8
26.6
26.3
27.5
When we turn to the issues of female in IT and foreign IT staff in service recipient side, we see lesser ratio of female IT staff, just 13%, where the service provider has 32% of IT jobs employing females. A stunning surprise from Table 12 is the ratio of foreign IT staff standing at 8% of total IT staff. This is quite alarming for local IT engineers. But at the same time it is worth finding out why this is happening. Some recipient organizations cited the complex IT systems that require high levels of IT skills. Therefore, rather than seeking local talent the service recipients tend to trust and hire staff from abroad. Table 12 Ratio of Female and Foreigner IT Staffs at IT Service Recipients
2012 Ratio of Female IT Staffs 13% Ratio of IT Staffs with Foreign Nationality 8%
4.2.2 Salary of IT Staff at IT Service Recipients The snapshot of IT staff salaries in 2012 at IT service recipients shows a slightly differnet picture of which job functions are getting the highest average pay. From the service recipient’s data, as shown in Figure 12, the Senior and Junior staff taking up the functions of Networking and Database Administration are getting the highest average monthly salary. The average salary of IT employees in the service recipient side in 2011 had fallen slightly compared to year 2010 (clearly shown in Table 13), but mostly recovered in 2012. This cannot be easily explained, but should be simply taken as the labor market dynamics. The demand and supply

30 | P a g e
factors of the IT professional might have been interplaying over the past three years in the labor market. Table 13 Monthly Average Salary of IT Staffs in IT Service Recipients by Job Functions, 2010-2012
Senior IT Staff Junior IT Staff
Job Functions 2010 2011 2012 2010 2011 2012 Programming $407 $310 $354 $250 $234 $268 Networking $576 $460 $530 $249 $232 $272 Database Administration $446 $511 $523 $210 $224 $285 Hardware and Software Support $466 $352 $423 $228 $235 $238 Multimedia $267 $250 $350 $178 $204 $248 Website and Online Contents $255 $261 $400 $168 $189 $229 Others $400 $450 $435 $235 $212 $245
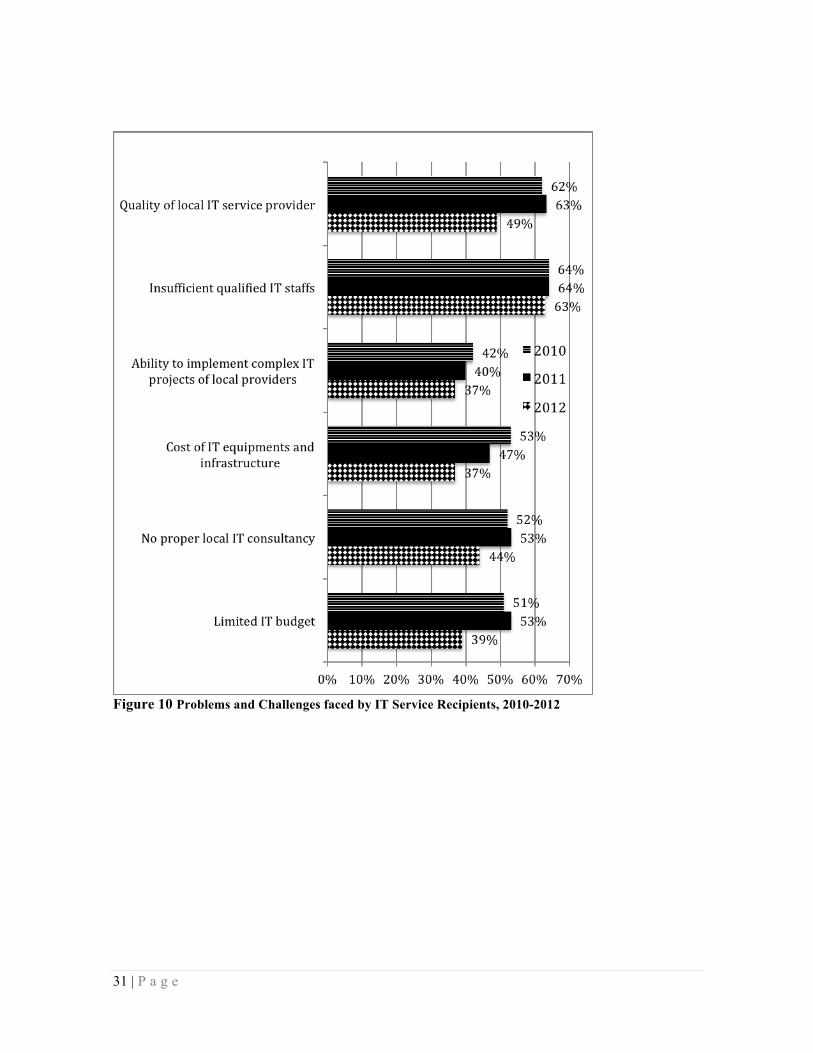
4.3 Problems and Challenges of IT Service Recipients From the Figure 9, it seems that over the past three years most of the business concerns have eased for the service recipient. Each of the challenges remain but at lower levels. However, the issue of ‘insufficient qualified IT staff’ remains of high concern among the service recipients. This might be partially responsible for the 8% ratio of foreign IT staff in Table 12 above. The one concern that has improved significantly is the ‘quality of local IT service provider’. Again, it remains to be seen in the longer term. But at this point in time this is in fact the concern that has improved by almost 14 percentage points when compared to 2010 and 2011.
31 | P a g e
Figure 10 Problems and Challenges faced by IT Service Recipients, 2010-2012

32 | P a g e
Chapter 5 : Industry Estimate and Future Trend
5.1 Market Size Estimate for Lao IT Service Industry Just as we did in previous years, we have estimated the market size from the side of IT service providers. However, this year we hoped to estimate with greater accuracy by including a numbers of additional factors. Details will be discussed in the remainder of this chapter. Figure 10 shows how the IT service provider respondents were expecting to grow and become bigger companies in the next few years. It looks like the majority of these respondents will be bigger and moving into a revenue block of USD200,000 to USD500,000 by year 2014. The 2012 figures are an estimate for the current year and 2013 and 2014 are both future projections.
Figure 11 Dynamics of Revenue of the IT Service Providers, 2012-2014 Table 14 illustrates the method we used to calculate the market size. This year, to be more realistic, we included the factors like the growth rate of the number of IT service providers. We used a proxy to project the future growth rate by taking the average growth rate of respondent providers’ combined growth over the past three years, which was 17%. To be even more to the point, LICA estimated from its own membership discussions that when a new IT company starts up, it is least likely that it will be starting out with a size of USD5 million or USD1 million. LICA indicated that 80% of new companies are starting out with revenue block of USD0-USD100K, 15% at USD100K – USD200K, and 5% at USD200K – USD500K.

33 | P a g e
After taking the above assumptions and propositions into account, we are ready to estimate the market size of year 2012 and forecast that of 2013 and 2014 with a similar method. Table 14 Market Size Calculation for the Year 2012 Revenue Block of the Respondents
No. of Samples Per Block
Share of New Entrant by Rev. Block
Ratio of Resp. by Rev. Block Over Total Resp.
Estimated Current Number of Comp. *
Avg. Rev. Range (1,000 $)
Estimated Market Size for 2011 (1,000 $)
(1) (2) (3) (4)=(2)/35 (5)=158*(4) (6) (7)=(5)x(6) $0 - 100K 12 Not
applicable 34% 54.15 50 2,708
$100K - 200K 8 23% 36.10 100 3,610 $200K - 500K 5 14% 23.56 350 7,898 $500K-1M 4 11% 18.05 750 13,539 $1M-3M 3 9% 13.54 2,000 27,077 $3M-5M 2 6% 9.03 4,000 36,103 > $5M 1 3% 4.51 6,000 27,077 35 100% 158 118,012 Source: Calculation by the survey team. *Note: Estimated number of companies for all revenue blocks is estimated to be 158. It is yielded by using the base number of 35 in 2011. i.e. 135 + (135*17%). Figure 11 indicates the growing size of the Lao IT service market since 2008. However, please note again that the estimation method for year 2012 – 2014 has been improved with more factors being incorporated.

34 | P a g e
Figure 12 Market Size Estimated with IT Service Providers’ Revenue It is necessary to note that IT service revenue includes income from both hardware and software sales. LICA estimates the share of the hardware sales is around 50 % to 60 % of the total IT service market revenue;
5.2 Direction of IT Spending in Laos Figure 12 shows the direction of spending by IT service recipients in Laos. These of course reflect the view of those participants in our surveys. In years 2012 and 2013 hardware will continue to dominate the spending list, but will decline in 2014. System maintenance and software applications in contrast will be gaining in 2013 and 2014. Security and Website contents are another two that will be seeing upward trends in the next few years. Education, training and data center activity will not see much of an increase in spending but will certainly remain relevant.

35 | P a g e
Figure 13 IT Spending Share by the IT Service Recipient Respondents, 2012-2014
5.3 Direction of IT Human Resource An industry wide estimated number of IT human resources from both service providers and recipients was derived from an inference available from samples involved in this survey. The 35 service provider respondents represent, on average, 25 percent of the total number of players in the market; while the 150 service recipient respondents, on average, stand for one third of the total number of market participants. Thus, the estimated number of IT service providers for the industry overall in 2012 is calculated as followed: 281 from respondent x 4 = 1,124; And Industry estimate number of IT service recipients in 2012 is: 1,105 from respondent x 3 = 3,315

36 | P a g e
For the years 2013 and 2014, we used the same method to get the estimated number.
Figure 14 Number of IT Professionals Working in IT Industry, 2009-2014 According to Figure 14, the ratio of IT staff working in service providers has increased, moving from about 1/5 of total IT workers in 2008 to about 1/4 in 2012 and will remain at this level until 2014.
Figure 15 Ratio of IT Professionals working for Service Provider vs. Total

37 | P a g e
Chapter 6 : Lao IT Service Industry - A Provincial Prospective
6.1 Background Information about Savannakhet Savannakhet province is located roughly in the center of Laos, having borders with Vietnam to the East and Thailand to the West. As a consequence of its geographical advantage Savannakhet has great access to larger foreign markets and attracts foreign investment into the province. Savannakhet is among the country’s largest provinces in terms of population and land area. By 2010, its population was estimated at 902,064 people, the highest in Laos. Its total land area is 21,774 sq. km., which is more than five times larger than Vientiane Capital.
Map of Savannakhet Province, Lao PDR.
38 | P a g e
In terms of economic development, Savannakhet is one of the most important economic powerhouses of Laos. Its economy grew at an average of 10.5% per annum during 2006-2010. This is higher than the national level. With rapid growth in the industrial sector, the structure of economy is expected to change following the national modernization and industrialization strategy. By 2015, the industry sector is targeted to cover about 30% of GDP, agriculture 39% and service sector 29%. Savannakhet has been very successful in attracting foreign direct investment. The agriculture sector has attracted investment in activities such as sugarcane plantations, sugar production, and other industrial tree plantations. Investment in the light industrial products includes manufacture of electrical wires, motorcycle assembly and electronic parts assembly. Service sectors like hospitality and logistics are expected to grow even more and attract further investment.
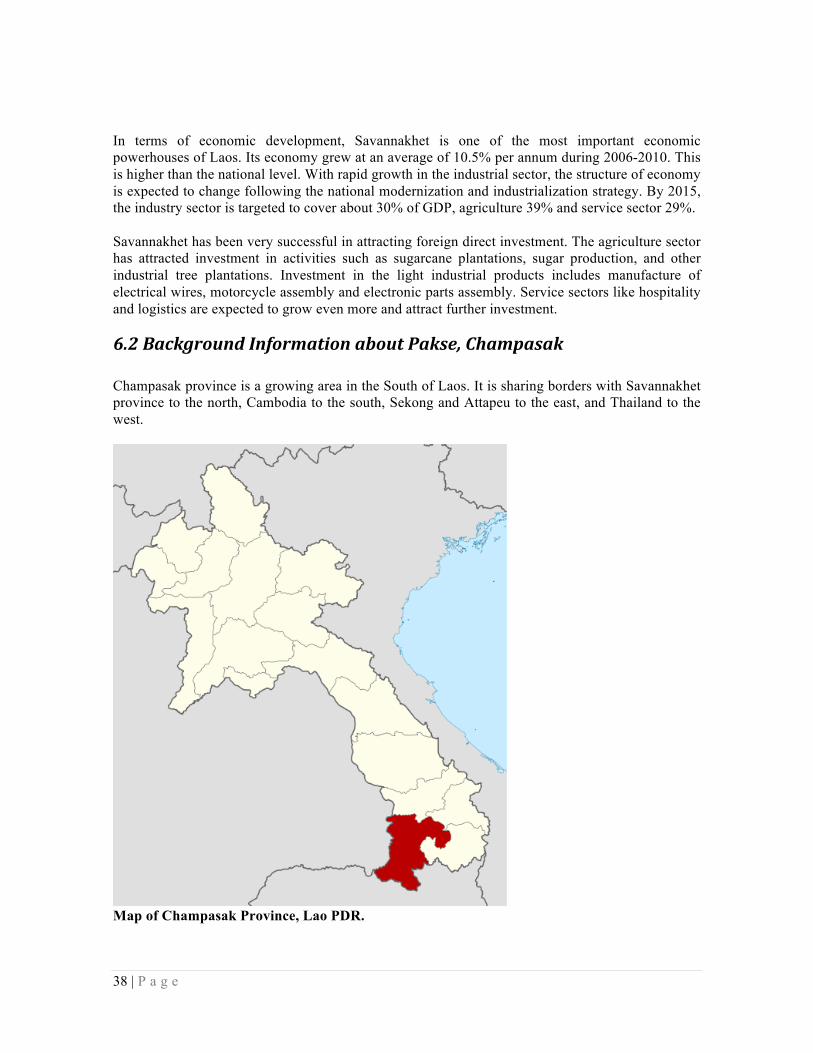
6.2 Background Information about Pakse, Champasak Champasak province is a growing area in the South of Laos. It is sharing borders with Savannakhet province to the north, Cambodia to the south, Sekong and Attapeu to the east, and Thailand to the west.
Map of Champasak Province, Lao PDR.

39 | P a g e
Champasak is the most populous province in the South and ranks third nationwide with over 640,000 people (in 2009), with the second highest density (42 people per sq. km.). In terms of economic development, Champasak has high potential in primary industry and tourism. FDI inflow into Champasak has been on an increasing trend. Given the above setting of both economic development and potential, Savannakhet and Champasak are certainly set to grow even more. To actually implement and realize these goals, serious adoption of modern tools like information technology (IT) or IT-enabled tools and equipment is inevitable.
6.3 Data Collection Workshop It was first ever event for the study team of the current research project to conduct a provincial workshop. The workshop was held on December 10th, 2012 in the form of data collection workshop at Daosavanh Hotel, Savannakhet Province. Some 29 companies and organizations participated in the workshop: 14 from government offices, 7 from colleges and training institutes, 3 from high schools, 2 from banks, and 3 from private companies. However, it must be noted that more than 80% of participants were from Savannakhet province. The main activities of the workshop included:
• Explaining the objectives of this survey; • Presenting last year’s finding for Lao IT service market; • Explaining the questionnaires in detail, one by one, question by question; • Encouraging the participants to complete the questionnaire forms on site, where possible.
6.4 Basic Findings
6.4.1 Situation of IT Human Resource in Savannakhet and Champasak To put the situation of Savannakhet and Champasak Provinces into perspective, we compared similar data with that of Vientiane Capital. Table 15 shows that the average number of IT staff in Vientiane Capital was almost three times bigger than that of Savannakhet and Champasak Province, i.e. 7.37 IT staff per recipient in Vientiane Capital vs. 2.59 IT staff per recipient organization in Savannakhet and Champasak. Table 15 Average No. of IT Staff in Service Recipient, Savannakhet + Champasak vs. Vientiane Capital in 2012 Total No. of
Respondent IT Service Recipient
Total No. of IT Staff
Average No. of IT Staff per Recipient
Vientiane Capital 150 1,105 7.37 Savannakhet + Champasak 29 75 2.59

40 | P a g e
Table 16 indicates that the Ratio of Senior vs. Junior IT Staff is different between Vientiane Capital and Savannakhet Province as well. Overall, IT service recipients in Savannakhet and Champasak Province have more Junior staff than their counterparts in Vientiane Capital. Table 16 Ratio of Senior vs. Junior IT Staff, Savannakhet + Champasak vs. Vientiane Capital in 2012 Vientiane
Capital Savannakhet
Province Ratio of Senior IT Staff 38% 26% Ratio of Junior IT Staff 62% 74% The comparison of female IT staff vs. total IT staff is illustrated in Table 17 below. Vientiane Capital has more female in IT industry when compared to Savannakhet Province. 13% of IT staff working in recipient organizations in Vientiane are female, while the same indicator is 7% in Savannakhet Province. Table 17 Ratio of Female IT Staff to Total IT Staff, Savannakhet + Champasak vs. Vientiane Capital, 2012 Year 2012 Ratio of Female IT Staff to Total IT Staff in Vientiane 13% Ratio of Female IT Staff to Total IT Staff in Savannakhet + Champasak 7%
6.4.2 IT Service Market in Savannakhet and Champasak Unfortunately, given the data availability and the quality of provided data it is very difficult to derive a set of information that is meaningful enough to produce a market estimate or even the IT spending trends in Savannakhet and Champasak Provinces for now. The team hoped to conduct another study in the future to better quantify the situation.
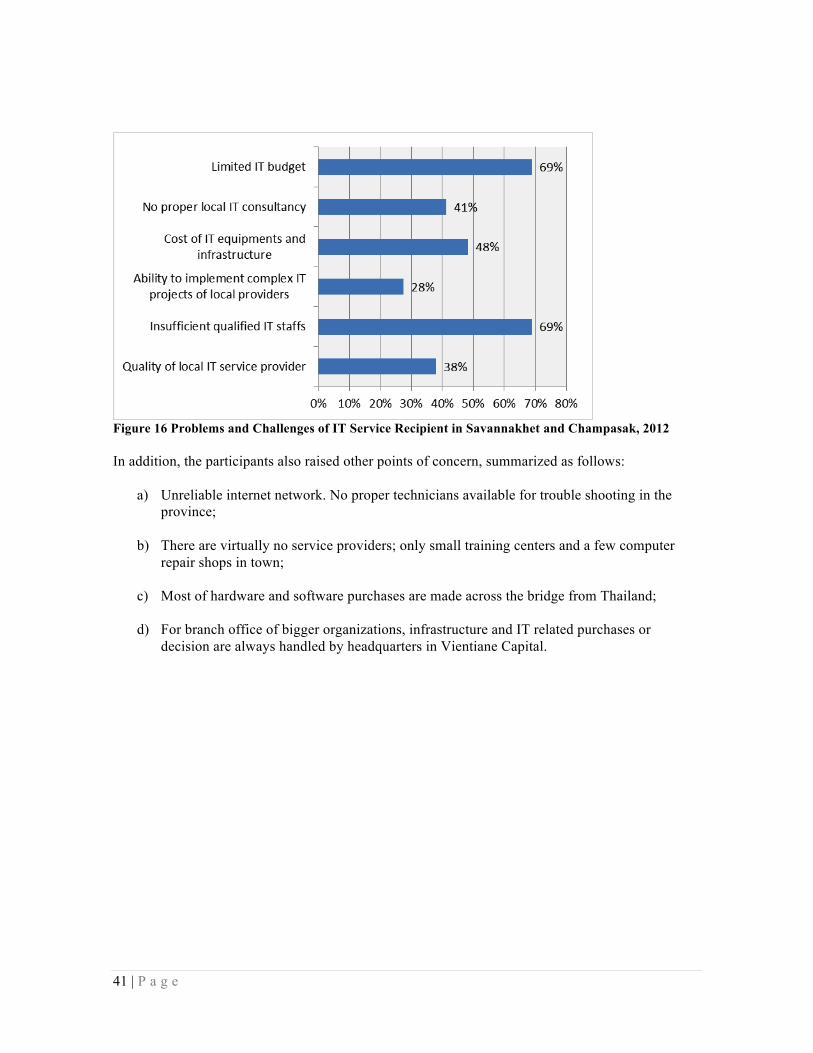
6.4.3 Problems and Challenges in Savannakhet and Champasak Figure 15 outlines the problems and challenges Savannakhet and Champasak IT service recipients are currently encountering, a perspective from the workshop participants. Limited IT budget and the supply of qualified IT staff top the list, both with 69% expressing concern. The cost of IT equipment and infrastructure was ranked third with 48%. This is quite similar to the situation in Vientiane Capital three to four years ago.
41 | P a g e
Figure 16 Problems and Challenges of IT Service Recipient in Savannakhet and Champasak, 2012 In addition, the participants also raised other points of concern, summarized as follows:
a) Unreliable internet network. No proper technicians available for trouble shooting in the province;
b) There are virtually no service providers; only small training centers and a few computer repair shops in town;
c) Most of hardware and software purchases are made across the bridge from Thailand;
d) For branch office of bigger organizations, infrastructure and IT related purchases or decision are always handled by headquarters in Vientiane Capital.

42 | P a g e
Chapter 7 : Recommendations To realize the ideal situation which is the future trend mentioned in chapter 5 minus the concerns raised by the IT service providers and recipients, the consultancy team came up with a set of recommendations or measures for each of the stakeholders in the IT service industry to consider and implement. 7.1 Policy Makers
a) Revise an updated ICT Master Plan with clear action plans, organizational structure, stakeholders, goals and mission;
• Define the duties and responsibilities of the stakeholders for this master plan,
providing clear division of tasks and objectives;
• Focus on short and medium term action plans that are feasible to support the growth of the whole ecosystem of the ICT industry in Laos (i.e users, small-medium companies, large enterprise, financial, telecommunications and energy sectors, and government);
• Promote and create ICT ‘champions’ in all key sectors , promote and award
successful projects and accomplishment in various categories, government , private, academia;
• Devise cost cutting and other approaches for the stakeholders to be competitive in
the region, with the arrival of the AEC in the next few years; and
b) Promote Research and Design using ICT in the key fields of growth such agro-industry, food industry, textiles, logistics and transport, urbanization and land use, etc.
7.2 IT Educational Institution
a) Introduce more practical courses at both degree level and vocational level, thereby enabling
human resource competitiveness for the upcoming AEC environment;
b) Increase the number of IT entrepreneurs by establishing efficient IT incubation centers; and
c) Encourage more private IT training centers to ensure quantity of qualified IT professionals. 7.3 Donor/International Development Community Although IT is seen as a catalyst for various development aspects – not only economic but social as well – there has been limited attention being paid from the donor/international development community to develop human resource in this area. Assistance in the development of ICT-related policies such as cyber law or e-commerce law or regulations would also contribute to the proper development of IT service industry in the future.

43 | P a g e
7.4 Industry body – LICA
Program recommendations:
a) Call for dissemination of government projects. Information on government projects should be publicly available;
b) Certification in IT education is at different standards among IT education providers. It is
proposed that a certification program be established in the form of a public-private-partnership (PPP) between LICA, MPT and NUOL to provide LICA IT professional certificates through an IT professional assessment, knowledge and training center. This certification should be renewed every two or three years;
c) The establishment of an IT Park in the near future. It could start with a software mini-park. The project could be initiated and implemented jointly by LICA, NUOL, and MPT. The park should embrace software and application development, a center of excellence for content development, a state-of-the-art data center, and business process outsourcing (BPO) activities. To start the project, in the short-term and medium term, LICA would require financial assistance from potential donors or even private funding.
Although some of the recommendations might not be able to be implemented strictly as proposed, certain modifications or combinations of the above will provide a good start to taking real action in tackling the various issues confronting the ICT industry.

44 | P a g e
References Bank of the Lao PDR. (2011), Annual Economic Report 2011 ITU, (May 2009), Information Society Statistical Profiles 2009 – Asia Pacific ITU, (December 2009), ITU Report on Enabling Frameworks for ICT Development in CLMV
Countries – Moving Forward JICA, (March 2010), Lao IT Service Market Research and Analysis Report 2009. JICA, (March 2011), Lao IT Service Research for IT Market and Outsourcing 2010 JICA, (March 2012), Lao IT Service Market Research 2011 World Bank, (May 2011), Lao PDR Economic Monitor September Update. World Bank, (November 2012), Lao PDR Economic Monitor.

45 | P a g e
Appendix
Appendix A: Respondent IT Service Providers – Company and Contact Information A.E.K IT Computer Add: Asean Rd Sidamduan Chanthabouly District Vientiane Cap. Tel: (856)-21 21 8217
Advanced IT Solutions Asia Add: Samsenthai Rd Anou Chanthabouly District Vientiane Cap. Tel: (856)-21 21 8876
Alice Computer Add: Thadeua Rd BeungkhaNyongTai Vientiane Cap. Tel: (856)-21 31 4999
APIS Co Ltd. Add: Kamphengmeuang St Saysetha District Vientiane Cap. Tel: (856)-21 45 3190
ATT Computer Add: Khouvieng St Phaxay Sisattanak District Vientiane Cap. Tel: (856)-21 35 3752
BECS Co Ltd Add: 261-01, 23 SinghaRd Nongbone Vientiane Cap. Tel: (856)-21 41 3354
BK Computer Add: Sibounheuang St Sibounheuang Vientiane Cap. Tel: (856)-21 31 2068
BP Computer Add: SouphanouvongAve Nakham Vientiane Cap. Tel: (856)-21 26 1514
BT Computer Add: Souphanouvong Ave SithanNeua Vientiane Cap. Tel: (856)-21 21 3340
Cyberia Co., Ltd. Add: 110/3 Samsenthai Rd Chanthabuly Dist. Vientiane Cap. Tel: (856)-21 21 6066
DATA COM Add: 2nd Floor SCC Building 2A/01 SouphanouvongAve Sihom Vientiane Cap. Tel: (856)-21 25 0850
Digital Divide Data Add: DongpalaepSt Ban Dongpalaep Vientiane Cap. Tel: (856)-21 26 3448
IBI Add: Haifong Road Ban Anou Chanthabuly Dist. Vientiane Cap.
ICT Solution Lao Add: Phonsinouan St Phonsinuan Village Vientiane Cap.

46 | P a g e
Tel : (856)-21 25 4349 Tel: (856)-21 2641 41 INFOTECH Co Ltd Add: Asean Rd Nakham Sikhotabong District Vientiane Cap. Tel: (856)-21 25 1512
Jitta Computer Shop Add: KhouviengSt Phaxay Vientiane Cap. Tel: (856)-20 7797 9920
LADA & Co Add: Ban HatsadyTai Vientiane Cap. Tel: (856)-21 21 3033
Lao IT Add: Ban SaphanthongNeua Vientiane Cap. Tel: (856)-21 31 5902
Max MV Com Add: Thongphanethong Sisattanak District Vientiane Cap. Tel: (856)-21 45 0609
Micro Info Add: AsianeRd Ban Sidamduan Vientiane Cap. Tel: (856)-21 21 5515
MyCom Add: Kaysone PhomvihaneRd Phonkheng Vientiane Cap. Tel: (856)-21 41 6781
NP Equipment Co Ltd Add: Viengchaleun Saysetha District Vientiane Cap. Tel: (856)-21 41 2976
PC Electronic Supplies Add: 062 04 KhounboulomRd Sisaket Vientiane Cap. Tel: (856)-21 21 9455
Planet Computer Co Ltd Add: 6th Floor ANZ Vientiane Commercial Bldg 207 33 LaneXangAve Hatsady Vientiane Cap. Tel: (856)-21 21 8972
S.O.A Co Ltd Add: 128 10 SailomRd Hatsady Vientiane Cap. Tel: (856)-21 2154 78
Saysiri IT Network Add: 147 10 PhonthanRd PhonthanTai Vientiane Cap. Tel: (856)-21 2618 13
Souphaxay Computer Add: LuangPrabangRd OuMoung Vientiane Cap. Tel: (856)-21 25 1207
SOUVANNASAB English and Computer Training Center Add: Sisavath Road, Ban Sisavath, Vientiane Cap. Tel: (856)-21 21 6939
SSS Computer Co Ltd Add: DongpainaSt Thongphanthong Vientiane Cap.
TNT Com Ink Add: T2Rd Sibounheuang Vientiane Cap.
47 | P a g e
Tel: (856)-21 45 0609 Tel: (856)-21 2648 09 V & T Computer Add: PhonsinouanSt Dongpalanthong Vientiane Cap. Tel: (856)-21 4525 55
Xangdao Consulting ICT and Services Add: Bourichanh Rd Banh Phonsinuan, Sisatthanak District, Vientiane Cap. Tel: (856)-30 9824711
XP Computer Add: SisangvoneSt ThatluangTai Vientiane Cap. Tel: (856)-21 41 6449
Mekong IT Add: Asean Road Vientiane Cap. Tel: (856)-21 725010
Trevico Add: Nongbon Road, Ban Naxay Vientiane Cap. Tel: (856)-21 285 456

48 | P a g e
Appendix B: Respondent IT Service Providers – Services Offering No. IT Service Provider Responding
Company
IT C
onsu
lting
IT E
duca
tion
Syst
ems
Inte
grat
ion
Softw
are
App
licat
ion
Dev
elop
men
t D
ata
Cen
tre
Serv
ice
IT S
yste
m
Mai
nten
ance
and
Su
ppor
t H
ardw
are
Sale
s an
d Se
rvic
e
Web
site
and
C
onte
nt D
ev.
Dev
elop
men
t IT
Sec
urity
Oth
ers*
1 A.E.K IT Computer √ √ √ √ √ √ √ √ 2 Advanced IT Solutions Asia √ √ √ 3 Alice Computer √ √ √ √ 4 APIS √ √ √ √ √ 5 ATT Computer √ √ √ √ √ 6 BECS √ √ 7 BK Computer √ 8 BP Computer √ √ √ √ √ 9 BT Computer √ √ √ √ √
10 Cyberia √ √ √ √ √ √ √ 11 Datacom √ √ √ √ √ √ √ √ √ 12 Digital Divide Data √ a 13 IBI Co Ltd √ √ √ √ √ √ 14 ICT Solution Lao √ √ √ √ 15 INFOTECH Co Ltd √ √ 16 Jitta Computer Shop √ 17 LADA & Co √ √ √ √ √ √ 18 Lao IT √ 19 Max MV Com √ 20 Micro Info √ √ √ √ √ √ √ √ 21 My Com √ √ 22 NP Equipment √ √ √ √ √ 23 PC Electronic Supplies √ √ 24 Planet Computer √ √ √ √ √ 25 S.O.A Co Ltd √ 26 Saysiri IT Network √ √ √ √ √ b 27 Souphaxay Computer √ √ √ √ √ 28 SOUVANNASAB English and
Computer Training Center √
29 SSS Computer √ √ √ √ √ √ √ 30 TNT Com Ink √ 31 V & T Computer √

49 | P a g e
32 Mekong IT √ √ √ √ √
33 Trivico Computer √ √ √ √ √
34 Xangdao Consulting ICT and Services
√ √ √ √ √ √ √ √ c
35 XP Computer √
Note: * Within "Others", (a) refers to” Data Management and Digital Publishing”; (b) refers to “CCTV, IP Camera”; and (c) means “Mobile Application”.

50 | P a g e
Appendix C: List of Workshop Participants (Committee Members) No. Name Organization 1 Mr. Mena SOUVANTHA
Pakpasak Technical College
2 Mr. Lai
Pakpasak Technical College
3 Mr. Sengpasong KHAMSING
AGL
4 Mr. Vongsay
AGL
5 Mr. Minaxay PHILAVONG Ministry of Posts and Telecommunications , LANIC
6 Mr. Khammany INTHAVONG RMA Laos
7 Mr. Thavisack MANODHAM
Enterprise of Telecommunications Lao
8 Mr. Davone PHACHANTHAVONG
A.C.E. Equipment Co., Ltd
9
Mr. Khamla SOURIYASACK APIS
10 Mr. Phoutthaly BOULOM
AMZ CRESCERE
11 Mr. Anouphone BOUTHAVONG
NTPC
12 Mr. Sanouphab PHOMKEONA
National University of Laos, FE
13 Mr. Hiroyuki IDE
JICA
14 Mr Tsuneo HEITO
JICA
15 Mr. Daovanh
JICA
16 Mr. Thanongsinh KANLAGNA
LICA / Consultant Leader
17 Mr. Thanousone PHONAMAT
LICA / Consultant
18 Mr. Anousa SOUANNAVONG
LICA / Consultant
19 Mr. Keovisouk DALASANE
LICA / Consultant
20 Mr. Bandaxay LOVANXAY
LICA / Consultant
21 Ms Somsoutkhay XAYAVONG
LICA / Project Secretary

51 | P a g e
Appendix D: Introducing LICA The Lao ICT Commerce Association (LICA) was established on 8th July 2005 under the umbrella of Lao National Chamber of Commerce and Industry (LNCCI) under direct supervision and guidance of Ministry of Post and Telecommunications (MPT). It is a platform uniting companies coming from the following fields: Telecom Operators, Internet Service Providers, IT Hardware and Software Vendors, System Integrators, ICT Consultants, Software Developers, Content Developers, ICT Technology Training Colleges and Institutions. Over the past few years, LICA has been promoting the local ICT industry through activities that increase trade, business matching, human resource development, and international relations. The main activities have been:
• Organizing the Lao ICT Expo 2010 with support from the LNCCI • Attending the ITU Telecom World 2011 as Lao delegates with high ranking officials from
the Ministry of Post and Telecommunications • Working closely with JICA, especially with the project at the National University of Laos
to produce yearly IT service market research and IT curriculum development. • Being a member of the World Congress on Information Technology (WITSA) and Asian-
Oceanian Computing Industry Organization (ASOCIO) to promote local industry and international cooperation.
Objectives:
1) To promote ICT market development and growth in Lao PDR;
2) To promote ICT products, services and human resource development as a vehicle for economic development of the nation;
3) To continuously improve the standard of provisioning of ICT product and services to society;
4) To foster a closer and more effective public-private-partnership (PPP) in the areas mentioned above;
5) To ensure the sustainability in the development and growth of its members as well as all beneficiaries and stakeholders involved in ICT development in Lao PDR

52 | P a g e
Organizational Structure
Employed Staff

53 | P a g e
Five Year Working Plan - 2010–2015 (Priorities) Education & Government
• Work closely and seek guidance from the Ministry of Post and Telecommunications, participate in preparing advice and recommendations on ICT-related Laws and Regulations.
• Continue working closely with National University of Laos to produce the right IT human resources required by the industry
• Start working with the ICT vocational education institutions by providing advice to the board of curriculum development and internship programs within company members and find / create work place opportunities for the IT work forces.
• Organize IT Career Fairs.
Market Development • Help create a better environment for ICT companies to operate (includes regulation and
policy for hardware, internet/broadband services, software companies); • Measurement of the market through surveys and analysis; • Organize regional ICT Expos and summits; • Attend international events and meetings; • Establish an IT park in cooperation with Government and international financial support
agencies in order to produce competent IT engineers for the center of outsourcing work/ export in the area of software and application development;
• Standardize Lao ICT service levels for members to comply with in order to ensure that the customer’s interests are protected.
Contact Information:
Lao ICT Commerce Association (LICA) 2/F SCC Building, Sihom Village Souphanouvong Road, Vientiane, Lao PDR Tel: +856 21 250850 Fax: +856 21 219117 Email: [email protected] Website: www.lica.laopdr.org