lao pdr energy outlook 2020- chapter 6
TRANSCRIPT
Chapter 6
Assessment of Future Simulation Results
Shigeru Kimura
February 2020
This chapter should be cited as
Kimura, S. (2020), ‘Assessment of Future Simulation Results’, in ERIA and Lao PDR Ministry
of Energy and Mines, Lao PDR Energy Outlook 2020. ERIA Research Project Report FY2018
no.19, Jakarta: ERIA, pp.58-80.

58
Chapter 6
Assessment of Future Simulation Results
Shigeru Kimura
There were several scenarios or cases studied for the Lao People’s Democratic Republic (Lao
PDR) Energy Outlook as described in Chapter 5. The base case is defined as the Business-As-
Usual (BAU) scenario. The other cases studies are the gross domestic product (GDP)
scenarios, oil price scenarios, energy efficiency and conservation (EEC) promotion scenarios,
and renewable energy (RE) development scenarios.
This chapter provides the result of the simulation runs for the BAU scenario and the other
case studies.
6.1 Business-As-Usual Scenario
The BAU scenario is developed based on the assumptions that the Lao PDR's demand for
energy will continue to increase based on historical trends and future growth in the GDP,
population, and oil price in the absence of additional policies for EEC and RE promotion. Table
A6.1 and Table A6.2 (see Annex) are the base year (2015) and the projected 2040 Energy
Balance of the Lao PDR.
Final energy consumption
The total final energy consumption (TFEC) of the Lao PDR increased at an average rate of 4.5%
per year, from 1.5 million tons of oil equivalent (Mtoe) in 2000 to 2.9 Mtoe in 2015. Given the
assumed economic and population growth, the growth in the TFEC will continue at a slightly
higher rate of 4.7% per year during 2015–2040 under the BAU scenario (Figure 6.1).
This growth is brought by the rapid increase of energy consumption in the industry and
transport sectors. Coal consumption in the industry sector contributed to the growth of the
sector in the past (2000–2015), while in the future, it will be electricity consumption. The

59
industry’s electricity consumption will grow at an average rate of around 10% per year under
the BAU scenario, while coal is at 7.7% per year.
Figure 6.1 Total Final Energy Consumption by Sector
Mtoe = million tons of oil equivalent. Source: Author’s calculations.
Final energy consumption in the transport sector in the BAU scenario will grow more slowly
than in the past, at an average rate of 6.0% per year. Road transport will dominate, due to the
growth at 6.1% per year while air transport will grow at 3.0% per year.
Final energy consumption of the ‘Others’ sector (mainly consisting of residential and
commercial) will grow at an average of 1.3% per year over the outlook period, slower than it
was in the past (2.1% per year between 2000–2015). The growth in consumption of the
commercial sector will be 2.1% per year, while the residential sector will grow at 1% per year.
The residential sector, although growing the slowest, has had the highest share in the TFEC in
the past. This is due to its consumption of biomass for cooking. The share of biomass will
decline in the future as household appliances become more efficient and households use
more alternatives, such as liquefied petroleum gas (LPG). The residential sector share in the
TFEC will decrease from 43% in 2015 to 18% in 2040.
The transport sector had the second largest share in the TFEC (30% in 2015), while the share
of the industry sector was 15% and the commercial sector share was 12%. By 2040, the share
of the transport sector consumption in the TFEC will increase to 41% and industry to 35%. As
a result, the commercial sector’s share will decline to 6% by 2040.
2,91
3,60
4,50
5,71
7,21
9,14
0,00
1,00
2,00
3,00
4,00
5,00
6,00
7,00
8,00
9,00
10,00
2015 2020 2025 2030 2035 2040
Mto
e
Industry Transport Residential
Commercial Agriculture Non Energy
15%21% 25% 29% 32% 35%
30%32%
35%38%
39%41%
43%35%
30%25%
21% 18%
12% 11% 10% 8% 7% 6%
0%
10%
20%
30%
40%
50%
60%
70%
80%
90%
100%
2015 2020 2025 2030 2035 2040
Industry Transport Residential
Commercial Agriculture Non Energy

60
In the future, demand for all fuels, except biomass, will continue to increase. For electricity,
the demand will increase the fastest at an average rate of 8.1% per year to 2.5 Mtoe in 2040.
Coal demand will continue to grow rapidly, but at a slower rate than in the past. The annual
growth rate for coal demand would be 7.7% per year over the 2015–2040 period (Figure 6.2).
Figure 6.2 Total Final Energy Consumption by Fuel Type
Mtoe = million tons of oil equivalent. Source: Author’s calculations.
Oil demand will continue to grow in line with the increase in the number of passenger cars as
the income level of the Lao PDR increases. The annual growth rate for oil demand will be 6.1%
per year. The share of biomass demand is expected to decrease an average rate of 0.2% per
year.
According to the slower growth of biomass demand in the future, the share of this fuel in the
TFEC will decline significantly, from 50% in 2015 to 15% in 2040. In its place, oil will become
the dominant fuel with its share reaching 44% in 2040.
Electricity demand although growing the fastest, will still have a lower share than oil. The
share of electricity in the TFEC increases from 13% in 2015 to 28% in 2040. The remaining
share will be that of coal, increasing from 6% in 2015 to 13% in 2040.
Power generation
The Lao PDR’s power generation came mainly from hydro sources prior to 2015. Power
generation from hydro sources increased from around 3.5 terawatt hours (TWh) in 2000 to
14.5 TWh in 2015 at an average rate of 9.9% per year. In 2015, the Hongsa coal-fired power
2,91
3,60
4,50
5,71
7,21
9,14
-
1,00
2,00
3,00
4,00
5,00
6,00
7,00
8,00
9,00
10,00
2015 2020 2025 2030 2035 2040
Mto
e
Solid Fuels Biomass Electricity
Oil Products Non Energy Total
6% 10% 11% 12% 13% 13%
50% 39% 31% 24% 19% 15%
13%17%
20%23%
25%28%
32% 34% 37% 40% 42% 44%
0%
10%
20%
30%
40%
50%
60%
70%
80%
90%
100%
2015 2020 2025 2030 2035 2040
Solid Fuels Biomass Electricity Oil Products Non Energy

61
plant was in full operation, generating around 3 TWh making the total electricity generation
of the Lao PDR 17 TWh.
The majority of the electricity produced, especially from the Hongsa power plant was
exported to Thailand. Therefore, the future total generation of electricity in the Lao PDR will
not only meet the domestic demand but also meet the contracted export target. In addition,
the own use and losses (transmission and distribution) of electricity must be included in the
future generation of electricity of the Lao PDR.
In the BAU scenario, total electricity production of the Lao PDR will reach around 70 TWH in
2040, where 53% of this amount will be for export purposes. The projected average annual
growth of electricity production between 2015 to 2040 will be around 5.8% per year, slower
than between 2000 to 2015 (Figure 6.3).
By type of fuel, generation from other renewable sources which consist of solar, wind, and
biomass will grow the fastest at an average rate of 18.4% per year. The main reason for this
very rapid growth is that this energy outlook is influenced by national RE targets. Generation
from coal will grow at an average rate 7.6% per year while hydropower generation will grow
at 5.4% per year.
The share of hydropower will remain dominant in the total power generation of the country.
Its share in total power generation, however, will decline to 77% in 2040 from 85% in 2015.
Hydropower in 2040 will be replaced by coal (22%), biomass, and other renewables (solar
and wind).

62
Figure 6.3 Power Generation by Fuel Type
TWh = terawatt hour. Source: Author’s calculations.
Primary energy supply
The total primary energy supply (TPES) in the Lao PDR grew faster than the final energy
consumption at about 6.9% per year, from around 2 Mtoe in 2000 to 4 Mtoe in 2015. Amongst
the major energy sources, the fastest-growing fuel between 2000 and 2015 was coal at 40.8%
per year. This is mainly due to the requirement of the Hongsa coal-fired power plant which
started production in 2015, resulting in a significant increase in coal supply that year. The
Hongsa power plant was constructed only for export purposes to Thailand.
Hydropower, the main supply for power generation in the country grew at an average rate of
9.9% per year over the 2000–2015 period. Oil, the major supply for the transport sector, grew
at a slower rate of 8.5% per year and biomass, the major supply for the residential sector,
grew at an average rate of 1.7% per year.
The Lao PDR exports most of its electricity to Thailand. However, it also imports electricity,
especially during the dry season and to areas not connected to the national grid. Electricity
in the TPES reflected the net electricity trade (import minus export), and a negative value
indicated that the Lao PDR has been a net electricity exporting country. The electricity export
in the TPES increased significantly at an average rate of 10.1% per year. Another renewable
supply (solar) has been be used since 2005, but the amount was small, amounting to 0.09
Mtoe in 2015.
0
10
20
30
40
50
60
70
80
2015 2020 2025 2030 2035 2040
TWh
Hydro Coal Biomass Solar
85%76% 74% 75% 75% 77%
15%24% 26% 25% 25% 22%
0%
10%
20%
30%
40%
50%
60%
70%
80%
90%
100%
2015 2020 2025 2030 2035 2040
Hydro Coal Biomass Solar

63
In the BAU scenario, the Lao PDR’s TPES is projected to increase more slowly than in the past,
at an average annual rate of 4.4%, reaching 13 Mtoe in 2040 (Figure 6.4). Coal is projected to
continue growing, but at a slower rate of 5.3% per year compared to the past. Hydropower
will also increase at a slightly higher rate than coal at 5.4% per year. Oil is projected to increase
at an average annual rate of 6.1% over 2015–2040 and it will be highest as compared to coal
and hydropower. Biomass, on the other hand, will experience a declining trend as LPG and
more efficient biomass stoves will be used in the residential sector.
Figure 6.4 Total Primary Energy Supply
Mtoe = million tons of oil equivalent. Source: Author's calculations.
The Lao PDR will continue its export target, and the net electricity trade in the total supply
will reach 3.2 Mtoe, increasing on average by 5% per year between 2015 to 2040.
In terms of share in the TPES, biomass had the highest share over the 2000 to 2015 period.
The share, however, declined from 78% in 2000 to 37% in 2015. The coal share was only 1%
in 2000, but its share became the second largest in 2015 (35%) because coal was used not
only for industry but also power generation. The oil share in the TPES was second highest in
2000 (17%). In 2015, the share increased to 21%, which was lower than coal. Hydropower
share in the TPES increased from 5% in 2000 to 7% in 2015. The electricity trade value in the
TPES was mostly from hydropower resources.
2000 2015 2020 2025 2030 2035 2040
Electricity -0,22 -0,95 -1,46 -1,90 -2,38 -2,76 -3,20
Solar, Wind, Ocean 0,00 0,00 0,00 0,01 0,01 0,02 0,01
Biomass 1,26 1,62 1,58 1,59 1,61 1,62 1,60
Hydro 0,30 1,25 1,74 2,27 2,97 3,64 4,65
Oil 0,27 0,93 1,25 1,70 2,31 3,07 4,07
Coal 0,01 1,55 2,22 3,17 4,00 4,98 5,68
Total 1,62 4,40 5,34 6,83 8,52 10,56 12,81
-5
0
5
10
15
20
Mto
e

64
In the BAU scenario, the coal share in the TPES will be the highest in 2040 (37%) in line with
the expansion of the Hongsa power plant. The oil share will also increase to 32%, and hydro’s
share in the TPES will increase to 19% by 2040. As a result, the share of biomass in the TPES
will decrease to 12% by 2040. The other renewables share remains very small (Figure 6.5).
Figure 6.5 Energy Mix of the Total Primary Energy Supply
Mtoe = million tons of oil equivalent. Source: Author’s calculations.
CO2 emissions
The major sources of CO2 emissions from fuel combustion in the Lao PDR are solid fossil fuel
(coal) and liquid fossil fuel (oil). In 2015, the CO2 emissions from coal combustion was 68%,
because the coal share was 35% of the TPES, while oil was only 21%. Therefore, the majority
of CO2 emissions came from burning coal. Total CO2 emissions were 2.4 million ton-c (in terms
of carbon content) or approximately 8.8 million ton-CO2 in 2015. The CO2 emissions will reach
9.4 million ton-c (Mt-c) by 2040 in the BAU scenario, increasing at an average rate of 5.6% per
year. Coal combustion will still be the major source for CO2 emissions since its share in the
TPES increases to 37% due to increased use of coal in power generation and industry (Figure
6.6).
Coal35%
Oil21%
Hydro7%
Biomass37%
Other renewable0%
2015 (4.4 Mtoe)
Coal37%
Oil32%
Hydro19%
Biomass12%
Other renewable0.1%
2040 (12.8 Mtoe)

65
Figure 6.6 Total CO2 Emissions
Mt-c = million tons of carbon. Source: Author's calculations.
Energy indicators
Energy indicators are often used to analyse a country import dependency on energy, energy
consumption per capita, energy consumption per GDP, elasticity between TPES and GDP, as
well as CO2 emissions.
Import dependency
In terms of import dependency, the Lao PDR imported all its oil requirements and some
electricity to meet consumption during the dry season and in the border areas without
electricity access. Measuring import dependency is by dividing the total energy import to the
total energy production. The total production of the Lao PDR consisted of coal, hydropower,
biomass, solar and wind.
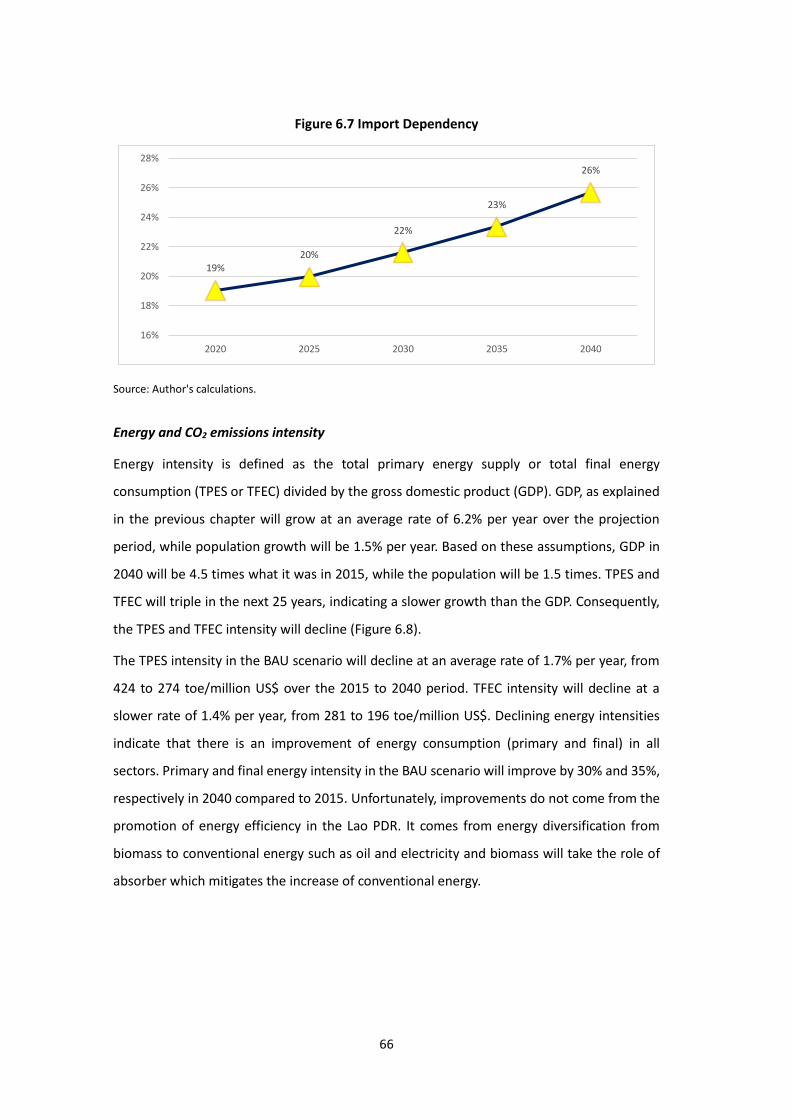
The import dependency ratio was 19% in 2015, an increase from 17% in 2000 due to the
increase in oil consumption, particularly in the transport sector. In the BAU scenario, the Lao
PDR import dependency is projected to continue increasing and will reach 26% by 2040
(Figure 6.7). If the Lao PDR increases domestic coal consumption for power generation
instead of hydropower generation, the import dependency ratio should decline because of
different thermal efficiency between coal power plants and hydropower plants. Nevertheless,
oil consumption will increase faster than coal, which will result in an increase of the import
dependency ratio.
0,0
1,62,3
3,44,2
5,36,0
0,8
1,0
1,4
1,9
2,5
3,3
0
1
2
3
4
5
6
7
8
9
10
2000 2015 2020 2025 2030 2035 2040
Mt-
c
Coal Oil
66
Figure 6.7 Import Dependency
Source: Author's calculations.
Energy and CO2 emissions intensity
Energy intensity is defined as the total primary energy supply or total final energy
consumption (TPES or TFEC) divided by the gross domestic product (GDP). GDP, as explained
in the previous chapter will grow at an average rate of 6.2% per year over the projection
period, while population growth will be 1.5% per year. Based on these assumptions, GDP in
2040 will be 4.5 times what it was in 2015, while the population will be 1.5 times. TPES and
TFEC will triple in the next 25 years, indicating a slower growth than the GDP. Consequently,
the TPES and TFEC intensity will decline (Figure 6.8).
The TPES intensity in the BAU scenario will decline at an average rate of 1.7% per year, from
424 to 274 toe/million US$ over the 2015 to 2040 period. TFEC intensity will decline at a
slower rate of 1.4% per year, from 281 to 196 toe/million US$. Declining energy intensities
indicate that there is an improvement of energy consumption (primary and final) in all
sectors. Primary and final energy intensity in the BAU scenario will improve by 30% and 35%,
respectively in 2040 compared to 2015. Unfortunately, improvements do not come from the
promotion of energy efficiency in the Lao PDR. It comes from energy diversification from
biomass to conventional energy such as oil and electricity and biomass will take the role of
absorber which mitigates the increase of conventional energy.
19%20%
22%
23%
26%
16%
18%
20%
22%
24%
26%
28%
2020 2025 2030 2035 2040

67
Figure 6.8 Energy Indicators (2015 = 100)
GDP = gross domestic product, POP = population, TFEC = total final energy consumption, TPES = total primary energy supply. Source: Author's calculations.
Per capita energy consumption, measured as the ratio of TPES to the total population, was
0.7 toe/person in 2015 higher than it was in 2000 (0.3 toe/person). This increase in energy
per capita indicates improvement in energy access of society, which was reflected by the
electrification ratio. In the BAU scenario, energy consumption per capita will continue to
increase and will reach 1.4 toe per person in 2040.
Energy elasticity, which is the ratio of percentage growth in energy and the GDP will improve
from 0.9 over the 2000–2015 period to 0.7 over the projection period regarding the TPES. For
the TFEC, the elasticity will shift from 0.6 to 0.7 over the same period.
As with energy intensity, CO2 intensity measures the ratio of GDP or the TPES to the CO2
emissions. Both the CO2/GDP and CO2/TPES increased in the past as coal and oil consumption
increased significantly faster than the GDP growth.
Under the BAU scenario, CO2 emissions in 2040 will almost be four times from the 2015 level,
indicating a slower growth than the GDP. As a result, the CO2/GDP will decline by 0.9 times in
the next 25 years (Figure 6.9). Initially, the CO2/GDP will increase until 2025 then start to
decline to 2040. Overall, the CO2/GDP will decline at an average rate of 0.6% per year, from
232 ton-c/million US$ in 2015 to 200 ton-c/million US$ in 2040.
450
145
291314
65
10070
0
50
100
150
200
250
300
350
400
450
500
2015 2020 2025 2030 2035 2040
20
15
= 1
00
GDP POP TPES
TFEC TPES/GDP TFEC/GDP

68
Figure 6.9 CO2 Emissions Intensity (2015 = 100)
GDP = gross domestic product, TPES = total primary energy supply. Source: Author’s calculations.
The CO2/TPES will increase to 0.73 ton-c/toe by 2040 from 0.55 ton-c/toe in 2015. This change
will come from the diversification of the energy share to shift from low carbon energy
(biomass and hydro) to fossil fuels (coal and oil) in the Lao PDR.
6.2 Case Studies
The case studies being considered in this outlook are:
1) Changes in GDP (GDPH and GDPL): It is assumed that the GDP annual growth rate
could increase or decrease with additional ±1% as compared to the BAU scenario.
2) Higher oil price (OILH): It is assumed that the crude oil price could increase from
US$150 by 2030 and US$200 by 2040 in the BAU scenario to US$200 by 2030 and
US$250 by 2040, respectively.
3) EEC promotion: It is assumed that the TFEC would reduce by 10% (EE10) and 20%
(EE20) in 2040 compared to the BAU scenario through the implementation of EEC
activities.
4) RE development: It is assumed that the share of power generation outputs from RE
sources (solar and wind) could reach 10% (RE10) and 20% (RE20) of total power
generation (compared to negligible share of the BAU scenario) by 2040. These
additional increases are assumed for replacing coal-fired thermal power plants.
291
390
134
100 87
0
50
100
150
200
250
300
350
400
450
2015 2020 2025 2030 2035 2040
20
15
= 1
00
TPES CO2 CO2 /TPES CO2 /GDP

69
A detailed assumption applied in the case studies has been outlined in Chapter 5. The impacts
of the different case studies will be compared to the BAU scenario.
Final energy consumption
The projected TFEC in 2040 by sector and by fuel for the different case studies as compared
to the BAU scenario is shown in Figure 6.10. The TFEC for the case studies will be different
than the BAU scenario except for the RE development case studies. Under the RE
development case studies, the TFEC will be the same as in the BAU scenario because the
assumption was on the power generation side, not on the demand side. In the RE case
studies, the RE sources (solar and wind) share in the total generation will increase to 10%
(RE10) and 20% (RE20) in 2040. Thus, increasing coal-fired thermal power plants will not be
as much as in the BAU scenario since some will be replaced by RE sources.
Figure 6.10 Total Final Energy Consumption in 2040 by Cases
BAU = Business-As-Usual, EE = energy efficiency, GDP = gross domestic product, Mtoe = million tons of oil equivalent, RE = renewable energy. Source: Author’s calculations.
Under the GDPH, increasing 1% of the GDP growth rate of the BAU scenario will increase the
TFEC by 19% in 2040. Under the GDPL, the TFEC will decrease by 16%. Increasing the oil price
by US$50 in 2030 and in 2040, respectively from that of the BAU scenario (OILH) will also
decrease the TFEC, but only by 0.1%.
9,1
10,9
7,7
9,1
8,2
7,3
9,1 9,1
0,0
2,0
4,0
6,0
8,0
10,0
12,0
BAU GDPH GDPL OILH EE10 EE20 RE10 RE20
Mto
e
Industry Transport Others Non-energy Total
9,1
10,9
7,7
9,1
8,2
7,3
9,1 9,1
0,0
2,0
4,0
6,0
8,0
10,0
12,0
BAU GDPH GDPL OILH EE10 EE20 RE10 RE20
Mto
e
Coal Oil Electricity Others Total

70
Under the EE20, the TFEC will be 20% lower than that of the BAU scenario while under the
EE10, the difference will be 10%. These scenarios are tentatively assumed for assessing the
sensitivity of this outlook.
Under the GDPL, reduction in different sectors is not the same. The reduction in the TFEC of
the transport sector will be 21%, while for the industry sector 18% and the ‘Others’ sector
2%. The non-energy sector relates to the transport sector (lubricants), so the reduction will
also be similar (21%). The transport and industry sectors are more sensitive to the changes in
GDP due to a zero or small share of biomass.
In case of the ‘Others’ sector, the majority of the consumption is that of the residential sector.
Since biomass has the major share in the TFEC of the residential sector, changes in the GDP
will not directly impact biomass consumption. In fact, biomass consumption will increase
under the GDPL case and decrease under the GDPH case. Under the GDPL, the highest
reduction will be in electricity (25%), followed by oil (21%) and coal (5%). The reduction in oil
consumption mostly occurs in the road transport sector.
Power generation
As mentioned previously, the electricity demand of the final sector is 25% lower than the BAU
scenario under the GDPL. Under the EE20, electricity consumption is only 20% lower than the
BAU scenario. Since the electricity export will be the same for all cases, then electricity
generation will be the lowest under the GDPL (Figure 6.11).
Under all cases, hydropower is the major source for electricity generation in the Lao PDR
(77%). The second largest source for electricity generation will be coal (22%) under all cases
except RE cases (RE10 and RE20). The remaining share will be that of biomass and other
renewables (solar and wind).
Under RE10 and RE20, the share of solar and wind will be 10% and 20% higher than the BAU
scenario. The substitution is assumed only for coal-fired power plants. Thus, the share of coal
in total power generation will decrease to 13% under RE10 and 3% under RE20.

71
Figure 6.11 Comparison of Scenarios to Electricity Generation by 2040
BAU = Business-As-Usual, EE = energy efficiency, GDP = gross domestic product, RE = renewable energy, TWh = terawatt hour. Source: Author’s calculations.
Primary energy supply
The TPES of the Lao PDR in 2040 will be 18% higher than the BAU scenario under the GDPH
(Figure 6.12). This increase will mainly come from the use of hydropower and other
renewables (solar and wind) to meet the higher electricity demand. Hydropower and other
renewable supply under the GDPH will be 15% higher than in the BAU scenario. Coal supply
will also be 12% higher than the BAU scenario. Biomass supply, on the other hand, will be 9%
lower than the BAU scenario since households tend to use more efficient stoves (such as LPG
and electricity) as incomes increase due to the improvement in the economy.
In a reverse situation, where GDP growth declined by 1% (GDPL), biomass supply will increase
while the other sources will decrease. Biomass supply will increase by 8% under the GDPL as
compared to the BAU scenario. Hydropower and other renewables will decrease by 12%,
while coal decreases by 10% resulting in an overall decrease of the TPES by 15%. Under the
OILH case, the TPES will also be lower than the BAU scenario, but only by 0.04%.
70
81
62
7067
64
70 70
0
10
20
30
40
50
60
70
80
90
BAU GDPH GDPL OILH EE10 EE20 RE10 RE20
TWh
Coal Hydro Solar/Wind Biomass Total
72
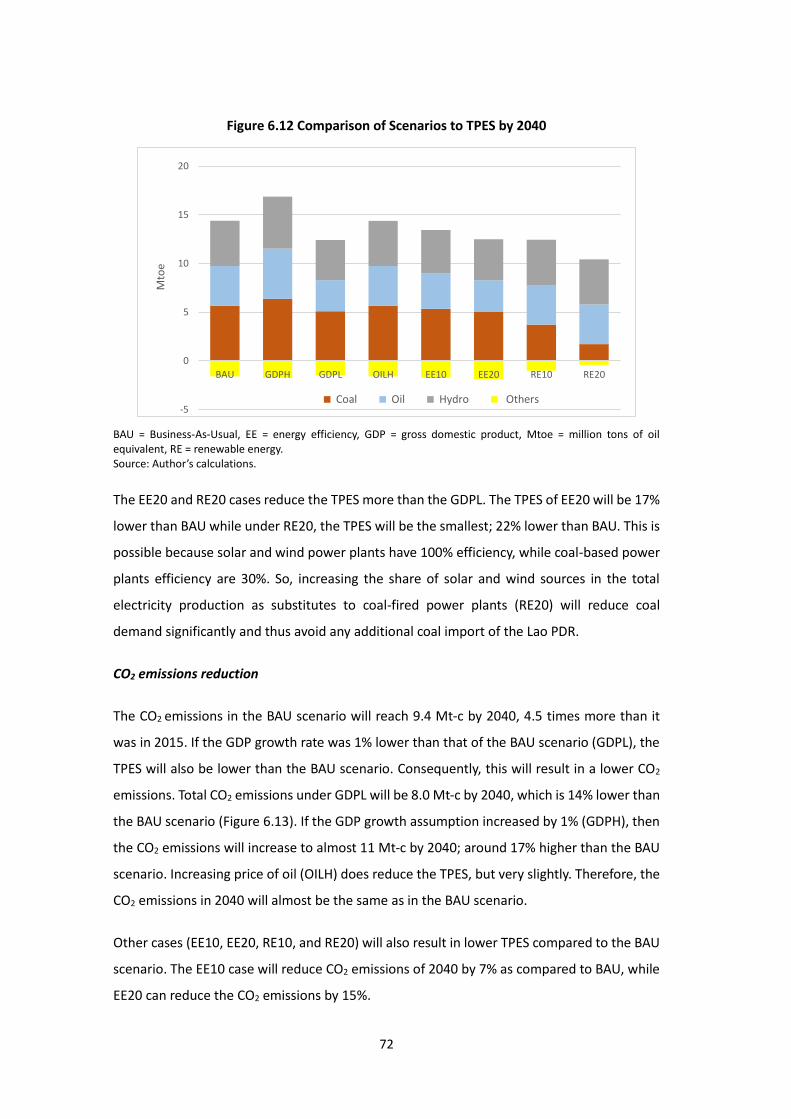
Figure 6.12 Comparison of Scenarios to TPES by 2040
BAU = Business-As-Usual, EE = energy efficiency, GDP = gross domestic product, Mtoe = million tons of oil equivalent, RE = renewable energy. Source: Author’s calculations.
The EE20 and RE20 cases reduce the TPES more than the GDPL. The TPES of EE20 will be 17%
lower than BAU while under RE20, the TPES will be the smallest; 22% lower than BAU. This is
possible because solar and wind power plants have 100% efficiency, while coal-based power
plants efficiency are 30%. So, increasing the share of solar and wind sources in the total
electricity production as substitutes to coal-fired power plants (RE20) will reduce coal
demand significantly and thus avoid any additional coal import of the Lao PDR.
CO2 emissions reduction
The CO2 emissions in the BAU scenario will reach 9.4 Mt-c by 2040, 4.5 times more than it
was in 2015. If the GDP growth rate was 1% lower than that of the BAU scenario (GDPL), the
TPES will also be lower than the BAU scenario. Consequently, this will result in a lower CO2
emissions. Total CO2 emissions under GDPL will be 8.0 Mt-c by 2040, which is 14% lower than
the BAU scenario (Figure 6.13). If the GDP growth assumption increased by 1% (GDPH), then
the CO2 emissions will increase to almost 11 Mt-c by 2040; around 17% higher than the BAU
scenario. Increasing price of oil (OILH) does reduce the TPES, but very slightly. Therefore, the
CO2 emissions in 2040 will almost be the same as in the BAU scenario.
Other cases (EE10, EE20, RE10, and RE20) will also result in lower TPES compared to the BAU
scenario. The EE10 case will reduce CO2 emissions of 2040 by 7% as compared to BAU, while
EE20 can reduce the CO2 emissions by 15%.
-5
0
5
10
15
20
BAU GDPH GDPL OILH EE10 EE20 RE10 RE20
Mto
e
Coal Oil Hydro Others

73
Figure 6.13 Lao PDR CO2 Emissions by Cases
BAU = Business-As-Usual, EE = energy efficiency, GDP = gross domestic product, Mt-c = million tons-c, RE = renewable energy. Source: Author’s calculations.
The CO2 emissions in 2040 will be significantly reduced if the Lao PDR promotes solar and
wind power generation instead of coal-fired power plants. If the policy is to increase the share
of solar and wind in the total power generation by 10% (RE10), the CO2 emissions reduction
in 2040 will reach 22%. If the share increases to 20%, then the CO2 emissions reduction will
reach 45%; the lowest from all cases.
Energy indicators
Import dependency
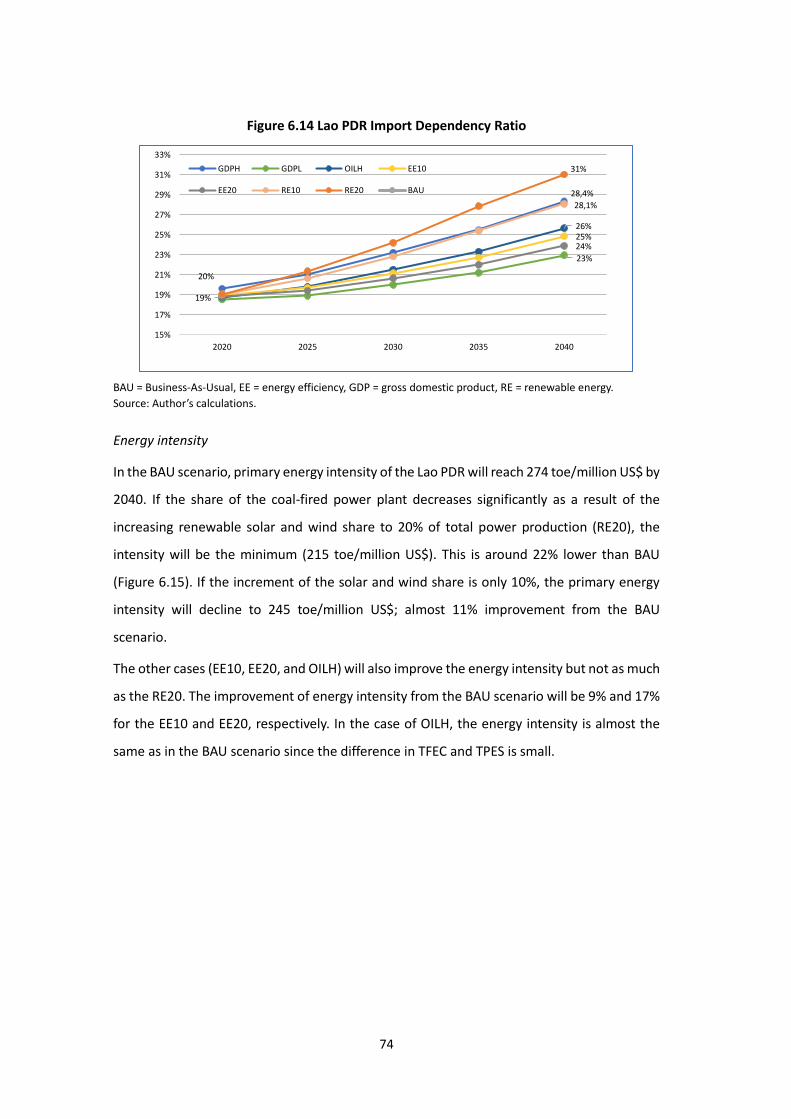
In the BAU scenario, the Lao PDR import dependency will reach 26% by 2040. Import
dependency will be the highest at 31% under RE20 (Figure 6.14). The RE20 case increases
the role of solar and wind in power generation by 20% to substitute electricity produced by
coal-fired power plants. Since coal use will decrease in RE20, the domestic production of
coal will be lower than in the BAU scenario. In addition, an increase in solar and wind supply
will not be as much since renewable plants have 100% efficiency, while coal is only 30%. As
a result, the import dependency ratio will be higher than in the BAU scenario. In the RE10
case, the reduction in total energy production will not be as low as in RE20, so that import
dependency will only reach 28% in 2040.
0,0
2,0
4,0
6,0
8,0
10,0
12,0
BAU GDPH GDPL OILH EE 10 EE20 RE10 RE20
Mt-
c
Coal Oil
74
Figure 6.14 Lao PDR Import Dependency Ratio
BAU = Business-As-Usual, EE = energy efficiency, GDP = gross domestic product, RE = renewable energy.
Source: Author’s calculations.
Energy intensity
In the BAU scenario, primary energy intensity of the Lao PDR will reach 274 toe/million US$ by
2040. If the share of the coal-fired power plant decreases significantly as a result of the
increasing renewable solar and wind share to 20% of total power production (RE20), the
intensity will be the minimum (215 toe/million US$). This is around 22% lower than BAU
(Figure 6.15). If the increment of the solar and wind share is only 10%, the primary energy
intensity will decline to 245 toe/million US$; almost 11% improvement from the BAU
scenario.
The other cases (EE10, EE20, and OILH) will also improve the energy intensity but not as much
as the RE20. The improvement of energy intensity from the BAU scenario will be 9% and 17%
for the EE10 and EE20, respectively. In the case of OILH, the energy intensity is almost the
same as in the BAU scenario since the difference in TFEC and TPES is small.
20%
28,4%
23%
19%
26%25%24%
28,1%
31%
15%
17%
19%
21%
23%
25%
27%
29%
31%
33%
2020 2025 2030 2035 2040
GDPH GDPL OILH EE10
EE20 RE10 RE20 BAU
75
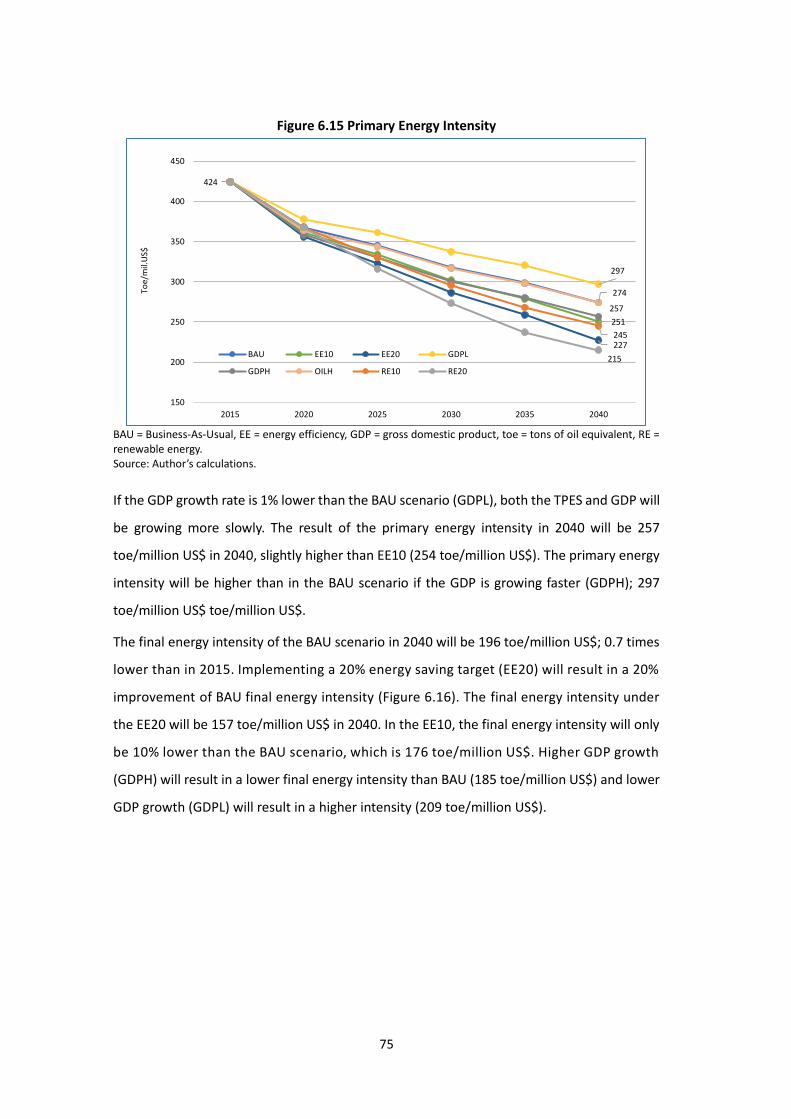
Figure 6.15 Primary Energy Intensity
BAU = Business-As-Usual, EE = energy efficiency, GDP = gross domestic product, toe = tons of oil equivalent, RE = renewable energy. Source: Author’s calculations.
If the GDP growth rate is 1% lower than the BAU scenario (GDPL), both the TPES and GDP will
be growing more slowly. The result of the primary energy intensity in 2040 will be 257
toe/million US$ in 2040, slightly higher than EE10 (254 toe/million US$). The primary energy
intensity will be higher than in the BAU scenario if the GDP is growing faster (GDPH); 297
toe/million US$ toe/million US$.
The final energy intensity of the BAU scenario in 2040 will be 196 toe/million US$; 0.7 times
lower than in 2015. Implementing a 20% energy saving target (EE20) will result in a 20%
improvement of BAU final energy intensity (Figure 6.16). The final energy intensity under
the EE20 will be 157 toe/million US$ in 2040. In the EE10, the final energy intensity will only
be 10% lower than the BAU scenario, which is 176 toe/million US$. Higher GDP growth
(GDPH) will result in a lower final energy intensity than BAU (185 toe/million US$) and lower
GDP growth (GDPL) will result in a higher intensity (209 toe/million US$).
251
227
297
257
274
245
424
215
150
200
250
300
350
400
450
2015 2020 2025 2030 2035 2040
Toe/
mil.
US$
BAU EE10 EE20 GDPL
GDPH OILH RE10 RE20

76
Figure 6.16 Final Energy Intensity
BAU Business-As-Usual, EE = energy efficiency, GDP = gross domestic product, toe = tons of oil equivalent, RE = renewable energy. Source: Author’s calculations.
The final energy intensity remains the same as the BAU scenario for the RE10 and RE20
because these two cases impact only on the TPES. The higher oil price will reduce the TFEC,
but as discussed above, only very slightly. So, the final energy intensity will almost be the
same as that of the BAU scenario.
CO2 emissions intensity
The CO2 emissions intensity in 2040 will be lower than the BAU scenario for all cases with the
same GDP assumption of BAU because the total CO2 emissions will be lower as explained
above. In the BAU scenario, CO2 emissions intensity (CO2/GDP) will be 200 ton-c/million US$.
Promoting RE development by 20% (RE20) will result in the lowest CO2 emissions intensity of
111 ton-c/million US$, which is 45% lower than the BAU scenario. If RE development is only
10% (RE10), the improvement of CO2 intensity s compared to the BAU scenario will only be
21% (Figure 6.17).
176
157
209
185
281
196
140
180
220
260
300
2015 2020 2025 2030 2035 2040
Toe/
mil.
US$
BAU EE10 EE20 GDPL
GDPH OILH RE10 RE20

77
Figure 6.17 CO2 Emissions Intensity (CO2/GDP)
BAU = Business-As-Usual, EE = energy efficiency, GDP = gross domestic product, RE = renewable energy. Source: Author’s calculations.
The EE promotion case only improves the CO2 intensity by 7% under the EE10 but can be
more (15%) under the EE20. Increasing oil prices (OILH) will also improve the CO2 emissions
intensity but by a very small amount (0.1%).
In case of different GDP levels, the CO2 emissions intensity will be 9% higher than the BAU
scenario under GDPL. Under GDPH, the CO2 emissions intensity will improve 7% more than
in the BAU scenario.
The CO2/TPES of the BAU scenario will be 0.73 ton-c/toe in 2040 and except for the RE
development cases (RE10 and RE20), the ratio of other cases will still be around 0.7 ton-c/toe.
The RE development cases will decrease the coal share in the TPES significantly, consequently
the total share in the TPES will decrease by 2040. In the RE10, the fossil fuel share in the TPES
will reduce to 60% from the 70% in BAU and to 40% in the RE20. Consequently, the CO2
emissions of the country will decrease very sharply in RE development cases and CO2/TPES
intensity will be 13% and 29% lower than BAU under the RE10 and RE20, respectively. Figure
6.18 shows the evolution of the CO2/TPES intensity of the BAU and the study cases (with index
2015=100).
200
171
218
186
156
232
111
-
50
100
150
200
250
300
2015 2020 2025 2030 2035 2040
ton
-c/m
illio
n U
S$
BAU EE10 EE20 GDPL
GDPH OILH RE10 RE20

78
Figure 6.18 CO2/TPES Intensity
BAU = Business-As-Usual, EE = energy efficiency, GDP = gross domestic product, RE = renewable energy, TPES = total primary energy supply. Source: Author’s calculations.
136
138
135
133134
117
100
94
80
90
100
110
120
130
140
150
2015 2020 2025 2030 2035 2040
ton
-C/t
oe
(20
15
=10
0)
BAU EE10 EE20 GDPL GDPH OILH RE10 RE20

79
Annex Table A6.1 Energy Balance Table 2015, BAU
Coal Hydropower Solar and Wind Biomass Electricity Oil Non-energy Total
Production 1552 1250 0 1619 0 0 0 4422
Imports 0 0 0 0 177 968 2 1147
Exports 0 0 0 0 -1126 -41 0 -1167
From Stock Change 0 0 0 0 0 0 0 0
Total Primary Supply 1552 1250 0 1619 -949 927 2 4402
Refinery 0 0 0 0 0 0 0 0
Electricity Generation -1371 -1250 0 -2 1470 0 0 -1153
Transmission and Distribution 0 0 0 0 -157 0 0 -157
Total Transformation -1371 -1250 0 -2 1314 0 0 -1310
Statistical Differences 0 0 0 172 0 9 0 181
Industry 181 0 0 56 150 46 0 433
Transport 0 0 0 0 0 868 0 868
Residential 0 0 0 1116 137 1 0 1254
Commercial 0 0 0 274 74 2 0 351
Agriculture 0 0 0 0 3 0 0 3
Non-energy 0 0 0 0 0 0 2 2
Total Demand 181 0 0 1446 365 918 2 2912
BAU = Business-As-Usual.
Source: Author’s calculations.
80
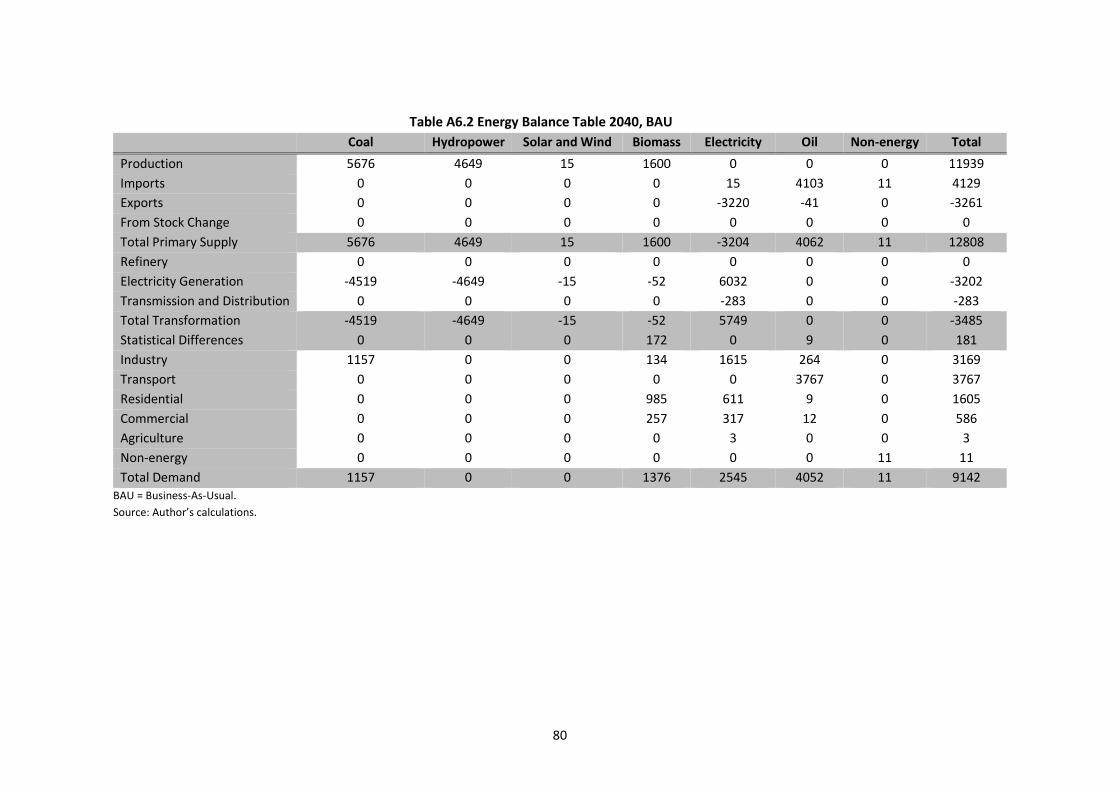
Table A6.2 Energy Balance Table 2040, BAU Coal Hydropower Solar and Wind Biomass Electricity Oil Non-energy Total
Production 5676 4649 15 1600 0 0 0 11939
Imports 0 0 0 0 15 4103 11 4129
Exports 0 0 0 0 -3220 -41 0 -3261
From Stock Change 0 0 0 0 0 0 0 0
Total Primary Supply 5676 4649 15 1600 -3204 4062 11 12808
Refinery 0 0 0 0 0 0 0 0
Electricity Generation -4519 -4649 -15 -52 6032 0 0 -3202
Transmission and Distribution 0 0 0 0 -283 0 0 -283
Total Transformation -4519 -4649 -15 -52 5749 0 0 -3485
Statistical Differences 0 0 0 172 0 9 0 181
Industry 1157 0 0 134 1615 264 0 3169
Transport 0 0 0 0 0 3767 0 3767
Residential 0 0 0 985 611 9 0 1605
Commercial 0 0 0 257 317 12 0 586
Agriculture 0 0 0 0 3 0 0 3
Non-energy 0 0 0 0 0 0 11 11
Total Demand 1157 0 0 1376 2545 4052 11 9142 BAU = Business-As-Usual.
Source: Author’s calculations.