laporte county snapshot
TRANSCRIPT

Data SnapShot Series 1.0February 2015
DATA SNAPSHOTLaPorte County

Table of contents
Introduction01Demography02
Economy03Labor Market04

Purpose
About LaPorte County
01introductio
n

4
Purpose
This document provides information and data about LaPorte County that can be used to guide local decision-making activities.
The Data SnapShot showcases a variety of demographic, economic and labor market information that local leaders, community organizations and others can use to gain a better perspective on current conditions and opportunities in their county.
To strengthen the value and usability of the information, we showcase the data using a variety of visual tools, such as charts, graphs and tables. In addition, we offer key points about the data as a way of assisting the user with the interpretation of the information presented.
Finally, short takeaway messages are offered at the end of each section in order to highlight some of the more salient findings.
Introduction
section 01

5
About LaPorte CountyIntroduction
section 01
County Background
Established 1832
CountySeat
LaPorte
Area 613 sq. mi.
NeighboringCounties
Berrien, MIJasper, INPorter, IN
St. Joseph, INStarke, IN

Population change
Population pyramids
Race
Ethnicity
Educational attainment
Takeaways
02demograp
hy

7
110,106
111,467
111,281
112,471
Population change
Components of Population Change, 2000-2013
Total Change 948
Natural Increase 3,723
International Migration
1,000
Domestic Migration
-3,131
The total population is projected to increase by 1 percent between 2013 and 2020.
Demography
Sources: STATSIndiana, U.S. Census Bureau – 2000 Decennial Census, 2010 Decennial Census, 2013 Estimates, Estimates of the Components of Resident Population Change
section 02
The total population increased by 1 percent between 2000 and 2013. The major contributor to that expansion was natural increase (births minus deaths over that span of time) with a net growth of over 3,700 persons.
Data on domestic migration (the difference between the number of people moving out of the county versus moving in) show that out-migration outpaced in-migration by more than 3,100 people. On the other hand, international migration had a net increase of 1,000, indicating that the county experienced an influx of new people from outside the U.S.
Total population projections
2000
2010
2013
2020

8
0-9
10-19
20-29
30-39
40-49
50-59
60-69
70-79
80+
9 6 3 0 3 6 9
6.0%
6.4%
7.4%
7.2%
7.3%
7.6%
5.7%
2.9%
1.4%
5.9%
6.0%
5.5%
5.5%
6.3%
7.2%
6.0%
3.4%
2.5%
Percent of Total PopulationA
ge C
oh
ort
0-9
10-19
20-29
30-39
40-49
50-59
60-69
70-79
80+
9 6 3 0 3 6 9
6.9%
7.1%
7.1%
8.2%
8.5%
6.0%
3.6%
2.8%
1.1%
6.4%
6.5%
5.6%
6.7%
7.5%
5.8%
3.9%
3.8%
2.3%
Percent of Total Population
Ag
e C
oh
ort
Population pyramidsPopulation pyramids are visual representations of the age distribution of the population by gender.
While the male to female ratio of the population did not change dramatically between 2000 and 2013, the distribution of people across the various age categories did change over the two periods of time.
Demography
Source: U.S. Census Bureau – 2000 Decennial Census and 2013 Annual Population Estimates
section 02
The percentage of people under 50 years old has decreased for both males and females over the 2000-2013 period. In addition, the number 50 years old and over now stands at nearly 40,700 people (about 37 percent of the population, up from 29 percent in 2000).
Male
Female
20132000
Male
Female

9
White86%
Black
Asian
Native
Two or More Races
White88%
Black
Asian
Native
Two or More Races
Race
The number of non-White residents in LaPorte County increased by 2 percentage points between 2000 and 2013.
While every race, other than White, experienced a numerical increase since 2000, the population of Black and those of Mixed Races gained the most people, helping to expand the population of Other Races from 12 percent to 14 percent of the total population between 2000 and 2013.
Demography
Race Data Source: U.S. Census Bureau – 2000 Decennial Census and 2013 Annual Population Estimates
section 02
2000
2013
10
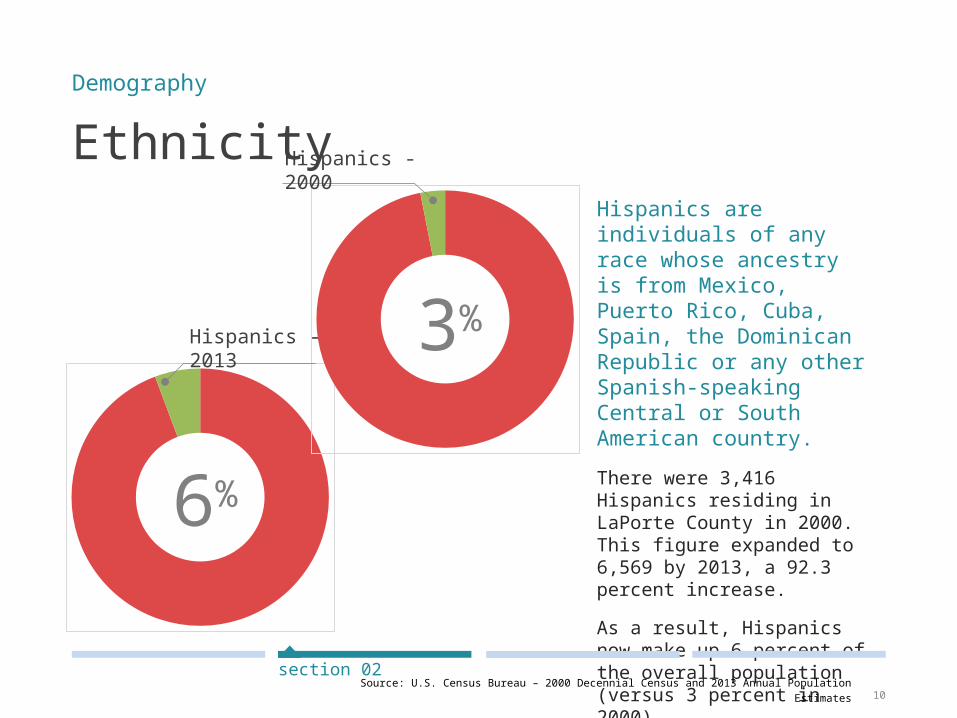
EthnicityHispanics are individuals of any race whose ancestry is from Mexico, Puerto Rico, Cuba, Spain, the Dominican Republic or any other Spanish-speaking Central or South American country.
There were 3,416 Hispanics residing in LaPorte County in 2000. This figure expanded to 6,569 by 2013, a 92.3 percent increase.
As a result, Hispanics now make up 6 percent of the overall population (versus 3 percent in 2000).
Demography
Source: U.S. Census Bureau – 2000 Decennial Census and 2013 Annual Population Estimates
section 02
6%
3%
Hispanics - 2000
Hispanics - 2013

11
No High School;
19%
High School;
41%
Some College;
20%
Asso-ciate's Degree,
6%
Bache-lor's
Degree or More;
14%
Educational attainment LaPorte County witnessed a 5
percent increase between 2000 and 2013 in the proportion of adults (25 and over) with an
associate’s, bachelor’s or graduate degree.
The proportion of adults 25 years of age and older with a high school
education or more improved from 81 percent in 2000 to 86 percent by
2013.
Residents with less than a high school education fell by 5
percentage points and those with some college education rose by 1
percentage point from 2000 to 2013.
The number of adults with a college degree increased from 20 percent in
2000 to 25 percent in 2013. This was due to a 2 percent increase in
associate’s degrees and a 3 percent increase in adults with at least a
bachelor's degree.
Demography
Source: U.S. Census Bureau – 2000 Decennial Census and 2013 ACS
section 02
2000
2013
No High School;
14%
High School;
40%Some Col-lege; 21%
Asso-ciate's Degree;
8%
Bache-lor's
Degree or More;
17%

12
Takeaways
The population of LaPorte County is expected to grow modestly over the next few years, and if past trends hold, that increase will be largely due to natural increase (more births than deaths).
While LaPorte County’s population has been growing over the 2000 to 2013 period, it has also been aging. This suggests a need to take a hard look at how the county can remain hospitable and responsive to the needs of growing number of people over 50. In addition, the county’s domestic migration has declined by over 3,000, suggesting that young individuals and those of prime working age (30 to 39 and 40 to 49 years of age) are moving out of the county at a faster pace than they are moving in.
While the population remains largely white, the growth of the Hispanic community is worthy of note. As such, finding ways to address the needs and opportunities of a diversifying population will be important.
The educational attainment of adults 25 and over has improved since 2000, but the number with a high school education only continues to be high (at 40 percent). So, determining if this could be a barrier to economic growth is worthy of examining.
LaPorte County may want to explore the mix of services and amenities that will be vital to retaining and attracting educated young adults, including the availability of good quality jobs.
Demography
section 02

Establishments
Industries
Occupations
Income and poverty
Takeaways
03economy

14
Establishments
Components of Change for Establishments
Total Change (2000-11) 2,144
Natural Change (births minus deaths) 2,043
Net Migration (number moving in versus moving out of the county)
101
The number of establishments in LaPorte County doubled between 2000 and 2011.
The rapid growth of establishments was largely due to natural change. That is, 7,081 establishments were launched in the county between 2000 and 2011, while 4,937 closed, resulting in a gain of 2,144 establishments.
Economy
Source: National Establishment Time Series (NETS) – 2012 Database
section 03
An establishment is a physical business
location. Branches, standalones and
headquarters are all considered types of
establishments.
Definition of Company Stages
0 12 3
4
Self-employed
2-9 employees
10-99employees
100-499employees
500+employees
Note: The 2011 figures use 2012 data to include all gains and losses over the entire
year. Establishment information was calculated in-house and may differ slightly from publicly available data.

15
Number of establishments by stage/employment category
Economy
Source: National Establishment Time Series (NETS) – 2012 Database
section 03
2000 2011
Stage Establishments Proportion Establishment
s Proportion
Stage 0 1,294 24% 2,175 29%
Stage 1 2,994 56% 4,348 58%
Stage 2 925 17% 850 11%
Stage 3 79 1% 68 1%
Stage 4 13 0% 8 0%
Total 5,305 100% 7,449 100%
Note: The 2011 figures use 2012 data to include all gains and losses over the entire year.

16
Number of jobs by stage/employment category
Economy
Source: National Establishment Time Series (NETS) – 2012 Database
section 03
2000 2011Stage Jobs Proportion Jobs Proportion
Stage 0 1,294 2% 2,175 4%
Stage 1 11,164 18% 13,607 24%
Stage 2 23,972 40% 22,641 39%
Stage 3 14,500 24% 12,630 22%
Stage 4 9,435 16% 6,845 12%
Total 60,365 100% 57,898 100%
Note: The 2011 figures use 2012 data to include all gains and losses over the entire year.

17
Amount of sales (2011 dollars) by stage/employment category
Economy
Source: National Establishment Time Series (NETS) – 2012 Database
section 03
2000 2011Stage Sales Proportion Sales Proportion
Stage 0 $160,046,855 2% $146,378,224 3%
Stage 1 $1,670,192,872 21% $1,212,360,959 21%
Stage 2 $3,034,642,492 38% $2,086,169,167 37%
Stage 3 $2,001,047,378 25% $1,719,904,604 30%
Stage 4 $1,169,791,625 15% $535,943,906 9%
Total $8,035,721,221 100% $5,700,756,860 100%
Note: The 2011 figures use 2012 data to include all gains and losses over the entire year.

18
Manufacturing14.5%
Government13.6%
Retail Trade12.3%
Health Care & Social Assis-
tance11.1%
Accommoda-tion & Food
Services8.0%
All Other Indus-tries
40.5%
Top five industries in 2013
59.5 percent of jobs are tied to one of the top five industries in LaPorte County.
Manufacturing is the largest industry sector (7,756 jobs), followed by government (7,262 jobs) and retail trade (6,586 jobs).
Accommodation & Food Services is the smallest of the top industry sectors with 4,272 jobs.
The top four industries all lost jobs between 2002 and 2013. Only Accommodation & Food Services experienced job gains over the two periods of time (12 percent growth).
Economy
Source: Economic Modeling Specialists International (EMSI) – 2014.3 – QCEW Employees, Non-QCEW Employees, Self-Employed, and Extended Proprietors
section 03

19
Industry distribution and changeNAICS Code
Description Jobs 2002
Jobs 2013
Change (2002-2013)
% Change (2002-2013)
Average Total
Earnings 2013
11Agriculture, Forestry, Fishing & Hunting 1,079 1,147 68 6% $28,778
21Mining, Quarrying, & Oil & Gas Extraction 128 56 -72 -56% $12,669
22 Utilities 280 238 -42 -15% $170,36723 Construction 3,336 2,679 -657 -20% $52,22931-33 Manufacturing 9,621 7,756 -1,865 -19% $59,85642 Wholesale Trade 1,264 1,413 149 12% $52,10944-45 Retail Trade 7,053 6,586 -467 -7% $23,79248-49 Transportation & Warehousing 2,341 2,100 -241 -10% $47,54251 Information 834 396 -438 -53% $33,44052 Finance & Insurance 1,269 1,496 227 18% $55,53753 Real Estate & Rental & Leasing 1,831 2,109 278 15% $23,970
54Professional, Scientific & Technical Services 1,505 1,553 48 3% $35,344
55Management of Companies and Enterprises 70 154 84 120% $72,808
56 Administrative & Waste Management 2,654 2,994 340 13% $25,87861 Educational Services (Private) 538 544 6 1% $26,15962 Health Care & Social Assistance 6,464 5,952 -512 -8% $53,01471 Arts, Entertainment & Recreation 1,864 1,783 -81 -4% $27,56172 Accommodation and Food Services 3,825 4,272 447 12% $14,953
81Other Services (except Public Administration) 2,756 2,980 224 8% $19,429
90 Government 8,156 7,262 -894 -11% $48,16099 Unclassified Industry <10 <10 - - -All Total 56,870 53,473 -3,397 -6% $40,108
Economy
Source: Economic Modeling Specialists International (EMSI) – 2014.3 – QCEW Employees, Non-QCEW Employees, Self-Employed, and Extended Proprietors
section 03

20
Employment Increase
Employment Decrease
Industries with the largest gains and losses in employment numbers between 2002 & 2013:
Industry distribution and change
The largest percentage gains in employment in LaPorte County occurred in: Management of Companies
and Enterprises (+120.0 percent)
Finance and Insurance (+17.9 percent)
The largest percentage losses in employment occurred in: Mining, Quarrying and Oil and
Gas Extraction (-56.3 percent) Information (-52.5 percent)
Economy
Source: Economic Modeling Specialists International (EMSI) – 2014.3 – QCEW Employees, Non-QCEW Employees, Self-Employed, and Extended Proprietors
section 03
Manufacturing(-1,865)
Government(-894)
Construction(-657)
Accommodation and Food
Services (+447)
Administrative and Waste
Management (+340)

21
Sales & Related 14.3%
Office & Administrative Support 12.6%
Produc-tion 9.9%
Food Preparation & Serving Related
8.7%
Transportation & Mate-rial Moving
6.2%
All Other Occupa-
tions48.3%
Top five occupations in 2013
The top five occupations in LaPorte County represent 51.7 percent of all jobs.
Sales & Related (14.3 percent of the workforce with 7,660 jobs) and Office & Administrative Support (12.6 percent of the labor force involving 6,723 jobs) represent the top two occupations in LaPorte County.
Transportation & Material Moving is the smallest of the top five occupations in the county (with 6.2 percent of the workforce and 3,319 jobs).
Economy
Source: Economic Modeling Specialists International (EMSI) – 2014.3 – QCEW Employees, Non-QCEW Employees, Self-Employed, and Extended Proprietors
section 03

22
SOC Description Jobs
2002Jobs 2013
Change (2002-2013)
% Change (2002-2013)
Hourly Earnings
201311 Management 3,154 3,142 -12 0% $24.4913 Business & Financial Operations 1,617 1,664 47 3% $24.2715 Computer & Mathematical 485 426 -59 -12% $24.5617 Architecture & Engineering 782 646 -136 -17% $28.8619 Life, Physical & Social Science 232 226 -6 -3% $25.6121 Community & Social Service 916 732 -184 -20% $16.9523 Legal 228 198 -30 -13% $26.4225 Education, Training & Library 2,372 2,350 -22 -1% $20.93
27Arts, Design, Entertainment, Sports & Media 1,094 1,013 -81 -7% $13.34
29 Health Care Practitioners & Technical 2,460 2,384 -76 -3% $41.4731 Health Care Support 1,358 1,266 -92 -7% $11.8733 Protective Service 2,129 1,965 -164 -8% $19.1235 Food Preparation & Serving Related 4,396 4,664 268 6% $9.36
37Building & Grounds Cleaning Maintenance 1,922 2,077 155 8% $10.13
39 Personal Care & Service 2,057 2,280 223 11% $9.4141 Sales & Related 7,508 7,660 152 2% $13.6043 Office & Administrative Support 7,640 6,723 -917 -12% $14.5845 Farming, Fishing & Forestry 239 272 33 14% $9.5547 Construction & Extraction 3,009 2,497 -512 -17% $19.9049 Installation, Maintenance & Repair 2,216 2,023 -193 -9% $17.9651 Production 6,556 5,302 -1,254 -19% $15.3453 Transportation & Material Moving 3,877 3,319 -558 -14% $16.3355 Military 383 375 -8 -2% $19.2799 Unclassified 239 269 30 13% $11.58All Total 56,870 53,473 -3,397 -6% $16.96
Occupation distribution and change
Economy
Source: Economic Modeling Specialists International (EMSI) – 2014.3 – QCEW Employees, Non-QCEW Employees, Self-Employed, and Extended Proprietors
section 03

23
Occupations with the largest gains and losses in employment numbers between 2002 & 2013:
Employment Increase
Employment Decrease
Food Preparation & Serving
(+268)
Personal Care & Service(+223)
Production(-1,254)
Office & Administrative
(-917)
Transportation & Material Moving
(-558)
Occupation distribution and change
Economy
Source: Economic Modeling Specialists International (EMSI) – 2014.3 – QCEW Employees, Non-QCEW Employees, Self-Employed, and Extended Proprietors
section 03
The largest percentage gain in employment in LaPorte County occurred in: Farming, Fishery and Forestry
(+12.8 percent) Personal Care and Service
(+10.8 percent) Building Grounds and
Cleaning Maintenance (+8.1 percent)
The largest percentage loss in employment occurred in: Community and Social Service
(-20.1 percent) Production (-19.1 percent)

24
Income and poverty
2000 2006 2013
Total Population in Poverty 9.5% 12.0% 17.0%
Minors (up to age 17) in Poverty 12.7% 18.6% 26.9%
Real Median Income (2013 base year)
$ 53,611 $ 53,213 $ 46,610
The median income in LaPorte County dipped by $7,000 between 2000 and 2013 in real dollars (that is, adjusted for inflation).
Both the total population in poverty and the number of minors in poverty increased since 2000. A key statistic is that the number of minors in poverty more than doubled between 2000 and 2013.
Economy
Source: U.S. Census Bureau – Small Area Income and Poverty Estimates (SAIPE)
section 03

25
2000
2001
2002
2003
2004
2005
2006
2007
2008
2009
2010
2011
2012
2013
42,000
44,000
46,000
48,000
50,000
52,000
54,000
56,000
0
5
10
15
20
25
30
Rea
l Med
ian In
com
e (2
013 d
ol-
lars
)
Popula
tion
in P
over
ty (
per
cent)
Median Income
Minors in Poverty
All Ages in Poverty
Income and povertyMedian income in LaPorte County has decreased in recent years, while poverty has continued to increase.
Economy
Source: U.S. Census Bureau – Small Area Income and Poverty Estimates (SAIPE)
section 03

26
Takeaways Growth in the number of establishments in LaPorte County occurred in businesses having fewer than 10 employees (the self-employed and Stage 1 enterprises). These are two components of the local economy that are often overlooked but may deserve closer attention by local leaders.
Industries that have experienced major job losses have tended to be in the manufacturing, government, construction and health care and social assistance sectors, all with average earnings of $48,000 or more. Growth in jobs has occurred in industries that pay decent wages (such as Finance & Insurance and Wholesale Trade) but also by industries that provide low average earnings (Accommodation & Food Services, Administrative & Waste Management, and Real Estate & Leasing). It may be these
shifts in the industry make-up of the county that have contributed to a decline in median income (in real dollars) and the upswing in the poverty rate in LaPorte County since 2000.
With the exception of business and financial operations, occupations that have grown the most between 2002 and 2013 in the county pay an average hourly rate of $9.36 to $13.60. This level of compensation will not be sufficient to retain well-educated or highly skilled workers.
It may be worthwhile for LaPorte County to focus on policies and programs that strengthen high-growth Stage 2 firms, since they tend to employ several people and are capturing sizable sales.
Services targeted to poverty-stricken individuals should be considered given the dramatic rise in poverty, especially for children under 18 years old.
Economy
section 03

Labor force and unemployment
Commuteshed
Laborshed
Takeaways
04labor
market

28
Labor force and unemployment
2002 2013
Labor Force 54,092 48,905
Unemployment Rate 6.8% 9.4%
The labor force in LaPorte County decreased by 9.6 percent between 2002 and 2013.
This decrease is likely due to a rise in the number of individuals who are either officially unemployed or who have given up looking for a job.
Labor market
Source: U.S. Bureau of Labor Statistics – Local Area Unemployment Statistics
section 04

29
20002001
20022003
20042005
20062007
20082009
20102011
20122013
0.0
2.0
4.0
6.0
8.0
10.0
12.0
14.0
3.3%
6.8%
5.1%
11.9%
9.4%
Unem
plo
yment
Rate
(perc
ent)
Unemployment rateUnemployment increased dramatically after 2007, peaking at 11.9 percent in 2009. Since that time, the rate has been on a slow but steady decline, dipping to 9.4 percent by 2013.
Labor market
Source: U.S. Bureau of Labor Statistics – Local Area Unemployment Statistics
section 04

30
Commuteshed
A county’s commuteshed is the geographic area to which its work force travels to work.
Forty-nine percent of employed residents in LaPorte County commute to jobs located outside of LaPorte County.
The top counties where LaPorte county residents commute are Lake County (4,685 workers), Porter County (4,609 workers) and St. Joseph County (3,214 workers).
Labor market
Source: U.S. Census Bureau – Longitudinal Employer-Household Dynamics (LEHD)
section 04
22,710
Out-Commuters
23,405
Same Work/Home
Commuters Proportion
Lake, IN 4,685 10.2%
Porter, IN 4,609 10.0%
St. Joseph, IN 3,214 7.0%
Marion, IN 1,614 3.5%
Berrien, MI 1,202 2.6%

31
Commuteshed in 2011Labor market
section 04
Source: U.S. Census Bureau, OTM, LEHD, PCRD
Seventy-five percent of LaPorte County’s working residents are employed either in LaPorte, Lake or Porter Counties. Another 5 percent commute to Cook County, Illinois, or Berrien County, Michigan. An additional 5 percent travel to jobs in St. Joseph or Marion Counties.
Collectively, these seven counties represent 85 percent of the commuteshed for LaPorte County.
32
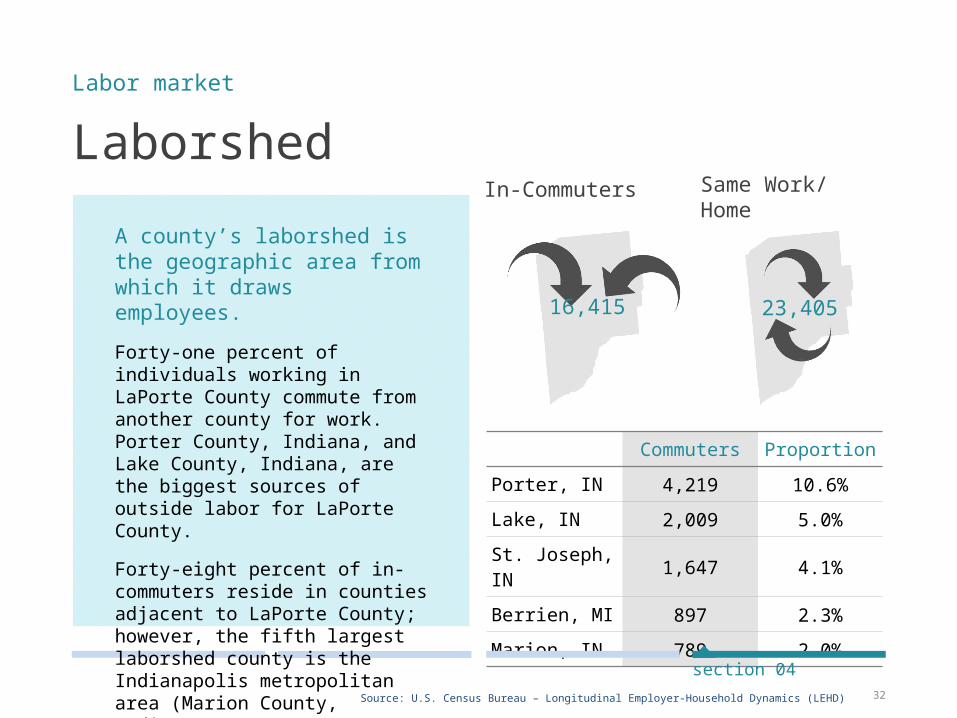
Laborshed
Commuters Proportion
Porter, IN 4,219 10.6%
Lake, IN 2,009 5.0%
St. Joseph, IN 1,647 4.1%
Berrien, MI 897 2.3%
Marion, IN 789 2.0%
Labor market
Source: U.S. Census Bureau – Longitudinal Employer-Household Dynamics (LEHD)
section 04
16,415
In-Commuters
23,405
Same Work/Home
A county’s laborshed is the geographic area from which it draws employees.
Forty-one percent of individuals working in LaPorte County commute from another county for work. Porter County, Indiana, and Lake County, Indiana, are the biggest sources of outside labor for LaPorte County.
Forty-eight percent of in-commuters reside in counties adjacent to LaPorte County; however, the fifth largest laborshed county is the Indianapolis metropolitan area (Marion County, Indiana).

33
Laborshed in 2011Labor market
section 04
Source: U.S. Census Bureau, OTM, LEHD, PCRD
The bulk (75 percent) of LaPorte County’s workforce
is drawn from LaPorte, Lake, and Porter Counties.
Another 5 percent is drawn from St. Joseph County in
Indiana and Berrien County in Michigan. An additional 5
percent come from Starke and Marion Counties in
Indiana and Cook County in Illinois.
Combined, the eight counties represent 85
percent of LaPorte County’s laborshed.

34
Takeaways
LaPorte County’s unemployment rate increased after 2002, swelling to nearly 12 percent by 2009. This increase occurred during the period of the Great Recession (approximately 2008 to 2010). The rate has since been declining.
Despite the modest changes in the population over the past decade or more, the county’s labor force has decreased since 2002, indicating that there may be an increasing number of individuals who are unemployed or are discouraged workers (workers who have given up trying to find a job).
Employees that work but do not live in LaPorte County tend to commute from surrounding counties. People who commute out of the county for work often travel to other metropolitan areas.
LaPorte County should assess if a major workforce development training effort should be targeted to the growing number of working age adults struggling to find jobs. Furthermore, determining the human capital attributes of workers who commute to jobs outside the county might be insightful. It may provide the information needed to determine how best to reduce the leakage of educated and skilled workers to surrounding counties.
The laborshed and commuteshed data suggest there may be some value in exploring economic and workforce development from a regional (multi-county) basis.
Labor market
section 04

35
Report ContributorsThis report was prepared by the Purdue Center for Regional Development in partnership with Purdue University Extension.
section 04
Data AnalysisIndraneel Kumar, Ph.D.Ayoung Kim
Report AuthorsElizabeth DobisBo Beaulieu, Ph.D.
Report DesignTyler WrightAdeline Jackson

FOR MORE INFORMATION
Purdue Center for Regional Development (PCRD) . . .seeks to pioneer new ideas and strategies that contribute to regional collaboration, innovation and prosperity.
Purdue Extension Community Development (CD) . . . works to strengthen the capacity of local leaders, residents and organizations to work together to develop and sustain strong, vibrant communities.
Please contact
Mary FoellCounty Extension Community Development [email protected]
PCRDMann Hall, Suite 266Purdue University
OR