lapse experience in life insurance industry - institute of actuaries … venkateswara rao.pdf ·...
TRANSCRIPT
Analysis of Analysis of Lapse Experience of Lapse Experience of
Life Insurance policies Life Insurance policies in Indiain India
R.KannanR.KannanK.P. K.P. SarmaSarmaA.V.RaoA.V.Rao
S.K. S.K. SarmaSarma

This focuses onThis focuses on……....
Background Background Collection of data Collection of data –– ProblemsProblems--RectificationRectificationAnalysisAnalysis
Trends in the industryTrends in the industryAnalysis by grouping of companies Analysis by grouping of companies Single factor analysisSingle factor analysisTwo factor analysisTwo factor analysisCausal factor studyCausal factor study
ConclusionsConclusions

Volume of data received from companiesVolume of data received from companies
The total lapses and exposure for the industry during The total lapses and exposure for the industry during the period 2002the period 2002--03 to 200603 to 2006--07 :07 :
LapsesLapses Exposed to RiskExposed to Risk
NumberNumber 5.226 5.226 crorecrore
lifelife-- yearsyears73.419 73.419 crorecrore
life life
yearsyears
PremiumPremium RsRs. 20,521 . 20,521 crorecrore RsRs. 3,36,183 . 3,36,183 crorecrore

Trends in lapse rate for the industry as a whole
3.50%4.00%4.50%5.00%5.50%6.00%6.50%7.00%7.50%8.00%8.50%
Financial Year
Laps
e ra
te
Lapse rate-Number 5.62% 7.76% 7.79% 7.60% 6.64%
Lapse rate-Premium
4.40% 5.91% 6.70% 6.95% 6.18%
2002-03 2003-04 2004-05 2005-06 2006-07
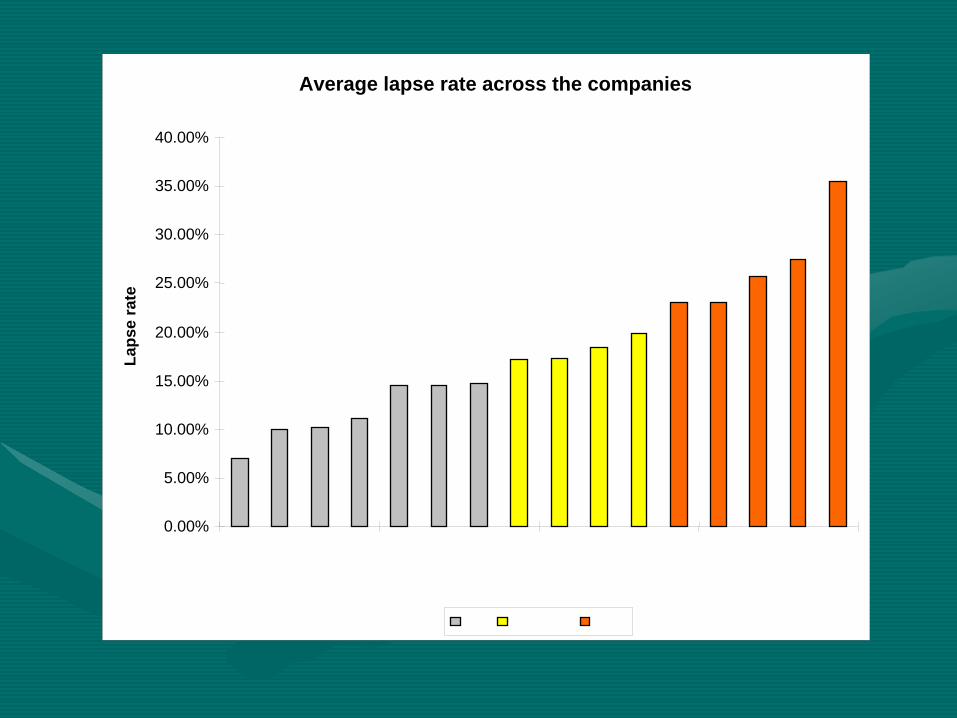
Average lapse rate across the companies
0.00%
5.00%
10.00%
15.00%
20.00%
25.00%
30.00%
35.00%
40.00%La
pse
rate
Need for grouping the companiesNeed for grouping the companies
••
Observation of average lapse rate for 2004Observation of average lapse rate for 2004--05 to 200605 to 2006-- 07 revealed wide variation in lapse rate across the 07 revealed wide variation in lapse rate across the
companies(7% to 35%).companies(7% to 35%).••
It was observed that industry trends were mostly It was observed that industry trends were mostly dominated by few companies (called dominated by few companies (called GroupGroup--I I companiescompanies
hereafter) having lapse rate less than 10%.hereafter) having lapse rate less than 10%.
••
It was felt necessary to make some analysis separating It was felt necessary to make some analysis separating these low lapsethese low lapse--rate companies from others (called rate companies from others (called GroupGroup--II companiesII companies
here after) to get more obvious here after) to get more obvious
picture regarding level of lapse.picture regarding level of lapse.

Trends in lapse rate for Group - I companies
4.00%
4.50%
5.00%
5.50%
6.00%
6.50%
7.00%
7.50%
8.00%
Financial Year
Laps
e ra
te
Lapse rate(number) 5.53% 7.60% 7.55% 7.23% 6.18%
Lapse rate (premium) 4.31% 5.76% 5.86% 5.90% 5.29%
2002-03 2003-04 2004-05 2005-06 2006-07
Trends in lapse rate for Group - II companies
10.00%
12.50%
15.00%
17.50%
20.00%
22.50%
25.00%
27.50%
Financial Year
Laps
e ra
te
Lapse rate(number) 24.99% 22.93% 21.35% 20.55% 18.01%
Lapse rate(premium)
13.80% 11.19% 13.23% 16.59% 12.54%
2002-03 2003-04 2004-05 2005-06 2006-07
Group-I Companies•Levels and trends in lapse rate are similar to those of industry.•Number lapse rate varied from 5.53% to 6.18%
(Industry rate 5.62% to 6.64%) and Premium lapse rate varied from 4.31% to
5.29% (Industry rate 4.40% to 6.18%).
Group-II Companies •Number lapse rate gradually decreased from 25% in 2002-
03 to 18.01% in 2006-07. (Industry rate 5.62% to 6.64%) •Premium lapse rate showed fluctuations (between 12.5% to 16.6%) with fall in 2003-04 and sharp rise in 2005-06. (Industry rate varied from 4.40% to 6.18%).

Financial year wise variation in lapse rate in premium
0.00%
5.00%
10.00%
15.00%
20.00%
Financial year
Laps
e ra
te
Group-Icompanies
4.36% 5.80% 5.95% 6.07% 5.47%
Group-IIcompanies
17.37% 15.74% 13.48% 14.49% 15.36%
2002-03 2003-04 2004-05 2005-06 2006-07
Financial year wise variation in lapse rate in number
0.00%
5.00%
10.00%
15.00%
20.00%
25.00%
30.00%
Financial year
Lapse rateLa
Group-Icompanies
5.52% 7.53% 7.51% 7.24% 5.52%
Group-IIcompanies
27.15% 24.44% 19.76% 20.52% 27.15%
2002-03 2003-04 2004-05 2005-06 2006-07
With profit Endowment type of product
Group-I companies showed a different trend with that by Group-II companies
For the group-I companies the lapse rate has increased from 2002-03 to 2004-05 and then decreased thereafter. Whereas converse is observed with respect to the group-II companies.
The scale of lapse varies by large extent between the groups as evident from the data values. However, the volume of the data for Group-II companies is considerably low.

Financial year wise variation in lapse rate in premium
0.00%
10.00%
20.00%
30.00%
40.00%
50.00%
Financial year
Laps
e ra
te
Group-I companies
4.51% 4.25% 2.81% 2.38% 2.33%
Group-IIcompanies
11.56% 42.69% 27.02% 27.21% 25.10%
2002-03 2003-04 2004-05 2005-06 2006-07
Financial year wise variation in lapse rate in number
0.00%
10.00%
20.00%
30.00%
40.00%
50.00%
60.00%
70.00%
Financial year
Laps
e ra
te
Group-I companies
9.24% 6.10% 3.32% 3.11% 9.24%
Group-IIcompanies
22.87% 57.56% 34.96% 28.99% 22.87%
2002-03 2003-04 2004-05 2005-06 2006-07
Non-profit Endowment type product
With respect to number of policies, lapse rate for group-I companies is observed to decrease from 2002-03 to 2005-06 and then increased in 2006-07 whereas with respect to premium lapse rate is observed to decrease from 2002-03 to 2006-07.
For the group-II companies there is a large increase in lapse rate from 2002-03 to 2003-04 from 2002-03 and thereafter the lapse rate decreased until 2006-07.

Financial year wise variation in lapse rate in number
0.00%
10.00%
20.00%
30.00%
40.00%
50.00%
Financial year
Laps
e ra
te
Group-Icompanies
27.69% 43.56% 35.64% 27.30% 27.69%
Group-IIcompanies
32.41% 25.85% 37.44% 31.62% 32.41%
2002-03 2003-04 2004-05 2005-06 2006-07
Financial year wise variation in lapse rate in premium
0.00%
5.00%
10.00%
15.00%
20.00%
25.00%
30.00%
Financial year
Laps
e ra
te
Group-Icompanies
15.49% 27.61% 21.61% 15.12% 12.48%
Group-IIcompanies
22.15% 15.65% 17.71% 17.11% 24.52%
2002-03 2003-04 2004-05 2005-06 2006-07
With respect to number of policies lapsed, group-I companies has a different trend to that of group-II companies up to 2004-05.
For group-I companies the lapse rate has increased from 2002-03 to 2003-04 and decreased thereafter and for group-II companies, the lapse rate has increased from 2002-03 to 2003-04 and decreased thereafter.
Also, in 2003-04 the number lapse rate for group-I companies is higher than that of group-II companies.
A similar trend is observed with respect to premium lapsed with the lapse rate for group-I is higher than that under the group-II in 2003-04 and 2004-05.
Term assurance product

Financial year wise variation in lapse rate in number
0.00%
10.00%
20.00%
30.00%
40.00%
50.00%
Financial year
Laps
e ra
te
Group-I companies 10.00% 13.75% 32.05% 44.49% 10.00%
Group-II companies 11.51% 13.83% 8.03% 10.46% 11.51%
2002-03 2003-04 2004-05 2005-06 2006-07
Financial year wise variation in lapse rate in premium
0.00%
2.00%
4.00%
6.00%
8.00%
10.00%
12.00%
14.00%
Financial year
Laps
e ra
te
Group-I companies 3.82% 4.01% 4.08% 4.91% 4.43%
Group-II companies 9.32% 11.97% 5.89% 7.86% 8.46%
2002-03 2003-04 2004-05 2005-06 2006-07
Number lapse rate for both the groups is almost the same until 2003-04 and thereafter the
group-I companies showed higher lapse rate than the group-
II companies with a sharp increase of lapse rate to 44.5% in 2005-06 and decrease to 10% in 2006-07.
Premium lapse rate (roughly around 4%) for the group-I class doesn’t have as much fluctuation as the
corresponding number lapse rate has. Even though there is a sharp increase in number lapse rate to 44.5% in 2005-06 there is no increase of such magnitude in premium lapse rate. One of the factors leading to this kind of observation was the decrease in average premium lapsed per policy
Unit linked products

Financial year wise variation in lapse rate in number
0.00%
2.00%
4.00%
6.00%
8.00%
10.00%
Financial year
Lapse rate
Group-I companies 0.61% 2.31% 2.31% 1.80% 0.61%
Group-II companies 1.89% 6.75% 6.21% 8.60% 1.89%
2002-03 2003-04 2004-05 2005-06 2006-07
Financial year wise variation in lapse rate in premium
0.00%
1.00%
2.00%
3.00%
4.00%
5.00%
6.00%
7.00%
Financial year
Laps
e ra
te
Group-I companies 0.39% 1.02% 1.05% 1.45% 2.29%
Group-II companies 0.88% 4.18% 3.90% 6.18% 3.54%
2002-03 2003-04 2004-05 2005-06 2006-07
•Pension product had the least lapse rate compared to other type of products.
•For group-I companies the number-lapse rate was observed to be decreasing from 2003-04 and premium-
lapse rate increasing from 2002-03.
•For group-II companies, trends in lapse rate both with respect to number and premium were observed to have similar trends with each other with highest lapse rate being shown in 2005-06
Pensions

For financial year 2006For financial year 2006--0707
Variation in lapse rate with respect to combination of duration and policy type
0.00%
10.00%
20.00%
30.00%
40.00%
50.00%
60.00%
70.00%
Duraton in years
Laps
e ra
te
WP-Endowment 12.47% 9.24% 6.56% 5.67%NP-Endowment 34.05% 28.93% 13.16% 4.60%Term 22.50% 58.96% 24.72% 11.36%WP-Whole life 10.53% 10.03% 5.30% 4.15%NP-Whole life 65.89% 45.33% 15.62% 4.47%ULIP 13.43% 18.10% 8.78% 3.94%
0-1 1-2 2-3 3-4
•The term assurance policies showed the highest lapse rates at all durations from 1-2 years compared to other product types. •There is large increase in lapse rate (more than doubled) from duration of 0-1 to 1-2 years which is a deviation from normally expected trend of decreasing lapse rate with increasing duration elapsed. •Unit linked policies showed similar deviation form 0-1 to 1-2 years of duration.

Analysis using single factor dataAnalysis using single factor data Significant factorsSignificant factors
••
ANOVA principles were applied to find the significance of the fANOVA principles were applied to find the significance of the factors actors in affecting the lapse rates in the industry.in affecting the lapse rates in the industry.
••
The factors in decreasing order of significance in affecting thThe factors in decreasing order of significance in affecting the lapse rate e lapse rate with respect to with respect to number of policiesnumber of policies
werewere1.1.
Age at entryAge at entry2.2.
Mode of premium paymentMode of premium payment3.3.
Duration elapsed since inception of the policyDuration elapsed since inception of the policy4.4.
Type of policyType of policy5.5.
Type of AgencyType of Agency6.6.
Type of underwriting i.e. Medical/Non medicalType of underwriting i.e. Medical/Non medical
••
The factors in decreasing order of significance in affecting theThe factors in decreasing order of significance in affecting the
lapse rate lapse rate with respect to with respect to premiumpremium
werewere1.1.
Age at entryAge at entry2.2.
Duration elapsed since inception of the policyDuration elapsed since inception of the policy3.3.
Mode of premium paymentMode of premium payment4.4.
Type of underwriting i.e. Medical/Non medicalType of underwriting i.e. Medical/Non medical5.5.
Type of policyType of policy6.6.
Premium paying termPremium paying term

Analysis using single factor data Analysis using single factor data Trends in the industry lapse rates with respect to the Trends in the industry lapse rates with respect to the
significant factorssignificant factorsAge at entryAge at entry
Trends with number and Trends with number and premium were similar.premium were similar.Low lapse rates at ages less than Low lapse rates at ages less than 18 years.18 years.Sharp rise in lapse rate to age Sharp rise in lapse rate to age range of 18range of 18--2727Continuous decrease there after Continuous decrease there after till age group 53till age group 53--5757Probable causes of high lapse Probable causes of high lapse rate at younger agesrate at younger agesoo
Lack of appreciation of Lack of appreciation of need for insuranceneed for insurance
oo
Lack of continuity in Lack of continuity in earningsearnings
oo
Inclination towards Inclination towards alternative risky investmentsalternative risky investments
Industry wise trends in Lapse rate(number) with respect to Age at entry
0.00%
2.00%
4.00%
6.00%
8.00%
10.00%
12.00%
14.00%
16.00%
Age group
Laps
e ra
te
Lapse rate 7.37% 14.56% 11.83% 9.15% 7.14% 5.63% 4.44% 3.59% 3.05% 3.48% 2.23%
<18 18-22 23-27 28-32 33-37 38-42 43-47 48-52 53-57 58-62 63-67
Industry wise trends Lapse rate(Premium) with respect to Age at entry
0.00%
2.00%
4.00%
6.00%
8.00%
10.00%
12.00%
Age group
Laps
e ra
te
Lapse rate 5.46% 10.98 9.74% 7.99% 6.60% 5.48% 4.63% 3.96% 3.70% 4.75% 3.69%
<18 18-22 23-27 28-32 33-37 38-42 43-47 48-52 53-57 58-62 63-67

Analysis using single factor data Analysis using single factor data Trends in the industry lapse rates with respect to the significaTrends in the industry lapse rates with respect to the significant factorsnt factors
Mode of premium paymentMode of premium paymentIncrease in number lapse rate with Increase in number lapse rate with increase in frequency of payment up to increase in frequency of payment up to quarterly mode & increase in premium quarterly mode & increase in premium lapse rate up to monthly modelapse rate up to monthly modeLower lapse rate in Salary deduction Lower lapse rate in Salary deduction than monthly due to automatic than monthly due to automatic deduction of premium from salarydeduction of premium from salaryIncreased automation with Increased automation with ‘‘Other Other modesmodes’’ like Electronic transfer of like Electronic transfer of premium resulted in the lowest lapse premium resulted in the lowest lapse rate.rate.Reduction in grace period for low Reduction in grace period for low frequent modes, sending reminders and frequent modes, sending reminders and notices becoming expensive for high notices becoming expensive for high frequent modes, effect of frequent modes, effect of policyholderspolicyholders’’ habitual procrastination habitual procrastination of being more on high frequent modes of being more on high frequent modes could be the probable causes for the could be the probable causes for the observed trends.observed trends.
Industry wise trends in lapse rate (number) with respect to Mode of Premium payment
0.00%
5.00%
10.00%
15.00%
20.00%
25.00%
30.00%
35.00%
Mode
Laps
e ra
te
Lapse rate 10.48% 24.84% 30.42% 28.58% 20.86% 0.45%
AnnualHalf
yearlyQuarterly Monthly
Salary deductio
Other
Industry wise trends in Lapse rate(Premium) with respect to Mode of Premium payment
0.00%
5.00%
10.00%
15.00%
20.00%
25.00%
Mode
Laps
e ra
te
Lapse rate 7.93% 16.99% 20.05% 22.29% 16.56% 0.24%
Annual Half yearly
Quarterly Monthly Salary deductio
Other

Analysis using single factor data Analysis using single factor data Trends in the industry lapse rates with respect to the Trends in the industry lapse rates with respect to the
significant factorssignificant factors
Duration elapsed since inception of Duration elapsed since inception of
the policythe policyTrends with number and premium were Trends with number and premium were similarsimilarHigher lapse rate in low premium policies Higher lapse rate in low premium policies would have resulted in lower lapse rate for would have resulted in lower lapse rate for premium than numberpremium than numberSales force not giving thorough explanation Sales force not giving thorough explanation of the policy conditions, forced sales, lack of the policy conditions, forced sales, lack policyholderpolicyholder’’s understanding about the s understanding about the terms and conditions would be the probable terms and conditions would be the probable causes of high initial lapse ratescauses of high initial lapse ratesHump observed around 5Hump observed around 5--6 years might be 6 years might be due to majority of the policies acquiring due to majority of the policies acquiring paidpaid--up/surrender value after three years or up/surrender value after three years or random fluctuation.random fluctuation.Around 53% of the policies commenced Around 53% of the policies commenced tend to be continued after 7tend to be continued after 7--8 years.8 years.
Industry wise trends in lapse rate(Number) with respect to duration elapsed
0.00%
5.00%
10.00%
15.00%
20.00%
Duration in years
Laps
e ra
te
Lapse rate 17.28 10.89 5.44 4.59 3.89 5.75 4.52 3.52 3.29
0-1 1-2 2-3 3-4 4-5 5-6 6-7 7-8 >8
Industry wise trends in Lapse rate(Premium) with respect to Duration elapsed
0.00%
2.00%
4.00%
6.00%
8.00%
10.00%
12.00%
14.00%
Duration in years
Laps
e ra
te
Lapse rate 11.64 8.25 4.23 3.75 3.23 4.46 3.69 2.88 2.98
0-1 1-2 2-3 3-4 4-5 5-6 6-7 7-8 >8

Analysis using single factor data Analysis using single factor data Trends in the industry lapse rates with respect to the Trends in the industry lapse rates with respect to the
significant factorssignificant factors
Type of productType of product
Trends with number and premium Trends with number and premium were similarwere similarTerm assurance products showed Term assurance products showed the highest lapse ratethe highest lapse ratePension policies showed the least Pension policies showed the least lapse ratelapse rateWhole life products showed higher Whole life products showed higher lapse rate than Endowment lapse rate than Endowment productsproductsWith profit products showed With profit products showed higher lapse rate compared to their higher lapse rate compared to their nonnon--profit counter partsprofit counter parts
Industry wise trends in lapse rate (number) with respect to policy type
0.00%
5.00%
10.00%
15.00%
20.00%
25.00%
30.00%
Policy type
Laps
e ra
te
Lapse rate 28.12% 18.75% 8.34% 7.07% 6.15% 3.89% 2.49%
Term LinkedWP-
whole-life
WP-Endowment
NP-whole-
life
NP-Endowment
Pension
Industry wise trends in lapse rate (premium) with respect to policy type
0.00%
2.00%
4.00%
6.00%
8.00%
10.00%
12.00%
14.00%
16.00%
18.00%
20.00%
Policy type
Laps
e ra
te
Lapse rate 18.50% 9.43% 8.35% 6.68% 5.97% 2.94% 1.73%
TermWP-
whole-life
NP-whole-
lifeLinked
WP-Endowment
NP-Endowment
Pension
Analysis using single factor data Analysis using single factor data Trends in the industry lapse rates with respect to the Trends in the industry lapse rates with respect to the
significant factorssignificant factors
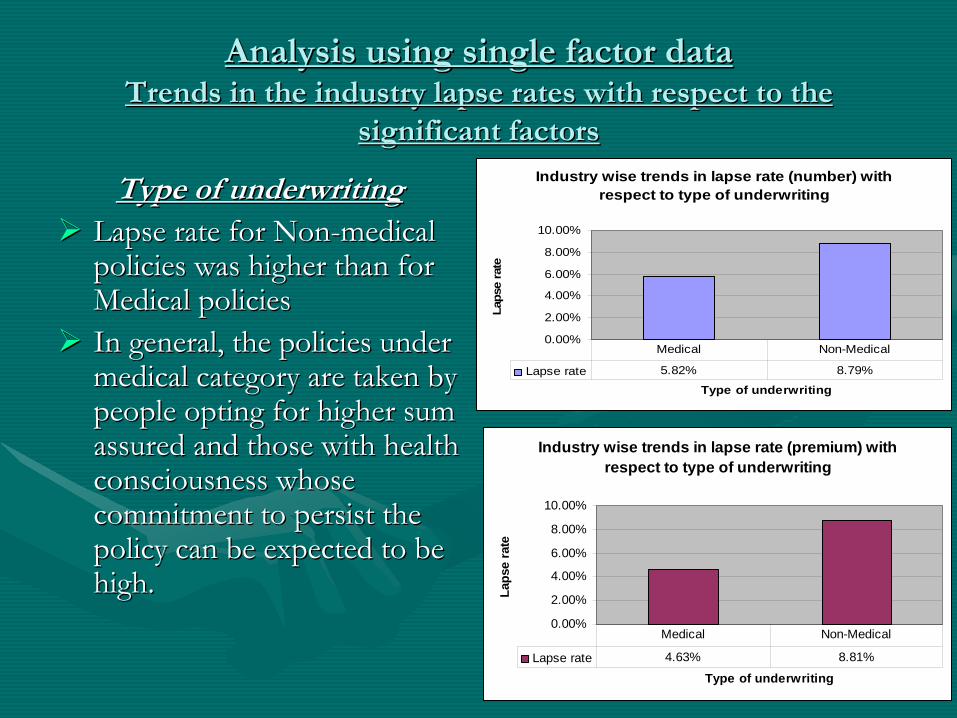
Type of underwritingType of underwritingLapse rate for NonLapse rate for Non--medical medical policies was higher than for policies was higher than for Medical policiesMedical policiesIn general, the policies under In general, the policies under medical category are taken by medical category are taken by people opting for higher sum people opting for higher sum assured and those with health assured and those with health consciousness whose consciousness whose commitment to persist the commitment to persist the policy can be expected to be policy can be expected to be high.high.
Industry wise trends in lapse rate (number) with respect to type of underwriting
0.00%
2.00%
4.00%
6.00%
8.00%
10.00%
Type of underwriting
Laps
e ra
te
Lapse rate 5.82% 8.79%
Medical Non-Medical
Industry wise trends in lapse rate (premium) with respect to type of underwriting
0.00%
2.00%
4.00%
6.00%
8.00%
10.00%
Type of underwriting
Laps
e ra
te
Lapse rate 4.63% 8.81%
Medical Non-Medical

Analysis using single factor data Analysis using single factor data Trends in the industry lapse rates with respect to the Trends in the industry lapse rates with respect to the
significant factorssignificant factors
Premium paying termPremium paying term
Number lapse rate was observed to Number lapse rate was observed to have different trend with that of have different trend with that of premiumpremium--lapse ratelapse rate
Number lapse rate for premium term Number lapse rate for premium term 1111--15 years observed to be lower 15 years observed to be lower compared to those of very low and compared to those of very low and very high premium ranges.very high premium ranges.
Lack of ability to continue premium Lack of ability to continue premium payment for longer terms and lack of payment for longer terms and lack of ability to pay high premiums at very ability to pay high premiums at very low premium terms would have caused low premium terms would have caused higher lapse rate at premium term higher lapse rate at premium term ranges other than 11ranges other than 11--15.However, the 15.However, the number lapse rate remained constant number lapse rate remained constant more or less after 16 years of premium more or less after 16 years of premium term. term.
Industry wise trends in lapse-rate(number) with respect to Premium
term
4.00%
5.00%
6.00%
7.00%
8.00%
9.00%
Premium term
Laps
e ra
te
Lapse rate 8.03% 5.47% 7.81% 7.80% 7.95%
0-10 11-15 16-20 21-25 >25
Industry wise trends in lapse rate(Premium) with respect to
Premium term
4.00%
5.00%
6.00%
7.00%
8.00%
Premium term
Laps
e ra
te
Lapse rate 4.20% 4.92% 6.71% 6.65% 6.88%
0-10 11-15 16-20 21-25 >25

Analysis using single factor data Analysis using single factor data Trends in the industry lapse rates with respect to the Trends in the industry lapse rates with respect to the
significant factorssignificant factors
Type of AgencyType of Agency
••
The The ‘‘Other channelsOther channels’’
constituting constituting mostly the referral arrangements mostly the referral arrangements and direct marketing micro and direct marketing micro insurance agents/rural agents insurance agents/rural agents showed the highest lapse rateshowed the highest lapse rate
••
Although the lapse level of Although the lapse level of BancassuranceBancassurance
is low it is to be is low it is to be remembered that volume of the remembered that volume of the data for the policies is low and only data for the policies is low and only in future years meaningful in future years meaningful conclusions can be drawn.conclusions can be drawn.
Industry wise trends in Lapse rate(number) with respect to Agency type
0.00%
10.00%
20.00%
30.00%
40.00%
50.00%
60.00%
Tepe of Agency
Laps
e ra
te
Lapse rate 18.56% 26.18% 20.16% 12.84% 51.92%
Tied agent
Corporate agent
Broker Bankassurance
Other
Industry wise trends in lapse rate(premium) with respect to Tupe of agency
0.00%
10.00%
20.00%
30.00%
40.00%
Type of agency
Laps
e ra
te
Lapse rate 13.01% 13.89% 14.84% 11.83% 29.65%
Tied agent
Corporate agent Broker
Bankassurance Other

Analysis using single factor data Analysis using single factor data Trends in the industry lapse rates with respect to the nonTrends in the industry lapse rates with respect to the non--
significant factorssignificant factors
Premium rangePremium range
At very low and high levels of premium At very low and high levels of premium the lapse rate observed was higher than at the lapse rate observed was higher than at other levelsother levels
Relatively higher lapse rate at high Relatively higher lapse rate at high premium range may be attributed topremium range may be attributed to
oo
high premiums becoming a burden if high premiums becoming a burden if income levels fluctuate over timeincome levels fluctuate over time
oo
increase in choice of investment for increase in choice of investment for financially sound sections of the financially sound sections of the societysociety
Inability to continue premium payment by Inability to continue premium payment by lower income group of the society could lower income group of the society could have caused higher lapse rate at low have caused higher lapse rate at low premium ranges.premium ranges.
Industry wise trends in Lapse rate( number) with respect to Premium range
0.00%
5.00%
10.00%
15.00%
Premium range in 000'
Laps
era
teLapse rate 7.74% 6.20% 5.02% 3.87% 4.89% 8.02% 8.86% 9.77% 8.58%
0-5 5-10 10-25 25-50 50-100 100-200 200-500 500-1000 >1000

Analysis using single factor data Analysis using single factor data Trends in the industry lapse rates with respect to the nonTrends in the industry lapse rates with respect to the non--
significant factorssignificant factors
SexSexMale lives showed a higher Male lives showed a higher lapse rate than female lives.lapse rate than female lives.Some of the causes Some of the causes attributable to the lower lapse attributable to the lower lapse rate with female lives are rate with female lives are strict rules of financial and strict rules of financial and medical underwriting applied medical underwriting applied to the female lives and to the female lives and majority of the women majority of the women policyholders being from policyholders being from sections of society having sections of society having good educational and good educational and economic background.economic background.
Industry wise trends in Lapse rate(number) with respect to sex
0.00%
2.00%
4.00%
6.00%
8.00%
10.00%
Sex
Laps
e ra
te
Lapse rate 7.66% 6.57%
Male Female
Industry wise trends in Lapse rate(Premium) with respect sex
0.00%
2.00%
4.00%
6.00%
8.00%
Sex
Laps
e ra
te
Lapse rate 6.54% 6.16%
Male Female

Analysis using single factor data Analysis using single factor data Trends in the industry lapse rates with respect to the Trends in the industry lapse rates with respect to the
nonnon--significant factorssignificant factors
••
Rural/Urban Rural/Urban classificationclassification
Urban lapse rate is Urban lapse rate is observed to be higher observed to be higher than rural lapse rate with than rural lapse rate with respect to both number respect to both number and premium lapsed and premium lapsed
Industry wise trends in Lapse rate(number) with respect to
Rural/Urban classification
0.00%
2.00%
4.00%
6.00%
8.00%
10.00%
Rural/Urban
Laps
e ra
te
Lapse rate 6.76% 7.88%
Rural Urban
Industry wise trends in lapse rate(premium) with respect to
Rural/Urban classification
0.00%
2.00%
4.00%
6.00%
8.00%
Rural/Urban
Laps
e ra
te
Lapse rate 6.04% 6.53%
Rural Urban

Trends in industry lapse rate (number of policies) Trends in industry lapse rate (number of policies) with respect to twowith respect to two--factor combinationsfactor combinations
Duration and Type of policyDuration and Type of policy
Industry wise trends in lapse rate with respect to combination of factors duration and policy type
0.00%5.00%
10.00%15.00%20.00%25.00%30.00%35.00%40.00%45.00%
Duration
Laps
e ra
te
WP ENDT 18.14% 11.62% 5.71% 4.72% 3.98% 5.88% 2.86%
NP ENDT 19.03% 23.17% 9.68% 5.26% 3.10% 2.26% 5.82%
TERM 34.72% 37.44% 17.13% 11.98% 9.98% 28.03% 32.33%
WP WHOLE LIFE 11.87% 9.31% 4.80% 4.17% 3.28% 2.13% 8.65%
NP WHOLE LIFE 13.22% 40.67% 33.05% 7.24% 3.22% 4.99% 17.52%
UL 23.87% 18.11% 8.35% 3.67% 2.10% 2.16% 20.96%
1 2 3 4 5 6 7 and above

Trends in industry lapse rate (number of policies) Trends in industry lapse rate (number of policies) with respect to twowith respect to two--factor combinationsfactor combinations
Duration and Type of policyDuration and Type of policy••
Term assurance policies showed the highest rate of lapse in the Term assurance policies showed the highest rate of lapse in the initial years after inception with a sudden increase in the lapsinitial years after inception with a sudden increase in the lapse e rate in the duration of 5rate in the duration of 5--6 years.6 years.
••
Except for withExcept for with--profit endowment plans, all other policy types profit endowment plans, all other policy types showed a sudden increase in lapse rate after 5showed a sudden increase in lapse rate after 5--6 years. 6 years.
••
NonNon--profit plans showed a sharp rise in lapse rate in the second profit plans showed a sharp rise in lapse rate in the second year of the policy.year of the policy.
••
With profit policies showed a lower lapse rate than their nonWith profit policies showed a lower lapse rate than their non-- profit counter parts in the initial years of policy term.profit counter parts in the initial years of policy term.
••
Unit linked policies showed a gradual fall in lapse rate as the Unit linked policies showed a gradual fall in lapse rate as the duration elapsed rises up to 6 years.duration elapsed rises up to 6 years.

Causal factorsCausal factors
Grouping of companies by lapse rate experienceGrouping of companies by lapse rate experience
••
Combining data of the last three years of the observation perioCombining data of the last three years of the observation period, simple arithmetic d, simple arithmetic mean of the industry lapse rate is found to be 18.1% with a stanmean of the industry lapse rate is found to be 18.1% with a standard deviation of dard deviation of 7.5%.7.5%.
••
Assuming lapse rate across various companies follows Normal distAssuming lapse rate across various companies follows Normal distribution with the ribution with the above mean and standard deviation, four companies fall in the peabove mean and standard deviation, four companies fall in the percentile ranging from rcentile ranging from 35 to 65 i.e. within 15% neighborhood of the industry mean (or m35 to 65 i.e. within 15% neighborhood of the industry mean (or mean ean ––
38.5% 38.5% standard deviation to mean + 38.5% of standard deviation). Thesestandard deviation to mean + 38.5% of standard deviation). These
four companies can four companies can be considered to have lapse rates in average range.be considered to have lapse rates in average range.
••
Seven companies fall in the lower percentile ranging from 0 to 3Seven companies fall in the lower percentile ranging from 0 to 35 (i.e. lapse rates less 5 (i.e. lapse rates less than (meanthan (mean--
38.5% of standard deviation)) which may be considered to have l38.5% of standard deviation)) which may be considered to have lighter ighter lapse rates below the average range.lapse rates below the average range.
••
Five companies fall in the upper percentile ranging from 65 to 1Five companies fall in the upper percentile ranging from 65 to 100 (i.e. lapse rate 00 (i.e. lapse rate greater than mean + 38.5% of standard deviation). These five comgreater than mean + 38.5% of standard deviation). These five companies can be panies can be considered to have heavier lapse rates above the average range.considered to have heavier lapse rates above the average range.

No. of companies conducting regular revival campaigns
Among these, number of companies having different levels of lapse
No. of companies not conducting regular revival campaigns
Among these, No. of companies having different levels of lapse
8 High Average Low 5 High Average Low
1 3 4 4 0 1
Revival campaigns seem to have significant effect in reduction of the levels of lapse rate.
No. of companies giving incentives to
intermediaries for reduction of lapses
Among these, no. of companies having different levels of lapse
No. of companies not giving any incentives to intermediaries for reduction of lapses
Among these, no. of companies having different levels of lapse
4 High Average Low 9 High Average
0 1 3 5 2
It seems the special incentives given to intermediaries have significant effect in reducing the levels of lapse.
No. of companies paying maximum levels
of commission
Among these, no. of companies having different levels of lapse
No. of companies not paying maximum levels
of commission
Among these, no. of companies having different levels of lapse
3 High Average Low 10 High Average Low1 0 2 3 3 4
It is difficult to conclude from the available data whether the levels of commission have any influence on the lapse rates.
No. of companies sending notices to
intermediaries
Among these, no. of companies having different levels of lapse
No. of companies not sending notices to
intermediaries
Among these, no. of companies having different levels of lapse
4 High Average Low 9 High Average
0 2 2 5 1
Sending copies of notices to intermediaries helps bring down lapses seems to have considerable effect in reducing the levels of lapse.

ConclusionsConclusions……..
Trends observed in lapse rate for the industry over Trends observed in lapse rate for the industry over the last the last fivefive yearsyears
••
Over the five financial years from 2002Over the five financial years from 2002--03 to 200603 to 2006--07, 07, industry lapse rate by number of policies varied from industry lapse rate by number of policies varied from 5.62% to 7.8% and decreased slowly from 20045.62% to 7.8% and decreased slowly from 2004--05. 05. Lapse rate by premium varied from 4.40% to 6.95% Lapse rate by premium varied from 4.40% to 6.95% slowly increasing year by year excepting a small slowly increasing year by year excepting a small decrease in 2006decrease in 2006--07.07.
••
On exclusion of the companies having low lapse rates), On exclusion of the companies having low lapse rates), the rates substantially increased to the range of 18% the rates substantially increased to the range of 18% --
25% (number of policies) and to the range of 11.2% 25% (number of policies) and to the range of 11.2% -- 16.6% (premium lapsed).16.6% (premium lapsed).

ConclusionsConclusions……Factor wise analysis led to the following results:Factor wise analysis led to the following results:
••
The factors 1) Age group at entry 2) Mode of premium payment The factors 1) Age group at entry 2) Mode of premium payment 3) Duration elapsed since policy inception 4) Policy type and 5)3) Duration elapsed since policy inception 4) Policy type and 5)
Type of underwriting are found to be the most significant factorType of underwriting are found to be the most significant factors s affecting the lapse rates.affecting the lapse rates.
••
Lapse rate with respect to Age at entry showed a decreasing Lapse rate with respect to Age at entry showed a decreasing trend from age 18 to 60 years. The lapse rates are lower for agtrend from age 18 to 60 years. The lapse rates are lower for ages es below 18 compared to other ages. below 18 compared to other ages.
••
Lapse rate (by number of policies) tended to increase as the Lapse rate (by number of policies) tended to increase as the frequency of premium payment increased up to quarterly mode frequency of premium payment increased up to quarterly mode and decreased for monthly and salary deduction modes. and decreased for monthly and salary deduction modes.
••
Lapse rates are observed to be decreasing with duration elapsed Lapse rates are observed to be decreasing with duration elapsed since inception.since inception.

ConclusionsConclusions……
••
Term assurance policies show the highest rate of lapse Term assurance policies show the highest rate of lapse with respect to both number and premium lapsed.with respect to both number and premium lapsed.
••
Whole life products show higher lapse rate than Whole life products show higher lapse rate than endowment products.endowment products.
••
Pension policies are observed to show the least lapse Pension policies are observed to show the least lapse rates among the all. rates among the all.
••
Unit linked contracts have lapse rates higher than for Unit linked contracts have lapse rates higher than for traditional planstraditional plans
(other than term(other than term--assurance).assurance).
••
Lapse rates for NonLapse rates for Non--Medical policies are observed to Medical policies are observed to be higher than for Medical policies.be higher than for Medical policies.

ConclusionsConclusions……
Analysis of causes affecting lapse rates Analysis of causes affecting lapse rates indicates the followingindicates the following::
••
Revival campaignsRevival campaigns••
special incentives given to intermediariesspecial incentives given to intermediariesand and
••
sending copies of notices to intermediaries sending copies of notices to intermediaries seem to have significant effect in reduction of seem to have significant effect in reduction of the levels of lapse rate.the levels of lapse rate.

LimitationsLimitations••
Inclusion of single premium policies by some Inclusion of single premium policies by some companies companies ––
Eliminated after due verificationEliminated after due verification..
•• Inclusion of surrenders by some companies Inclusion of surrenders by some companies ––
Not Not
found significant hence ignored.found significant hence ignored.••
Inaccurate data under some of the reference factors Inaccurate data under some of the reference factors ––
Such data constituted < 0.01% of the total data hence ignored.Such data constituted < 0.01% of the total data hence ignored.••
Varied definition of lapse across the companies and Varied definition of lapse across the companies and also across the products within a company also across the products within a company ––
Definition of lapse under majority of companies found similar Definition of lapse under majority of companies found similar hence proceeded with the data as available.hence proceeded with the data as available.
•• NonNon--availability of data for years 2002availability of data for years 2002--04 for some 04 for some companiescompanies--
analyses with respect to each factor/combination analyses with respect to each factor/combination
of factors were based on data for years 2004of factors were based on data for years 2004--05 to 200605 to 2006--07.07.

Impact of lapse rates on Reserve & Impact of lapse rates on Reserve & solvency margin for Endowment solvency margin for Endowment
ProductProductDuration
since inception (years)
Over all %
increase in lapse
rate
Over all % change
in statutory reserve
Over all % change in solvency margin
0-3 65.24% 120.84% 54.84%
4-7 81.67% 25.57% 18.23%
7-12 100.00% -8.37% -6.73%
13-15 62.50% -31.01% -25.75%
Duration since
inception (years)
Over all %
decrease in lapse
rate
Over all % change in statutory reserve
Over all % change in solvency margin
0-3 25.56% -47.05% -21.19%
4-7 20.42% -8.29% -5.89%
7-12 30.56% 4.47% 3.58%
13-15 50.00% 16.79% 13.94%

Duration since
inception (years)
Over all % decrease in lapse rate
Over all % change in solvency margin
Over all %
increase in lapse
rate
Over all % change
in solvency margin
0-8 24.08% 0.00% 83.97% 0.00%
9-15 46.67% 2.29% 63.33% -2.20%
16-20 50.00% 2.40% 50.00% -1.76%
Term Assurance ProductTerm Assurance Product-- Impact of lapse rates on solvency Impact of lapse rates on solvency
marginmargin

Duration since
inception (years)
Over all %
increase in lapse
rate
Over all % change in statutory reserve
Over all %
decrease in lapse
rate
Over all %
change in
statutory reserve
0-5 75.14% -11.50% 24.34% 7.86%
6-10 89.30% -31.31% 25.67% 24.37%
11-15 60.00% -46.56% 50.00% 28.72%
Unit Linked ProductUnit Linked Product-- Impact of lapse rates on Statutory Impact of lapse rates on Statutory
ReserveReserve

Effect of early lapse rates on spread Effect of early lapse rates on spread of expensesof expenses
Duration since
inception (years)
Over all % increase in lapse rate
Over all % change in per policy overhead expenses
Over all % decrease in lapse
rate
Over all % change in per policy overhead expenses
0-6 74% 15.09% 23% -8.58%
7-16 58% 40.85% 50% -22.26%
17-35 50% 51.55% 50% -48.70%

Effect of Effect of lapsationlapsation
on profits fon profits for an or an Endowment type of product:Endowment type of product:
Duration since
inception (years)
Over all %
increase in lapse
rate
Over all % change in
profit
Over all %
decrease in lapse
rate
Over all % change in
profit
0-1 41.18% -329.18% (Rise in
loss)
29.41% +131.51%
1-6 80.24% +74.74% 21.79% +29.31%
7-10 95.00% +86.70% 27.92% +25.75%
10-15 62.50% +59.68% 50.00% +30.60%
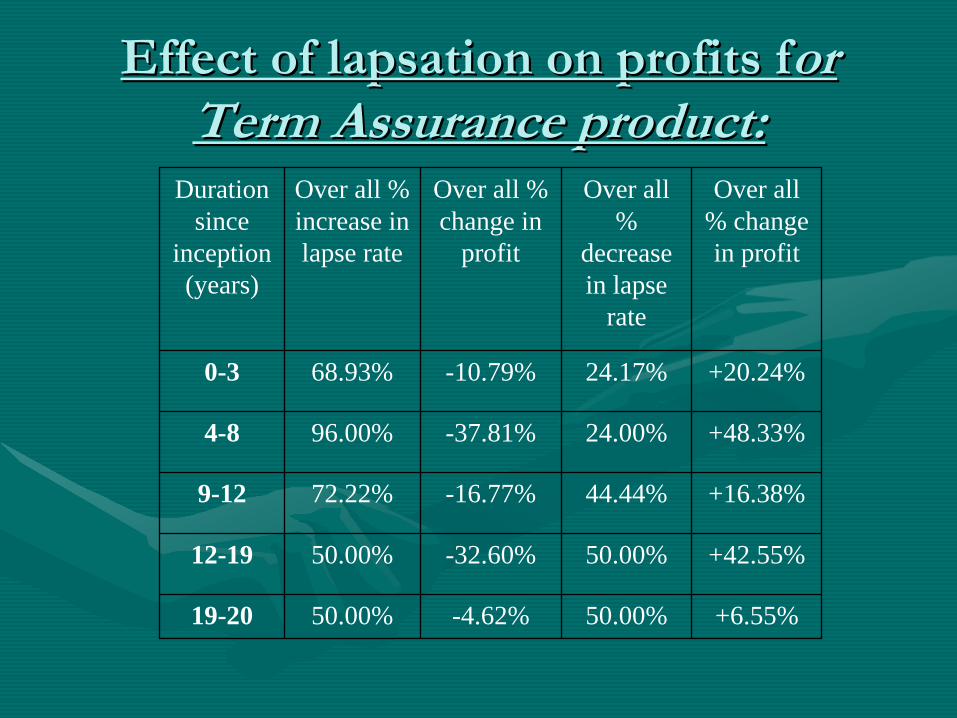
Effect of Effect of lapsationlapsation
on profits fon profits for or Term Assurance product:Term Assurance product:
Duration since
inception (years)
Over all % increase in lapse rate
Over all % change in
profit
Over all %
decrease in lapse
rate
Over all % change in profit
0-3 68.93% -10.79% 24.17% +20.24%
4-8 96.00% -37.81% 24.00% +48.33%
9-12 72.22% -16.77% 44.44% +16.38%
12-19 50.00% -32.60% 50.00% +42.55%
19-20 50.00% -4.62% 50.00% +6.55%

Effect of Effect of lapsationlapsation
on profits fon profits for or Unit linked product:Unit linked product:
Duration since
inception (years)
Over all % increase in lapse
rate
Over all % change in
profit
Over all %
decrease in lapse
rate
Over all % change in profit
0-3 65.24% +10.67% 25.56% -7.27%
4-10 89.52% -21.48% 24.76% +16.52%
10-15 60.00% -42.46 50.00% +28.72%

Concluding remarks…This study can be treated as a beginning for the study of lapses in
the Indian insurance industry. It will be more useful to continue the study in future obtaining data
from all the companies with respect to all combinations of the factors found significant in this study and all interactions of such significance
The data will have to be collected with a predetermined uniformdefinition of lapse (for the purpose of study) from the companies irrespective of the manner in which the data base is maintained with the company.