laredo petroleum announces 2017 fourth-quarter and … level of $800 million, ... remain committed...
TRANSCRIPT

15 West 6th Street, Suite 900 · Tulsa, Oklahoma 74119 · (918) 513-4570 · Fax: (918) 513-4571
www.laredopetro.com
Laredo Petroleum Announces 2017 Fourth-Quarter and
Full-Year Financial and Operating Results
TULSA, OK - February 14, 2018 - Laredo Petroleum, Inc. (NYSE: LPI) ("Laredo" or the "Company") today
announced its 2017 fourth-quarter and full-year results. For the fourth quarter of 2017, the Company reported net
income attributable to common stockholders of $408.6 million, or $1.70 per diluted share, which includes a $405.9
million gain on the sale of Laredo's investment in the Medallion-Midland Basin pipeline system. Adjusted Net
Income, a non-GAAP financial measure, for the fourth quarter of 2017 was $44.8 million, or $0.19 per adjusted
diluted share. Adjusted EBITDA, a non-GAAP financial measure, for the fourth quarter of 2017, was $133.8
million.
For the year ended December 31, 2017, the Company reported net income attributable to common stockholders of
$549.0 million, or $2.29 per diluted share. Adjusted Net Income for the year ended December 31, 2017 was $144.7
million, or $0.60 per adjusted diluted share, and Adjusted EBITDA was $486.4 million. Please see supplemental
financial information at the end of this news release for reconciliation of the non-GAAP financial measures.
2017 Highlights
• Produced a Company record 58,273 barrels of oil equivalent ("BOE") per day in full-year 2017, resulting in
production growth of approximately 17% from full-year 2016
• Grew proved developed reserves organically by approximately 36% in 2017 at a proved developed finding
and development ("F&D") cost, a non-GAAP financial measure, of $7.90 per BOE
• Completed 62 horizontal development wells in 2017 at an average anticipated well-level rate of return on
invested capital of greater than 30%
• Increased cash margin per BOE to $20.87 in full-year 2017, an increase of 48% from full-year 2016,
doubling the 24% increase in the Company's average realized price per BOE over the same time frame
• Reduced unit lease operating expenses ("LOE") to $3.53 per BOE in full-year 2017, a reduction of
approximately 15% from full-year 2016
• Recognized approximately $27.9 million of net cash benefits from Laredo Midstream Services, LLC
("LMS") field infrastructure investments through reduced capital and operating costs and increased revenue
• Realized approximately $830 million in net proceeds from the sale of the Company's interest in the
Medallion-Midland Basin pipeline system, enabling the Company to reduce debt by $690 million to a total
debt level of $800 million, and net debt to 1.3 times annualized fourth-quarter 2017 Adjusted EBITDA

2
"During 2017, Laredo's development plan yielded well-level returns on invested capital exceeding 30% while
making meaningful progress towards co-developing multiple landing points in our Upper and Middle Wolfcamp
formations," stated Randy A. Foutch, Chairman and Chief Executive Officer. "We did experience increased cycle
times and decreased capital efficiency in the second half of the year as we optimized completions and tested
spacing with the goal of adding additional premium locations. We are confident in our operational abilities and
remain committed to progressing towards a high-density development plan that we believe will result in improved
long-term value creation."
"We will be announcing separately that our board of directors has authorized a $200 million share repurchase
program. We believe having the optionality of repurchasing approximately 10% of our outstanding shares at
current market prices represents a highly accretive use of capital. Given our view of the value of the Company's
reserves, financial position after our Medallion divestment and the expected efficiencies as we identify additional
premium locations in our Upper and Middle Wolfcamp formations, we believe repurchasing our shares
accelerates value recognition for our current stockholders."
E&P Update
In the fourth quarter of 2017, Laredo completed 18 horizontal wells averaging approximately 9,500 completed
lateral feet. Fourth-quarter 2017 production was a Company record 61,922 BOE per day, an increase of
approximately 17% from fourth-quarter 2016.
During the fourth quarter of 2017, the Company completed the six-well Kloesel package, drilled in the western
Glasscock portion of our leasehold. The package tested five discrete landing points in a dense-spacing
configuration. Initial data is affirming pre-drill modeling and the early oil cut is positive. The package was delayed
due to drilling challenges associated with one well testing a higher-pressure landing point and a second well
experiencing a problem with its casing. Root causes of both issues have been identified and are not expected to
impede further activities in the area.
The performance of the Company's 114 horizontal wells to date that utilized optimized completions combined with
proprietary analytics continues to exceed type curve expectations, outperforming the Upper/Middle Wolfcamp
three-stream type curve by approximately 34% and the oil type curve by approximately 21%. Production data
supports Laredo's modeled expectations that wells will perform, on average, at the Company's 1.3 million BOE
type curve as completions and spacing are modified to facilitate higher density development and increase net asset
value per section.
Utilizing the Company's comprehensive dataset, high-resolution geomodels and predictive analytics, Laredo
continues to evaluate the spacing density of horizontal wells as they are co-developed in multiple landing points
in the Upper and Middle Wolfcamp formations. Results of spacing tests conducted in 2017 suggest development
of up to 32 Upper and Middle Wolfcamp locations per section is possible. Laredo plans to further evaluate this
higher-density development design in 2018 and expects approximately 60% of wells brought on production in the
second half of 2018 to be developed at this tighter spacing.
3
Lease operating expenses decreased to $3.22 per BOE in the fourth quarter of 2017, down approximately 9% from
third-quarter 2017. The Company continues to receive significant benefits from prior investments in field
infrastructure, which reduced unit LOE by an estimated $0.54 per BOE.
Laredo is currently operating three horizontal rigs and expects to complete 16 net horizontal wells with an average
completed lateral length of approximately 9,100 feet in the first quarter of 2018. Cold weather early in the first
quarter of 2018 disrupted operations, negatively impacting estimated quarterly volumes by 52,000 BOE.
The Company expects well costs in the first quarter of 2018 to begin to trend lower as longer stage lengths, in-
basin sand and other completion design changes are implemented. Additionally, Laredo has completed the process
of selecting a second full-time completions crew. Pricing quotes from interested parties confirmed the Company's
assumptions that current service cost increases are minimal and we believe our average well cost savings goal of
$600,000 per well in 2018 can be achieved.
Laredo Midstream Services Update
LMS-owned field infrastructure provided net combined benefits from increased revenue and cost savings of
approximately $7.5 million in the fourth quarter of 2017. In addition to financial benefits, LMS assets provide
significant operational flexibility, including the ability to offload Laredo's natural gas production to alternative
natural gas processing facilities. During the fourth quarter of 2017, LMS-owned natural gas gathering assets
enabled the delivery of more than 10 million cubic feet of natural gas per day that would have been flared had the
natural gas not had access to alternative processing facilities via LMS-owned gathering assets.
LMS' ownership of assets that gather approximately 50% of the Company's gross operated natural gas production
increases Laredo's confidence that temporary residue natural gas delivery issues to the WAHA hub by gas
processors will not result in substantial flaring or production curtailments. Although Laredo has not contracted
directly for firm transportation capacity of its natural gas, the Company believes that a combination of its
processors' firm capacity and the ability to offload LMS-gathered natural gas to alternative processors through
the LMS-owned gathering system provides the flexibility needed to avoid substantial production curtailments.
2017 Capital Program
During the fourth quarter of 2017, Laredo invested approximately $160 million in exploration and development
activities. Other expenditures incurred during the quarter included approximately $4 million in bolt-on land
acquisitions and lease extensions, approximately $10 million in infrastructure held by LMS and approximately $8
million in capitalized employee-related costs.
Liquidity
At December 31, 2017, the Company had cash and cash equivalents of approximately $112 million and undrawn
capacity under the senior secured credit facility of $1 billion. At February 13, 2018, the Company had cash and
cash equivalents of approximately $46 million and undrawn capacity under the senior secured credit facility of $1
billion, resulting in total liquidity of approximately $1.05 billion.

4
Commodity Derivatives
Laredo maintains a disciplined hedging program to reduce the variability in its anticipated cash flow due to
fluctuations in commodity prices. The Company utilizes a combination of puts, swaps and collars, entering into
contracts solely with banks that are part of its senior secured credit facility. Laredo currently has hedges in place
for approximately 90% of anticipated oil production in 2018 and has increased oil hedges through 2020. Laredo
has also entered into NGL and natural gas hedges through 2018 and basis hedges through 2019. Details of the
Company's hedge positions are included in the current Corporate Presentation available on the Company's website
at www.laredopetro.com.
Guidance
The Company is reiterating its anticipated full-year 2018 production growth guidance of at least 10% as compared
to 2017. The table below reflects the Company's guidance for the first quarter of 2018.
1Q-2018E
Total production (MBOE/d) .............................................................................................................. 62.0
Oil production (MBO/d).................................................................................................................... 27.0
Price Realizations (pre-hedge):
Crude oil (% of WTI) .................................................................................................................. 97%
Natural gas liquids (% of WTI) ................................................................................................... 28%
Natural gas (% of Henry Hub) .................................................................................................... 57%
Operating Costs & Expenses:
Lease operating expenses ($/BOE) ............................................................................................. $3.55
Midstream expenses ($/BOE) ..................................................................................................... $0.20
Production and ad valorem taxes (% of oil, NGL and natural gas revenue) ................................ 6.25%
General and administrative expenses:
Cash ($/BOE) ......................................................................................................................... $2.90
Non-cash stock-based compensation ($/BOE) ....................................................................... $1.65
Depletion, depreciation and amortization ($/BOE) ..................................................................... $7.75
Fourth-Quarter and Full-Year 2017 Earnings Conference Call
Laredo will host a conference call on Thursday, February 15, 2018 at 7:30 a.m. CT (8:30 a.m. ET) to discuss its
fourth-quarter and full-year 2017 financial and operating results and management's outlook. Individuals who
would like to participate on the call should dial 877.930.8286 (international dial-in 253.336.8309), using
conference code 2795428 or listen to the call via the Company's website at www.laredopetro.com, under the tab for
"Investor Relations." A telephonic replay will be available approximately two hours after the call on February 15,
2018 through Thursday, February 22, 2018. Participants may access this replay by dialing 855.859.2056, using
conference code 2795428.

5
About Laredo
Laredo Petroleum, Inc. is an independent energy company with headquarters in Tulsa, Oklahoma. Laredo's
business strategy is focused on the acquisition, exploration and development of oil and natural gas properties, and
the transportation of oil and natural gas from such properties, primarily in the Permian Basin in West Texas.
Additional information about Laredo may be found on its website at www.laredopetro.com.
Forward-Looking Statements
This press release and any oral statements made regarding the subject of this release, including in the conference
call referenced herein, contain forward-looking statements as defined under Section 27A of the Securities Act of
1933, as amended, and Section 21E of the Securities Exchange Act of 1934, as amended. All statements, other than
statements of historical facts, that address activities that Laredo assumes, plans, expects, believes, intends,
projects, estimates or anticipates (and other similar expressions) will, should or may occur in the future, including,
but not limited to, the share repurchase program, which may be suspended or discontinued by the Company at any
time, are forward-looking statements. The forward-looking statements are based on management's current belief,
based on currently available information, as to the outcome and timing of future events.
General risks relating to Laredo include, but are not limited to, the decline in prices of oil, natural gas liquids and
natural gas and the related impact to financial statements as a result of asset impairments and revisions to reserve
estimates, the increase in service costs, hedging activities, possible impacts of pending or potential litigation and
other factors, including those and other risks described in its Annual Report on Form 10-K for the year ended
December 31, 2016, and those set forth from time to time in other filings with the Securities and Exchange
Commission ("SEC") including, but not limited to, its Annual Report on Form 10-K for the year ended December
31, 2017, to be filed with the SEC. These documents are available through Laredo's website at
www.laredopetro.com under the tab "Investor Relations" or through the SEC's Electronic Data Gathering and
Analysis Retrieval System at www.sec.gov. Any of these factors could cause Laredo's actual results and plans to
differ materially from those in the forward-looking statements. Therefore, Laredo can give no assurance that its
future results will be as estimated. Laredo does not intend to, and disclaims any obligation to, update or revise any
forward-looking statement.
The SEC generally permits oil and natural gas companies, in filings made with the SEC, to disclose proved
reserves, which are reserve estimates that geological and engineering data demonstrate with reasonable certainty
to be recoverable in future years from known reservoirs under existing economic and operating conditions and
certain probable and possible reserves that meet the SEC's definitions for such terms. In this press release and the
conference call, the Company may use the terms "resource potential" and "estimated ultimate recovery," "type
curve," or "EURs," each of which the SEC guidelines restrict from being included in filings with the SEC without
strict compliance with SEC definitions. These terms refer to the Company's internal estimates of unbooked
hydrocarbon quantities that may be potentially added to proved reserves, largely from a specified resource play. A
resource play is a term used by the Company to describe an accumulation of hydrocarbons known to exist over a
large areal expanse and/or thick vertical section potentially supporting numerous drilling locations, which, when
compared to a conventional play, typically has a lower geological and/or commercial development risk. EURs are
based on the Company's previous operating experience in a given area and publicly available information relating
to the operations of producers who are conducting operations in these areas. Unbooked resource potential or
EURs do not constitute reserves within the meaning of the Society of Petroleum Engineer's Petroleum Resource
Management System or SEC rules and do not include any proved reserves. Actual quantities of reserves that may
be ultimately recovered from the Company's interests may differ substantially from those presented herein. Factors
affecting ultimate recovery include the scope of the Company's ongoing drilling program, which will be directly
affected by the availability of capital, decreases in oil, NGL and natural gas prices, drilling costs and production
costs, availability of drilling services and equipment, drilling results, lease expirations, transportation constraints,

6
regulatory approvals, negative revisions to reserve estimates and other factors as well as actual drilling results,
including geological and mechanical factors affecting recovery rates. Estimates of unproved resources may change
significantly as development of the Company's core assets provides additional data. In addition, our production
forecasts and expectations for future periods are dependent upon many assumptions, including estimates of
production decline rates from existing wells and the undertaking and outcome of future drilling activity, which may
be affected by significant commodity price declines or drilling cost increases. "Type curve" refers to a production
profile of a well, or a particular category of wells, for a specific play and/or area. In addition, the Company's
production forecasts and expectations for future periods are dependent upon many assumptions, including
estimates of production decline rates from existing wells and the undertaking and outcome of future drilling
activity, which may be affected by significant commodity price declines or drilling cost increases.

7
Laredo Petroleum, Inc.
Condensed consolidated statements of operations
Three months ended December 31, Year ended December 31,
(in thousands, except per share data) 2017 2016 2017 2016
(unaudited) (unaudited)
Revenues: Oil, NGL and natural gas sales .......................................................... $ 183,376 $ 136,012 $ 621,507 $ 426,485
Midstream service revenues ............................................................. 2,369 2,421 10,517 8,342 Sales of purchased oil .................................................................................................
54,592 45,881 190,138 162,551
Total revenues ............................................................................... 240,337 184,314 822,162 597,378
Costs and expenses: Lease operating expenses ................................................................. 18,359 17,407 75,049 75,327
Production and ad valorem taxes ....................................................... 10,991 7,103 37,802 28,586
Midstream service expenses ............................................................. 1,113 1,251 4,099 4,077
Costs of purchased oil ..................................................................... 54,247 48,346 195,908 169,536
General and administrative ............................................................... 23,707 25,698 96,312 91,756
Depletion, depreciation and amortization ............................................. 45,062 37,526 158,389 148,339
Impairment expense ....................................................................... — — — 162,027
Other operating expenses ................................................................. 1,025 1,523 4,931 5,692
Total costs and expenses .................................................................. 154,504 138,854 572,490 685,340
Operating income (loss) ................................................................... 85,833 45,460 249,672 (87,962 )
Non-operating income (expense): Gain (loss) on derivatives, net ........................................................... (37,777 ) (43,642 ) 350 (87,425 )
Income from equity method investee** ............................................... 575 3,144 8,485 9,403
Interest expense ............................................................................. (19,787 ) (23,004 ) (89,377 ) (93,298 )
Loss on early redemption of debt ....................................................... (23,761 ) — (23,761 ) —
Gain on sale of investment in equity method investee** .......................... 405,906 — 405,906 —
Other, net..................................................................................... (628 ) (379 ) (501 ) (1,457 )
Non-operating income (expense), net .................................................. 324,528 (63,881 ) 301,102 (172,777 )
Income (loss) before income taxes ..................................................... 410,361 (18,421 ) 550,774 (260,739 )
Income tax expense: Current ....................................................................................... (1,800 ) — (1,800 ) —
Total income tax expense ................................................................. (1,800 ) — (1,800 ) —
Net income (loss) ........................................................................... $ 408,561 $ (18,421 ) $ 548,974 $ (260,739 )
Net income (loss) per common share: Basic .......................................................................................... $ 1.71 $ (0.08 ) $ 2.30 $ (1.16 )
Diluted ........................................................................................ $ 1.70 $ (0.08 ) $ 2.29 $ (1.16 )
Weighted-average common shares outstanding: Basic .......................................................................................... 239,332 238,047 239,096 225,512
Diluted ........................................................................................ 240,289 238,047 240,122 225,512
8
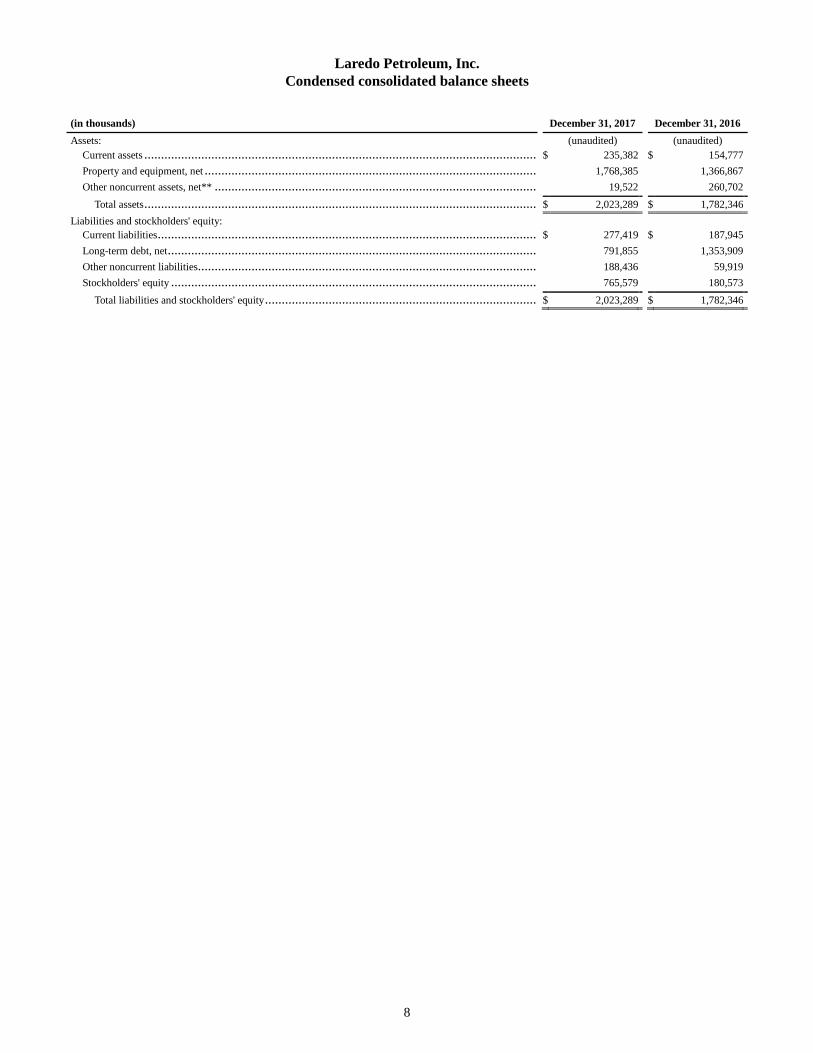
Laredo Petroleum, Inc.
Condensed consolidated balance sheets
(in thousands) December 31, 2017 December 31, 2016
Assets: (unaudited) (unaudited)
Current assets ...................................................................................................................... $ 235,382 $ 154,777
Property and equipment, net .................................................................................................... 1,768,385 1,366,867
Other noncurrent assets, net** ................................................................................................. 19,522 260,702
Total assets ...................................................................................................................... $ 2,023,289 $ 1,782,346
Liabilities and stockholders' equity: Current liabilities .................................................................................................................. $ 277,419 $ 187,945
Long-term debt, net ............................................................................................................... 791,855 1,353,909
Other noncurrent liabilities...................................................................................................... 188,436 59,919
Stockholders' equity .............................................................................................................. 765,579 180,573
Total liabilities and stockholders' equity .................................................................................. $ 2,023,289 $ 1,782,346

9
Laredo Petroleum, Inc.
Condensed consolidated statements of cash flows
Three months ended December 31, Year ended December 31,
(in thousands) 2017 2016 2017 2016
(unaudited) (unaudited)
Cash flows from operating activities: Net income (loss).............................................................................. $ 408,561 $ (18,421 ) $ 548,974 $ (260,739 )
Adjustments to reconcile net income (loss) to net cash provided by operating activities:
Depletion, depreciation and amortization ................................................. 45,062 37,526 158,389 148,339
Impairment expense ........................................................................... — — — 162,027
Gain on sale of investment in equity method investee** .............................. (405,906 ) — (405,906 ) —
Loss on early redemption of debt ........................................................... 23,761 — 23,761 —
Non-cash stock-based compensation, net of amounts capitalized ................... 8,857 9,667 35,734 29,229
Mark-to-market on derivatives: (Gain) loss on derivatives, net .............................................................. 37,777 43,642 (350 ) 87,425
Cash settlements received for matured derivatives, net ............................... 2,792 37,655 37,583 195,281
Cash settlements received for early terminations of derivatives, net ............... — — 4,234 80,000
Cash premiums paid for derivatives ....................................................... (12,311 ) (2,697 ) (25,853 ) (89,669 )
Other, net** ..................................................................................... 3,196 (425 ) 2,062 (5,848 )
Cash flows from operations before changes in assets and liabilities ................ 111,789 106,947 378,628 346,045
(Increase) decrease in current assets and liabilities, net ................................ (2,934 ) 4,016 2,568 10,669
Decrease (increase) in other noncurrent assets and liabilities, net ................... 4,008 (122 ) 3,718 (419 )
Net cash provided by operating activities ................................................ 112,863 110,841 384,914 356,295
Cash flows from investing activities: Deposit received for potential sale of oil and natural gas properties ............... — 3,000 — 3,000
Deposit utilized for sale of oil and natural gas properties ............................. (3,000 ) — (3,000 ) —
Capital expenditures: Acquisitions of oil and natural gas properties ............................................ — (9,060 ) — (124,660 )
Oil and natural gas properties ............................................................... (156,957 ) (83,944 ) (538,122 ) (360,679 )
Midstream service assets ..................................................................... (9,207 ) (1,009 ) (20,887 ) (5,240 )
Other fixed assets .............................................................................. (1,301 ) (6,629 ) (4,905 ) (7,611 )
Investment in equity method investee** ................................................. (7,236 ) (10,897 ) (31,808 ) (69,609 )
Proceeds from disposition of equity method investee, net of selling costs** ..... 829,615 — 829,615 —
Proceeds from dispositions of capital assets, net of selling costs.................... 29 32 64,157 397
Net cash provided by (used in) investing activities ..................................... 651,943 (108,507 ) 295,050 (564,402 )
Cash flows from financing activities: Borrowings on Senior Secured Credit Facility .......................................... 35,000 25,000 190,000 239,682
Payments on Senior Secured Credit Facility ............................................ (190,000 ) (25,000 ) (260,000 ) (304,682 )
Early redemption of debt .................................................................... (518,480 ) — (518,480 ) —
Proceeds from issuance of common stock, net of offering costs .................... — — — 276,052
Other, net........................................................................................ 15 (22 ) (11,997 ) (1,427 )
Net cash (used in) provided by financing activities .................................... (673,465 ) (22 ) (600,477 ) 209,625
Net increase in cash and cash equivalents ................................................ 91,341 2,312 79,487 1,518
Cash and cash equivalents, beginning of period ........................................ 20,818 30,360 32,672 31,154
Cash and cash equivalents, end of period ................................................. $ 112,159 $ 32,672 $ 112,159 $ 32,672

10
Laredo Petroleum, Inc.
Selected operating data
Three months ended December 31, Year ended December 31,
2017 2016 2017 2016
(unaudited) (unaudited)
Sales volumes: Oil (MBbl) ................................................................................... 2,448 2,274 9,475 8,442
NGL (MBbl) ................................................................................ 1,613 1,293 5,800 4,784
Natural gas (MMcf)........................................................................ 9,818 7,935 35,972 29,535
Oil equivalents (MBOE)(1)(2) ............................................................. 5,697 4,889 21,270 18,149
Average daily sales volumes (BOE/D)(2) .............................................. 61,922 53,141 58,273 49,586
% Oil .......................................................................................... 43 % 46 % 45 % 47 %
Average sales prices(2): Oil, realized ($/Bbl)(3) ..................................................................... $ 53.57 $ 43.98 $ 46.97 $ 37.73
NGL, realized ($/Bbl)(3) ................................................................... $ 20.53 $ 14.79 $ 17.49 $ 11.91
Natural gas, realized ($/Mcf)(3) .......................................................... $ 1.95 $ 2.13 $ 2.09 $ 1.73
Average price, realized ($/BOE)(3) ...................................................... $ 32.19 $ 27.82 $ 29.22 $ 23.50
Oil, hedged ($/Bbl)(4) ...................................................................... $ 54.38 $ 58.92 $ 50.45 $ 58.07
NGL, hedged ($/Bbl)(4).................................................................... $ 19.53 $ 14.79 $ 16.91 $ 11.91
Natural gas, hedged ($/Mcf)(4) ........................................................... $ 2.08 $ 2.26 $ 2.15 $ 2.20
Average price, hedged ($/BOE)(4) ....................................................... $ 32.48 $ 34.97 $ 30.71 $ 33.73
Average costs per BOE sold(2): Lease operating expenses ................................................................. $ 3.22 $ 3.56 $ 3.53 $ 4.15
Production and ad valorem taxes ....................................................... 1.93 1.45 1.78 1.58
Midstream service expenses ............................................................. 0.20 0.26 0.19 0.22
General and administrative: Cash ........................................................................................... 2.61 3.28 2.85 3.45
Non-cash stock-based compensation, net of amounts capitalized ................ 1.55 1.98 1.68 1.61
Depletion, depreciation and amortization ............................................. 7.91 7.68 7.45 8.17
Total costs and expenses .................................................................. $ 17.42 $ 18.21 $ 17.48 $ 19.18
Cash margins per BOE(2): Realized ...................................................................................... $ 24.23 $ 19.27 $ 20.87 $ 14.10
Hedged ....................................................................................... $ 24.52 $ 26.42 $ 22.36 $ 24.33
_______________________________________________________________________________
(1) BOE is calculated using a conversion rate of six Mcf per one Bbl.
(2) The numbers presented are based on actual results and are not calculated using the rounded numbers presented in
the table above.
(3) Realized oil, NGL and natural gas prices are the actual prices realized at the wellhead adjusted for quality,
transportation fees, geographical differentials, marketing bonuses or deductions and other factors affecting the
price received at the wellhead.
(4) Hedged prices reflect the after-effects of our hedging transactions on our average sales prices. Our calculation of
such after-effects includes current period settlements of matured derivatives in accordance with GAAP and an
adjustment to reflect premiums incurred previously or upon settlement that are attributable to instruments that
settled in the period.

11
Laredo Petroleum, Inc.
Costs incurred
The following table presents the costs incurred in the acquisition, exploration and development of oil, NGL and natural gas
assets:
Three months ended December 31, Year ended December 31,
(in thousands) 2017 2016 2017 2016
(unaudited) (unaudited)
Property acquisition costs: Evaluated(1) .................................................................................. $ — $ — $ — $ 5,905
Unevaluated ................................................................................. — 9,123 — 119,923
Exploration costs ........................................................................... 7,920 7,583 36,257 41,333
Development costs(2) ....................................................................... 163,664 73,839 560,919 298,942
Total costs incurred ......................................................................... $ 171,584 $ 90,545 $ 597,176 $ 466,103
_______________________________________________________________________________
(1) Evaluated property acquisition costs include $1.1 million in asset retirement obligations for the year ended December
31, 2016.
(2) Development costs include $0.1 million and $2.0 million in asset retirement obligations for the three months ended
December 31, 2017 and 2016, respectively, and $0.7 million and $2.5 million for the years ended December 31, 2017
and 2016, respectively.

12
Laredo Petroleum, Inc.
Supplemental reconciliations of GAAP to non-GAAP financial measures
Non-GAAP financial measures
The non-GAAP financial measures of Adjusted Net Income, Adjusted EBITDA and proved developed Finding & Development
Cost, as defined by us, may not be comparable to similarly titled measures used by other companies. Therefore, these non-
GAAP measures should be considered in conjunction with net income or loss and other performance measures prepared in
accordance with GAAP, such as operating income or loss or cash flow from operating activities. Adjusted Net Income,
Adjusted EBITDA and proved developed Finding and Development Cost should not be considered in isolation or as a
substitute for GAAP measures, such as net income or loss, operating income or loss, standardized measure of discounted future
net cash flows or any other GAAP measure of liquidity or financial performance.
Adjusted Net Income (Unaudited)
Adjusted Net Income is a non-GAAP financial measure we use to evaluate performance, prior to income tax expense or benefit,
impairment expense, mark-to-market on derivatives, cash premiums paid for derivatives, write-off of debt issuance costs, gain
on sale of investment in equity method investee, gains or losses on disposal of assets, loss on early redemption of debt and
other non-recurring income and expenses and after applying adjusted income tax expense. We believe Adjusted Net Income
helps investors in the oil and natural gas industry to measure and compare our performance to other oil and natural gas
companies by excluding from the calculation items that can vary significantly from company to company depending upon
accounting methods, the book value of assets and other non-operational factors.
Including a higher weighted-average common shares outstanding in the denominator of a diluted per-share computation results
in an anti-dilutive per share amount when an entity is in a loss position. As such, for each of the periods ended December 31,
2016, our net loss (GAAP) per common share calculation utilizes the same denominator for both basic and diluted net loss per
common share. However, our calculation of Adjusted Net Income (non-GAAP) results in income for the periods presented.
Therefore, we believe it appropriate and more conservative to calculate an Adjusted diluted weighted-average common shares
outstanding utilizing our fully dilutive weighted-average common shares. As such, for each of the periods ended December 31,
2017 and 2016, we present a line item that calculates Adjusted Net Income per Adjusted diluted common share.

13
The following table presents a reconciliation of income (loss) before income taxes (GAAP) to Adjusted Net Income (non-
GAAP):
Three months ended December 31, Year ended December 31,
(in thousands, except for per share data, unaudited) 2017 2016 2017 2016
Income (loss) before income taxes ...................................................... $ 410,361 $ (18,421 ) $ 550,774 $ (260,739 )
Plus: Impairment expense ....................................................................... — — — 162,027
Mark-to-market on derivatives: (Gain) loss on derivatives, net............................................................ 37,777 43,642 (350 ) 87,425
Cash settlements received for matured derivatives, net ............................. 2,792 37,655 37,583 195,281
Cash settlements received for early terminations of derivatives, net ............. — — 4,234 80,000
Cash premiums paid for derivatives .................................................... (12,311 ) (2,697 ) (25,853 ) (89,669 )
Write-off of debt issuance costs ......................................................... — — — 842
Gain on sale of investment in equity method investee** .......................... (405,906 ) — (405,906 ) —
Loss on disposal of assets, net ........................................................... 906 411 1,306 790
Loss on early redemption of debt ....................................................... 23,761 — 23,761 —
Adjusted net income before adjusted income tax expense ......................... 57,380 60,590 185,549 175,957
Adjusted income tax expense(1) ......................................................... (12,624 ) (21,812 ) (40,821 ) (63,345 )
Adjusted Net Income ....................................................................... $ 44,756 $ 38,778 $ 144,728 $ 112,612
Net income (loss) per common share: Basic .......................................................................................... $ 1.71 $ (0.08 ) $ 2.30 $ (1.16 )
Diluted ........................................................................................ $ 1.70 $ (0.08 ) $ 2.29 $ (1.16 )
Adjusted Net Income per common share: Basic .......................................................................................... $ 0.19 $ 0.16 $ 0.61 $ 0.50
Adjusted diluted ............................................................................ $ 0.19 $ 0.16 $ 0.60 $ 0.49
Weighted-average common shares outstanding: Basic .......................................................................................... 239,332 238,047 239,096 225,512
Diluted ........................................................................................ 240,289 238,047 240,122 225,512
Adjusted diluted ............................................................................ 240,289 243,507 240,122 228,676
_______________________________________________________________________________
(1) Adjusted income tax expense is calculated by applying a statutory tax rate of 22% for each of the periods ended
December 31, 2017 in response to recent changes in the tax code, and 36% for each of the periods ended December
31, 2016.

14
Adjusted EBITDA (Unaudited)
Adjusted EBITDA is a non-GAAP financial measure that we define as net income or loss plus adjustments for income tax
expense or benefit, depletion, depreciation and amortization, bad debt expense, impairment expense, non-cash stock-based
compensation, net of amounts capitalized, accretion expense, mark-to-market on derivatives, cash premiums paid for
derivatives, interest expense, write-off of debt issuance costs, gains or losses on disposal of assets, income or loss from equity
method investee, proportionate Adjusted EBITDA of our equity method investee and other non-recurring income and expenses.
Adjusted EBITDA provides no information regarding a company's capital structure, borrowings, interest costs, capital
expenditures, working capital movement or tax position. Adjusted EBITDA does not represent funds available for discretionary
use because those funds are required for debt service, capital expenditures, working capital, income taxes, franchise taxes and
other commitments and obligations. However, our management believes Adjusted EBITDA is useful to an investor in
evaluating our operating performance because this measure:
• is widely used by investors in the oil and natural gas industry to measure a company's operating performance
without regard to items excluded from the calculation of such term, which can vary substantially from company to
company depending upon accounting methods, the book value of assets, capital structure and the method by
which assets were acquired, among other factors;
• helps investors to more meaningfully evaluate and compare the results of our operations from period to period by
removing the effect of our capital structure from our operating structure; and
• is used by our management for various purposes, including as a measure of operating performance, in
presentations to our board of directors and as a basis for strategic planning and forecasting.
There are significant limitations to the use of Adjusted EBITDA as a measure of performance, including the inability to analyze
the effect of certain recurring and non-recurring items that materially affect our net income or loss, the lack of comparability of
results of operations to different companies and the different methods of calculating Adjusted EBITDA reported by different
companies. Our measurements of Adjusted EBITDA for financial reporting as compared to compliance under our debt
agreements differ.

15
The following table presents a reconciliation of net income (loss) (GAAP) to Adjusted EBITDA (non-GAAP):
Three months ended December 31, Year ended December 31,
(in thousands, unaudited) 2017 2016 2017 2016
Net income (loss) ........................................................................... $ 408,561 $ (18,421 ) $ 548,974 $ (260,739 )
Plus: Income tax expense ........................................................................ 1,800 — 1,800 —
Depletion, depreciation and amortization ............................................. 45,062 37,526 158,389 148,339
Impairment expense ....................................................................... — — — 162,027
Non-cash stock-based compensation, net of amounts capitalized ................ 8,857 9,667 35,734 29,229
Accretion expense .......................................................................... 969 896 3,791 3,483
Mark-to-market on derivatives: (Gain) loss on derivatives, net............................................................ 37,777 43,642 (350 ) 87,425
Cash settlements received for matured derivatives, net ............................. 2,792 37,655 37,583 195,281
Cash settlements received for early terminations of derivatives, net ............. — — 4,234 80,000
Cash premiums paid for derivatives .................................................... (12,311 ) (2,697 ) (25,853 ) (89,669 )
Interest expense ............................................................................. 19,787 23,004 89,377 93,298
Write-off of debt issuance costs ......................................................... — — — 842
Gain on sale of investment in equity method investee** .......................... (405,906 ) — (405,906 ) —
Loss on disposal of assets, net ........................................................... 906 411 1,306 790
Loss on early redemption of debt ....................................................... 23,761 — 23,761 —
Income from equity method investee** ............................................... (575 ) (3,144 ) (8,485 ) (9,403 )
Proportionate Adjusted EBITDA of equity method investee**(1) ................ 2,326 6,386 22,081 20,367
Adjusted EBITDA .......................................................................... $ 133,806 $ 134,925 $ 486,436 $ 461,270
_______________________________________________________________________________
(1) Proportionate Adjusted EBITDA of Medallion, our equity method investee through October 30, 2017, is calculated as
follows:
Three months ended December 31, Year ended December 31,
(in thousands, unaudited) 2017 2016 2017 2016
Income from equity method investee ................................................... $ 575 $ 3,144 $ 8,485 $ 9,403
Adjusted for proportionate share of depreciation and amortization .............. 1,751 3,242 13,596 10,964
Proportionate Adjusted EBITDA of equity method investee ...................... $ 2,326 $ 6,386 $ 22,081 $ 20,367

16
Proved Developed Finding and Development Cost (Unaudited)
Proved developed finding and development ("F&D") cost is calculated by dividing (x) development costs for the period, by (y)
proved developed reserve additions for the period, defined as the change in proved developed reserves, less purchased reserves,
plus sold reserves and plus sales volumes during the period. The method we use to calculate our proved developed F&D cost
may differ significantly from methods used by other companies to compute similar measures. As a result, our proved developed
F&D cost may not be comparable to similar measures provided by other companies. We believe that providing the measure of
proved development F&D cost is useful in evaluating the cost, on a per BOE basis, to add proved developed reserves.
However, this measure is provided in addition to, and not as an alternative for, and should be read in conjunction with, the
information contained in our financial statements prepared in accordance with GAAP. Due to various factors, including timing
differences in the addition of proved reserves and the related costs to develop those reserves, proved developed F&D cost do
not necessarily reflect precisely the costs associated with particular proved reserves. As a result of various factors that could
materially affect the timing and amounts of future increases in proved reserves and the timing and amounts of future costs, we
cannot assure you that our future proved developed F&D cost will not differ materially from those presented.
(dollars in millions, except per BOE amount, reserves and sales volumes in MMBOE) Proved developed F&D
Development costs (x) ...................................................................................................................................... $ 561
Proved developed reserves: As of December 31, 2017 ................................................................................................................................ 191
As of December 31, 2016 ................................................................................................................................ (141 )
Change in proved developed reserves ............................................................................................................... 50
Plus sales of proved developed reserves during 2017 .............................................................................................. —
Plus 2017 sales volumes .................................................................................................................................. 21
Proved developed reserve additions (y) ............................................................................................................. 71
Proved developed F&D cost per BOE .................................................................................................................. $ 7.90
** On October 30, 2017, LMS, together with Medallion Midstream Holdings, LLC ("MMH"), which is owned and controlled
by an affiliate of the third-party interest holder, The Energy & Minerals Group ("EMG"), completed the sale of 100% of the
ownership interests in Medallion to an affiliate of Global Infrastructure Partners ("GIP"), for cash consideration of $1.825
billion (the "Medallion Sale"). LMS' net cash proceeds for its 49% ownership interest in Medallion in 2017 was $829.6 million,
before post-closing adjustments and taxes, but after deduction of its proportionate share of fees and other expenses associated
with the Medallion Sale. On February 1, 2018, closing adjustments were finalized and LMS received additional net cash of
$1.7 million for total net cash proceeds before taxes of $831.3 million. The Medallion Sale closed pursuant to the membership
interest purchase and sale agreement, which provides for potential post-closing additional cash consideration that is structured
based on GIP's realized profit at exit. There can be no assurance as to when and whether the additional consideration will be
paid.
# # #
Contacts:
Ron Hagood: (918) 858-5504 - [email protected]
18-3