large area high resolution neutron imaging detector for fuel cell
TRANSCRIPT

1
Large Area High Resolution Neutron Imaging Detector for Fuel Cell Research
Christian Tötzkea,d,*, Ingo Mankea, André Hilgera, Gerard Choinkaa, Nikolay Kardjilova,
Tobias Arlta, Henning Marköttera, Alexander Schröderb, Klaus Wippermannb, Detlef
Stoltenb, Christoph Hartnigc, ‡, Phillip Krügerc, Robert Kuhnc and John Banharta,d
aHelmholtz Centre Berlin (HZB), 14109 Berlin, Germany bResearch Centre Jülich, 52428 Jülich, Germany (FZJ) cCentre for Energy and Hydrogen Research (ZSW), 89081 Ulm, Germany dTechnical University Berlin, 10623 Berlin, Germany * corresponding author. Fon: +49 30 8062 42615
Email: [email protected]
‡ present address: Chemetall GmbH, Trakehner Straße 3, 60487 Frankfurt a. M.,
Germany
ABSTRACT Neutron radiography is increasingly being considered a powerful diagnostic tool in fuel
cell research. Analyzing the water distribution for entire cells requires large and flexible
fields of view and high spatial resolution at the same time. The combination of these
requirements is a great technical challenge for neutron detectors: While conventional
detectors could provide large fields of view, the accuracy of water mapping has so far
been limited by their low spatial resolution. On the other hand, the applicability of
sophisticated high-resolution detectors in fuel cell research is limited by their small and
invariable fields of view.
We present a novel detector system designed to meet the specific demands of fuel cell
research. High spatial resolution of at the best 25 µm was achieved by an optimized
gadox scintillator, while a large and flexible field of view, e.g. 61.4 × 61.4 mm2 at a scale
factor of 1:1 is provided by a 4096 × 4097 pixel2 CCD-camera.

2
The set up ensures great adaptivity to fuel cells of various sizes along with the best
possible spatial resolution. Studies on the water transport in a DMFC and PEMFC are
presented to demonstrate the capacity of the detector system.
Introduction
Neutron radiography has been used as a valuable diagnostic technique in a wide range of
industrial and scientific applications, providing complementary information to X-ray
imaging.[1-5] The increasing number of publications related to neutron imaging is an
indicator that it has become a standard tool for the investigation of fuel cell water
distribution in polymer electrolyte membrane fuel cells (PEMFCs)[6-21] as well as CO2-
and cell water distribution in direct methanol fuel cells (DMFCs).[22-23]
Neutrons have unique properties for imaging when compared to x-rays: they can
penetrate deeply into many metals, e.g. aluminum or steel, while they are strongly
attenuated by hydrogen-containing compounds such as water. For the investigation of
water distributions in engineering systems, neutron imaging is often favored over X-rays;
although high-energy X-rays can penetrate metallic components, they only have low
sensitivity to water and can therefore provide little information about the water
distribution within a system.
So far the limited spatial resolution of neutron radiography has been one of the major
drawbacks of this imaging technique. Three years ago, the typical resolution of standard
imaging setups still ranged from 100 µm to 250 µm.[1]
Alternatively, synchrotron X-ray radiography allows measurements at high spatial and
temporal resolution.[1] This technique has been successfully applied to analyze water and
carbon dioxide distributions in PEMFCs[24-28] and DMFCs.[29] In contrast to neutron
radiography, only comparatively small cell areas of typically 10-100 mm2 can be
investigated due to the small field of view. In addition, all highly absorbent components
must be removed from the beam path which necessitates modifications of the fuel cell
design.

3
Several research groups have worked towards considerably improving the spatial
resolution of neutron imaging. High-resolution neutron detector systems have been
developed by following different engineering concepts. Prominent examples are micro-
focusing optical devices[30] and imaging systems based on a 10B-doped micro channel
plate (MCP)[31-32] design. However, with respect to investigations of fuel cells, these
high-resolution detector systems have a severe disadvantage: They provide only a small
and invariable field of view (e.g. 27.6 × 27.6 mm2, 14 × 14 mm2 or circular with 25 mm
in diameter[30-32]). Thus, a vital advantage of conventional neutron detector systems
over synchrotron X-rays, namely the wide field of view, is sacrificed in favor of higher
spatial resolution. As studies on water management often require the visualization of
large cell areas or even complete cells, time-consuming sequential screening procedures
become necessary. Image scanning would have significant negative impacts on time
resolution.
At the Helmholtz Centre in Berlin an alternative approach has been chosen: We have
worked to develop a detector design based on conventional components that can cope
with two major demands of fuel cell research: a large and flexible field of view and high
spatial resolution at the same time. Such a system would allow for the visualization of
large cell areas at high resolution without relying on intricate screening procedures.
Neutron Detector Imaging Systems - State of the Art The basic components of a conventional modern neutron detector system are a low-noise
CCD camera and a scintillator screen that converts detected neutrons into visible light.
The sample under investigation is exposed to neutrons as close as possible to the
scintillator. This way a 2D absorption image of the sample is formed on the scintillator
screen and is subsequently projected onto the CCD-chip via a mirror and the lens system
of the camera. The mirror prevents the camera from direct beam exposure. Images were
recorded by a PC-system and later processed with appropriate software. The principal
setup of a neutron radiographic study on fuel cells is depicted in Figure 1.

4
Figure 1: Principal experimental setup for neutron radiographic studies of fuel cells
Apart from beam parameters influencing the image resolution (i.e. collimation ratio L/D),
the maximum spatial resolution of the detector system resolution is restricted by blurring
on the scintillator screen, the optical quality of the camera lens and the pixel size on the
CCD-chip.
Standard scintillator screens are coated with a powder mixture of lithium fluoride and
zinc sulfide (6LiFZnS). 6Li-nuclei absorb impinging neutrons and as a result emit α and T
(3H) particles. In turn, these particles trigger photon-emitting scintillation events as they
interact with zinc sulfide particles; the scintillator starts shining.
The image definition of the sample projection formed by the scintillating screen depends
on the thickness of the 6LiFZnS layer and the mean free path of both T and α particles.
Although thick coating layers ensure good light efficiencies (due to the high probability
of neutron interaction with lithium nuclei), increasing the layer thickness impairs spatial
resolution because of the extended travel of T and α particles and the increased effective
size of photo-emission sites.

5
A reduction of 6LiFZnS layer thickness is, therefore, an obvious way to improve
scintillator resolution. This also results in lower light efficiency requiring longer exposure
times.
Taking into account the interrelationship of spatial and temporal resolution and the
necessity to find a trade-off, the determination of the appropriate scintillator thickness
depends on the requirements of the respective application.
Development of Novel Scintillator Screens
The evolution of a high-resolution detector system is based on the improvement of the
scintillator. The thickness of the 6LiFZnS layer was reduced from 200 µm to 50 µm
resulting in an improvement of the resolution from 137 µm to 72 µm. Images were taken
by a CCD-camera (model Andor DW 436) in combination with a 105 mm Nikon lens. If
the 6LiFZnS layer thickness was further reduced, nearly all neutrons would pass through
the scintillator screen without interaction, resulting in an unfavorable signal-to-noise
ratio.
Yet a thinner scintillator design becomes possible if 6LiFZnS is substituted by a Gd2O2S
(“gadox”) layer. Compared to 6LiFZnS, gadox has a significantly larger effective cross
section for neutrons. A layer of only 10-µm thick gadox absorbs nearly 90 % of the
incoming radiation.
A neutron captured by Gd generates conversion electrons that stimulate GdS2O3 to
scintillate. The conditions for high spatial resolution are more favorable in gadox since
the free mean path of conversion electrons (Rce = 12 µm) is an order of magnitude less
than that of T in 6Li (Rt = 130 µm).
When used for neutron imaging, gadox scintillators also have some disadvantages,
including high sensitivity to X-rays, and low light output due to the low energy of the
conversion electrons. To compensate the latter drawback, the scintillator light output was
optimized by embedding the gadox powder into water glass. Additionally, the incident
neutron side of the scintillating layer was coated by an aluminum layer which back-

6
reflects the light emitted away from the detector position. The performance of Gadox
scintillators with layer thicknesses in the range of 5-30 µm was tested. Layer thickness
between 10-20 µm was found to yield best light output. In thicker layers, self shielding
occurs, which spoils the scintillator light performance.
As shown in Figure 2, the scintillator resolution can be tested by imaging appropriate
patterns, e.g. a Siemens star.[33] This test pattern consists of dark spokes on a bright
background radiating from a common centre and getting wider towards the outside. The
radial spokes of the star can be resolved from the outside of the pattern only down to a
certain size, after which the central region is blurred. This provides an estimate for the
spatial resolution.
Alternatively, the resolution can be determined using the modulation transfer function
(MTF) which is calculated over a sharp edge. This was measured for an image produced
by attaching a gadolinium foil to the scintillator. Resolution measurements achieved in
this way for scintillators of various thicknesses are listed in Table 1. The results refer to a
value of 10% of the MTF. Series consisting of three images, each with 30 s exposure
time, were taken in order to compensate the low light emission and improve signal-to-
noise ratios. “White spots” were reduced by median and erosion filters.
Figure 2: Siemens star used in a resolution test. Left: Image of the test pattern on a 10 µm gadox scintillator (200 mm lens, 150 s exposure time, 13.5 µm pixel size) Right: Magnified detail of the area marked in white on the left, demonstrating a spatial resolution better than 50 µm.

7
Table 1: Spatial resolutions of different gadox scintillators measured via the MTF of a sharp edge. Exposure time was 3 × 30 s in all cases. Scintillator thickness [μm] Resolution [μm]
30 61
20 40
10 31
5 25
Implementation of a 16 Megapixel Camera System
Addressing questions of water management often requires the visualization of large cell
areas or even complete cells, preferably at high resolution. The small and invariable field
of view of most high resolution systems strongly restricts the practicability of such
measurements: Since the dimensions of fuel cells normally exceed the image area a
sequential scan is inevitable. This entails additional experimental effort and some loss of
information about the water transport dynamics in the cell.
Upgrading the CCD-chip is a promising possibility to extend the image area. In
combination with an appropriate lens system the field of view is now variable. At the
Helmholtz Centre Berlin, this approach was realized by integrating a 4k × 4k CCD sensor
based camera system (Peregrine 486).

8
Figure 3: 16-MegaPixel-CCD Camera (Peregrin 486) equipped with a lens of the type Schneider Kreuznach Macro Symmar 5.6/120.
A single pixel has a physical dimension of 15×15 µm2. The camera is equipped with an
optical system that allows a magnification range from 1:0.84 up to 1:1.25. At 1:1 scale,
the field of view covers an area of 61.44 × 61.44 mm2. Owing to the flexible
magnification, the imaging field can be adapted to the requirements of a given
application. A cooling system ensures the operation temperature of -50 ° C, which is
necessary to reduce thermal electronic noise.
When using gadox scintillators, longer exposure times must be accepted owing to the
lower light output compared to 6LiFZnS. However, the crucial neutron quantum yield is
optimal, which improves the real signal statistics and largely compensates for this
disadvantage.
Applications in Fuel Cell Research

9
Selected results of radiographic studies of the water distribution in a DMFC and PEMFC
are presented in the following section. The experiments were conducted using the
CONRAD instrument at the Hahn-Meitner research reactor of the Helmholtz Centre
Berlin.[34]
Water Distribution in a Running Direct Methanol Fuel Cell
Experimental Setup A direct methanol fuel cell was designed and manufactured at the Research Centre Jülich.
The test cell has an active area of 42 × 42 mm2. One-molar methanol solution is fed to the
anode side and distributed via a meandering channel structure. An air stream passes
through the cathode where a matrix of square feet forms a grid flow field. In order to
study the influence of surface treatments on the water transport characteristics, half of the
cathode flow field surface was hydrophilized.
To allow for a radiographic study of the cell at high resolution and acceptable exposure
times, a 20-µm thick gadox scintillator 45 × 45 mm2 in size was attached to the back of
the cell. The 4k × 4k detector combined with a 1:0.84 optic is ideally suited for cells of
this size. It provides a field of view of 51 × 51 mm2 at a pixel size of only 12.6 µm. This
way, a high resolution is obtained without time consuming scanning of a detector with
limited field of view.
Experimental Results
Figure 4 displays a series of quotient images of the test cell showing water distributions
during one hour of operation at a current density of 50 mA/cm2 and an air stoichiometry
of λ = 2. The dotted line indicates the border between untreated (left) and hydrophilized
flowfield surface (right).

10
Figure 4: Water formation and transport in a direct methanol fuel cell (DMFC) (current density 50 mA/cm2, λ = 2). (A) start, (B) after 15 min, (C) after 30 min, and (D ) after 60 min. Hydrophilic (right) and untreated areas are separated by the dashed line. Grey values < 1 (dark areas) indicate water accumulation. The water distribution was visualized by normalizing all images with respect to a
reference state where the anode is flooded by methanol solution whereas the cathode side
is dry.
Methanol solution is supplied to the bottom and exits at the top of the cell. The upward
flow direction supports the drag out of CO2 bubbles which form during operation. At the
cathode side, air is fed in at the top of the cell.

11
The water formed at the cathode during cell operation is transported through the GDL
and dragged out of the cell by both the gas stream and gravity. As illustrated in Figure 4,
the transport characteristics differ significantly between the untreated and hydrophilic cell
area, respectively. While large water accumulation can be found inside the left
(untreated) half of the cell, only much less water accumulates within the right half. This
shows that the hydrophilic flow field offers good conditions for effective water transport.
Water in the hydrophilic gas channels tends to form thin continuous layers covering the
surface without severely interfering with the gas stream. In contrast, water forms droplets
in the untreated part of the flowfield. The growing droplets successively flood the gas
channels, thereby blocking gas flow. In Figure 4, these flooded areas appear as dark
rectangular spots revealing the checkered flow field geometry.
At the anode side, CO2 bubbles are formed as product gas of methanol oxidation. The gas
concentration in the anode channel increases in flow direction. Eventually, CO2 exits the
cell along with unreacted methanol solution. Even though the temporal resolution of the
image series is insufficient to resolve single gas bubbles, the accumulation of CO2 inside
the gas channels can be tracked by analyzing the attenuation values along the anode
channel. Figure 5 shows a mean image of the test cell averaged over one hour of
operation.

12
Figure 5: Neutron image of the test cell averaged over one hour of operation. Grey values along the white arrow are displayed in Figure 6. Following the anode channel upwards, the transmission values successively increase, so
the meandering anode channel appears brighter. This proves an increasing gas content in
flow direction inside the channel.
In Figure 6, the attenuation values are given along a line perpendicular to the meandering
anode channel (as indicated in Figure 5) with hatched areas indicating the channel
regions. The trend of transmission along the channel clearly documents a bubble
enrichment in the anode stream. The gradient suggests higher accumulation rates for the
first half of the channel, which corresponds to the bottom half of the cell. Values in the
unhatched regions of the diagram represent the transmission profile of the land areas
along the arrow. The moderate increase in transmission indicates a decreasing water
content of the GDL in from bottom to top.
0 10 20 30 40
0.9
1.0
1.1
1.2
1.3
1.4
Nor
mal
ized
tran
smis
sion
[a.u
.]
x [mm]
Trend along the methanol channel in flow direction
Figure 6: Attenuation values along a line crossing the cell (white arrow in Figure 5). Trend line represents downstream attenuation and reveals gas formation within the anode channel.
Water Distribution and Eruptive Water Transport in a PEMFC A study of the water distribution and transport in a polymer electrolyte membrane cell
(PEM) is presented in a second example.

13
Experimental Setup The test cell was designed and manufactured at the Centre for Solar Energy and
Hydrogen Research in Ulm (Germany). The cell dimension of 140 × 140 mm2 included
an active area of 100 × 100 mm2. A 420-µm thick gas diffusion layer (GDL) of the type
“SGL 10 BB” was used. The media were distributed by a threefold meander flowfield
possessing 0.7-mm wide flow field channels separated by 0.8-mm wide land areas.
Experimental Results The test cell was operated through a series of increasing current densities: Starting in the
dry condition at 100 mA/cm2, the current density was successively increased to 300
mA/cm2 after 25 min, 400 mA/cm2 after 60 min and 500 mA/cm2 after 90 min after start.
Throughout the experiment, the utilization rates were kept at uC=25 % at the anodic and
uA=90 % at the cathodic side. Figure 7 shows a series of representative quotient images
documenting water evolution in both the GDL and the flow field channels. All images are
normalized with respect to the reference image of the dry cell.
At the current density of 100 mA/cm2, see Figure 7(A), only a moderate amount of water
is formed and accumulates inside the GDL, predominantly in the upper part of the cell
beneath land areas. Very few droplets have entered the flowfield channels yet. Upon
increasing the current density to 300 mA/cm2, water accumulation in the GDL intensifies.
Owing to the thickness of the GDL-type used, water diffusion inside the GDL can be
tracked very well. The obvious grey shade in Figure 7 (B) indicates that water has now
also accumulated in wide areas of the middle and lower test cell section. Moreover, first
water droplets have entered flow field channels at various cites – recognizable as dark
spots in Figure 7 (B). Further increasing the current density to 400 mA/cm2 and then to
500 mA/cm2 continues the trend of water accumulation, due to the formation rate now
significantly exceeding the evaporation rate into the passing air stream. Consequently,
channels are gradually flooded by coalescing water droplets that form growing water
domains, which in turn extend to water columns. These water columns occupy complete

14
channel sections and impede the bypass of air. Therefore, pressure builds up which
eventually drags out entire cohesive water agglomerates, see Figure 7(C) and (D).
Figure 7: Evolution of the water distribution at different current densities. A) after 30 min, I=100 mA/cm2; B) after 40 min, I=300 mA/cm2; C) after 65 min, I=400 mA/cm2; D) after105 min, I=500 mA/cm2. Water accumulation within the GDL appears as grey shade, dark parts of the flowfield structure are the water filled channel sections. An interesting water transport feature is the fast formation and stripping of droplets in the
flow field channel.[25-26, 35-38] Because the respective transition spots are very small
and droplet transitions occur rapidly, the phenomenon of eruptive water transport from
the GDL into the flowfield channels could be investigated in situ by synchrotron X-ray
radiography only in the past.[25-26]
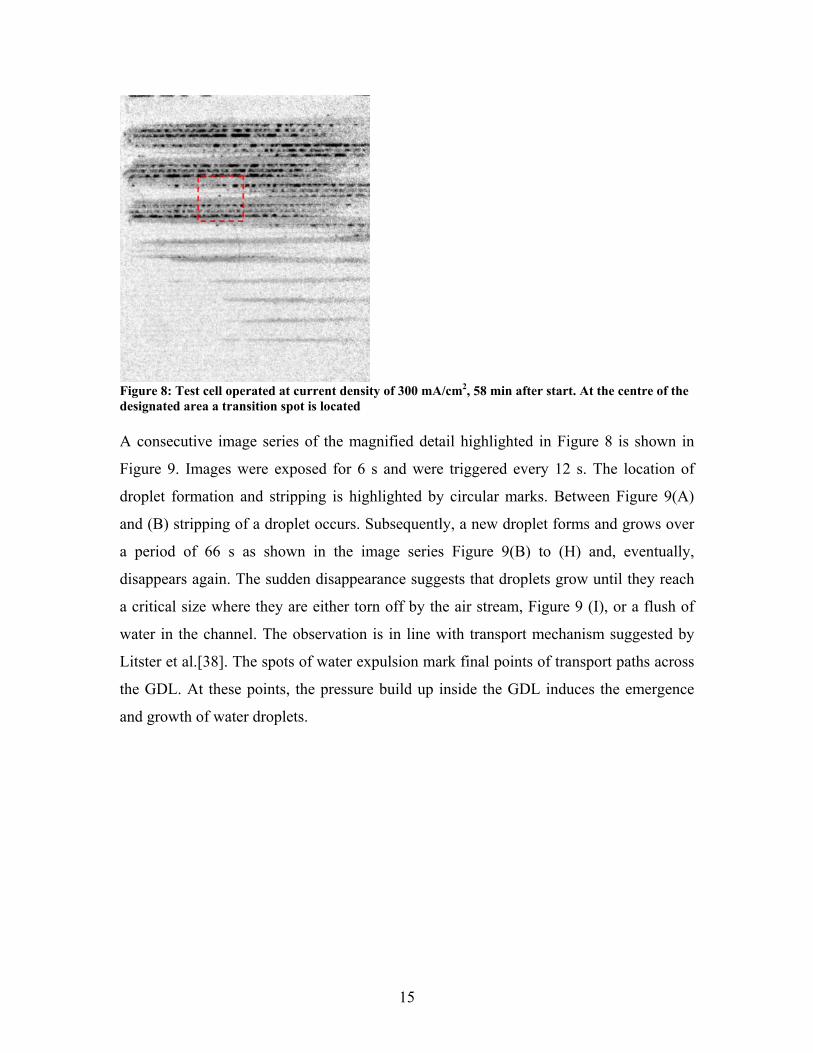
In this neutron radiographic study it was possible to identify various spots at flowfield
channels where water droplets form and disappear on a short time scale. The location of
such a typical spot is highlighted by the dashed rectangular marker in Figure 8.
15
Figure 8: Test cell operated at current density of 300 mA/cm2, 58 min after start. At the centre of the designated area a transition spot is located A consecutive image series of the magnified detail highlighted in Figure 8 is shown in
Figure 9. Images were exposed for 6 s and were triggered every 12 s. The location of
droplet formation and stripping is highlighted by circular marks. Between Figure 9(A)
and (B) stripping of a droplet occurs. Subsequently, a new droplet forms and grows over
a period of 66 s as shown in the image series Figure 9(B) to (H) and, eventually,
disappears again. The sudden disappearance suggests that droplets grow until they reach
a critical size where they are either torn off by the air stream, Figure 9 (I), or a flush of
water in the channel. The observation is in line with transport mechanism suggested by
Litster et al.[38]. The spots of water expulsion mark final points of transport paths across
the GDL. At these points, the pressure build up inside the GDL induces the emergence
and growth of water droplets.

16
Figure 9: Detail of the test cell showing eruptive water transport from the GDL into the flowfield channel. An analysis of droplet growth and displacement shows that eruptive transport does not
occur randomly, but rather shows regular temporal patterns. The intensity of the
respective cell area (circular marks in Figure 9) is shown in Figure 10. After a run time of
t=51 min (3060 s), the intensity at the transition spot suddenly starts to oscillate. This
oscillation is associated to the life time of droplets and has a periodicity of about 60 s ±
10 s. The experimental finding is also in line with experimental results of synchrotron X-
ray radiographic studies that evidenced eruptive water transport into flowfield
channels.[25-26] In previous studies, various spots of serial eruptive water expulsion with
repetition times of typically 30 s to 60 s were identified, which matches the order of
magnitude found in the present neutron radiographic study.19-21

17
Figure 10: Mean transmission values at the transition spot marked in Figure 9. After 51 min, an intense oscillation sets in, indicating the sudden onset of droplet eruption.
Conclusions Neutron radiography has been proven a valuable tool in fuel cell research. Neutrons have
a high metal penetration potential and, concurrently, an excellent sensitivity to water.
This makes them ideally suited for in situ studies of water management.
The development of novel gadox scintillators led to major improvements of the spatial
resolution to 25 µm. In addition, the implementation of a 4k × 4k CCD chip allows for
visualizing water distributions of large cell areas or even complete fuel cells with sizes
ranging up to 73 × 73 mm2 at high spatial resolutions. When equipped with appropriate
lens systems, the field of view could even be further extended to more than 200 × 200
mm2.
A unique feature of the presented high-resolution detector system is the large and flexible
field of view that can be adapted to fuel cells of various sizes while ensuring the best
possible spatial resolution. As opposed to high-resolution detectors with a very limited
field of view, intricate sequential screening procedures can be avoided.
Acknowledgements The research activities were partly funded by the German Federal Ministry for Education
and Science (BMBF) under grant number 03SF0324A and 03SF0324F (RuNPEM) and

18
by the German Federation of Industrial Research Associations (AiF) under grant number
16002 N.
References
[1] J. Banhart, Advanced Tomographic Methods in Materials Research and Engineering, Oxford University Press, Oxford, UK, 2008. [2] J. Banhart, A. Borbély, K. Dzieciol, F. Garcia-Moreno, I. Manke, N. Kardjilov, A.R. Kaysser-Pyzalla, M. Strobl, W. Treimer, International Journal of Materials Research, (2010) 1069-1079. [3] I. Manke, J. Banhart, A. Haibel, A. Rack, S. Zabler, N. Kardjilov, A. Hilger, A. Melzer, H. Riesemeier, Applied Physics Letters, 90 (2007) 214102. [4] N. Kardjilov, A. Hilger, I. Manke, M. Strobl, W. Treimer, J. Banhart, Nuclear Instruments and Methods in Physics Research Section A: Accelerators, Spectrometers, Detectors and Associated Equipment, 542 (2005) 16-21. [5] M. Strobl, I. Manke, N. Kardjilov, A. Hilger, M. Dawson, J. Banhart, Journal of Physics D-Applied Physics, 42 (2009). [6] R.J. Bellows, M.Y. Lin, M. Arif, A.K. Thompson, D. Jacobson, Journal of The Electrochemical Society, 146 (1999) 1099-1103. [7] R. Satija, D.L. Jacobson, M. Arif, S.A. Werner, Journal of Power Sources, 129 (2004) 238-245. [8] M.A. Hickner, N.P. Siegel, K.S. Chen, D.N. McBrayer, D.S. Hussey, D.L. Jacobson, M. Arif, Journal of The Electrochemical Society, 153 (2006) A902-A908. [9] J. Zhang, D. Kramer, R. Shimoi, Y. Ono, E. Lehmann, A. Wokaun, K. Shinohara, G.G. Scherer, Electrochimica Acta, 51 (2006) 2715-2727. [10] D. Kramer, J. Zhang, R. Shimoi, E. Lehmann, A. Wokaun, K. Shinohara, G.G. Scherer, Electrochimica Acta, 50 (2005) 2603-2614. [11] A. Turhan, K. Heller, J.S. Brenizer, M.M. Mench, Journal of Power Sources, 160 (2006) 1195-1203. [12] J.J. Kowal, A. Turhan, K. Heller, J. Brenizer, M.M. Mench, Journal of The Electrochemical Society, 153 (2006) A1971-A1978. [13] M.A. Hickner, N.P. Siegel, K.S. Chen, D.S. Hussey, D.L. Jacobson, M. Arif, Journal of The Electrochemical Society, 155 (2008) B427-B434. [14] P. Boillat, D. Kramer, B.C. Seyfang, G. Frei, E. Lehmann, G.G. Scherer, A. Wokaun, Y. Ichikawa, Y. Tasaki, K. Shinohara, Electrochemistry Communications, 10 (2008) 546-550. [15] C. Hartnig, I. Manke, N. Kardjilov, A. Hilger, M. Grünerbel, J. Kaczerowski, J. Banhart, W. Lehnert, Journal of Power Sources, 176 (2008) 452-459. [16] A. Geiger, A. Tsukada, E. Lehmann, P. Vontobel, A. Wokaun, G. Scherer, Fuel Cells, 2 (2002) 92-98.

19
[17] I. Manke, C. Hartnig, N. Kardjilov, M. Messerschmidt, A. Hilger, M. Strobl, W. Lehnert, J. Banhart, Applied Physics Letters, 92 (2008) 244101. [18] D.J. Ludlow, C.M. Calebrese, S.H. Yu, C.S. Dannehy, D.L. Jacobson, D.S. Hussey, M. Arif, M.K. Jensen, G.A. Eisman, Journal of Power Sources, 162 (2006) 271-278. [19] I. Manke, C. Hartnig, M. Grunerbel, J. Kaczerowski, W. Lehnert, N. Kardjilov, A. Hilger, J. Banhart, W. Treimer, M. Strobl, Applied Physics Letters, 90 (2007) 184101. [20] J.P. Owejan, T.A. Trabold, D.L. Jacobson, D.R. Baker, D.S. Hussey, M. Arif, International Journal of Heat and Mass Transfer, 49 (2006) 4721-4731. [21] P. Boillat, G.G. Scherer, A. Wokaun, G. Frei, E.H. Lehmann, Electrochemistry Communications, 10 (2008) 1311-1314. [22] A. Schröder, K. Wippermann, J. Mergel, W. Lehnert, D. Stolten, T. Sanders, T. Baumhöfer, D.U. Sauer, I. Manke, N. Kardjilov, A. Hilger, J. Schloesser, J. Banhart, C. Hartnig, Electrochemistry Communications, 11 (2009) 1606-1609. [23] A. Schröder, K. Wippermann, W. Lehnert, D. Stolten, T. Sanders, T. Baumhöfer, N. Kardjilov, A. Hilger, J. Banhart, I. Manke, Journal of Power Sources, 195 (2010) 4765-4771. [24] C. Hartnig, I. Manke, R. Kuhn, S. Kleinau, J. Goebbels, J. Banhart, Journal of Power Sources, 188 (2009) 468-474. [25] I. Manke, C. Hartnig, N. Kardjilov, H. Riesemeier, J. Goebbels, R. Kuhn, P. Krüger, J. Banhart, Fuel Cells, 10 (2010) 26-34. [26] C. Hartnig, I. Manke, R. Kuhn, N. Kardjilov, J. Banhart, W. Lehnert, Applied Physics Letters, 92 (2008) 134106. [27] I. Manke, C. Hartnig, M. Grunerbel, W. Lehnert, N. Kardjilov, A. Haibel, A. Hilger, J. Banhart, H. Riesemeier, Applied Physics Letters, 90 (2007) 174105. [28] S.J. Lee, N.-Y. Lim, S. Kim, G.-G. Park, C.-S. Kim, Journal of Power Sources, 185 (2008) 867-870. [29] C. Hartnig, I. Manke, J. Schloesser, P. Krüger, R. Kuhn, H. Riesemeier, K. Wippermann, J. Banhart, Electrochemistry Communications, 11 (2009) 1559-1562. [30] E.H. Lehmann, G. Frei, G. Kühne, P. Boillat, Nuclear Instruments and Methods in Physics Research Section A: Accelerators, Spectrometers, Detectors and Associated Equipment, 576 (2007) 389-396. [31] A.S. Tremsin, J.V. Vallerga, J.B. McPhate, O.H.W. Siegmund, W.B. Feller, L. Crow, R.G. Cooper, Nuclear Instruments and Methods in Physics Research Section A: Accelerators, Spectrometers, Detectors and Associated Equipment, 592 (2008) 374-384. [32] O.H.W. Siegmund, J.V. Vallerga, A. Martin, B. Feller, M. Arif, D.S. Hussey, D.L. Jacobson, Nuclear Instruments and Methods in Physics Research Section A: Accelerators, Spectrometers, Detectors and Associated Equipment, 579 (2007) 188-191. [33] C. Grunzweig, G. Frei, E. Lehmann, G. Kuhne, C. David, Review of Scientific Instruments, 78 (2007) 053708. [34] N. Kardjilov, A. Hilger, I. Manke, M. Strobl, M. Dawson, J. Banhart, Nuclear Instruments and Methods in Physics Research Section A: Accelerators, Spectrometers, Detectors and Associated Equipment, 605 (2009) 13-15. [35] A. Bazylak, D. Sinton, N. Djilali, Journal of Power Sources, 176 (2008) 240-246. [36] P. Zhou, C.W. Wu, Journal of Power Sources, 195 (2010) 1408-1415. [37] P.K. Sinha, C.-Y. Wang, Electrochimica Acta, 52 (2007) 7936-7945. [38] S. Litster, D. Sinton, N. Djilali, Journal of Power Sources, 154 (2006) 95-105.