large scale applications - tu...
TRANSCRIPT
Large scale applications:
* Verwey transition (magnetite, YBaFe2O5) * Boron nitride BN on transition metal (111) surfaces* Misfit layer compounds PbS1.14TaS2
Karlheinz SchwarzInstitut für Materialchemie
TU Wien

1. example: YBaFe2O5
Magnetic and charge order phase transition in
YBaFe2O5 (Verwey transition)
Thanks to: Pavel Karen (Univ. Oslo, Norway)
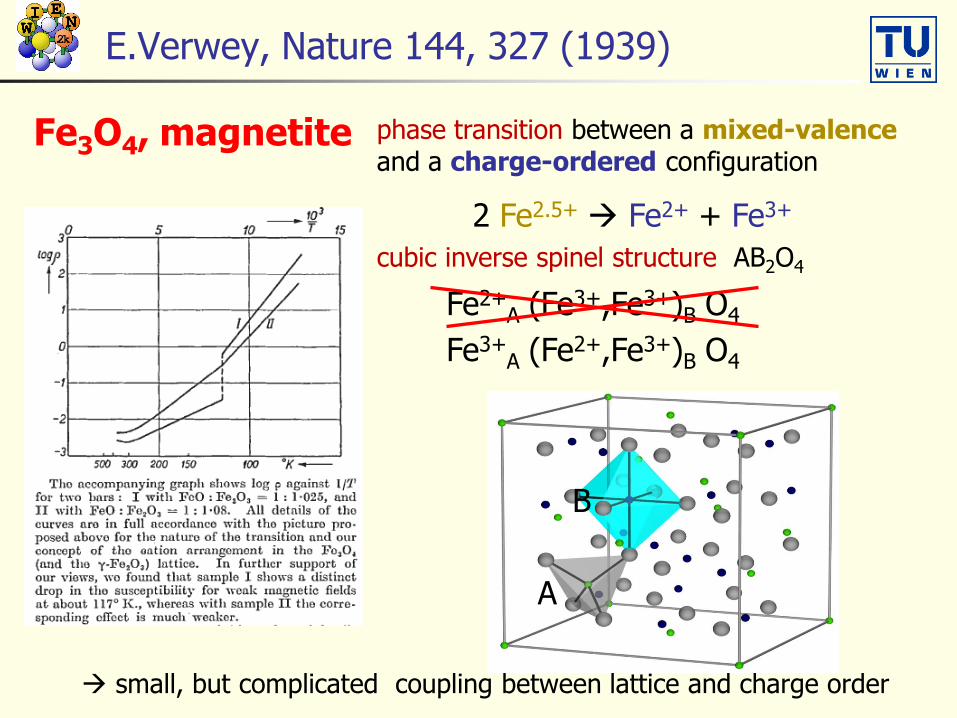
E.Verwey, Nature 144, 327 (1939)
Fe3O4, magnetite phase transition between a mixed-valenceand a charge-ordered configuration
2 Fe2.5+ Fe2+ + Fe3+
cubic inverse spinel structure AB2O4
Fe2+A (Fe3+,Fe3+)B O4
Fe3+A (Fe2+,Fe3+)B O4
B
A
small, but complicated coupling between lattice and charge order

… as a B-site Fe network
Wright et al. PRB 66 (2002) 214422
Fe3+
Fe2+
Verwey et al. J.Chem.Phys 15(1947)181
2+2 order minimizes nearest-
neighbor Coulombic energy
Imma
P.W.Anderson, PR 102 (1956)1008
3+1 order
Verwey suggestion:
Fe2.5+

Double-cell perovskites: RBaFe2O5
ABO3 O-deficient double-perovskite
Y (R)
Ba
square pyramidalcoordination
Antiferromagnet with a 2 step Verwey transition around 300 K
Woodward&Karen, Inorganic Chemistry 42, 1121 (2003)
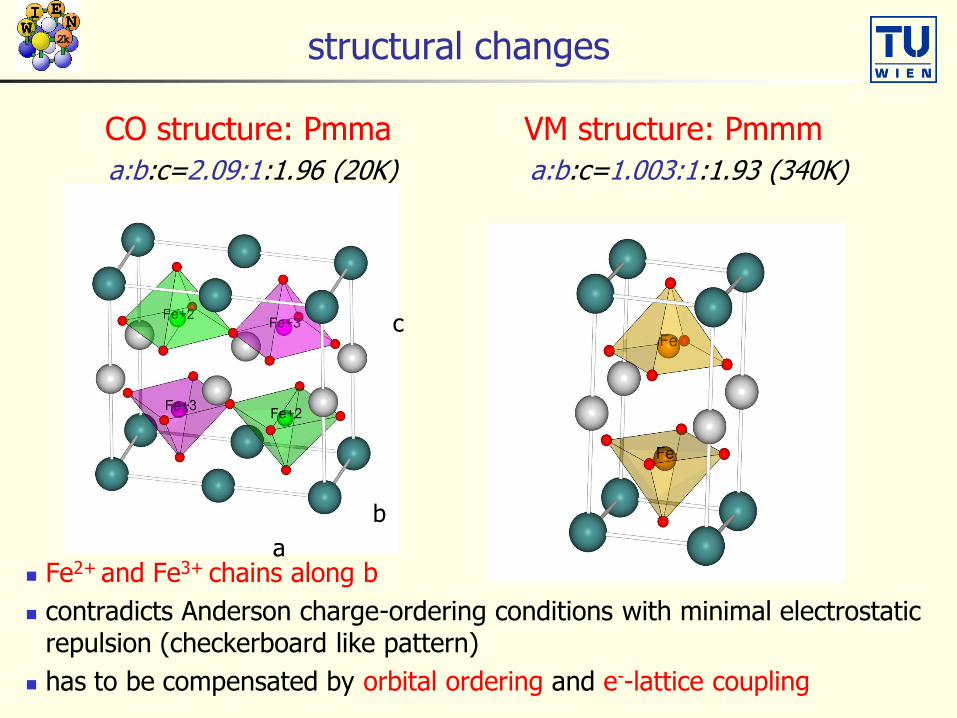
structural changes
CO structure: Pmma VM structure: Pmmm
a:b:c=2.09:1:1.96 (20K) a:b:c=1.003:1:1.93 (340K)
Fe2+ and Fe3+ chains along b
contradicts Anderson charge-ordering conditions with minimal electrostatic repulsion (checkerboard like pattern)
has to be compensated by orbital ordering and e--lattice coupling
a
b
c

antiferromagnetic structure
CO phase: G-type AFM VM phase: AFM arrangement in all directions, AFM for all Fe-O-Fe superexchange paths
also across Y-layer FM across Y-layer (direct Fe-Fe exchange)
Fe moments in b-direction
4 8independent Fe atoms

“Localized electrons”: GGA+U
Hybrid-DFT Exc
PBE0 [r] = ExcPBE [r] + a (Ex
HF[Fsel] – ExPBE[rsel])
LDA+U, GGA+U ELDA+U(r,n) = ELDA(r) + Eorb(n) – EDCC(r)
separate electrons into “itinerant” (LDA) and localized e- (TM-3d, RE 4f e-)
treat them with “approximate screened Hartree-Fock”
correct for “double counting”
Hubbard-U describes coulomb energy for 2e- at the same site
orbital dependent potential
)2
1)(( ,',,', mmmm nJUV

GGA-results:
Metallic behaviour/No bandgap
Fe-dn t2g states not splitted at EF
overestimated covalency between O-p and Fe-eg
Magnetic moments too small Experiment:
CO: 4.15/3.65 (for Tb), 3.82 (av. for Y)
VM: ~3.90 Calculation:
CO: 3.37/3.02
VM: 3.34
no significant charge order
charges of Fe2+ and Fe3+ sites nearly identical
CO phase less stable than VM
LDA/GGA NOT suited for this compound!
Fe-eg t2g eg* t2g eg

DOS: GGA+U vs. GGA
GGA+U GGAinsulator, t2g band splits metallic single lower Hubbard-band in VM splits in CO with Fe3+ states lower than Fe2+
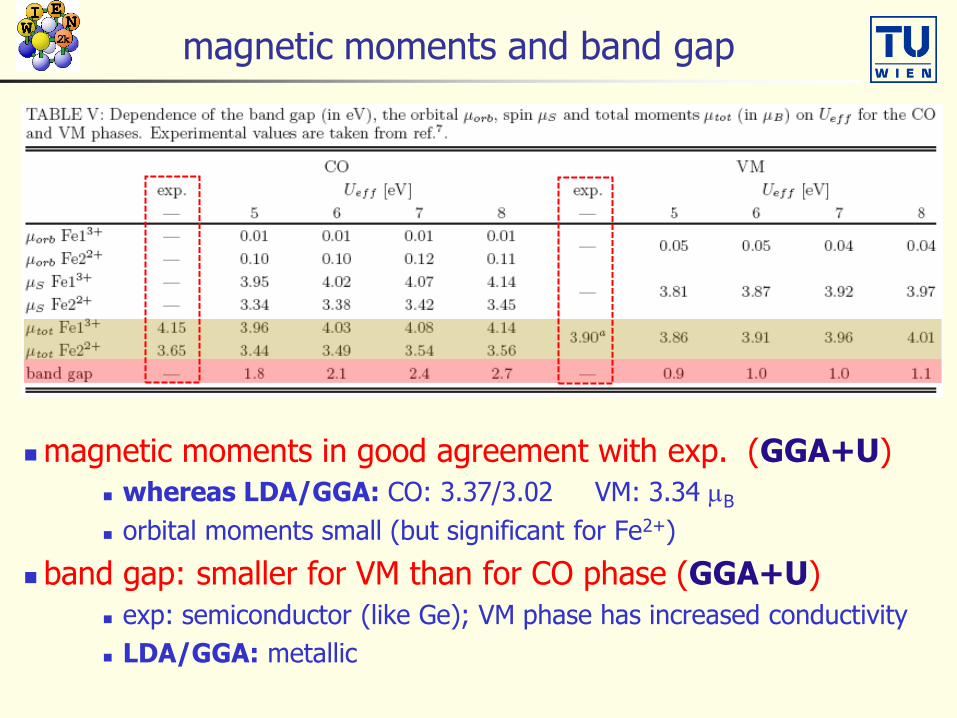
magnetic moments and band gap
magnetic moments in good agreement with exp. (GGA+U)
whereas LDA/GGA: CO: 3.37/3.02 VM: 3.34 mB
orbital moments small (but significant for Fe2+)
band gap: smaller for VM than for CO phase (GGA+U)
exp: semiconductor (like Ge); VM phase has increased conductivity
LDA/GGA: metallic

Charge transfer
Charges according to Baders “Atoms in Molecules” theory
Define an “atom” as region within a zero flux surface
Integrate charge inside this region
0 n
r
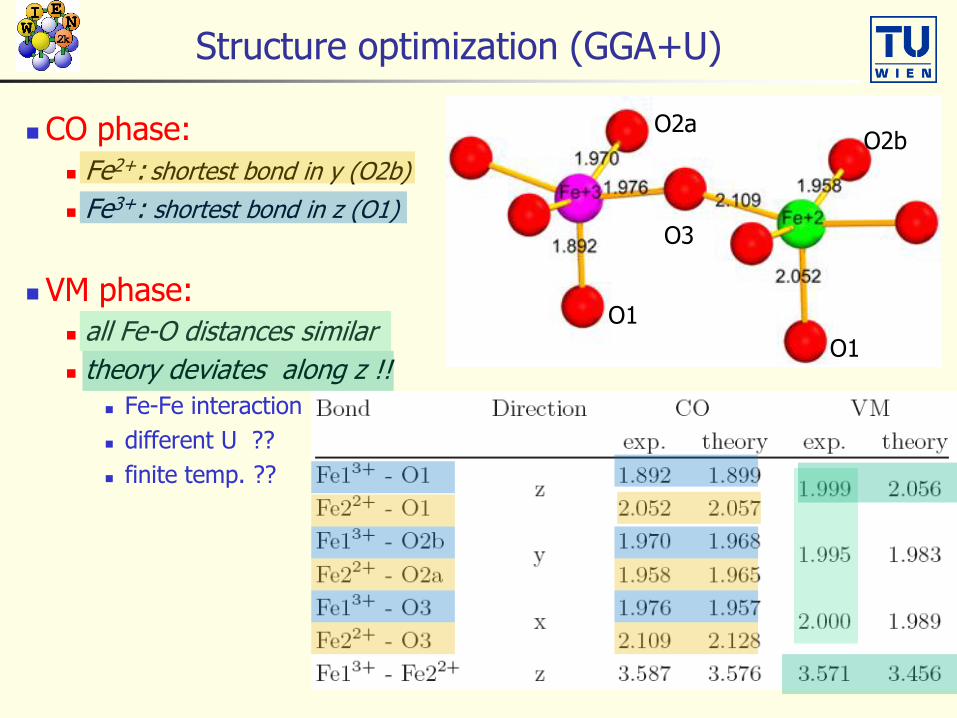
Structure optimization (GGA+U)
CO phase:
Fe2+: shortest bond in y (O2b)
Fe3+: shortest bond in z (O1)
VM phase:
all Fe-O distances similar
theory deviates along z !!
Fe-Fe interaction
different U ??
finite temp. ??
O1
O1
O2aO2b
O3

Can we understand these changes ?
Fe2+ (3d6) CO Fe3+ (3d5) VM Fe2.5+ (3d5.5)
majority-spin fully occupied
strong covalency effects very localized states at lower energy than Fe2+
in eg and d-xz orbitals
minority-spin states
d-xz fully occupied (localized) empty d-z2 partly occupied
short bond in y short bond in z (one O missing) FM Fe-Fe; distances in z ??
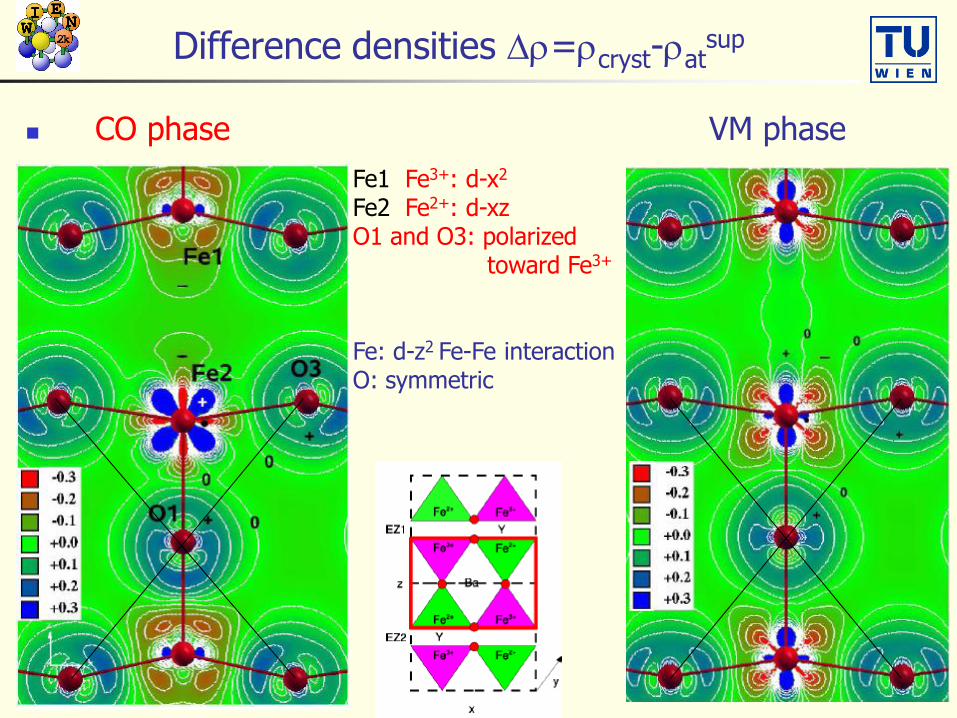
Difference densities Dr=rcryst-ratsup
CO phase VM phase
Fe1 Fe3+: d-x2
Fe2 Fe2+: d-xzO1 and O3: polarized
toward Fe3+
Fe: d-z2 Fe-Fe interactionO: symmetric

dxz spin density (rup-rdn) of CO phase
Fe3+:(Fe1) no contribution
Fe2+:(Fe2) dxz
weak p-bond with
O tilting of O3 p-orbital

Mössbauer spectroscopyIsomer shift: charge transfer too small in LDA/GGAHyperfine fields: Fe2+ has large Borb and BdipEFG: Fe2+ has too small anisotropy in LDA/GGA
CO
VM

magnetic interactions
CO phase:
magneto-crystalline anisotropy:
moments point into y-direction
in agreement with exp.
experimental G-type AFM structure (AFM direct Fe-Fe exchange) is
8.6 meV/f.u. more stable than the
magnetic VM phase (direct FM)
VM phase:
experimental “FM across Y-layer”
AFM structure (FM direct Fe-Fe exchange)
is 24 meV/f.u. more stable than magnetic
order of CO phase (G-type AFM)
direction [hkl] energy [Ry]
[100] -115.578,24026
[010] -115.578,24065
[001] -115.578,24024

Verwey transition in YBaFe2O5
Standard LDA/GGA methods cannot explain YBaFe2O5
metallic, no charge order (Fe2+-Fe3+), too small moments
Needs proper description of the Fe 3d electrons (GGA+U, …)
CO-phase: Fe2+: high-spin d6, occupation of a single spin-dn orbital (dxz)
Fe2+/Fe3+ ordered in chains along b,
cooperative Jahn-Teller distortion and strong e--lattice coupling
VM phase: small orthorhombic distortion (AFM order, moments along b)
Fe d-z2 spin-down orbital partly occupied (top of the valence bands)
leads to direct Fe-Fe exchange across Y-layer
and thus to ferromagnetic order (AFM in CO phase).
Quantitative interpretation of the Mössbauer data
C.Spiel, P.Blaha, K.Schwarz, Phys.Rev.B.79, 085104 (2009)
N
N
N
B
B
B H
HH
H
H H
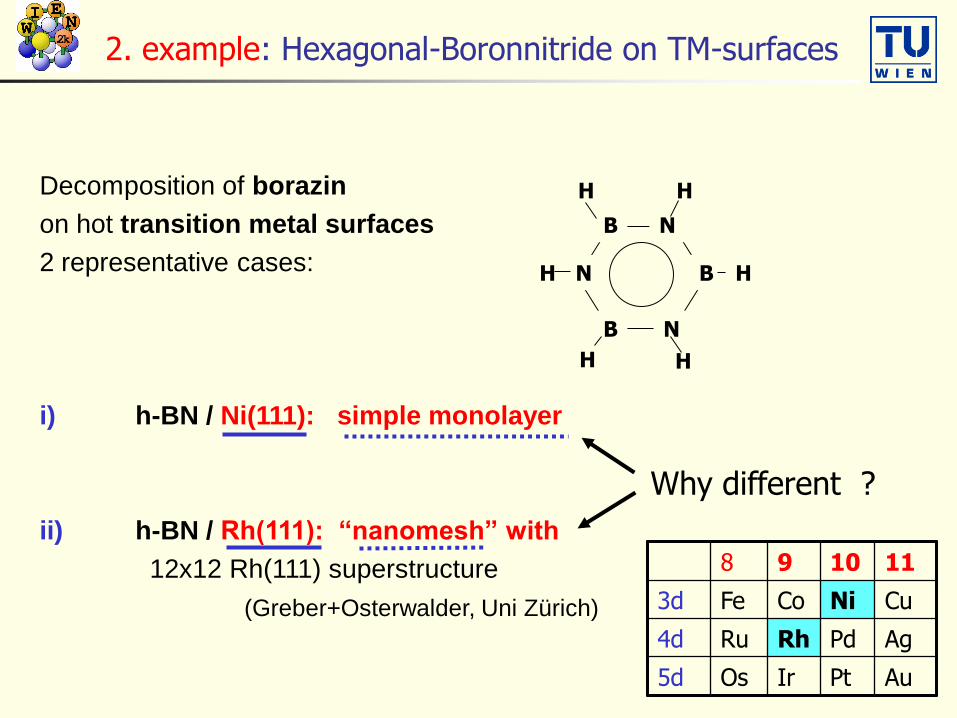
Decomposition of borazin
on hot transition metal surfaces
2 representative cases:
i) h-BN / Ni(111): simple monolayer
ii) h-BN / Rh(111): “nanomesh” with
12x12 Rh(111) superstructure
(Greber+Osterwalder, Uni Zürich)
2. example: Hexagonal-Boronnitride on TM-surfaces
Why different ?
8 9 10 11
3d Fe Co Ni Cu
4d Ru Rh Pd Ag
5d Os Ir Pt Au

h-BN on transition metal-surfaces
thermal decomposition of borazine (HBNH)3
on hot TM metal surfaces (~1000K)
forms simple (1x1) or very complex structures
- as seen by STM
h-BN/Ni(111) 0.25 nm h-BN/Rh(111) 3.2 nm
C60 decoration

Strain energy of BN on TM(111)
Lattice mismatch
0.5eV/BN

Geometric structure of h-BN/Ni(111)
N occupies the „top“ site
„buckling“ of BN:
exp. 2.04/2.19 (0.07) Å
theory 2.09/2.19 (0.10) Å
BN-layer spacing in pure h-BN: 3.33 Å
G.Grad, P.Blaha, K.Schwarz W.Auwärter, T.Greber, Phys.Rev. B 68, 085404 (2003)
Hexagonal boronnitride grown epitaxially on a Ni(111) surface
Modelling of the h-BN/Ni(111) interface by a slab-supercell
fcc Ni has (ABCABC…) stacking
N and B atoms can occupy „top“, „hcp“ or „fcc“ sites
hcp
fcc
A
B
C
A
B N
A
B
C

Theoretical Method
WIEN2k (APW+lo method)
• DFT simulation
• Surface simulated with
3-d periodic system
BN
7 layer-Ni
BN
Ni
N
B

Possible positions of B and N on Ni(111):
Only N on „top“ of Ni gives stable structures
(top,fcc) by only 9 meV/BN more stable than (top,hcp)
NiNB
NBfcc
hcp
top
B
N
top

STM-data of h-BN/Ni(111)
Exp: three different sites are visible. Which site is dark? Which white ?
)()(2
0 Ft EErI Electron densities at EF +/- 0.08eVr0: 2.5 Å from surface
Ni(111)
h-BN/Ni(111)
Ni
N
fcc
hcp
B
hcp
N
Bhcp

Work function W (001) surface
potential
bulk
Surface
EF
Work
function
Vacuum
supercell

Workfunction shift:
Intensity drop!
workfunction:
Ni h-BN/Ni
5.3 3.5 eV exp.
5.6 3.9 eV theory
charge transfer(Bader„s AIM method):
N B Ni
free h-BN-l: -0.56 +0.56 e-
h-BN/Ni: -0.59 +0.65 -0.06
electrostatic picture with 1 Å charge separation 2eV shift
additional 0.06e should fill Ni-dn states: smaller moment

Magnetic moments (19 Ni-layers):
pure Ni(111) surface:
surface moments enlarged(localization)
Friedel oszillations
„Bulk“ value reached
h-BN/Ni(111) surface:
surface moments reduceddue to charge transfer from B to Ni-dn
Friedel oszillations
„bulk“ value not reached

XAS: X-ray absorption spectra
ℓ-like PDOS (atom A)
Δℓ = ± 1dipole-section rule
energy conservation
Radial transition probability:
• from a core state with q.n. n´ℓ´on
atom A
• to an ℓ-like conduction band state
inside the atomic sphere A
• within the dipole approximation
dipole operator
Final state effects:supercell with (partial) core holeon one of the atoms

Angle dependency of B-K edge in h-BN/Ni(111)
aaaB-pxy
B-pz
B-p

Boron nitride on Rh(111)

h-BN on Rh(111)
“lattice mismatch leads to two
incomplete BN layers which form a
nanomesh”
M.Corso, W.Auwärter, M.Muntwiller, A.Tamai, T.Greber:Science, 303, 217 (2004)
STM
12x12 Rh13x13 h-BN
covered with C60

Rh 0 (top)
Rh -2 (fcc) Rh -1 (hcp)
BN
Relative position of BN w.r.t. Rh(111)
A typical atomic configuration
N
N
N
N
N
Lattice mismatch:13 x 13 BN12 x 12 Rh

What binds BN to Rh ?
BN at (fcc,top) position:
repulsive N-forces
attractive B forces dominate
BN at (hcp,fcc) position:
repulsive N-forces dominate attractive B-forces
Rh
N BNB
top
NB
top
hcp
fcc

Rh – B, N interactions
B pz
N pzRh dz2
EF
Rh-B antibonding stateabove EF
Rh-N antibondingstate below EF
schematic bonding diagram
I
I
II
II
III
III

Force field for h-BN/Rh(111)
separate BN-Rh from B-N interaction
freeze Rh underlayer
Rh(111)-N,B interactionab-initio calculated force field
FN,B = FN,B(x,y,z)
• stretched h-BN in 1x1 geometry• stretching has minor influence
on forces
elastic h-BNrestoring force, elastic model
Fr = ks.ds + kb.db
response to stretching and buckling deformations
12x12 Rh supercell13x13 h-BN supercell
geometry optimization

Single h-BN layer on Rh(111)
R.Laskowski, P.Blaha, Th.Gallauner, K.Schwarz,Single layer model of the h-BN nanomesh on the Rh(111) surface
Phys.Rev.Lett. 98, 106802 (2007)
3 nm
13 x 13 BN
12 x 12 Rh
Å

h-BN layer on Rh(111)
R.Laskowski, P.Blaha, Th.Gallauner, K.Schwarz,Single layer model of the h-BN nanomesh on the Rh(111) surface
Phys.Rev.Lett. 98, 106802 (2007)
3 nm
N-low
N-high
B-low
B-high
Rh
“low”: N on “top”“high”: “top” empty
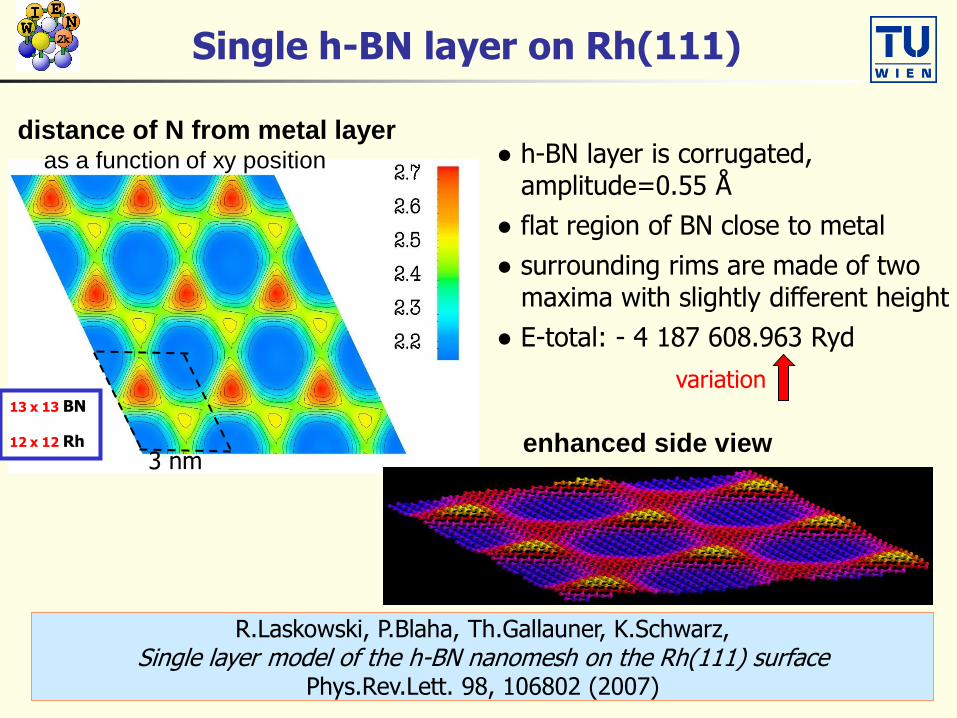
Single h-BN layer on Rh(111)
R.Laskowski, P.Blaha, Th.Gallauner, K.Schwarz,Single layer model of the h-BN nanomesh on the Rh(111) surface
Phys.Rev.Lett. 98, 106802 (2007)
3 nm
13 x 13 BN
12 x 12 Rh
distance of N from metal layeras a function of xy position ● h-BN layer is corrugated,
amplitude=0.55 Å
● flat region of BN close to metal
● surrounding rims are made of twomaxima with slightly different height
● E-total: - 4 187 608.963 Ryd
enhanced side view
variation

Force field vs. WIEN2k
3 layers Rh, h-BN on the both sides of the slab (inversion symmetry)
12x12 Rh, 13x13 h-BN per layer (1108 atoms in the unit cell)
Hamiltonian size ~50000 metallic system !
64 proc (Xeons), 2h per SCF iteration, 30 iterations/scf
challenge for WIEN2k
N-metal layer distance Wien2kForce field
R.Laskowski, P.Blaha: Unraveling the structure of the h-BN/ Rh(111) nanomesh by ab-initio calculationsJ.Phys.Cond.Mat 20, 064207 (2008)

Comparing STM images (Tersov-Hamann)
+0.07V: Preobrajenski et al. PRB 75, 245412-2V: Goriachko et al., Langmuir 2007, 23, 2928
WIEN2k: -2 eV, 2A above surface WIEN2k: + 2eV, 3A above surface
“high” atoms have large DOS and highdensity
“low” atoms have large DOS and highdensity
EF

single layer model of the h-BN/Rh(111) nanomesh
single continuous BN layer: 13x13 BN on top of 12x12 Rh(111)
DFT simulation:quite heavy: 3 layers TM + BN: 1108 atoms/cell (metal !)
WIEN2k (all electron APW+lo full-potential calculations) Hamiltonian size ~50000-70000 (50-100 GB memory)
64 proc (Xeons), 2h per SCF iteration, 30 iterations/scf
full structural optimization

3. Example: Misfit layer compound
Structure (model) (PbS)1.14TaS2
of misfit layer compounds (MFLC)
Mechanisms of stabilization
predicted by experiment
Computer simulations Evgeniya Kabliman
E. Kabliman, P. Blaha, K. Schwarz,Ab initio study of stabilization of the misfit layer coumpund (PbS)1.14TaS2
Phys.Rev.B 82, 125308 (2010)

x
y
z
The misfit layer compounds (MFLC)
Transition metal dichalcogenides (TMDCs )
Cubic monochalcogenides(MCs)
InterestTMDCs – superconductivity and
possibility of intercalating foreign atoms
and molecules as well as double layers
of cubic semiconductors MX.
hexagonal structure cubic structure
Misfit : x = ((2aTaS2/aPbS)-1)
x
z
y
x
z
y
TaS2 PbS

The misfit layer compounds (MFLC)
(MX)1+x(TX2)m
M = a metal atom Sn, Pb, Bi, Sb
or rare-earth one ;
X = a chalcogen atom S or Se ;
T = a transition metal atom Ti, V, Cr,
Nb or Ta ;
m = number of TX2 layers between
two MX layers ;
m = (1,2,3) ;
x = ((2aTX2/aMX)-1) ; - parameter of misfit!
0.08 < x < 0.26 .
Commensurate model of MFLC
structure is needed
Resonable numbers of MX and TX2 unit cells

The misfit layer compound PbS1.14TaS2U
nit c
ell
= 7
4ato
ms in 1
9 W
yck. P
os.
Incommesurability in (PbS)1.14TaS2 is modeled by
“ideal” commensurate periodic structure: 7 aTaS2= 4 aPbS
Figure 1. The conventional unit cell (a periodic
structure containing 4 PbS and 7 TaS2 unit cells in
the incommensurate direction) of the stoichiometric
(PbS)1.14TaS2 with relaxed “ideal” structure.
Incommensurate ”misfit” direction
1+x = 8/7 = 1.14

Method
DFT
FP-LAPW+lo
GGA (Wu Cohen 2006)
• R (Pb) = 2.80 a.u. ;
R (Ta) = 2.13 a.u. ;
R (S) = 2.07 a.u. ;
• RminKmax = 7.0 (plane wave basis set cutoff) ;
• Nk up to 2x2x5.
DFT simulation
Formation energy
WHAT stabilizes
misfit layer compounds ?
Eform ≈ 0 Ryfor stoichiometric (PbS)1.14TaS2
with relaxed “ideal” structure
!
„Ideal“ structure optimization

The misfit layer compound PbS1.14TaS2
Two mechanisms of stabilization
predicted by experiment :
1. Nonstoichiometry [1] – a systematic
cationic substitution of M ions by T
atoms within the MX layer (necessary
condition).
2. Metal cross substitution [2] –
interchange of Pb and Ta atoms in the
PbS and TaS2 layers and
nonstoichiometry is not a necessary
condition.Figure 2a The conventional unit cell of the stoichiometric
(PbS)1.14TaS2 compound with the lowest energy with a
metal (Pb,Ta) cross substitution at a fairly small distance
between the exchanged atoms.
?!
Can theory find
the mechanism of stabilization.
for MFLC ?[1] Y. Moëlo et al. Chem. Mat. 7, 1759 (1995)
[2] M. Kalläne et al. PRL 100, 065502 (2008)
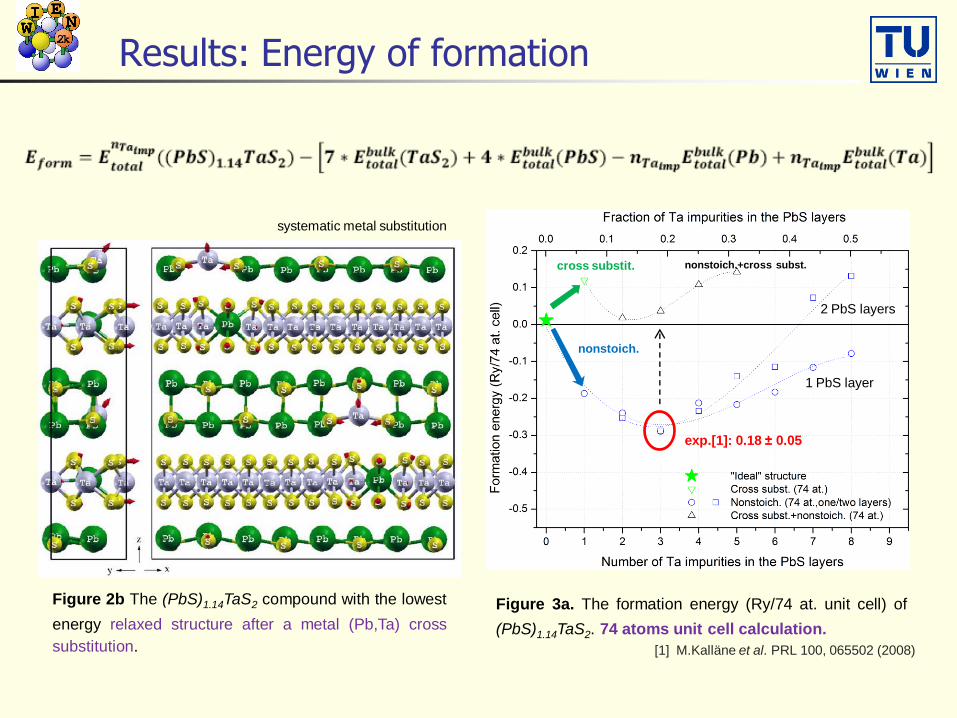
Results: Energy of formation
Figure 3a. The formation energy (Ry/74 at. unit cell) of
(PbS)1.14TaS2. 74 atoms unit cell calculation.
Figure 2b The (PbS)1.14TaS2 compound with the lowest
energy relaxed structure after a metal (Pb,Ta) cross
substitution.
1 PbS layer
2 PbS layers
exp.[1]: 0.18 ± 0.05
[1] M.Kalläne et al. PRL 100, 065502 (2008)
systematic metal substitution
cross substit.
nonstoich.
nonstoich.+cross subst.

From 74 to 296 atoms per unit cell
(74 at. unit cell) x 4 296 atoms unit cell
Mechanism of stabilization of the misfit layer compound (PbS)1.14TaS2
z
x single metal substitution breaks the symmetryy

Results: Energy of formation
Stabilization of 0.4 Ry / 74 atoms
cells for nTaimp=0.13-0.19 in a good
agreement with experiment.
Nonstoichiometry (Ta substitution in
the pseudocubic PbS layers) is
necessary condition for the
stabilization of the (PbS)1.14TaS2
misfit layer compound.
Pb impurities in the TaS2 layer are
also possible due to high T and non-
equillibrium conditions during the
growth of these materials. Figure 3b. The formation energy (Ry/74 at. unit cell) of
(PbS)1.14TaS2. 74 and 296 atoms unit cell calculations.
74 at.
296 at.
no cluster formation
for Ta impurities in
PbS layerseveral
struct-s
cross subst.
nonstoich.
nonstoich.+cross subst.

PbS PbS layer
(ideal)
TaS2
(ideal)
TaS2 layer
(exch.)
Pb – S 2.957 2.74(z), 2.92(xy)
3.24 – 3.29a
- 2.69 – 2.76
Pb – Pb 4.182 4.05 – 4.22 - -
Ta – S - - 2.46 - 2.47 2.44 – 2.50
Ta – Ta - - 3.32 - 3.33 3.15b – 3.60
Results: Structure deformation
aPb(PbS) – S(TaS2 ); bPb(exch) is nn-neighbour
“Breathing” of theTaS2 layer:
Pb impurities change distances only to next
nearest neighbours
no change
Change of atomic distances (Å) due to metal
cross substitution and nonstoichiometry
nonstoichiometry + metal cross substitution

Results: Structure deformation
aPb(PbS) – S(TaS2 )
Change of atomic distances (Å) due to metal
cross substitution and nonstoichiometry
TaS2 PbS layer
(ideal)
TaS2
(ideal)
PbS layer
(exch.)
Pb – S - 2.74(z), 2.92(xy)
3.24 – 3.29a
- 2.74 – 3.04
3.07 – 3.71a
Pb – Pb - 4.05 – 4.22 - 3.79 – 4.39
Ta – S 2.467 - 2.46 - 2.47 2.26 – 2.46
Ta – Ta 3.297 - 3.32 - 3.33 -
change
Large distortion of PbS layer :
Ta impurities significantly change the interatomic
distances
nonstoichiometry + metal cross substitution

Results: Density of states
The parent compounds The „ideal“ (PbS)1.14TaS2
Charge transfer from PbS layer to TaS2 layer
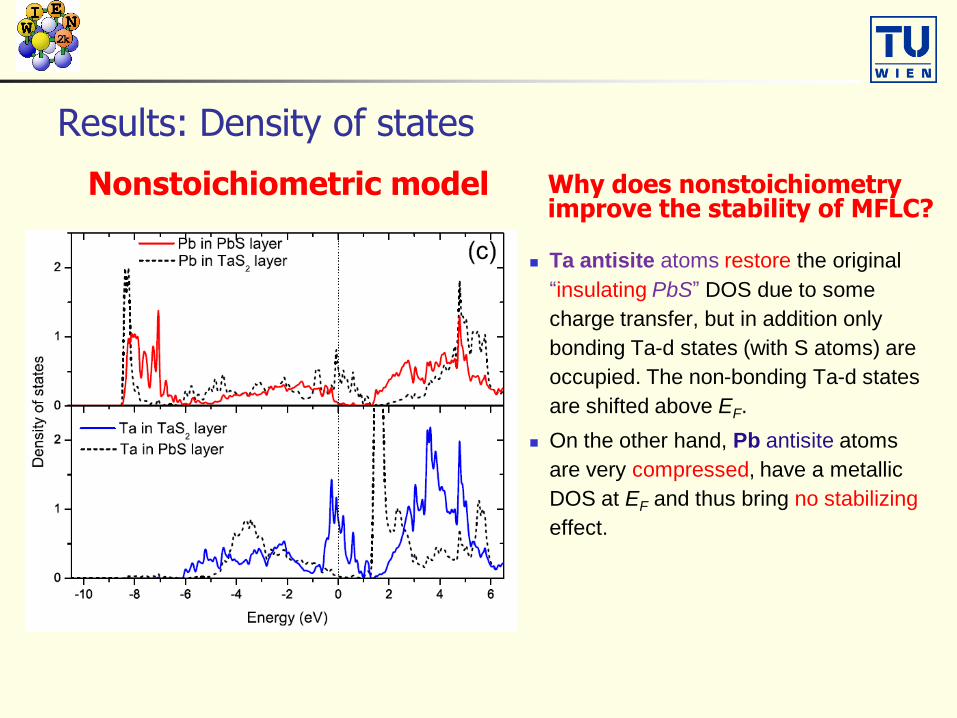
Results: Density of states
Nonstoichiometric model Why does nonstoichiometryimprove the stability of MFLC?
Ta antisite atoms restore the original
“insulating PbS” DOS due to some
charge transfer, but in addition only
bonding Ta-d states (with S atoms) are
occupied. The non-bonding Ta-d states
are shifted above EF.
On the other hand, Pb antisite atoms
are very compressed, have a metallic
DOS at EF and thus bring no stabilizing
effect.
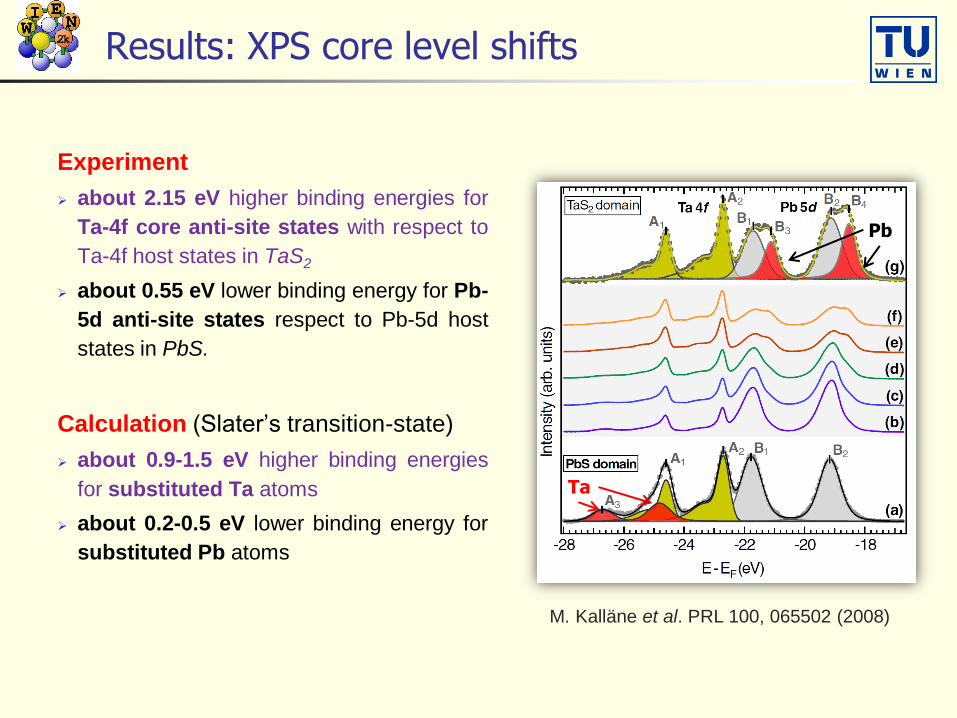
Results: XPS core level shifts
Experiment
about 2.15 eV higher binding energies for
Ta-4f core anti-site states with respect to
Ta-4f host states in TaS2
about 0.55 eV lower binding energy for Pb-
5d anti-site states respect to Pb-5d host
states in PbS.
Calculation (Slater’s transition-state)
about 0.9-1.5 eV higher binding energies
for substituted Ta atoms
about 0.2-0.5 eV lower binding energy for
substituted Pb atoms
M. Kalläne et al. PRL 100, 065502 (2008)
Ta
Pb

Mechanisms of stabilization of (PbS)1.14TaS2
The metal (Pb,Ta) cross substitution can not stabilize the (PbS)1.14TaS2
compound according to the calculated formation energies.
The nonstoichiometric model (Ta atoms substitute Pb in the PbS layer) has a
strong stabilizing effect and thus must be the stabilizing mechanism in the misfit
layer compounds.
The most stable structure for an impurity concentration around nTaimp= 0.15 in
very good agreement with experimental estimates.
Pb impurities in the TaS2 layer are also possible due to high temperature and non-
equilibrium conditions during the growth of these materials.
Large distortions of the flexible PbS layers, when “small” Ta atoms are
incorporated, but only a “breathing” , when Pb substitutes Ta in TaS2.
The stabilizing effect can be explained by analyzing the DOS and the related
charge transfer.
The calculated XPS core level shifts are in fairly good agreement with
experiments.

Summary
DFT simulations with Wien2k
Atomic structure
Electronic structure
Properties
Relative stability (relaxations)
Electron (spin) densities
Magnetic order
Spectra
Comparison between theory and experiment
Systems Verwey transition (charged ordered vs. valence mixed) YFeBa2O5,
Nanomesh: h-BN/Rh(111),
misfit layer compound (PbS)1.14TaS2

Thank you for
your attention !

Computational aspects

Increase in system size• WIEN2k (APW+lo method)
• Surfaces simulated with 3D-periodic slab geometry• unit cells with 1108 atoms (nanomesh),
very expensive (matrix size: 50000x50000)64 Xeons, 100 Gb memory, 3 days/geometry)
• Scaling from 1 atom/unit cell to 1000 atoms/u.c.
atoms matrix size (N) memory (N2) computer time (N3)
• 1 N=50• 1000 N=50000 x 106 x 109
Rh
BN

Aurora Cluster IBM e1350
72 x Dual Xeon
3.6 GHz, 1MB L2
FiberChannel Storage
14 x 146GB-FC
Infiniband Switch
4 x SMC with 24 Gigabit-Ports

h-BN / Rh(111) nanomesh
STM Experiment: M.Corso et al., Science 303, 217(2004) “partial double layer model”
Theory: R.Laskowski et al., PRL 98, 106802 (2007): “Corrugated single layer model”
N corrugation
12x12 Rh, 13x13 BN, 1108 atoms/cell,
HC=ESC (50000x50000, 50 GB memory)64 cpus, 2h/scf-cycle (was 20h!!)3 month of computing time
Theoretical model was confirmed later !
H. Dill, et. al.: Science 319, S. 1824(2008)

The breathing mode in BaBiO3 (perovskite)
Disproportionation
2 Bi4+ Bi3+ + Bi5+
the oxygen can be
closer to Bi5+ (small octahedron, blue)
than to Bi3+ (large octahedron, yellow)
P.Blaha, K.Schwarz, Ph.Dufek. G.Vielsack, W.Weber:Z.Naturforsch. 48a, 129 (1993)
Frozen phonon calculation
Etot=-119 603.624 Ryd
------
Ba1-xKxBiO3
superconductor
1 mRyd Bi5+
Bi3+