large-scale study on realization and application of … · large-scale study on realization and...
TRANSCRIPT

__________________________________________________________
Executive Summary
Large-Scale Study on Realization and
Application of SANI® Process in
Sewage Treatment in Hong Kong
Prepared by
The Hong Kong University of Science And Technology
September 2015
RD2079 Demonstration-scale trial of SANI process in Shatin Sewage Treatment Works

2 RD2079 Demonstration-scale trial of SANI process (Executive Summary)
Introduction
Hong Kong has used seawater for toilet flushing (SWTF) since 1950s resulting in a considerable
reduction in portable water demand. To extend and integrate the benefit of SWTF practice, the
Hong Kong University of Science and Technology (HKUST) developed an innovative biological
organic carbon and nitrogen removal process for treatment of saline sewage produced from SWTF,
which is named “Sulfate Reduction, Autotrophic Denitrification and Nitrification Integrated
process (SANI® process)”, as depicted in Exhibit 1 below.
EXHIBIT 1
The SANI® process consists of two reactors: Sulfate Reducing Upflow Sludge Bed (SRUSB)
reactor followed by a second Biofilm reactor with anoxic zone(s) and aerobic zone(s). The

3 RD2079 Demonstration-scale trial of SANI process (Executive Summary)
SRUSB reactor is designed to make use of sulfate (originating from seawater) in the sewage for
oxidation of organic carbon into carbon dioxide (dissoves as bicarbonate) and production of
dissolved sulfide by sulfate reduction bacteria under anaerobic conditions. In the second Biofilm
reactor, the anoxic zone(s) is designed for autotrophic denitrification of nitrate with dissolved
sulfide produced in SRUSB reactor to produce harmless nitrogen gas through oxidation of sulfide
back to sulfate ion and the aerobic zone(s) is to nitrify ammonia to nitrate, which is recirculated to
the anoxic zone for denitrification. Since all three biochemical reactions involved in the SANI®
process have very low sludge yield, the sludge production rate is much less than that produced by
conventional secondary biological treatment. It effectively reduces the costs, energy and space for
sludge handling and disposal.
With the support from the Innovation and Technology Fund and the Drainage Services Department
(DSD), a 1,000 m3/day SANI demo-plant study on saline sewage treatment on the application of
SANI® process commenced on 18 March 2013 for a period of 2 years at Shatin Sewage Treatment
Works (STSTWs) as depicted in Exhibit 2 below.
EXHIBIT 2

4 RD2079 Demonstration-scale trial of SANI process (Executive Summary)
Objectives
The major objectives of this study are:
To develop a set of full-scale SANI sewage treatment plant design criteria, in particular
process design, reactor design and hydraulic flow conditions;
To develop a mathematical SANI® process model for optimization of full-scale applications;
To gain extensive operation know-how of the SANI® process and the sulfate-reducing
bacteria (SRB) granular sludge reactor; and
To demonstrate and confirm the plant performance, sludge reduction efficiency and saving
on costs, space and energy.
Key Tasks and Programme
Since commencement in March 2013, the key tasks untaken in this study include:
Pilot plant studies, comprising reactor design, site selection and investigation, environmental
review, contract administration, procurement, construction, supervision, optimization studies,
data analyses, and reporting; and
Process wastewater quality monitoring including performance tests of process trains;
compliance tests of discharge effluent quality. All sampling, preservation and testing of
samples, shall be carried out in accordance with Standard Methods for Examination of Water
and Wastewater published by American Public Health Association (Standard Methods) or
other testing methods approved by the Engineer.
5 RD2079 Demonstration-scale trial of SANI process (Executive Summary)
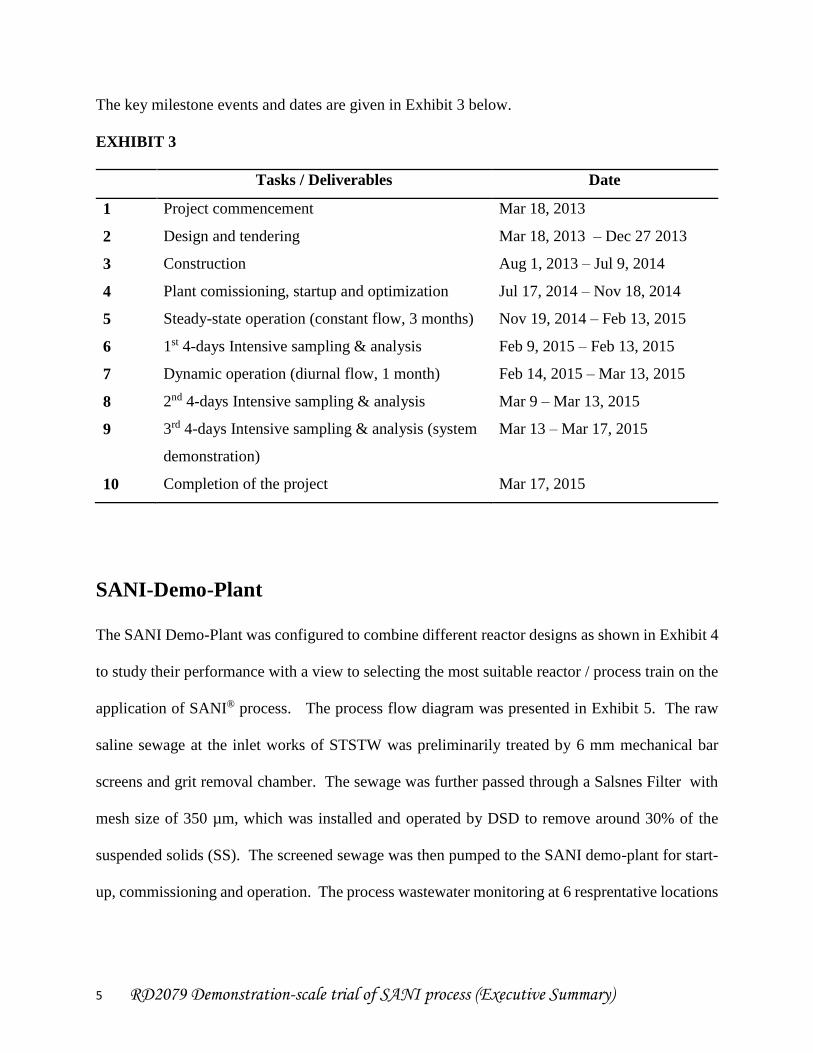
The key milestone events and dates are given in Exhibit 3 below.
EXHIBIT 3
Tasks / Deliverables Date
1 Project commencement Mar 18, 2013
2 Design and tendering Mar 18, 2013 – Dec 27 2013
3 Construction Aug 1, 2013 – Jul 9, 2014
4 Plant comissioning, startup and optimization Jul 17, 2014 – Nov 18, 2014
5 Steady-state operation (constant flow, 3 months) Nov 19, 2014 – Feb 13, 2015
6 1st 4-days Intensive sampling & analysis Feb 9, 2015 – Feb 13, 2015
7 Dynamic operation (diurnal flow, 1 month) Feb 14, 2015 – Mar 13, 2015
8 2nd 4-days Intensive sampling & analysis Mar 9 – Mar 13, 2015
9 3rd 4-days Intensive sampling & analysis (system
demonstration)
Mar 13 – Mar 17, 2015
10 Completion of the project Mar 17, 2015
SANI-Demo-Plant
The SANI Demo-Plant was configured to combine different reactor designs as shown in Exhibit 4
to study their performance with a view to selecting the most suitable reactor / process train on the
application of SANI® process. The process flow diagram was presented in Exhibit 5. The raw
saline sewage at the inlet works of STSTW was preliminarily treated by 6 mm mechanical bar
screens and grit removal chamber. The sewage was further passed through a Salsnes Filter with
mesh size of 350 µm, which was installed and operated by DSD to remove around 30% of the
suspended solids (SS). The screened sewage was then pumped to the SANI demo-plant for start-
up, commissioning and operation. The process wastewater monitoring at 6 resprentative locations

6 RD2079 Demonstration-scale trial of SANI process (Executive Summary)
(namely S1-S6) were conducted to monitor the performance of the SANI Demo-Plant. The
number of sampling points for monitoring depends on the type of process train adopted.
EXHIBIT 4
Stage Biological Reactors / Process
Trains
Reactor Size
Stage A
(Organic carbon
removal)
(1) Flocculent-sludge based SRUSB
reactors (FS-SRUSB)
Diameter: 3.5 m
Height: 5 m
(2) Granular-sludge based SRUSB
reactor (GS-SRUSB)
Diameter: 3.5 m
Height: 5 m
Stage B
(Nitrogen removal)
(3) Submerged Anoxic/aerobic Filter
(SAF) reactors
8 m (W) x 7m (L) x 4 m (D)
(4) Moving Bed Biofilm Reactor
(MBBR)
8 m (W) x 7m (L) x 4 m (D)
Process Train
(1) SRUSB reactor + SAF reactor
(2a) SRUSB reactor + MBBR
(2b) SRUSB reactor + MBBR + Post Treatment1
1. Post treatment is a pilot-scale tank to treat 25 m3/d of MBBR effluent as a demonstration of final clarification and
phosphorus removal.

7 RD2079 Demonstration-scale trial of SANI process (Executive Summary)
EXHIBIT 5
: Sampling Points
Technical Performance and Findings
Start-up / Commissioning of the Reactors
SRUSB reactors were seeded with anaerobic digester sludge while SAF and MBBR reactors were
seeded with activated sludge. After sludge seeding, the SANI demo-plant was started-up with the
fine screened sewage. The parameters, namely COD, SS, pH, alkalinity, ammonia, nitrate, sulfate,
and sulfide concentrations in the influent and effluent of all reactors, and reactor biomass (MLSS
and MLVSS) concentrations in the reactors were monitored weekly during the start-up period.
Upon confirmation of satisfactory treatment of the sewage, the reactor loading was increased
S2 S3 S4
S5
S6
S
S1

8 RD2079 Demonstration-scale trial of SANI process (Executive Summary)
gradually based on a stepwise approach to the design flow rate of 1000 m3/d in 4 months. The
average operating sewage temperature was 29 oC during the commissioning.
During the commissioning period, 4 SRUSB reactors were operated as the main reactors. The
HRT of the SRUSB reactors were gradually reduced to 4.5 h while the OLR was gradually
increased to 1.7 - 2 kg COD/m3/d. The 4 SRUSB reactors were operated in the form of flocculent-
sludge (FS). At the end of the commissioning period, the average organic carbon and TSS removal
rate were 71 ± 11.5 % and 70 ± 13.6 %, respectively.
In respect of 2 types of Biofilm reactors, the performance of SAF reactor and MBBR were found
to be different. For SAF reactor, it was operated smoothly for 1 month at about 200 m3/d with
HRT of 25 h and the effluent ammonia nitrogen level was below 2 mg N/L. Then the performance
of the BAF reactor deteriorated afterwards, with a very high level of ammonia nitrogen in the
effluent. As a result, the SAF reactor was not operated after 2 months.
On the contrary, the loading rate of MBBR was gradually be increased to 800 m3/d with reduced
HRT to 7 h. The MBBR’s start-up was smooth and the effluent ammonia nitrogen level was
below 2 mg N/L. As a result of the promising results of the MBBR, the process train was
comprised of SRUSB reactor + MBBR, hereunder referred to “SRUSB-MBBR system”,was
selected for further tests on the application of the SANI® process. Due to limitation of pump and
pipework capacities, the maximum loading rate to MBBR was 800 m3/d and the maximum HRT
of the MBBR under test is 6.72 h.

9 RD2079 Demonstration-scale trial of SANI process (Executive Summary)
Steady-state and Diurnal Operation
After the commissioning period, the SRUSB-MBBR system comprising of 4 SRUSB reactors
(Total volume = 4 x 48 m3 = 192 m3) and 1 MBBR reactor (volume = 224 m3) was operated under
the constant flow of 800 m3/d with a total HRT of 12.5 h during Nov 19, 2014 – Feb 13, 2015.
The average sewage temperature was about 22 oC.
In order to investigate the effect of the diurnal variations of the flow and pollution loads, the
SRUSB-MBBR system was operated in a dynamic diurnal flow rate of 21 – 37.5 m3/h (equivalent
to 500 – 900 m3/d) with an overall HRT of 12.3 hr for 1 month. During this period, the SRUSB-
MBBR system consisted of 3 SRUSB reactors (total volume = 3 x 48 m3 = 144 m3) and 1 MBBR
(volume = 224 m3) while the sampling frequency remained the same as the steady state operation.
The average sewage temperature was about 22 oC.
As the effluent of the SRUSB-MBBR system had a moderate high TSS level, a post-treatment
plant with a HRT of 1h was added at the end of SRUSB-MBBR system for demonstration purpose.
A 4-day intensive sampling program with influent flow rate of 800 – 940 m3/d, and a total HRT of
12.2 h (including the post-treatment unit) was conducted. The average effluent TCOD, BOD5,
TSS, TN, NH4+-N and NOx-N levels were given in Exhibit 6 below and fully met the effluent
discharge limits.
EXHIBIT 6
Parameters SRUSB+MBBR
+Post Treatment
Effluent Discharge Standard
95 Percentile Annual Average Upper Limit

10 RD2079 Demonstration-scale trial of SANI process (Executive Summary)
TCOD (mg COD/L) 62 ± 43.5 - - -
BOD5 (mg BOD/L) 5.6 ± 1.8 20 - 40
TSS (mg SS/L) 18.9 ± 1.6 30 - 60
TN (mg N/L) 8.9 ± 1.95 - 20 35
NH4+-N (mg N/L) 0.43 ± 0.39 - 5 10
NOx-N (mg N/L) 7.53 ± 1.65 - - -
Sludge Production
During the operation period from 17 July 2014 to 17 March 2015, no de-sludging operation was
carried out while the sludge content in the SRUSB-MBBR system remained stable. The secondary
sludge generated daily was equal to that of sludge discharged to the effluent. As a result, the
average TSS level in the SRUSB-MBBR system effluent was 65 mg/L, and the secondary sludge
production rate was estimated to be around 2.17 ton sludge cake (at 30% solid content) per 10,000
m3 sewage treated (65 g /m3 / 30% x 10,000 m3 = 2.17 tonnes).
Development of Granular Sludge
The organic carbon removal performance by Granular Sludge (GS) is better than Flocculent Sludge
(FS) in SRUSB reactor. In this pilot trial, a GS-SRUSB reactor was designed to develop granules
under anaerobic conditions. The GS-SRUSB reactor was seeded with pre-cultured FS from FS-
SRUSB reactor. However, due to the late start-up of this reactor and the slow growth of the
anaerobic bacteria, the acclimation and granulation process of the GS-SRUSB reactor has not been
completed yet. Nevertheless, clear indication of granulation process, including an increase in size,
the sludge particular size distribution, and decrease in the SVI5/SVI30 ratio from 2.2 to 1.5 were

11 RD2079 Demonstration-scale trial of SANI process (Executive Summary)
observed after 2 months of GS development, and the microgranules under the microscope were
found.
Steady State Modeling
The steady state mathematical model was developed for the design and operation of the full scale
SANI® process. Based on the mass balance and steady state modeling, the biomass growth in
SRUSB-MBBR system is 0.05 g VSS/g COD (theoretical value), while the biomass growth in a
conventional activated sludge process is about 0.29 g VSS/g COD (theoretical value). This leads
to about 83% ([1-(0.05 g VSS/g COD)/(0.29 g VSS/g COD)] x 100%) reduction in biomass
production as compared with conventional activated sludge process and about 70 ± 5% ([1- (65
mg TSS SANI-bioreactor effluent/L – 20 mg TSSfinal effluent/L)/ (150~200 mg TSSCAS-bioreactor effluent/L – 20
mg TSSfinal effluent/L))*100%) reduction of total sludge in the bioreactors. Through the steady state
model simulation, COD removal capacity of SRUSB is found to be the critical factor governing
the sludge reduction and full scale SANI® process application.
Conclusion
After optimization and improvement on operation and maintenance of the process train comprising
of SRUSB+MBBR+Post Treatment Plant, the HRT was reduced from 31 h to 11.2~12.5 h and the
system performance fully met the effluent discharge limits. No de-sludge operation was carried
out during the pilot test. The SRUSB-MBBR system has a very low sludge production rate (2.17
tons of sludge cake/10,000 m3 sewage), in term of bioreactor. The bioreactor sludge reduction
was estimated to be 60 - 70% . Taking the benefits of the significant sludge reduction, the full

12 RD2079 Demonstration-scale trial of SANI process (Executive Summary)
scale SRUSB-MBBR system was estimated to save about 10 - 20 % of energy, space and capital
cost as compared with convential secondary biological treatment system.
Recommendations
Based on the optimization experience gained from this Pilot tests, the following recommendations
are proposed for future development on the application of SANI® process:-
The design data for FS-SRUSB reactor size (sewage temperature = 22 oC): (i) HRT of 3 – 4
h; and (ii) up-flow velocity of 1.3 - 1.7 m/h.
The design data for MBBR (sewage temperature = 22 oC): (i) nitrification rate - 1.0 g NH4-
N/m2/d ; (ii) denitrification rate - 1.2 g NOx-N/m2/d; and (iii) recycle ratio – 3 to 4.
The SRUSB-MBBR system should be equipped with automatic control equipment and on-
line monitors to optimize the operation and reduce the energy consumption.
The HRT and operating energy of the SRUSB-MBBR system could be improved further by
optimizing the reactor and system design.
Further development of granules under anaerobic conditions.