large scale visualization for hpc
TRANSCRIPT

Large Scale Visualizationfor HPC
Dieter KranzlmüllerLMU & LRZ
Munich, Germany
SOS13 - 13th Workshop onDistributed Supercomputing

Large Scale Remote Visualizationfor HPC and Grids
Dieter KranzlmüllerLMU & LRZ
Munich, Germany
SOS13 - 13th Workshop onDistributed Supercomputing

SOS13, Hilton Head, SC 3© 2009 Leibniz Supercomputing CentreBy Ernst A. Graf
The Leibniz Supercomputing Centreof the Bavarian Academy of Sciences and Humanities
• Computing Center forall Munich Universities
• Regional Computing Centerfor all Bavarian Universities
• National SupercomputingCenter of Germany

SOS13, Hilton Head, SC 4
Research Campus Garching
LRZ
SOS13, Hilton Head, SC 5
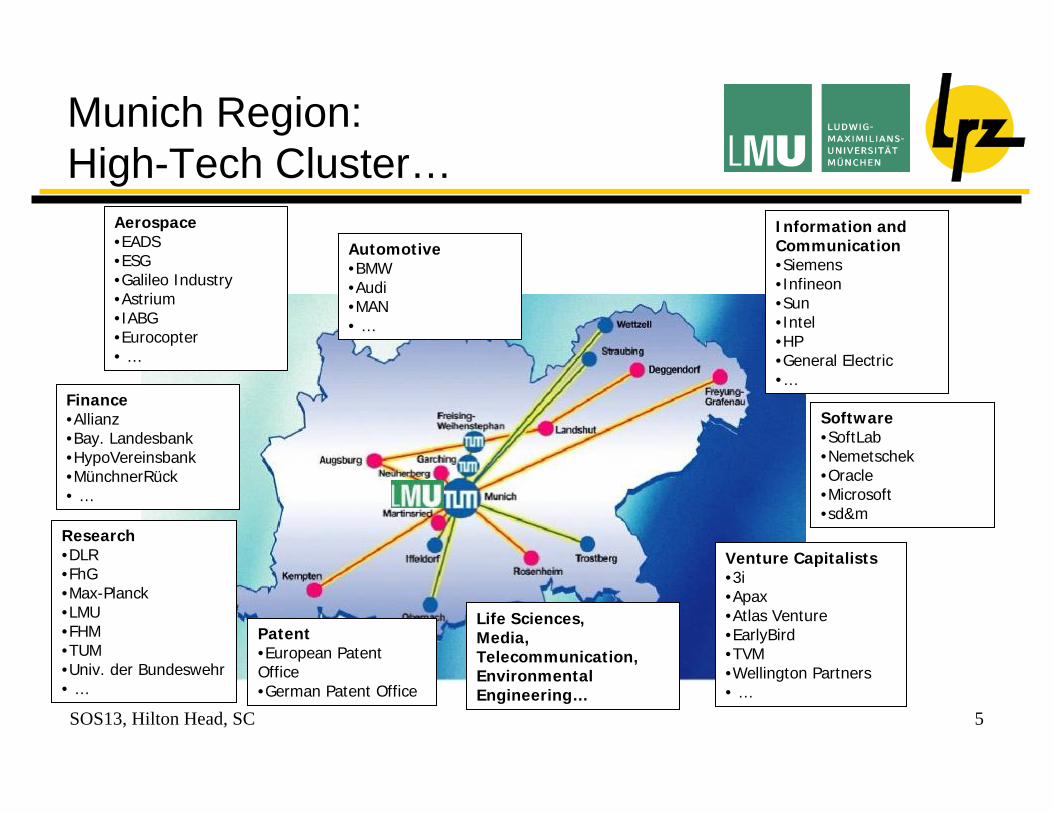
Munich Region: High-Tech Cluster…
Information andCommunication•Siemens•Infineon•Sun•Intel•HP•General Electric•…
Software•SoftLab•Nemetschek•Oracle•Microsoft•sd&m
Aerospace•EADS•ESG•Galileo Industry•Astrium•IABG•Eurocopter• …
Life Sciences, Media, Telecommunication,Environmental Engineering…
Finance•Allianz•Bay. Landesbank•HypoVereinsbank•MünchnerRück• …
Venture Capitalists•3i•Apax•Atlas Venture•EarlyBird•TVM•Wellington Partners• …
Research•DLR•FhG•Max-Planck•LMU•FHM•TUM•Univ. der Bundeswehr• …
Patent•European Patent Office•German Patent Office
Automotive•BMW•Audi•MAN• …

SOS13, Hilton Head, SC 6
HLRB-II: SGI Altix 4700
Foto Helmut Payer, produced by gsiCom

SOS13, Hilton Head, SC 7
267 Sites54 Countries114,000 CPUs20 PetaBytes>16000 Users>200 VOs>140,000 Jobs/Day Status January 2009: http://project.eu-egee.org/index.php?id=417

SOS13, Hilton Head, SC 8
Examples of Applications
• Computational Fluid Dynamics: Optimisation of turbines and wings, noise reduction, air conditioning in trains
• Fusion: Plasma in a future fusion reactor (ITER)• Astrophysics: Origin and evolution of stars and galaxies• Solid State Physics: Superconductivity, surface properties• Geophysics: Earth quake scenarios• Material Science: Semiconductors• Chemistry: Catalytic reactions• Medicine and Medical Engineering: Blood flow, aneurysms, air
conditioning of operating theatres• Biophysics: Properties of viruses, genome analysis• Climate research: Currents in oceans

SOS13, Hilton Head, SC 9
The Answer …
… to life, the universe, and everything?

SOS13, Hilton Head, SC 10
Example 1: CFD Simulation
• CATUM Simulation of water flow over a turbine blade
• CFD application (total: ~25% of CPU-time on HLRB-II)
• Steffen Schmidt, Matthias Thalhammer, Lehrstuhl fürGasdynamik, TUM

SOS13, Hilton Head, SC 11
Statement #1: Insight is Key
• The simulation of scientific problems is only one part of the problem solution
• The scientist needs insight
• Scientific visualization allows to cope with the complexity of the data and to understand
SOS13, Hilton Head, SC 12
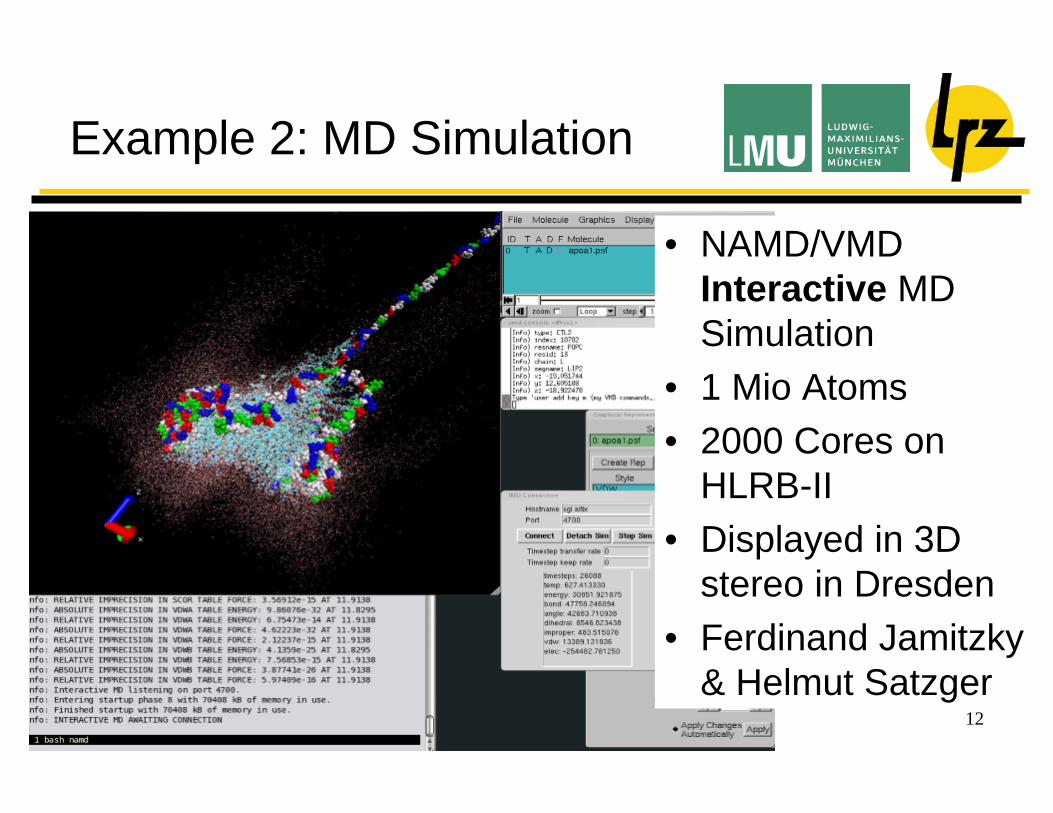
Example 2: MD Simulation
• NAMD/VMD Interactive MD Simulation
• 1 Mio Atoms• 2000 Cores on
HLRB-II• Displayed in 3D
stereo in Dresden• Ferdinand Jamitzky
& Helmut Satzger

SOS13, Hilton Head, SC 13
Example 2: Setup
HLRB-IIRVS1
~ 1 GB/s
300.000 Atoms500 Cores
30 Iterations/s
~ 1 MB/s
~ 500 km

SOS13, Hilton Head, SC 14
Statement #2: Remote Users
• Users are not necessarily located at/near the computing center
• Remote visualization is an important service that must be provided to the user community
• Users request different visualization software
• Problem: licensing becomes an issue

SOS13, Hilton Head, SC 15
Example 3: Blood Flow
• Parallelsimulationon the grid
• Onlinevisualizationat desktop
• Collaborationwith UniversityAmsterdam, NL

SOS13, Hilton Head, SC 16
Example 4: Fossil
• Fossil Ostracoden(100 Mio. years old)
• Size: 1,5 mm• Volume data (750 GB)
generated by ESFR Synchrotron in Grenoble, France
• Prof. Renate Matzke-Karasz (LMU)
SOS13, Hilton Head, SC 17
Statement #3: Amount of data
• The amount of visualization data increaseswith the amount of simulation data
• Data transportation takes place:– Within the supercomputer– Between supercomputer and visualization cluster– Visualization source and remote display
• Communication/IO is the weak link

SOS13, Hilton Head, SC 18
Example 5a: User Integration
• g-Eclipse: Integrated Access to HPC, Grid, Cloud, …
• Visualization local or remote

SOS13, Hilton Head, SC 19
Example 5b:Output devices
Sony PSP as output device for scientific visualization

SOS13, Hilton Head, SC 20
Statement #4: User-centric
• The output of the visualization is provided to the user
• The interface between user and machine is an important criteria to accept a system
• Users have specific requirements regarding visualization, e.g. different output devices

SOS13, Hilton Head, SC 21
Summary
• The goal of simulation and visualization is:Insight
• Data transportation is critical needs to be improved with increasing amounts of data
• Visualization is compute-intensive task with substantial requirements to performance and memory

SOS13, Hilton Head, SC 22
VisualizationMapping
Rendering
Data EnrichmentEnhancement
Reduction
Simulation
OutputDevice
SimulationData
DerivedData
AbstractVis-Object
DisplayableImage
Visualization Pipeline

SOS13, Hilton Head, SC 23
Summary 2
• Visualization is more than just generating pixels
• Just another visualization cluster is not sufficient
• Visualization is domain-specificand user-centric

International Symposium on High Performance Distributed
Computing (HPDC 2009)Munich, Germany
Workshops: 9-10 June 2009Symposium: 11-13 June 2009http://www.lrz.de/hpdc2009