large-scale wireless local-area network measurement and privacy
TRANSCRIPT

Large-scale Wireless Local-area Network Measurement and
Privacy Analysis
Dartmouth Computer Science Technical Report TR2011-703
A ThesisSubmitted to the Faculty
in partial fulfillment of the requirements for thedegree of
Doctor of Philosophyin
Computer Scienceby
Keren TanDARTMOUTH COLLEGEHanover, New Hampshire
August 2011
Examining Committee:
(chair) David F. Kotz, Ph.D.
Sean W. Smith, Ph.D.
Sergey Bratus, Ph.D.
Tristan Henderson, Ph.D.
Brian W. Pogue, Ph.D.Dean of Graduate Studies

Copyright by
Keren Tan
2011

Abstract
The edge of the Internet is increasingly becoming wireless. Understanding the wireless
edge is therefore important for understanding the performance and security aspects of the
Internet experience. This need is especially necessary for enterprise-wide wireless local-
area networks (WLANs) as organizations increasingly depend on WLANs for mission-
critical tasks. To study a live production WLAN, especially a large-scale network, is a
difficult undertaking. Two fundamental difficulties involved are (1) building a scalable net-
work measurement infrastructure to collect traces from a large-scale production WLAN,
and (2) preserving user privacy while sharing these collected traces to the network research
community. In this dissertation, we present our experience in designing and implement-
ing one of the largest distributed WLAN measurement systems in the United States, the
Dartmouth Internet Security Testbed (DIST), with a particular focus on our solutions to the
challenges of efficiency, scalability, and security. We also present an extensive evaluation
of the DIST system. To understand the severity of some potential trace-sharing risks for
an enterprise-wide large-scale wireless network, we conduct privacy analysis on one kind
of wireless network traces, a user-association log, collected from a large-scale WLAN. We
introduce a machine-learning based approach that can extract and quantify sensitive infor-
mation from a user-association log, even though it is sanitized. Finally, we present a case
study that evaluates the tradeoff between utility and privacy on WLAN trace sanitization.
ii
Acknowledgments
First and foremost, I would like to express my sincere gratitude to my advisor, David Kotz,
for his wisdom, knowledge, and insight that guided me during my Ph.D. study. It has been
my great honor to work with him, and this experience will be a significant presence in my
life forever.
Besides my advisor, I would like to thank the rest of my thesis committee: Sean Smith,
Sergey Bratus, and Tristan Henderson, for their encouragement and insightful comments.
My sincere thanks also goes to Guanhua Yan for offering me the summer internship
opportunity at Los Alamos National Laboratory and cooperating in our research project.
I am grateful to my colleagues: Bennet Vance, Chris McDonald, Yong Sheng, Jihwang
Yeo, Phil Fazio, Andrew Campbell, Mike Locasto, Guanlin Chen, Udayan Deshpande,
Libo Song, Chrisil Arackaparambil, Soumendra Nanda, Anna Shubina, Shrirang Mare,
Cory Cornelius, Aarathi Prasad, the staff of Computer Science Department and Computing
Services at Dartmouth College.
I would like to thank my parents for their love and support.
This research is supported by U.S. Department of Homeland Security (NBCH2050002,
2006-CS-001-000001), National Science Foundation (CNS-0831409, 0454062), and Aruba
iii

Networks. Points of view or opinions in this document are those of the author and do not
represent the official position or policies of any sponsor.
iv

Contents
1 Introduction 1
1.1 Wireless network measurement . . . . . . . . . . . . . . . . . . . . . . . . 3
1.2 Network trace sharing . . . . . . . . . . . . . . . . . . . . . . . . . . . . . 4
1.3 Contributions . . . . . . . . . . . . . . . . . . . . . . . . . . . . . . . . . 6
2 Building a large-scale WLAN measurement system 8
2.1 Background . . . . . . . . . . . . . . . . . . . . . . . . . . . . . . . . . . 10
2.1.1 MAP . . . . . . . . . . . . . . . . . . . . . . . . . . . . . . . . . 10
2.1.2 WLAN at Dartmouth College . . . . . . . . . . . . . . . . . . . . 12
2.2 Challenges . . . . . . . . . . . . . . . . . . . . . . . . . . . . . . . . . . . 13
2.2.1 Performance and scalability . . . . . . . . . . . . . . . . . . . . . 13
2.2.2 Security and privacy . . . . . . . . . . . . . . . . . . . . . . . . . 15
2.3 Approach . . . . . . . . . . . . . . . . . . . . . . . . . . . . . . . . . . . 16
2.3.1 Saluki . . . . . . . . . . . . . . . . . . . . . . . . . . . . . . . . . 17
2.3.2 DISTSANI . . . . . . . . . . . . . . . . . . . . . . . . . . . . . . 26
2.4 Evaluation . . . . . . . . . . . . . . . . . . . . . . . . . . . . . . . . . . . 28
v

2.4.1 Controlled environment evaluation . . . . . . . . . . . . . . . . . . 28
2.4.2 In-production evaluation . . . . . . . . . . . . . . . . . . . . . . . 32
2.5 DIST Active Protection System . . . . . . . . . . . . . . . . . . . . . . . . 39
2.5.1 Implementation . . . . . . . . . . . . . . . . . . . . . . . . . . . . 40
2.5.2 Evaluation . . . . . . . . . . . . . . . . . . . . . . . . . . . . . . 41
2.6 Summary . . . . . . . . . . . . . . . . . . . . . . . . . . . . . . . . . . . 43
3 Obstacles and opportunities for network trace sanitization 45
3.1 Background . . . . . . . . . . . . . . . . . . . . . . . . . . . . . . . . . . 46
3.1.1 Challenges for trace collection and sharing . . . . . . . . . . . . . 46
3.1.2 Real-world network trace sharing efforts . . . . . . . . . . . . . . . 48
3.1.3 Terminology . . . . . . . . . . . . . . . . . . . . . . . . . . . . . 49
3.1.4 Database sanitization and privacy-preserving data mining . . . . . . 51
3.1.5 Chapter organization . . . . . . . . . . . . . . . . . . . . . . . . . 53
3.2 Sanitization . . . . . . . . . . . . . . . . . . . . . . . . . . . . . . . . . . 56
3.2.1 Sanitization techniques . . . . . . . . . . . . . . . . . . . . . . . . 56
3.2.2 Sanitization tools . . . . . . . . . . . . . . . . . . . . . . . . . . . 61
3.3 De-sanitization . . . . . . . . . . . . . . . . . . . . . . . . . . . . . . . . 64
3.4 Evaluation of Sanitization . . . . . . . . . . . . . . . . . . . . . . . . . . . 67
3.5 Challenges and open problems . . . . . . . . . . . . . . . . . . . . . . . . 71
3.5.1 Quantifying sensitive information . . . . . . . . . . . . . . . . . . 71
3.5.2 Metrics for evaluating sanitization results . . . . . . . . . . . . . . 73
vi

3.5.3 Interpreting sanitization results . . . . . . . . . . . . . . . . . . . . 74
3.6 Summary and conclusion . . . . . . . . . . . . . . . . . . . . . . . . . . . 75
4 Privacy analysis on user-association logs 77
4.1 Related work . . . . . . . . . . . . . . . . . . . . . . . . . . . . . . . . . 79
4.2 WLAN user-association logs . . . . . . . . . . . . . . . . . . . . . . . . . 81
4.3 Threat model and problem formulation . . . . . . . . . . . . . . . . . . . . 83
4.4 Algorithm description . . . . . . . . . . . . . . . . . . . . . . . . . . . . . 86
4.4.1 Data representation . . . . . . . . . . . . . . . . . . . . . . . . . . 87
4.4.2 Algorithm procedure . . . . . . . . . . . . . . . . . . . . . . . . . 89
4.4.3 Conditional random field . . . . . . . . . . . . . . . . . . . . . . . 91
4.5 Evaluation . . . . . . . . . . . . . . . . . . . . . . . . . . . . . . . . . . . 95
4.6 Mitigation strategies . . . . . . . . . . . . . . . . . . . . . . . . . . . . . 99
4.6.1 Generalization . . . . . . . . . . . . . . . . . . . . . . . . . . . . 99
4.6.2 Perturbation . . . . . . . . . . . . . . . . . . . . . . . . . . . . . . 101
4.7 Conclusion . . . . . . . . . . . . . . . . . . . . . . . . . . . . . . . . . . 103
5 Case study: evaluating the tradeoff between utility and privacy on user-association
logs 105
5.1 Utility metric: Markov handoff predictor . . . . . . . . . . . . . . . . . . . 106
5.2 Privacy metric: LKC privacy . . . . . . . . . . . . . . . . . . . . . . . . . 109
5.3 Experiment . . . . . . . . . . . . . . . . . . . . . . . . . . . . . . . . . . 111
5.4 Summary . . . . . . . . . . . . . . . . . . . . . . . . . . . . . . . . . . . 120
vii

6 Summary and future work 121
6.1 Summary of contributions . . . . . . . . . . . . . . . . . . . . . . . . . . 121
6.2 Future work . . . . . . . . . . . . . . . . . . . . . . . . . . . . . . . . . . 125
viii

List of Tables
2.1 Deployment scale comparison of MAP, Jigsaw and DIST . . . . . . . . . . 13
2.2 Comparison of Aruba AP70 to other platforms . . . . . . . . . . . . . . . . 15
2.3 Comparison of passive network sniffing programs . . . . . . . . . . . . . . 17
2.4 UDP throughput for different datagram size . . . . . . . . . . . . . . . . . 19
2.5 DIST combo frame header definition . . . . . . . . . . . . . . . . . . . . . 20
2.6 In-production experiment configuration . . . . . . . . . . . . . . . . . . . 33
4.1 Features of an association activity vector . . . . . . . . . . . . . . . . . . . 90
ix

List of Figures
2.1 MAP architecture. . . . . . . . . . . . . . . . . . . . . . . . . . . . . . . . 11
2.2 DIST information flows. . . . . . . . . . . . . . . . . . . . . . . . . . . . 16
2.3 HMAC-SHA256’s processing speed on AP70. . . . . . . . . . . . . . . . . 24
2.4 The Saluki architecture. . . . . . . . . . . . . . . . . . . . . . . . . . . . . 25
2.5 The data flow inside Saluki. . . . . . . . . . . . . . . . . . . . . . . . . . . 26
2.6 Comparison of frame-capture rate. . . . . . . . . . . . . . . . . . . . . . . 30
2.7 Comparison of frame-loss ratio. . . . . . . . . . . . . . . . . . . . . . . . 30
2.8 Comparison of CPU usage. . . . . . . . . . . . . . . . . . . . . . . . . . . 31
2.9 Captured 802.11 frames and received DIST combo frames. . . . . . . . . . 35
2.10 IEEE 802.11 frames breakdown. . . . . . . . . . . . . . . . . . . . . . . . 37
2.11 Live/active APs and active users. . . . . . . . . . . . . . . . . . . . . . . . 38
2.12 Evaluation of De-authentication DoS attack. . . . . . . . . . . . . . . . . . 43
3.1 Geometric interpretation of prefix-preserving anonymization function. . . . 60
3.2 PCAP header sanitization rules used in FLAIM [110]. . . . . . . . . . . . . 63
3.3 TCP sanitization rules used in tcpmkpub [93]. . . . . . . . . . . . . . . . . 64
x

4.1 Represent an user’s association log using association activity template. . . . 88
4.2 Illustration of linear-chain CRF. . . . . . . . . . . . . . . . . . . . . . . . 95
4.3 Relationship between the attack performance and the amount of auxiliary
information. . . . . . . . . . . . . . . . . . . . . . . . . . . . . . . . . . . 98
4.4 Effectiveness of generalization-based mitigation against the proposed cor-
relation attack. . . . . . . . . . . . . . . . . . . . . . . . . . . . . . . . . . 100
4.5 Effectiveness of perturbation-based mitigation against the proposed corre-
lation attack. . . . . . . . . . . . . . . . . . . . . . . . . . . . . . . . . . . 103
5.1 Correct prediction ratio on unsanitized and sanitized traces. . . . . . . . . . 114
5.2 Comparison of number of unique contexts. . . . . . . . . . . . . . . . . . . 115
5.3 Wrong-prediction ratio on unsanitized and sanitized traces. . . . . . . . . . 117
5.4 Missed-prediction ratio on unsanitized and sanitized traces. . . . . . . . . . 118
xi

Chapter 1
Introduction
The edge of the Internet is increasingly becoming wireless. Therefore, understanding the
wireless edge is important for understanding the performance and security aspects of the
Internet experience. This understanding is necessary for enterprise-wide wireless local-
area networks (WLANs) as organizations increasingly depend on WLANs for mission-
critical tasks. To study a live production WLAN, especially a large-scale one, is a difficult
undertaking. Two fundamental difficulties involved are (1) building a scalable network
measurement infrastructure to collect traces from a large-scale production WLAN, and
(2) preserving the network users’ privacy while sharing these collected traces to the network
research community.
For the past decade, our research team at Dartmouth College has continuously devoted
effort to developing new technologies, software tools and systems to measure large-scale
WLANs, and some of our collected traces have been extensively studied by the network
research community. We were among the first to explore the feasibility of using distributed
arrays of Air Monitors (AMs) to passively monitor WLANs. Since then, via passive mon-
itoring, many WLAN traces have been collected in conference events, an office building
1

floor and even a whole office building. In this dissertation, we present our experience in de-
signing and implementing one of the largest distributed WLAN measurement systems, the
Dartmouth Internet Security Testbed (DIST), with a particular focus on our solutions to the
challenges of efficiency, scalability, and security. We also present an extensive evaluation
of the DIST system.
Creating and operating such a large-scale network measurement infrastructure is a
daunting task. The extensive investment of time and effort restricts the ability to capture
meaningful amounts of WLAN traces to larger or well-funded organizations. In such an en-
vironment, sharing becomes an essential feature of wireless-network research. To preserve
network users’ privacy, a trace publisher must sanitize the network traces before sharing
them with the public. Privacy analysis on wired network traces has been widely studied, to
understand the severity of some potential trace-sharing risks [16, 28, 89]. However, a sim-
ilar understanding is scarce for enterprise-wide, large-scale wireless networks [68, 116].
According to our survey of researchers [127], a lack of understanding about the privacy
issues in wireless-network traces is the top concern that prevents researchers from sharing
their traces. In this dissertation, we conduct privacy analysis on one of our own wireless
network traces, a user-association log, collected from the Dartmouth wireless network. We
introduce a machine-learning based approach that can extract and quantify sensitive infor-
mation from a user association log, even though it is sanitized. Finally, we present a case
study that evaluates the tradeoff between utility and privacy on WLAN trace sanitization.
In the rest of this chapter, we introduce our wireless-network measurement system and the
challenges of network trace sharing, and summarize our contributions in this dissertation.
2

1.1 Wireless network measurement
Wireless-network measurement techniques can be classified into two categories: either
measuring the wired side of a wireless network, or measuring the wireless side directly.
Earlier Dartmouth research [50,62] and many other WLAN measurement studies [2,8]
have monitored the “wired side” of Access Points (APs) in infrastructure WLANs using
SNMP, syslog and packet sniffing. These techniques monitor the traffic that has been
bridged from the wireless side to the wired side of a network. One advantage of such
techniques is that they are easy to implement, and they provide good coverage about some
information at a low cost, such as when and where a user has connected to the wireless
network. Usually such techniques do not require any device especially designed for wire-
less networks, and the procedures for collecting network traces are similar to that on wired
networks. However, the disadvantage is that the views offered by such techniques are often
incomplete because much lower-level information is missing. The collected traces only
characterize how the monitored WLAN and its users behave, and have provided little in-
sight about why the network and its users behave in such a manner [21].
Deploying dedicated wireless measurement devices, Air Monitors (AMs),1 to passively
monitor the wireless network directly is the second category of wireless measurement ap-
proaches. Measuring the “wireless side” of APs enables one to capture more refined infor-
mation about the wireless network, such as the control and management frames in IEEE
802.11 protocols, and some physical-layer information, such as signal strength. Aside from
the capability to capture more information, wireless measurement techniques are flexible
1We adopt the term “Air Monitor” introduced by Aruba Networks [5].
3

and non-intrusive. No assistance from the network provider is needed to tap into the wired
network, and the AMs can be deployed to any place that is of interest.
Due to the limited propagation range of Wi-Fi radio waves,2 each AM is only able to
monitor the wireless network traffic within its nearby area. Thus, a common solution is to
deploy an array of AMs to provide an extended measurement area. The cost to purchase and
deploy such distributed arrays of AMs is, however, much higher than that of only tapping
the wired side of a wireless network. We were among the first to explore the feasibility of
using distributed arrays of AMs to passively monitor the IEEE 802.11 link layer and higher
layers [107, 128]. As far as we know, our DIST system is the first large-scale WLAN
measurement system that covers a large fraction of an enterprise campus.
In summary, both the indirect (wired-side) and direct (wireless-side) measurements
have their own advantages and disadvantages, and they are complementary to each other.
At Dartmouth College, we use both techniques to monitor the campus-wide production
wireless network.
1.2 Network trace sharing
The sharing of network trace data provides important benefits to both network researchers
and administrators. Sharing traces helps scientists and network engineers compare and
reproduce results and the behavior of network tools. The practice of sharing such informa-
tion, however, faces a number of obstacles.2Here we imply that both the sender and the receiver use off-the-shelf commercial Wi-Fi products. By
using specially designed equipments, the propagation range of Wi-Fi radio waves may increase to over 100miles [123].
4

Network traces contain significant amounts of sensitive information about the network
structure and its users. Thus, researchers wishing to share traces must “sanitize” them
to protect this information. We distinguish the terms “anonymization” and “sanitization”:
“anonymization” attempts to protect the privacy of network users, and “sanitization” at-
tempts to protect the privacy of network users and the secrecy of operational network infor-
mation. In this sense, “sanitization” is a superset of “anonymization”. In some applications
when we only care about protecting the privacy of network users, we may use these two
terms interchangeably. In contrast, freely sharing full-capture traces happens rarely and
usually requires either close, pre-established personal relationships between researchers
or extensive legal agreements (as in the PREDICT repository [96]). Furthermore, most
real-world traces contain a large volume of information with features along many different
dimensions, making the problem of identifying and masking sensitive data non-trivial. It
remains difficult to precisely specify a policy regarding the type and structure of informa-
tion that should be sanitized, let alone provide a reliable method that ensures the conclusive
suppression of such information in the shared trace. Thus, two main categories of concerns
arise: (1) legal and ethical obstacles to capturing information derived from human interac-
tion for research purposes and (2) operational difficulties arising from a lack of effective
tools and techniques for suppressing sensitive information. In this dissertation, we are in-
terested in the second category of concerns, and Chapter 3 presents a detailed survey of
state-of-the-art research in the network trace sharing community.
5
1.3 Contributions
In this dissertation we make three major contributions:
1. We designed and implemented a distributed large-scale WLAN measurement system,
DIST. We improved processing speed more than 5 times over the previous imple-
mentation and reduced the network bandwidth requirement by more than 70%. A
two-month long-term evaluation not only proved the stability of the DIST system but
also provided us much insight about the monitored large-scale WLAN. We designed
and implemented an Active Protection System based on the DIST infrastructure.
2. We carried out an extensive privacy analysis on one kind of wireless network traces,
a user-association log [117]. By simulating an adversary’s role, we propose a novel
type of correlation attack in which the adversary uses the anonymized association
log to build signatures against each user, and when combined with auxiliary infor-
mation, such signatures can help to identify users within the anonymized log. Using a
log that contains more than four thousand users and millions of association records,
we demonstrate that this attack technique, under certain circumstances, is able to
pinpoint the victim’s identity exactly with a probability as high as 70%, or narrow
it down to a set of 20 candidates with a probability close to 100%. We present this
work in Chapter 4.
3. We present a case study evaluating the tradeoff between utility and privacy on WLAN
trace sanitization. We observe that the trace sanitization would not only affect the
research utility of a trace, but also in an extreme case, the researcher may draw a
6

different conclusion on the sanitized trace than it would draw from an un-sanitized
trace. We discuss the cause of such changes. We present this work in Chapter 5.
Certain parts of this dissertation have been published: part of Chapter 2 in WiN-
Mee’10 [115], Chapter 3 as a book chapter [118], and Chapter 4 in INFOCOM’11 [117].
The remainder of this dissertation is organized as follows. Chapter 2 discusses the
design, implementation and evaluation of our DIST system. After we present a survey on
the obstacles and opportunities for network trace sanitization in Chapter 3, we introduce
our privacy analysis on user-association logs in Chapter 4. Chapter 5 presents a case study
that evaluates the tradeoff between utility and privacy on user-association logs. Finally, we
summarize and conclude in Chapter 6.
7

Chapter 2
Building a large-scale WLANmeasurement system
As enterprises increasingly depend on WLANs for mission-critical applications, it is
important to monitor such networks to recognize usage patterns, diagnose malfunctions,
and detect any abnormal behaviors that would disrupt or degrade the network operation.
To support these activities, we built a campus-wide, distributed WLAN monitoring system,
the Dartmouth Internet Security Testbed (DIST) [15], at Dartmouth College.
This chapter describes our experience gained during the design, implementation and
operation of a distributed large-scale WLAN monitoring system, the Dartmouth Internet
Security Testbed (DIST). As one of the largest WLAN monitoring systems in the United
States, DIST is equipped with 420 radio interfaces on 210 AMs, and covers more than
10 buildings and more than 5,000 users. In the MAP project [107], the predecessor of
the DIST project, we implemented a building-wide WLAN monitoring system. However,
when an attempt was made to scale the deployment from a building to a campus, the MAP
system could no longer meet the required levels of efficiency, scalability, security and man-
ageability. Our new monitoring system, DIST, was designed to address these challenges.
8

We have made three major contributions in designing and building DIST:
Saluki: a high-performance Wi-Fi sniffing system [115]. Compared to our previous im-
plementation and to other available sniffing programs, Saluki has the following advantages:
(1) its small memory and computation footprint makes it suitable for a resource-constrained
Linux platform, such as those in commercial Wi-Fi access points; (2) all traffic between the
sniffer and the back-end server is secured using 128-bit encryption; (3) the frame-capture
rate has increased more than three-fold with minimal frame loss; and (4) under the same
frame-capture rate, the traffic load on the backbone network is reduced to only 30% of that
in our previous implementation.
DISTSANI: an online network trace sanitization and distribution program. It receives
the network trace captured by Saluki, sanitizes several fields in the frame/packet headers,
and distributes the sanitized network trace to different destinations simultaneously. The
online sanitization process is highly efficient, processing up to three million addresses per
second in our implementation.
MAPmaker: a tool for configuring, launching, monitoring, and terminating an ex-
periment. A running experiment consists of interacting processes distributed across many
hosts, including both servers and AMs. MAPmaker pushes master executables for these
processes to the hosts that need them, remotely starts them, and keeps track of their pro-
cess id numbers (pids) both for monitoring purposes and so that the experiment can be shut
down in an orderly fashion. MAPmaker runs multiple independent experiments concur-
rently without interference among them.
9

Because my individual contribution mainly lies in Saluki and DISTSANI, this chapter
only describes these two subsystems.
2.1 Background
This section first introduces the MAP project (the predecessor of DIST) and then presents
some basic information about the WLAN at Dartmouth; this WLAN is the target network
that DIST is designed to monitor.
2.1.1 MAP
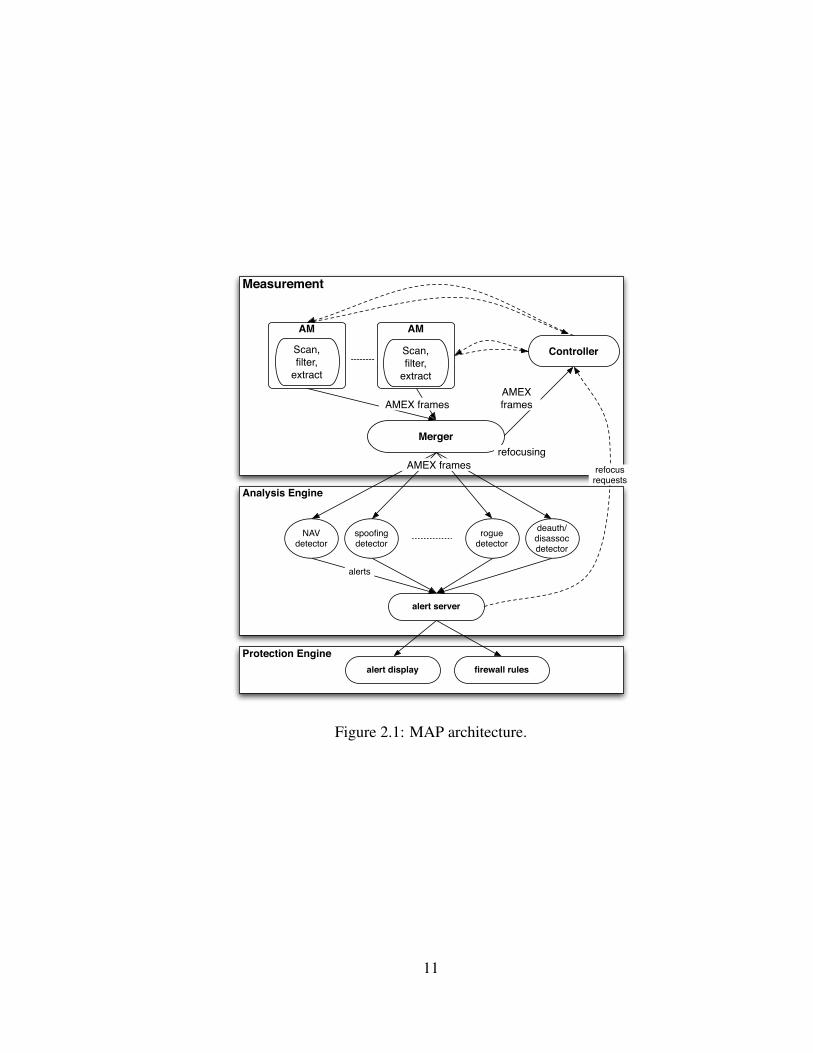
MAP [107] aimed to build a security-focused WLAN monitoring system while DIST has
broader goals. The architecture of the MAP system is shown in Figure 2.1. During 2005
and 2007, we deployed 20 Aruba AP70s [5] flashed with OpenWrt Linux [87] in the com-
puter science department building at Dartmouth College. These Aruba AP70s have been
used as Air Monitors (AMs) to capture wireless frames, extract and forward the desired
frame features to the merger process, which creates a unified stream on a coherent time-
line. The analysis engine includes plug-in detectors that analyze the traffic, producing alerts
to the protection system and feedback to the measurement system.
MAP includes several advanced features for WLAN measurement: AM feature ex-
traction, AM channel sampling and refocusing, and multi-source trace merging. AM fea-
ture extraction is designed to reduce the volume of forwarded traffic. It works as a user-
configurable filter that extracts user-requested information from each captured frame/packet,
10
Measurement
Controller
Merger
AM
Scan, filter,
extract
AM
refocusing
AMEX frames
Analysis Engine
Protection Engine
NAVdetector
spoofingdetector
rogue detector
alert server
refocusrequests
alerts
deauth/disassoc detector
alert display
AMEX frames
AMEX frames
Scan, filter,
extract
firewall rules
Figure 2.1: MAP architecture.
11

and only forwards the extracted information to the server in a frame format called AMEX.
AM channel sampling and refocusing are two complementary strategies to deal with the
multi-channel-monitoring problem in WLANs. Because the unlicensed bands used for
IEEE 802.11 networks have multiple channels, a single-radio AM can only listen to one
channel at any time. One could attach multiple radios to one device, or place multiple
single-radio devices at one location. Either way, the hardware required is bulky or pro-
hibitively expensive. The AMs in MAP monitor multiple channels by periodically assign-
ing the radio to each channel. This technique is named channel sampling, as it collects only
a sample of the frames passing through all the channels [33,34]. AM channel sampling will
inevitably lose information because the AM only visits each channel for a limited time. To
compensate for this loss, MAP allows the analysis components to dynamically “refocus”
the measurement system after observing some user-defined suspicious behaviors, by gath-
ering more frames from a client, AP, or region, or by extending the set of features collected
about the traffic of interest [35]. In the event of an ongoing network attack, the higher-
fidelity stream of frames may allow MAP to confirm the attack or locate the attacker. We
refer interested readers to our previous work [107] for more thorough information about
MAP and its comparison to Jigsaw [21], DAIR [7], DOMINO [101], and Wit [78].
2.1.2 WLAN at Dartmouth College
Dartmouth College was among the first universities in the world to provide campus-wide
WLAN coverage. In 2001, more than 500 Cisco 350 APs were installed, to provide
12
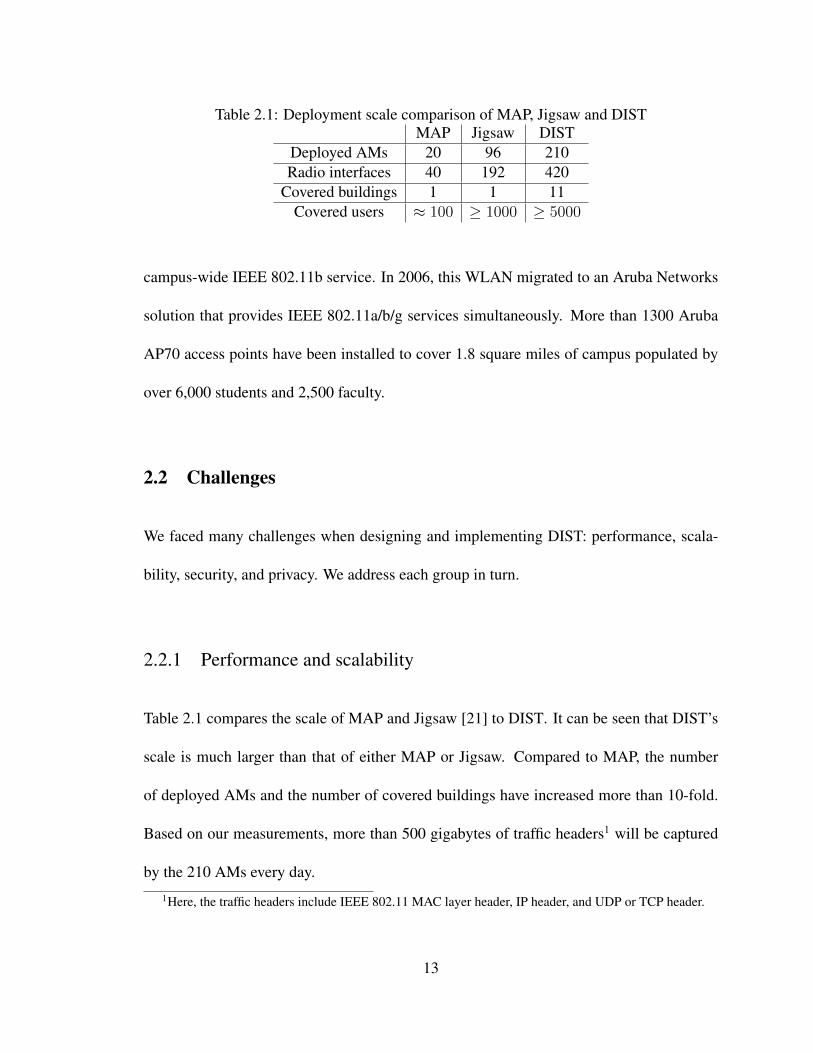
Table 2.1: Deployment scale comparison of MAP, Jigsaw and DISTMAP Jigsaw DIST
Deployed AMs 20 96 210Radio interfaces 40 192 420
Covered buildings 1 1 11Covered users ≈ 100 ≥ 1000 ≥ 5000
campus-wide IEEE 802.11b service. In 2006, this WLAN migrated to an Aruba Networks
solution that provides IEEE 802.11a/b/g services simultaneously. More than 1300 Aruba
AP70 access points have been installed to cover 1.8 square miles of campus populated by
over 6,000 students and 2,500 faculty.
2.2 Challenges
We faced many challenges when designing and implementing DIST: performance, scala-
bility, security, and privacy. We address each group in turn.
2.2.1 Performance and scalability
Table 2.1 compares the scale of MAP and Jigsaw [21] to DIST. It can be seen that DIST’s
scale is much larger than that of either MAP or Jigsaw. Compared to MAP, the number
of deployed AMs and the number of covered buildings have increased more than 10-fold.
Based on our measurements, more than 500 gigabytes of traffic headers1 will be captured
by the 210 AMs every day.
1Here, the traffic headers include IEEE 802.11 MAC layer header, IP header, and UDP or TCP header.
13
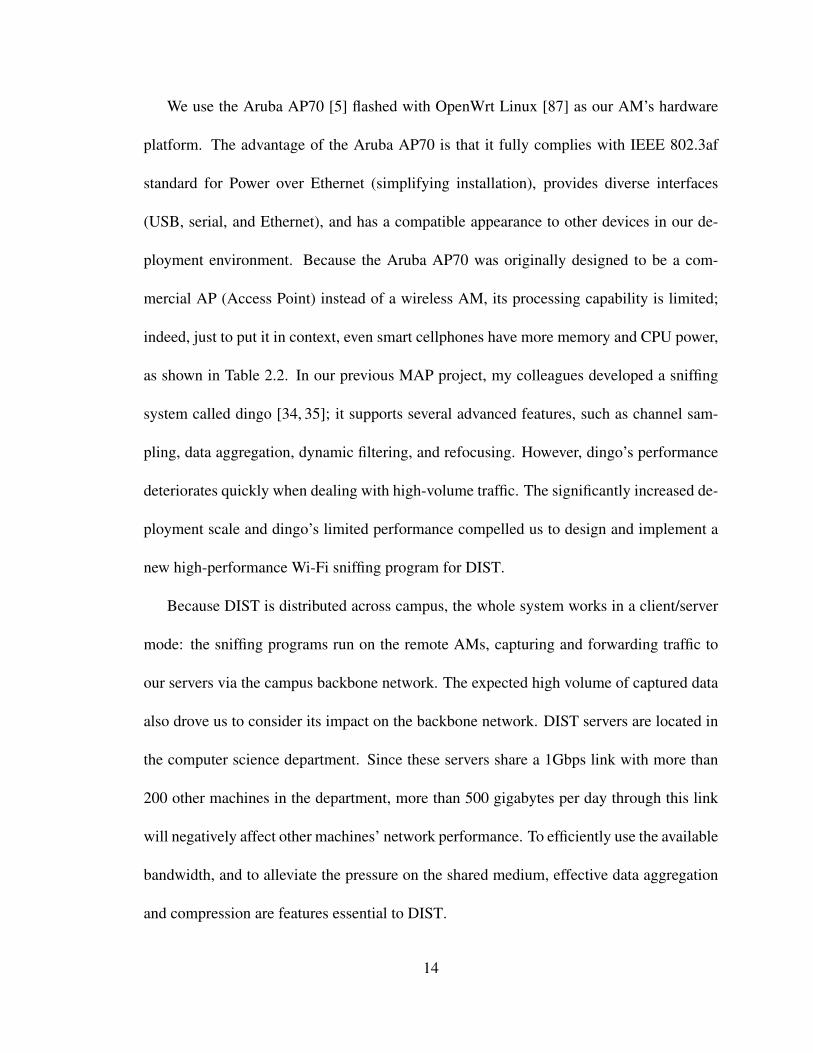
We use the Aruba AP70 [5] flashed with OpenWrt Linux [87] as our AM’s hardware
platform. The advantage of the Aruba AP70 is that it fully complies with IEEE 802.3af
standard for Power over Ethernet (simplifying installation), provides diverse interfaces
(USB, serial, and Ethernet), and has a compatible appearance to other devices in our de-
ployment environment. Because the Aruba AP70 was originally designed to be a com-
mercial AP (Access Point) instead of a wireless AM, its processing capability is limited;
indeed, just to put it in context, even smart cellphones have more memory and CPU power,
as shown in Table 2.2. In our previous MAP project, my colleagues developed a sniffing
system called dingo [34, 35]; it supports several advanced features, such as channel sam-
pling, data aggregation, dynamic filtering, and refocusing. However, dingo’s performance
deteriorates quickly when dealing with high-volume traffic. The significantly increased de-
ployment scale and dingo’s limited performance compelled us to design and implement a
new high-performance Wi-Fi sniffing program for DIST.
Because DIST is distributed across campus, the whole system works in a client/server
mode: the sniffing programs run on the remote AMs, capturing and forwarding traffic to
our servers via the campus backbone network. The expected high volume of captured data
also drove us to consider its impact on the backbone network. DIST servers are located in
the computer science department. Since these servers share a 1Gbps link with more than
200 other machines in the department, more than 500 gigabytes per day through this link
will negatively affect other machines’ network performance. To efficiently use the available
bandwidth, and to alleviate the pressure on the shared medium, effective data aggregation
and compression are features essential to DIST.
14

Table 2.2: Comparison of Aruba AP70 to other platformsAruba AP70 Linksys WRT54GL iPhone 4
CPU 266MHz MIPS 4Kc 200MHz MIPS 1GHz Apple A4Memory (RAM) 28MB 16MB 512MBStorage 8MB 4MB 16 or 32GB
2.2.2 Security and privacy
Since DIST is monitoring Dartmouth’s production WLAN, used daily by thousands of stu-
dents and staff, the collected traces contain sensitive information related to human activity,
the identifiers like MAC/IP addresses may identify individuals, and TCP/UDP payloads
may expose personal information. To maximally ensure system security and protect user
privacy, we carried out a comprehensive security and privacy analysis of the whole DIST
system, hardened the operating systems on all AMs and servers (such as minimizing run-
ning services and configuring strict firewall rules), and adhered to a strict guideline when
transferring and storing captured data: if it is not encrypted, then it must be sanitized.
We concluded an extensive security analysis and built detailed threat models of the
DIST system in our previous work [15]. In this chapter, we focus on two kinds of threats
that may jeopardize the data flow transmitted inside the DIST system. First, an adversary
may intercept the traffic between the AM and server. Second, an adversary may have access
to the server that stores captured traces. To protect against the first threat, we require all
data exchanged between AMs and the servers, including both captured traces and control
messages, be encrypted to ensure data confidentiality. As a further step, we implemented
an HMAC (Hash-based Message Authentication Code) to ensure both the data integrity and
15

AM AM
ControllerSanitizer
DiskData
subscriber 1Data
subscriber 2
AM
Encrypted data
Sanitized data
Encrypted control message
Figure 2.2: DIST information flows.
the authenticity of all data exchanged between AMs and the servers. To protect against the
second threat, we require all received data be sanitized before being written to persistent
storage (such as hard drives) or sent to data subscribers (including the merger and users’
analysis components, except for real-time attack detection). Figure 2.2 shows the types of
information flows inside DIST.
2.3 Approach
As described above, performance, scalability, security, and privacy are the fundamental
challenges we faced in designing and implementing DIST.
In this section we provide more details of our methods for addressing these challenges
using the Saluki and DISTSANI subsystem. Saluki is a high-performance Wi-Fi sniffing
system; DISTSANI is an online network trace sanitization and distribution system.
16
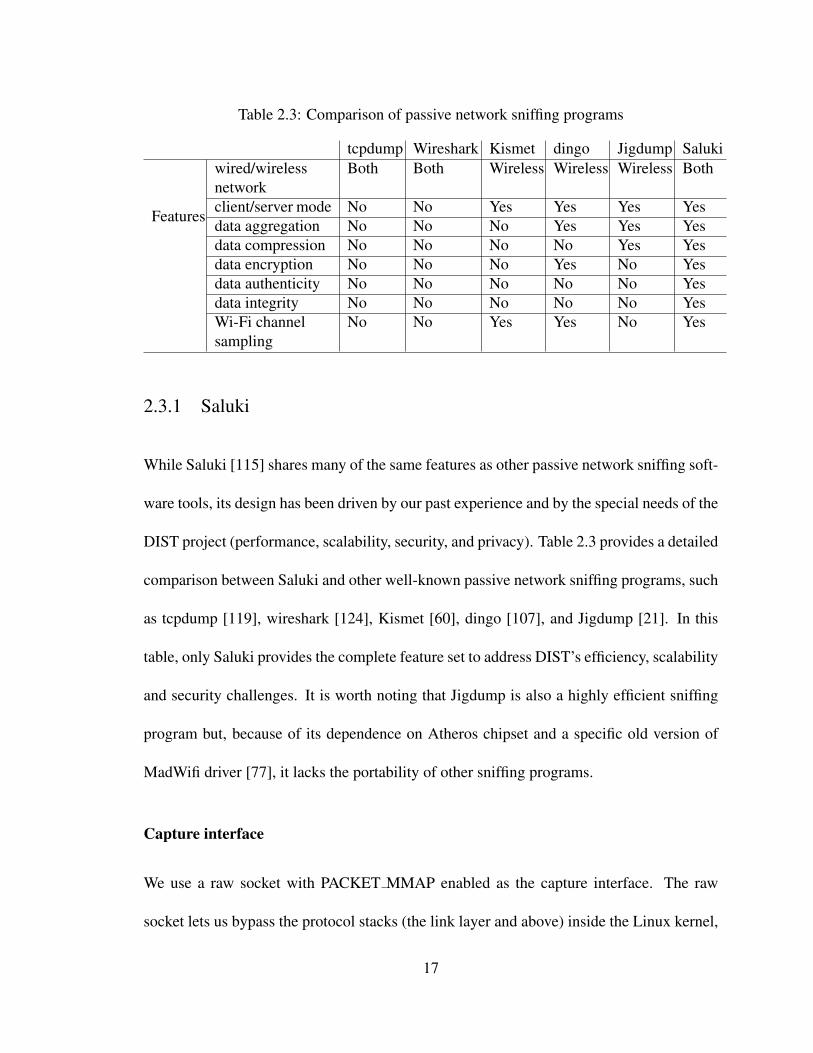
Table 2.3: Comparison of passive network sniffing programs
tcpdump Wireshark Kismet dingo Jigdump Saluki
Features
wired/wirelessnetwork
Both Both Wireless Wireless Wireless Both
client/server mode No No Yes Yes Yes Yesdata aggregation No No No Yes Yes Yesdata compression No No No No Yes Yesdata encryption No No No Yes No Yesdata authenticity No No No No No Yesdata integrity No No No No No YesWi-Fi channelsampling
No No Yes Yes No Yes
2.3.1 Saluki
While Saluki [115] shares many of the same features as other passive network sniffing soft-
ware tools, its design has been driven by our past experience and by the special needs of the
DIST project (performance, scalability, security, and privacy). Table 2.3 provides a detailed
comparison between Saluki and other well-known passive network sniffing programs, such
as tcpdump [119], wireshark [124], Kismet [60], dingo [107], and Jigdump [21]. In this
table, only Saluki provides the complete feature set to address DIST’s efficiency, scalability
and security challenges. It is worth noting that Jigdump is also a highly efficient sniffing
program but, because of its dependence on Atheros chipset and a specific old version of
MadWifi driver [77], it lacks the portability of other sniffing programs.
Capture interface
We use a raw socket with PACKET MMAP enabled as the capture interface. The raw
socket lets us bypass the protocol stacks (the link layer and above) inside the Linux kernel,
17

and the memory mapping provides for efficient communication between the kernel space
and user space. This interface avoids inefficiencies introduced by abstractions in the libpcap
library.
In the Linux kernel, PACKET MMAP is specifically designed to facilitate the network
traffic capturing task. Without this socket interface, capturing each network packet requires
a system call. PACKET MMAP implements a configurable circular buffer between the user
and the kernel space – capturing a packet in the user space becomes a simple read operation
on the shared circular buffer [91]. This interface proved highly efficient on the AP70s. In
one test (simply capturing frames and counting, nothing else), this interface was able to
capture 7,063 frames per second (fps) with 25%-35% CPU usage and 3.3% frame loss. As
a comparison, running tcpdump with libpcap 0.9.8 under the same traffic load, froze the
AMs.
Data aggregation
Saluki uses UDP packets to forward the captured traffic back to our central servers. We
observed that if we pack only one frame in each UDP packet, the 100Mbps Ethernet con-
nection on the Aruba AP70 could not keep up when there was a high volume of wireless
traffic. We measured the maximum throughput under different UDP datagram sizes as
shown in Table 2.4. We can see that small UDP packets degrade the Ethernet throughput
greatly. Given that small frames, like a 14-byte ACK frame, are widely used in the IEEE
802.11 MAC layer, it is much more efficient to aggregate multiple frames and then send
them as a “combo” frame. A DIST combo frame has two sections: the header section and
18

Table 2.4: UDP throughput for different datagram sizeDatagram size (bytes) Throughput (KBps)
10 44.850 222.9
100 443.9200 879.8
1000 4155.61500 5326.72500 7443.33000 7875.5
the data section. The header section contains meta information about this combo frame
as listed in Table 2.5, and the data section holds multiple captured frames. When a new
frame is captured, Saluki appends the frame size and the frame content to the DIST combo
frame’s data section.
It is worth noting that there is a trade-off between the size of the combo frame and
the frame-receipt delay at the server side. While a bigger combo frame will use the Eth-
ernet connection more efficiently, bigger is not always better, especially for time-critical
applications, like wireless-network intrusion detection. For this reason, we defined two
adjustable criteria to decide when a combo frame should be sent: when the payload size
of a combo frame exceeds a size threshold, or when the time difference between the first
enclosed IEEE 802.11 frames and the current system clock exceeds a time threshold. In our
current implementation we set these two parameters to 14KB and 1 second, respectively.
Data compression
The DIST combo frame increases Saluki’s network efficiency, but we need to do better to
more efficiently use the shared 1 Gbps backbone Ethernet bandwidth, so we compress a
19

Table 2.5: DIST combo frame header definitionSize Meaning
ver 16 bits combo frame format version numberamid 16 bits which AM sent out this combo frameseqn 16 bits combo frame sequence numberfrn 16 bits number of frames inside this combo framedsz 32 bits size of uncompressed data in bytesmac 32 bytes message authentication code (optional)
combo frame before sending it. Given the Aruba AP70’s limited processing power, instead
of pursuing the maximum compression ratio, we aimed to find a lossless compressor that
has a good balance between processing speed and compression ratio.
After some background study, we focused on two variants of the Lempel-Ziv (LZ)
compression method [122]: QuickLZ [97] and FastLZ [43]. Compared to the standard LZ
compressor, these two variants trade compression ratio in favor of speed. It is important to
note that a compressor’s performance (compression ratio and speed) may vary when dealing
with different data. We chose QuickLZ because it had a more consistent performance on
our captured network data. In our experiments, a 14KB combo frame was compressed to
2.8-3.6KB by QuickLZ. The use of compressed combo frames saved more than 70% of
the load on the backbone network, compared with sending individual uncompressed frame
headers in each UDP packet.
Data encryption
As a basic security measure to protect the privacy of the network users whose traffic we
capture, we encrypted all traffic between each AM and the central servers.
Encryption ciphers can be classified into two categories based on their operation mode:
20

block ciphers and stream ciphers. A block cipher operates on data blocks, usually of fixed
size, and a stream cipher operates on a continuous stream of data. We chose a stream cipher
over a block cipher for two reasons: speed and security. First, a stream cipher generally
will be much faster than a block cipher. Second, when using the same encryption key,
there is a strict one-to-one mapping between the plaintext and the ciphertext for a block
cipher, whereas there is no such one-to-one mapping for a stream cipher [56]. For DIST,
this property of block ciphers could be a potential security flaw, because all possible values
in many fields of Radiotap header and IEEE 802.11 header can be easily enumerated, and
thus a block cipher may facilitate attacks by providing a much smaller search space than a
stream cipher.
We evaluated all stream ciphers from the eSTREAM project [102] and the SNOW 2.0
cipher [40]. The best two ciphers were Rabbit and SNOW 2.0, which have been accepted as
ISO standard stream ciphers (ISO/IEC 18033-4). Both of them support 128-bit encryption
and are much faster than RC4 and AES in counter mode [102] .
We evaluated an assembly-language implementation of the Rabbit cipher optimized for
the MIPS 4Kc processor, whereas SNOW 2.0 is implemented in the C language and was
not specifically optimized for this processor. Since our goal was to transmit the protected
data most efficiently, we tried the ciphers both without compression and in combination
with compression. We observed the following.
1. For stream ciphers, Rabbit emerged as a winner on the Aruba AP70, surpassing
SNOW 2.0. When executing 5,000 loops on 14KB data, Rabbit took 5.33–5.55 seconds,
whereas SNOW 2.0 took 7.42–7.73 seconds.
21
2. Adding compression decreases the total processing time, because there were fewer
bytes to encrypt. In effect, compression was computationally “free”.
Securely transmitting 5000 14KB combo frames (each combo frame may contain tens
to hundreds of captured Radiotap and IEEE 802.11 frames) to a DIST server took 6.2–6.4
seconds, which encompassed two operations: encryption and UDP forwarding. The load
on the network averaged 14KB per combo frame. If we compressed these combo frames
first, however, handling them took less time, namely 5.3–5.4 seconds for three operations:
compression + encryption + UDP forwarding. The required network bandwidth was also
reduced by more than 70% (from 14KB per combo frame to 2.8-3.4KB per combo frame).
This result illustrates that an efficient compression not only saves network bandwidth, but
also reduces CPU time needed for encryption and UDP forwarding. If needed, we could
set the size of the uncompressed DIST combo frame to be larger than 14KB. Although
this change may improve the network throughput (Table 2.4), it comes at the expense of
increased delay at the server side.
Data authenticity and integrity
Encryption provides data confidentiality but does not ensure data authenticity and integrity.
To achieve a higher level of security, we integrated an optional HMAC-SHA256 component
into Saluki to ensure both authenticity and integrity of the data exchanged between Saluki
and servers.
HMAC-SHA256 is one type of HMAC (Hash-based Message Authentication Code)
that uses a SHA-256 cryptographic hash function [6, 47]. The input to HMAC has two
22

parts: the data to be processed, and a secret key. HMAC’s strength depends on the size
of secret key. Currently we use a 128-bit secret key, but this key can be extended to a
longer length, such as 256 bits, to improve HMAC’s security against a brute-force attack.
The output of HMAC-SHA256 is a 256-bit MAC (Message Authentication Code). For the
collected network traces transmitted from AMs to servers, this 256-bit MAC is generated
by Saluki running on AMs and verified by the receiver program, DISTSANI, running on
servers.
To accurately quantify HMAC-SHA256’s performance impact, we developed a bench-
mark program derived from Olivier Gay’s HMAC-SHA2 implementation [47]; Figure 2.3
shows the evaluation results. The x axis in Figure 2.3 is the size of data block processed
by HMAC-SHA256 ranging from 1,000 bytes to 5,000 bytes, and the y axis is the time
used by HMAC-SHA256 to process such a data block. The experiment was executed for
50,000 loops at each data-block size, and we plotted the error bars for 5 different block
sizes. At most locations, the upper and lower bar were cluttered together. We can see that
with a constant overhead, HMAC-SHA256 has a linear performance on input data. Using
the information in this figure, we can estimate that when the frame capture rate is 5,500
fps, capture length is 192 bytes for each frame, and an uncompressed DIST combo frame
is 14,000 bytes, HMAC-SHA256’s CPU usage on AP70 will be 5.24%, 7.53%, and 9.82%
for 2,000, 3,000, and 4,000 bytes of compressed DIST combo frames respectively.
23

Figure 2.3: HMAC-SHA256’s processing speed on AP70.
Multithreading
So far we have introduced four core components of the Saluki sniffing program: cap-
ture interface, data aggregation, compression, and encryption. The final important task
is to assemble them efficiently. Each of these components is relatively self-contained and
can work independently from other components. For example, capturing frames from the
Wi-Fi interface and forwarding DIST combo frames via Ethernet are I/O-intensive opera-
tions, while data compression and encryption are CPU-intensive operations. This observa-
tion inspired us to fit these components into a multithreading pipeline. We experimented
with several combinations of component and thread placement, and Figure 2.4 shows our
final and optimal configuration.
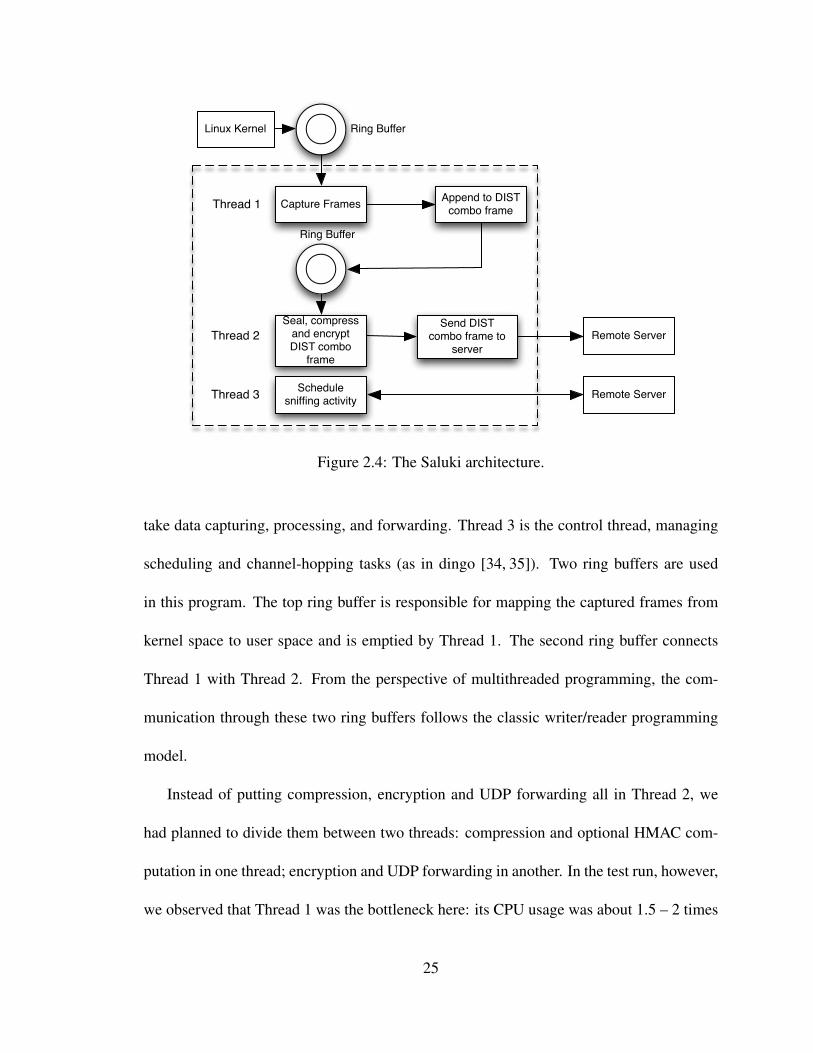
From Figure 2.4, we see that Saluki has three threads. Thread 1 and Thread 2 under-
24
Linux Kernel
Capture Frames Append to DIST combo frame
Seal, compress and encrypt DIST combo
frame
Send DIST combo frame to
server
Schedule sniffing activity
A
Remote Server
Remote Server
Ring Buffer
Ring Buffer
A
Thread 1
Thread 3
Thread 2
Figure 2.4: The Saluki architecture.
take data capturing, processing, and forwarding. Thread 3 is the control thread, managing
scheduling and channel-hopping tasks (as in dingo [34, 35]). Two ring buffers are used
in this program. The top ring buffer is responsible for mapping the captured frames from
kernel space to user space and is emptied by Thread 1. The second ring buffer connects
Thread 1 with Thread 2. From the perspective of multithreaded programming, the com-
munication through these two ring buffers follows the classic writer/reader programming
model.
Instead of putting compression, encryption and UDP forwarding all in Thread 2, we
had planned to divide them between two threads: compression and optional HMAC com-
putation in one thread; encryption and UDP forwarding in another. In the test run, however,
we observed that Thread 1 was the bottleneck here: its CPU usage was about 1.5 – 2 times
25

Combo frame header
802.11 frame802.11 frame802.11 frame802.11 frame802.11 frame
Combo frame header
Compressed content
Combo frame header
802.11 frame802.11 frame
MAC
Compressed content
Combo frame headerMAC
Encrypted and
compressed content
1. QuickLZ 2. HMAC-SHA256 3. Rabbit
Figure 2.5: The data flow inside Saluki.
of Thread 2 even when HMAC is turned on in Thread 2. Due to this observation, we did
not split Thread 2 further.
Figure 2.5 shows the data flow inside Saluki when all the features (data aggregation,
encryption, compression and the optional HMAC computation) are turned on.
2.3.2 DISTSANI
As noted in Section 2.2.2, we take the position that if our captured data are not encrypted
then they must be sanitized. In DIST, the transformation from the encrypted data to the
sanitized data happens inside DISTSANI. Depicted as the “sanitizer” in Figure 2.2, DIST-
SANI is in charge of parsing the received DIST combo frames, sanitizing each individual
802.11 frame, and distributing sanitized 802.11 frames to their correct destinations. These
three functionalities are implemented as three components in DISTSANI.
Parsing and Distributing Components
The parsing component receives the DIST combo frames sent by Saluki and mirrors the
operation of Saluki: decrypt a DIST combo frame using the Rabbit algorithm, verify the
26

HMAC (if any), decompress it using the QuickLZ algorithm, and split this combo frame
into individual 802.11 frames. The distributing component packs the processed 802.11
frames using pcap format and outputs them to different destinations, according to user
specifications – either to a trace file on local hard drives or to a live UDP stream forwarded
to data subscribers. For the same input traffic, different users may receive different outputs
from DISTSANI because they can choose different ways to sanitize the same captured data.
Sanitizing Component
DIST requires that all data available to data subscribers (except for real-time attack detec-
tion) or stored to persistent storage must be sanitized. This dictates that the DIST sanitiza-
tion process must be online and be fast enough to keep up with the data capturing speed,
otherwise much captured data will be lost. Although many sanitization algorithms have
been proposed, few of them have an online version [118]. DISTSANI uses a network trace
sanitization library, libdistsanitize, developed by Chris McDonald. Of note, our sanitiza-
tion scheme only sanitizes MAC and SSID addresses [15], and not any other addresses or
identifiers that appear in frame payloads, such IP addresses, TCP ports, or email addresses.
The primary reason for this limitation is that DIST only captures and stores MAC layer
headers together with physical-layer interface details, such as channel frequency and signal
strength. Moreover, most contemporary wireless networks encrypt everything above the
MAC layer, making payload sanitization both impossible and unnecessary.
27

2.4 Evaluation
We undertook two classes of experiments to evaluate DIST: first, a controlled-environment
evaluation, in which we evaluated Saluki’s extreme performance; second, a real-world in-
production evaluation, in which we ran the complete DIST system to monitor Dartmouth’s
production WLAN.
2.4.1 Controlled environment evaluation
In this section, we evaluate Saluki in terms of memory usage, CPU usage, frame-capture
rate, and frame-loss ratio. Because tcpdump, Kismet and dingo are all built on libpcap, and
tcpdump is the simplest (and should also be the fastest) among them, we used tcpdump as
the baseline for comparison. To release tcpdump’s maximum potential [74], we directed its
output to /dev/null instead of the screen or a file.2 We set the capture size for tcpdump
and Saluki to 192 bytes.
We set up two laptops (each a Thinkpad T42 with 1.6GHz Pentium M CPU and 1.5GB
RAM) to act as the IEEE 802.11g Access Point and the client respectively. These two
laptops were placed about 2 meters (6 feet) from each other, and one Aruba AP70 sniffer
was placed halfway between them. We used Iperf [54] as the traffic generator running on
two laptops.
We used the Linux command “top” to query memory usage. During execution, Saluki
occupied 660KB RAM, and tcpdump used 740KB RAM. Note that, since tcpdump is
2That is, tcpdump -i ath0 -n -s 192 -w /dev/null
28

dynamically linked with libpcap, its actual memory usage would be larger than 740KB
if the memory used by libpcap were counted. Of the 660KB RAM consumed by Saluki,
much of it was allocated to various buffers for better performance. For example, the size
of the second ring buffer (connecting Thread 1 and Thread 2) was about 90KB, and the
sizes of the compression and encryption buffers were about 30KB each. If needed, one can
reduce Saluki’s memory usage by shrinking these buffers.
Figures 2.6–2.8 show the performance in terms of frame-capture rate, frame-loss ratio
and CPU usage. The frame-capture rate measures the speed that a sniffing program captures
frames in frames per second (fps). The frame-loss ratio is the ratio of the number of lost
frames reported by the OS kernel to the sum of the number of captured frames and lost
frames. Since Saluki is a multithreaded program, its CPU usage in Figure 2.8 is the sum of
all its threads’ usage.
We used Iperf to generate constant-bit-rate (CBR) UDP traffic with 500B (500-byte)
and 1000B (1000-byte) datagrams under five UDP bandwidth settings: 10 Mbps, 15 Mbps,
20 Mbps, 25 Mbps and 30 Mbps. Each experiment ran for 200 seconds. Two things
are worth noting. First, these five bandwidth settings are the parameters given to Iperf;
however, in reality, the actual bandwidth could be a bit lower than the setting. Second, for
a given bandwidth setting, Iperf must generate many more small-size packets than large
ones to achieve that bandwidth. Due to the limited CPU power on the laptop, we could not
generate sufficient 500B UDP packets to reach 30Mbps. Thus we do not provide a result
for that setting.
Figure 2.6 shows that Saluki captured frames much faster than tcpdump under all set-
29

10 15 20 25 300
500
1000
1500
2000
2500
3000
3500
4000
4500
5000
5500
Iperf UDP bandwidth setting (Mbps)
Fra
me
−ca
ptu
re r
ate
(fp
s)
Saluki, 500B datagram
tcpdump, 500B datagram
Saluki, 1000B datagram
tcpdump, 1000B datagram
Figure 2.6: Comparison of frame-capture rate.
10 15 20 25 30
0
10%
20%
30%
40%
50%
60%
70%
80%
90%
100%
Iperf UDP bandwidth setting (Mbps)
Fra
me
−lo
ss r
atio
Saluki, 500B datagram
tcpdump, 500B datagram
Saluki, 1000B datagram
tcpdump, 1000B datagram
Figure 2.7: Comparison of frame-loss ratio.
30

10 15 20 25 300
10%
20%
30%
40%
50%
60%
70%
80%
90%
100%
Iperf UDP bandwidth setting (Mbps)
CP
U u
sa
ge
Saluki, 500B datagram
tcpdump, 500B datagram
Saluki, 1000B datagram
tcpdump, 1000B datagram
Figure 2.8: Comparison of CPU usage.
tings even though Saluki needed to complete much more work (data compression, data
encryption, and UDP forwarding) than tcpdump. Saluki’s advantage became more obvi-
ous when dealing with high-speed traffic. When Saluki captured 5,488 fps, tcpdump only
captured 1,802 fps. In this case, Saluki captured more than three times as many frames as
tcpdump did.
Figure 2.7 demonstrates that Saluki’s frame-loss ratio was significantly lower than tcp-
dump’s. For UDP traffic with 1000B datagrams, Saluki’s frame-loss ratio was nearly al-
ways zero (except for 0.028% under 30Mbps), while tcpdump could lose around 40% of
frames. For UDP traffic with 500B datagrams, the disparity was more obvious (8.6% vs.
67.4% in the worst case).
We make the following interesting observation: by comparing “tcpdump, 1000B data-
gram” to “tcpdump, 500B datagram” in Figure 2.6, we can see that tcpdump usually cap-
31

tured 500B frames at a lower rate than it captured 1000B frames, even though Iperf sent
them at a higher rate. In Figure 2.7 one can see that tcpdump lost a much higher fraction
of 500B frames. Our hypothesis is that tcpdump dropped many “half-processed” frames
when new frames arrived so quickly.
Figure 2.8 summarizes Saluki and tcpdump’s CPU usage. When there was not too much
traffic, their CPU usages were comparable. When traffic volume was high, Saluki’s CPU
usage was higher than tcpdump’s. Considering Saluki captured more than three times as
many frames and included other work, this amount of increased CPU usage, however, is
reasonable.
It is worth noting that the above evaluation results were achieved when the optional
HMAC computation was turned off. When this feature was turned on, no noticeable per-
formance changes (frame-capture rate, frame-loss ratio) were observed except that Saluki’s
CPU usage was increased by about 7% (from around 80% to around 87%) under the busiest
evaluation condition (25 Mbps UDP, 500B datagram).
2.4.2 In-production evaluation
To evaluate the performance of DIST, we continuously monitored Dartmouth’s production
wireless network for 62 days (from January 4, 2011 to March 6, 2011); 206 out of 210 AMs
were used for this evaluation (the remaining 4 AMs were reserved for debugging purposes).
We ran Saluki on both radio interfaces of each AM, in total providing 412 Saluki instances
on 412 radio interfaces. During the time span of this experiment, Dartmouth’s wireless
32

Table 2.6: In-production experiment configurationStart time 00:00, Jan 4, 2011Duration 62 daysRadio interfaces 412AMs 206Channel sampling equal-time samplingSampling interval 0.2 secondsChannels monitored 11 802.11b/g channelsCollected trace file size 3.7 terabytes (gzip compressed)
network only worked in IEEE 802.11b/g mode. To cover eleven IEEE 802.11b/g channels
ranging from 1 to 11, we configured Saluki to use equal-time channel sampling. Saluki
would jump to a new channel after dwelling on one channel for 0.2 seconds, and thus one
iteration took 2.4 seconds. To minimize the capturing overlap between two radio interfaces
on the same AM, the two Saluki instances running on them were set to listen to different
channels at any given time, leaving a channel distance of six between the radios. While our
software may easily be extended to cover the many additional channels provided by IEEE
802.11n, we have not yet had opportunity to extend and test DIST in an updated network.
Table 2.6 summarizes the experiment configuration.
We ran a single instance of DISTSANI on a server to receive and process all traffic cap-
tured from 412 Saluki instances. This server has two 3.0GHz Intel Xeon CPUs and 4GB
RAM. DISTSANI wrote the processed network traces in pcap file format to a 6-terabyte
RAID attached to this server. It is worth noting that, for privacy reasons, Dartmouth only
allows us to save IEEE 802.11 frame headers (no IP, TCP/UDP headers) to persistent stor-
age [15]. In total, 3.7 terabytes of compressed pcap trace files were generated in this 62-
day experiment (in uncompressed form, these trace files would occupy about 24 terabytes).
33

DISTSANI’s CPU usage was between 14% to 25% during the entire experiment. With the
HMAC-SHA256 turned on, an extra 2.40% – 4.49% CPU usage would be added to the
above numbers. Such low CPU usage validates DISTANI’s online processing capability in
a production environment.
Figure 2.9 gives an overall picture about the frames processed by the DIST system.
The top subplot shows the frame rate of DIST combo frames received by DISTSANI.
Since each DIST combo frame may carry hundreds of IEEE 802.11 frames, the bottom
subplot of Figure 2.9 shows the frame rate of the IEEE 802.11 frames encapsulated in
the received DIST combo frames. In Figure 2.9 and subsequent similar figures, we use a
“boxplot” style to project all measurement results in this 62-day experiment onto a typ-
ical 24-hour-calendar-day axis. Each box in a boxplot depicts 5-number summaries for
each non-overlapping 15-minute time window: the upper quartile (the top edge of a blue
rectangle), the lower quartile (the bottom edge of a blue rectangle), the median (the red
line between the top and bottom edges), the maximum (the top point of the black-dotted
whisker line), and the minimum (the bottom point of the black-dotted whisker line). Here
we set the maximum whisker length to 1.5, and thus the red crosses lying outside of any
box are outliers which imply that they are out of 99.3% coverage if the data are normally
distributed.
In Figure 2.9, the frame rate of DIST combo frames was relatively stable over time.
It mainly varied between 410 fps (frames per second) and 440 fps. Since there were 412
Saluki instances, we observed that each Saluki instance transmitted about one DIST combo
frame per second, corresponding well to the 1-second frame-holding threshold we set in
34

12
AM
2 A
M4
AM
6 A
M8
AM
10
AM
12
PM
2 P
M4
PM
6 P
M8
PM
10
PM
12
AM
40
0
41
0
42
0
43
0
44
0
45
0
Tim
e
DIST combo frames per second
Re
ce
ive
d D
IST
co
mb
o fra
me
s
12
AM
2 A
M4
AM
6 A
M8
AM
10
AM
12
AM
2 P
M4
PM
6 P
M8
PM
10
PM
12
AM
20
,00
0
25
,00
0
30
,00
0
35
,00
0
40
,00
0
45
,00
0
Tim
e
802.11 frames per second
Ca
ptu
red
IEE
E 8
02
.11
fram
es
Figure 2.9: Captured 802.11 frames and received DIST combo frames.
35
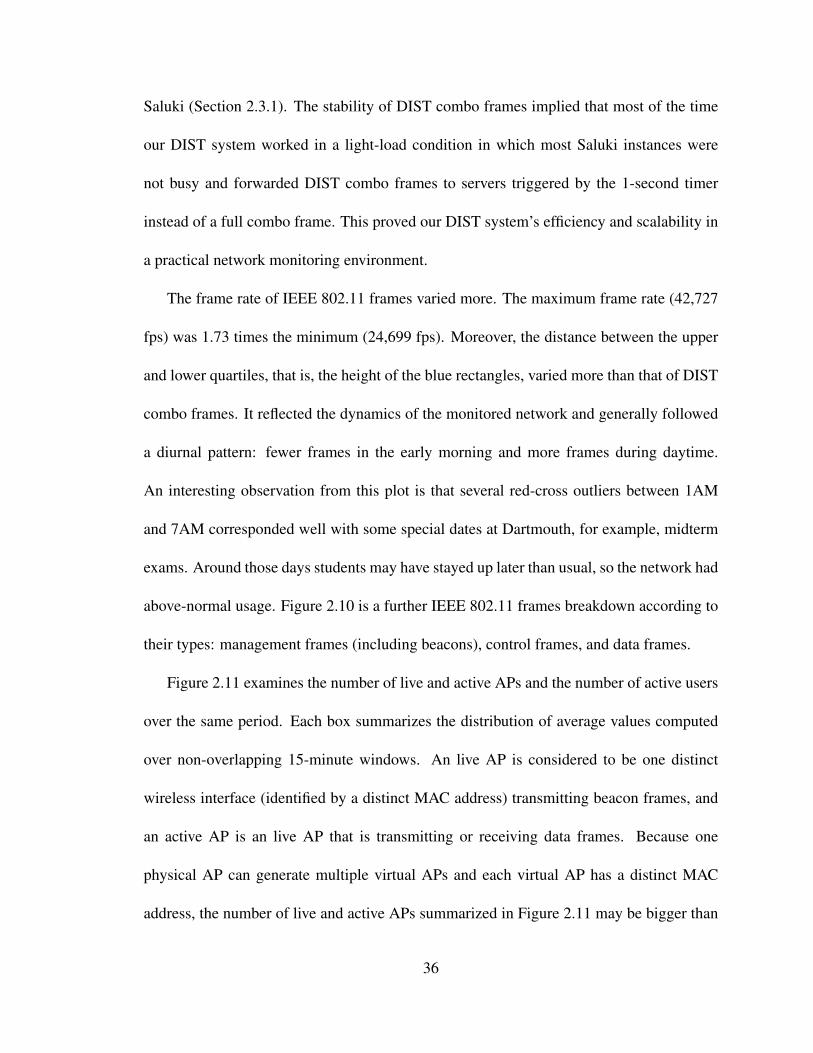
Saluki (Section 2.3.1). The stability of DIST combo frames implied that most of the time
our DIST system worked in a light-load condition in which most Saluki instances were
not busy and forwarded DIST combo frames to servers triggered by the 1-second timer
instead of a full combo frame. This proved our DIST system’s efficiency and scalability in
a practical network monitoring environment.
The frame rate of IEEE 802.11 frames varied more. The maximum frame rate (42,727
fps) was 1.73 times the minimum (24,699 fps). Moreover, the distance between the upper
and lower quartiles, that is, the height of the blue rectangles, varied more than that of DIST
combo frames. It reflected the dynamics of the monitored network and generally followed
a diurnal pattern: fewer frames in the early morning and more frames during daytime.
An interesting observation from this plot is that several red-cross outliers between 1AM
and 7AM corresponded well with some special dates at Dartmouth, for example, midterm
exams. Around those days students may have stayed up later than usual, so the network had
above-normal usage. Figure 2.10 is a further IEEE 802.11 frames breakdown according to
their types: management frames (including beacons), control frames, and data frames.
Figure 2.11 examines the number of live and active APs and the number of active users
over the same period. Each box summarizes the distribution of average values computed
over non-overlapping 15-minute windows. An live AP is considered to be one distinct
wireless interface (identified by a distinct MAC address) transmitting beacon frames, and
an active AP is an live AP that is transmitting or receiving data frames. Because one
physical AP can generate multiple virtual APs and each virtual AP has a distinct MAC
address, the number of live and active APs summarized in Figure 2.11 may be bigger than
36

12 A
M2 A
M4 A
M6 A
M8 A
M10 A
M12 P
M2 P
M4 P
M6 P
M8 P
M10 P
M12 A
M20,0
00
22,0
00
24,0
00
26,0
00
28,0
00
Tim
e
Frames per second
IEE
E 8
02.1
1 m
anagem
ent fra
mes
12 A
M2 A
M4 A
M6 A
M8 A
M10 A
M12 P
M2 P
M4 P
M6 P
M8 P
M10 P
M12 A
M0
2,5
00
5,0
00
7,5
00
10,0
00
12,5
00
Tim
e
Frames per second
IEE
E 8
02.1
1 c
ontro
l fram
es
12 A
M2 A
M4 A
M6 A
M8 A
M10 A
M12 P
M2 P
M4 P
M6 P
M8 P
M10 P
M12 P
M0
2,5
00
5,0
00
7,5
00
10,0
00
12,5
00
Tim
e
Frames per second
IEE
E 8
02.1
1 d
ata
fram
es
Figure 2.10: IEEE 802.11 frames breakdown.
37

12 A
M2 A
M4 A
M6 A
M8 A
M10 A
M12 P
M2 P
M4 P
M6 P
M8 P
M10 P
M12 A
M1,5
00
1,7
00
1,9
00
2,1
00
Liv
e A
Ps
Tim
e
Count
12 A
M2 A
M4 A
M6 A
M8 A
M10 A
M12 P
M2 P
M4 P
M6 P
M8 P
M10 P
M12 A
M0
400
800
1,2
00
1,6
00
Activ
e A
Ps
Tim
e
Count
12 A
M2 A
M4 A
M6 A
M8 A
M10 A
M12 P
M2 P
M4 P
M6 P
M8 P
M10 P
M12 A
M0
400
800
1,2
00
1,6
00
Activ
e u
sers
Tim
e
Count
Figure 2.11: Live/active APs and active users.
38

the number of physical APs installed on our campus. An active user is a wireless card
that is exchanging data frames with an AP. It is possible that a wireless card may have
been used in multiple devices, a device has been used by multiple people, or a person
may have multiple wireless devices, but we equate “active card” with “active user” for
the simplicity of expression. Two interesting observations can be drawn from Figure 2.11.
First, the variation of active users shown in Figure 2.11 followed a diurnal pattern as seen in
Figure 2.9. Second, the ratio between the active APs and the live APs was low. Even at the
peak time, only about 60% of APs were actively used. This result implies that Dartmouth’s
production wireless network has substantial redundancy for coverage reasons, and in the
future it may be possible to employ some energy-saving management strategies without
jeopardizing the user experience.
2.5 DIST Active Protection System
As discussed in Section 2.3.1 and Section 2.4.1, Saluki reduces the CPU demands on each
AM. Each AM can now collect a more faithful network trace under high traffic loads,
or undertake additional tasks providing more fine-grained monitoring or protection of the
wireless network. Moreover, as our Aruba AP70 monitors have two radio cards, we can
collect traffic with one while transmitting protective or interrogative frame sequences with
the other.
In this section we detail one representative application of DIST: an Active Protection
System (APS). While many techniques have been developed to detect potential security
39
threats on a wireless network, there are few, if any, techniques to protect normal users
against these threats. For a wired network, a network administrator can block a station’s
access to the network by port blocking, but this is not possible for a wireless network due to
the open medium. An adversary can send whatever he wants over the air; even if a wireless
IDS can detect the malicious behavior, it cannot stop it. The goal of the DIST APS is
to provide the wireless network administrator with a tool to mitigate the ongoing security
threats.
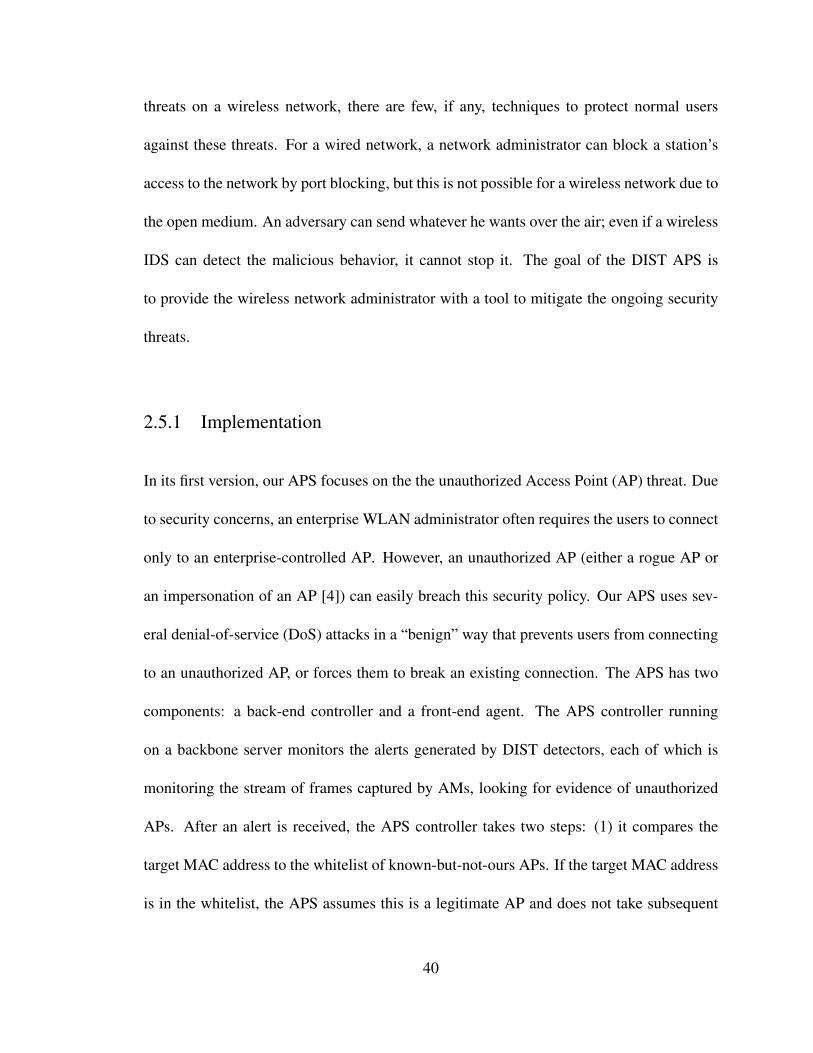
2.5.1 Implementation
In its first version, our APS focuses on the the unauthorized Access Point (AP) threat. Due
to security concerns, an enterprise WLAN administrator often requires the users to connect
only to an enterprise-controlled AP. However, an unauthorized AP (either a rogue AP or
an impersonation of an AP [4]) can easily breach this security policy. Our APS uses sev-
eral denial-of-service (DoS) attacks in a “benign” way that prevents users from connecting
to an unauthorized AP, or forces them to break an existing connection. The APS has two
components: a back-end controller and a front-end agent. The APS controller running
on a backbone server monitors the alerts generated by DIST detectors, each of which is
monitoring the stream of frames captured by AMs, looking for evidence of unauthorized
APs. After an alert is received, the APS controller takes two steps: (1) it compares the
target MAC address to the whitelist of known-but-not-ours APs. If the target MAC address
is in the whitelist, the APS assumes this is a legitimate AP and does not take subsequent
40

steps. Otherwise, APS will proceed to the next step: (2) it determines the actions (accord-
ing to predefined rules) and the set of AMs that should participate. Then it composes and
sends commands to the APS front-end agent running on each involved AM. An APS com-
mand includes at least the following four fields: target MAC address, channel, action, and
duration (such a command is protected by the Rabbit cipher and HMAC-SHA256 (Sec-
tion 2.3.1) to ensure data confidentiality, authenticity, and integrity). The APS agent parses
the command, prepares the interface and launches the attack against the specified target. It
is worth noting that, even though an adversary can move to other channels or other places
when he discovers the APS, it is difficult to bypass the system entirely because of the full-
spectrum coverage and broad deployment of DIST. Currently the APS agents are running
on DIST AMs, but technically it is possible to integrate them into production APs to save
cost.
2.5.2 Evaluation
We evaluated the DIST APS using the metrics of response time and protection effective-
ness.
Response time. A quick reaction is important to protect users from unauthorized APs.
The response time is the time between the moment when the APS controller receives an
alert and the moment when the APS agent transmits its first attack frame. Because our AMs
are remotely deployed around Dartmouth campus, the response time is the sum of (1) the
APS controller’s processing time, (2) the network delay, and (3) the APS agent’s processing
41

time. The measured average network delay is 0.372 milliseconds, and the average process-
ing time for APS controller and agent are 0.025 milliseconds and 350.347 milliseconds
respectively. The average DIST APS response time was thus about 351 milliseconds.
Protection effectiveness. We employed two DoS attacks to interrupt the operation of an
unauthorized AP: a Queensland DoS attack [1] and a De-authentication attack [10]. A
Queensland DoS attack is a blind-jamming attack that can disable all Wi-Fi activity on
the given channel in the immediate vicinity. In our lab environment, we observed that its
effective radius reached at least 50 feet. Compared to the Queensland DoS attack, the De-
authentication attack is more “intelligent” because it will only be effective on the target
device and will not interfere with other devices on the same channel.
Figure 2.12 shows how the De-authentication attack affects both UDP and TCP traffic
under different attack intensities. The purpose of this experiment is not only to evaluate
the effectiveness with which the De-authentication attack disconnects users from unautho-
rized APs, but more importantly it is to estimate the cost for APS to successfully launch
such an attack. To simulate a busy channel, we tried to transmit as much UDP and TCP
traffic as possible. Obviously, UDP traffic was much more robust than TCP traffic against
DoS attack. The attack was launched between t = 10 and t = 20 in this plot. In Fig-
ure 2.12, a 200-fps De-authentication attack completely blocked the TCP traffic while, for
UDP, it required 400 fps to do so. We also observed that UDP recovered much quicker
than TCP from the attack: 1 second vs. 4–5 seconds. From the cost perspective, because
one De-authentication frame is only 58 bytes, one APS agent only occupies 185.6 KBps
42

During attack
Figure 2.12: Evaluation of De-authentication DoS attack.
(≈1.5 Mbps) bandwidth when sending 400 De-authentication frames per second. At a con-
stant cost, such an attack can protect all nearby clients from the unauthorized AP, no matter
how many clients.
2.6 Summary
As an important edge of the Internet, enterprise-wide WLANs are increasingly used for
many mission-critical tasks. Monitoring such WLANs is important to understanding the
performance and security aspects of the Internet experience. However, monitoring a large-
scale WLAN is a difficult undertaking. In this chapter we introduce the design, implemen-
tation and evaluation of DIST, a large-scale general-purpose WLAN monitoring system.
43

As the successor of MAP, DIST has faced many challenges related to efficiency, scalabil-
ity, security, and privacy. Saluki and DISTSANI are our solutions to these challenges. The
combined strength of these subsystems make DIST an efficient and scalable WLAN mon-
itoring system, which has been validated by both controlled and real-world evaluations.
Although Saluki and DISTSANI have been designed to fit the special needs of DIST, they
are also applicable to general WLAN measurement tasks with variable scales.
DIST provides us a unique platform to study a large-scale WLAN and its users at both
macro and micro levels. DIST’s wide coverage facilitates community-oriented network
research, such as how a large body of users use the network and how the users interact with
each other. Currently we are building a system that uses the high-resolution data captured
by DIST to help the computing service at Dartmouth to diagnose malfunctions, and detect
any abnormal behaviors that would disrupt or degrade the network operation.
It is a daunting task to build and operate a large-scale network measurement infrastruc-
ture like DIST. The prohibitive investment of time and effort restricts the ability to capture
meaningful amounts of WLAN traces to larger or well-funded organizations. In such an
environment, sharing the collected network traces is essential to promote wireless network
research. In the following chapters, we will discuss the challenges, state-of-art techniques,
and our contributions in promoting network trace sharing.
44

Chapter 3
Obstacles and opportunities for networktrace sanitization
Network researchers benefit tremendously from access to traces of production net-
works, and several repositories of such network traces exist. By their very nature, these
traces capture sensitive business processes and personal activity. Furthermore, traces con-
tain operational information about the target network, such as its structure, identity of the
network provider, or addresses of important servers. To protect private or proprietary in-
formation, researchers must “sanitize” a trace before sharing it.
In this chapter, we survey the growing body of research that addresses the risks, meth-
ods, and evaluation of network trace sanitization. We distinguish the terms “anonymiza-
tion” and “sanitization”: “anonymization” attempts to protect the privacy of network users,
and “sanitization” attempts to protect the privacy of network users and the secrecy of oper-
ational network information. In this sense, “sanitization” is a superset of “anonymization”.
In some applications when we only care about protecting the privacy of network users, we
may use these two terms interchangeably. Research on the risks of network trace sanitiza-
tion attempts to extract information from published network traces, while research on san-
45

itization methods investigates approaches that may protect against such attacks. Although
researchers have recently proposed both quantitative and qualitative methods to evaluate the
effectiveness of sanitization methods, such work has several shortcomings, some of which
we highlight in a discussion of open problems. Sanitizing and sharing network traces,
however challenging, remains an important method for advancing network-based research.
This survey is a joint work with Jihwang Yeo and Michael E. Locasto. I am grateful for
their contributions, particularly in Section 3.1.4, Section 3.1.5, and Section 3.4.
3.1 Background
This section introduces some background information about: challenges for trace collection
and sharing, real-world network trace sharing efforts, terminology used in this chapter, and
database sanitization and privacy-preserving data ming.
3.1.1 Challenges for trace collection and sharing
The daunting challenge of creating and maintaining a network monitoring infrastructure
involves obtaining legal and administrative approval, reaching out to the campus or cor-
porate community, implementing extensive security and control measures, maintaining in-
ternal records and documentation, and (sometimes) undergoing external security audits.
This investment of time and effort can restrict the ability to capture meaningful amounts
of network data to larger or well-funded organizations. In such an environment, sharing
becomes an essential feature of networking research. Yet, the legal, ethical, and privacy
46

issues of capturing and sharing production network traces threatens to chill such sharing
and to eliminate this form of applied research.1
Many of the relevant laws are unclear about the legality of capturing and releasing
network traces [109]. Even if such laws were amended to include specific exceptions for
research use of network traces, as some advocate [19], individual privacy would still need
protection and organizations would still wish to protect operational details. For example,
network administrators may wish to share data for operational, not research purposes, but
privacy concerns remain. Moreover, the network operator may wish to protect other in-
formation of proprietary or operational significance, such as the structure of the network,
the identity of important servers, or how the network itself responds to particular types of
threats.
We recognize the inherent trade-off between privacy and usefulness. Sanitization
methods intentionally degrade the quality of a network trace to protect against trace users
who actively seek to extract sensitive information from the trace, and inevitably reduce
the type and content of features useful for non-malicious research. It is difficult to simul-
taneously achieve privacy and usefulness. A relationship exists between the amount of
information shared and the level of risk an organization or individual assumes in sharing
that information. Methods of sanitization or anonymization seek to bound the level of risk
as information sharing increases, but they can also bound the utility of the resulting data.
1Some point out that simulation provides an alternative to using real traffic data. For certain types ofresearch,(e.g., anomaly-based intrusion detection) simulation is unlikely to prove useful, as the details of areal data sample are important, not just those properties derived from aggregate statistics [108].
47

3.1.2 Real-world network trace sharing efforts
Although they may seem abstract, privacy concerns are far from theoretical, and recent
incidents involving real data sets have increased such concerns. The release of and sub-
sequent de-anonymization attacks against the AOL data set [48], the release of the Enron
email archive [41], and the de-anonymization attack on the Netflix competition data set [85]
show how easily simple methods of content anonymization can be broken and highlight the
risk posed by data once considered “private” or confidential.
Yet, the utility of sharing traces is so compelling that several efforts exist to share vary-
ing amounts and types of network trace data, including CAIDA, CRAWDAD, and PRE-
DICT.
CAIDA (Cooperative Association for Internet Data Analysis) [20] collects several dif-
ferent types of network data (including topology, security, traffic characteristics, routing,
real time monitors, and performance related data) at geographically and topologically di-
verse locations. CAIDA makes this data available to the research community while pre-
serving the data donors’ privacy. Currently its data repository has more than 230,000 data
files. DatCat [31] is a CAIDA project providing the Internet Measurement Data Catalog
(IMDC), a searchable registry of information about network measurement datasets. It aims
to provide a searchable index of available network datasets and to enhance the documenta-
tion of the dataset via a public annotation system.
CRAWDAD (Community Resource for Archiving Wireless Data At Dartmouth) [29]
provides a collection of trace data from wireless-network and mobile-computing researchers
48

around the world. As of July 2011, CRAWDAD.org has over 3,151 users from 77 coun-
tries. It now makes 70 data sets and 23 tool sets available through the archive, with several
more in the pipeline. Over 300 papers have been published with or about CRAWDAD
data sets. In addition, a Dartmouth-wide wireless monitoring infrastructure has contributed
to the CRAWDAD repository since 2001.
PREDICT (Protected Repository for the Defense of Infrastructure Against Cyber Threats) [96]
is sponsored by the Department of Homeland Security (DHS) Science and Technology
(S&T) directorate. The datasets in this repository, which include security-relevant network
traces and host logs, are only available to qualified cyber defense researchers and only in
the United States.
The DSHIELD [38] repository of firewall logs is one of the earliest examples of sharing
intrusion alert information. Newer sharing efforts like OpenPacket.org tend to have a more
limited number of datasets.
3.1.3 Terminology
Since this chapter assumes a focus on network traces, rather than other types of data collec-
tions (notably databases), our terminology reflects this bias by referring to packets, headers,
and other network-related terms. Within the world of network traces, however, many spe-
cific types exist (such as SNMP logs, IP packet dumps, or Netflow traces), each with their
own organization, data types, and information peculiarities. The content of a network trace
includes not only the information from a network protocol (such as IP and MAC addresses,
49

or port numbers), but also other metadata such as timestamps, session duration, or a wire-
less device’s geographical coordinates. Such diversity of network traces makes it difficult
or impossible to construct a universal algorithm for sanitizing all types of network traces.
Moreover, due to a lack of understanding of (or documentation about) what information a
trace might contain, trace sanitization can be much more challenging than it might initially
appear.
We assume a general model for a network trace that holds a series of records. Each
record contains a tuple of several fields. Each component represents a specific feature, such
as source and destination MAC address, source and destination IP address, and timestamp.
Sanitization techniques can be applied independently to specific fields or sets of fields,
and can include intra-record methods (hiding correlations between fields of a single record),
inter-record methods (hiding correlations between multiple records in a trace), and inter-
trace methods (hiding correlations between traces captured from different devices or at
different times). Section 3.2 gives a detailed review of the sanitization techniques, es-
pecially IP-address anonymization techniques, and introduces several state-of-art network
trace sanitization tools.
De-sanitization techniques extract sensitive information from the sanitized network
traces. These techniques can be classified into two categories: direct de-sanitization attacks
and indirect de-sanitization attacks. While a direct de-sanitization attack exploits the flaws
and limitations of some sanitization techniques, an indirect attack often leverages implicit
information from the sanitized trace or auxiliary information from other sources. As an in-
teresting example of the indirect attack, a CRAWDAD user suggested that the characteristic
50

scanning behavior of a well-known Internet worm could be used to reverse the anonymiza-
tion of IP addresses in some traces. Section 3.3 introduces current de-sanitization tech-
niques and demonstrates several sucessful de-sanitization practices.
3.1.4 Database sanitization and privacy-preserving data mining
A large body of research has been also conducted from the database and data mining com-
munity on sanitization metrics (and techniques) and privacy-preserving data mining [3].
Anonymity is widely used as a key measure of privacy in sanitized databases [94]. One
specific anonymity metric is “k-anonymity” [104], which in the database setting is defined
such that a system provides k-anonymity protection if each record in the database cannot be
distinguished from at least k−1 other records, with respect to every set of quasi-identifiable
non-sensitive attributes. Machanavajjhala et al. demonstrate some severe problems with
k-anonymity, however, especially when the attacker uses background knowledge, and pro-
pose “l-diversity” as a more powerful privacy definition than k-anonymity [76]. Li et al.
show some limitations of l-diversity, in that it is neither necessary nor sufficient to prevent
attribute disclosure, and propose a privacy notion called “t-closeness” that protects against
attribute disclosure [72].
Although from these metrics we may gain some insights for network trace sanitization,
they have made some assumptions that are specific to the database setting. For example,
each of these metrics assumes that the set of “sensitive” attributes are known a priori,
which is difficult to assume for network traces [26, 27]. Moreover, the metrics are purely
51

static and syntactic in that they only consider the distribution of attribute values in the san-
itized database and do not aim to capture the dynamic change of the adversary’s semantic
knowledge [17].
Instead, Shannon’s entropy is often used as a simple indicator of anonymity and a mea-
sure of the adversary’s knowledge gain in a network trace. Many information-theoretic
metrics have been proposed [23, 26, 36, 106], including the degree of anonymity [26, 36]
and the measure of the adversary’s knowledge gain [26].
Producing sanitized data that have “good” utility for various data mining tasks is an
important research goal in privacy-preserving data mining [17]. There are two approaches
for measuring utility: a workload-independent measure, i.e., a utility measure that can be
used for any data mining tasks, and a workload-dependent measure. Although workload-
independent measures of utility are ideal for broader uses of published data sets, they in-
evitably use “workload-independent” or “syntactic” properties, such as the amount of gen-
eralization and suppression [22], average size of quasi-identifier equivalence class [76],
or preservation of marginals [58]. Such “syntactic” measures, however, are of little use
for some specific data-mining tasks (such as classification algorithms) and therefore sev-
eral workload-dependent utility measures such as accuracy of data-mining algorithms have
been also studied [17, 55, 71, 121].
We believe that both workload-independent (syntactic) and workload-dependent (se-
mantic) approaches are applicable to usefulness metrics for network trace sanitization. For
specific applications like network security analysis, some approaches define and exploit a
workload-dependent usefulness metric [132, for example]. However, there is limited re-
52

search on workload-independent metrics for the usefulness of a trace for network analysis.
We discuss more details about the usefulness metric for network sanitization in Section 3.4
and 3.5.
3.1.5 Chapter organization
As network and security researchers, we have faced many obstacles, challenges, and prob-
lems in our efforts to share network trace information with others, be it wireless frames or
intrusion alerts. The success of CRAWDAD has shown us the promise of trace sharing.
Similarly, our experience building the DIST [37] system informs our opinion about the
cost to create such systems and their utility as a shared infrastructure for a wider commu-
nity. Our experience led us to want a deeper understanding of the issues involved in safely
sharing network traces.
We organize the rest of this chapter to reflect the structure of our own foray into this
topic: a progression we hope will ease the reader’s journey. We start by identifying other
overviews of sanitization techniques and selecting those we believe provide a novel per-
spective. In particular, the work of Ohm et al. highlights the legal issues surrounding net-
work monitoring for research [109]. That paper serves as a wake-up call for the wider
networking community, because collecting and sharing network data has several subtle pit-
falls that tend to get overlooked simply because computer scientists are rarely trained as
social-science researchers or legal experts.
Gattani et al. define a comprehensive reference model that can capture anonymization
53

problems [46]. They introduce the notion of universal information, which is the complete
truth regarding the users and the network where the trace was recorded. They show that
the raw trace is only a subset of the universal information and as such cannot contain the
universal information in its entirety. They propose a new entity set consisting of collector,
auditor, analyst, and adversary, where the auditor was missing in the traditional entity
set. They define the auditor to be an entity internal to the organization, who works with
the collector to guarantee the privacy, accuracy and usability of a sanitized trace. As the
only entity that can access the universal information, the auditor emulates the role of an
adversary, as demonstrated by Coull [26]. Their reference model is reasonable, and they
demonstrate its utility by applying it to Coull’s work; the comprehensiveness of the model
has not been verified with enough examples, however. Therefore, we do not use their model
in describing and comparing a variety of problems and methods in this chapter.
Kelly et al. survey the state of the art in metrics for precisely quantifying the informa-
tion leakage from anonymized network data [57]. They offer a comprehensive summary
of existing anonymity metrics and compare them in terms of applicability (whether a met-
ric is useful for data privacy or communication privacy), complexity (whether the method
requires substantial computation), and practicality (reflecting the trade-off between practi-
cality and mathematical rigor). In this chapter, we not only address the issues and problems
of anonymity metrics but also on research of usefulness metrics that quantify how useful
the sanitized trace is for the researchers to analyze the trace.
Porras et al. propose nine risks and challenges [95]. They group these challenges into
three categories: network sensors that generate data, repositories that collect data and make
54

them available for analysis, and the network infrastructure that delivers the data from the
sensors to the repository. Similarly, Bishop et al. pay special attention to the interactions
between the multiple actors (collector, analyst, and adversary) involved in a sanitization
problem [12, 30]. Coull et al. suggest that the research on anonymizing census micro-
data may also provide several useful insights on how to effectively anonymize network
traces [27].
These surveys served as a starting point to explore various themes in the field. We orga-
nize this chapter into three main sections bracketed by this background introduction and an
argument about three critical open problems for trace sanitization (Section 3.5). The main
sections consider, in turn, sanitization techniques (Section 3.2), methods of attacking these
techniques (Section 3.3), and current proposals for evaluating the strength of sanitization
and sanitization effects on datasets (Section 3.4). We seek to highlight the coevolution be-
tween ways to perform sanitization [13,16,28,42,49,63,73,75,81,89,93,100,110,125,129,
133,134], de-sanitization techniques [16,26,28,64,93], and methods of measuring [26,132]
the success of both such efforts.
Finally, we close with a consideration of various “gaps” in the space of sanitization and
sanitization techniques. We posit that the largest such gap is the difference between the type
of information sanitization tools operate on (and thus report on) and the type of information
meaningful to a human operator to help them assess the quality of a particular sanitization
pass over a specific dataset. Although several researchers [12, 95] note that network data
sanitization requires methods that simultaneously protect sensitive or private information
and preserve information useful for analysis, there has been only limited development of
55

usable quantitative metrics for measuring privacy protection for network data (e.g., the
degree of anonymity [26]).
3.2 Sanitization
To share network traces while preserving privacy, the trace publishers draft sanitization
policies according to their specific privacy concerns [93]. These policies explicitly or im-
plicitly determine which sanitization methods to apply and how.
In this section, we review current research on sanitization, with a focus on techniques
and tools. Here, “techniques” refer to specific methods or algorithms that solve a specific
sanitization problem. Because different fields in the network trace possess different char-
acteristics, they require different sanitization techniques; other techniques are needed to
sanitize some inferable and implicit information, such as network topology. A sanitization
“tool,” on the other hand, provides a systematic solution for a range of applications. A san-
itization tool usually implements a set of sanitization techniques and provides a convenient
interface to its user.
3.2.1 Sanitization techniques
General techniques to sanitize specific network trace fields can be classified into a few
categories [28, 110]: destruction, fixed transformation, variable transformation, and typed
transformation. Destruction removes part of, or all, the information from a field, for ex-
56

ample, complete removal of the TCP payload, or the removal of the least significant bits of
the IP address. Fixed transformation uses a single pseudonym value to substitute all values
appearing in a field, e.g., to replace the field with zero. Intrinsically this is same as de-
struction. Variable transformation provides more flexibility by using different pseudonym
values according to the context of the field. One example is to substitute an original IP
address with different pseudonym values according to the type of upper-layer protocols,
such as HTTP or SMTP. Typed transformation, also called permutation in the most gen-
eral sense, is a one-to-one mapping between a pseudonym value and a distinct value of the
original field. “Prefix-preserving” address anonymization, a common technique, belongs
to this category.
Among all the fields in the network trace, the IP address has received most research
attention. There are several types of IP-address anonymization techniques based on dif-
ferent design considerations [110, 133]. IP-address partial destruction removes the low-
order IP-address bits, which identify an individual host on a subnet. Prefix-preserving
anonymization (pseudonymization) is a special case of permutation that preserves the hi-
erarchical nature of IP addresses and is often preferred to random permutations. There are
two general classes of prefix-preserving IP address anonymization techniques: the strict
bitwise-preserving approach [42,81,125], and Pang’s “divide-and-conquer” approach [93].
In the strict bitwise-preserving approach, two anonymized IP addresses will have a
common n-bit prefix if and only if the un-anonymized IP addresses have a common n-
bit prefix. Minshall implemented one approach to such prefix-preserving anonymization
in TCPdpriv with the “A50” option [81]. Xu and Fan showed that such prefix-preserving
57

anonymization functions all follow a canonical form. They proposed a cryptography-based,
prefix-preserving anonymization technique, which is implemented in Crypto-PAn, without
the need for a prefix table [42, 125]. A geometric interpretation of this prefix-preserving
anonymization technique can be described as follows [49]. The collection of all possible IP
addresses can be represented by a complete binary tree (see Figure 3.1). For IPv4 addresses
the height of the tree is 32, and for IPv6 it is 128. Each leaf node of the tree represents a
distinct IP address, and each non-leaf node corresponds to a bit position, indicated by the
height of the node, and a bit value, indicated by the branch direction from its parent node.
The set of distinct addresses present in the unanonymized trace can be represented by a
subtree of this complete binary tree. This subtree is called the original address tree. A
prefix-preserving anonymization function can be viewed as specifying a binary variable
for each non-leaf node of the original address tree. This variable determines whether the
anonymization function “flips” this bit or not. Applying this anonymization function to
the original address tree results in an anonymized address tree. Based on Xu and Fan’s
work, Harvan [49] extended this algorithm to preserve SNMP’s lexicographical-ordering
property. Zhang and Li [134] observed that a trace is often used by different research
groups at the same time. Since each group has a distinct trustworthy level, one network
trace needs to be anonymized separately to fulfill each group’s requirement. Thus, if there
are n research groups, there will be n copies of anonymized trace from one original trace.
They proposed a scheme that only generates one copy of an anonymized trace, but the users
with different knowledge (secret keys) may recover different traces from this single copy.
Ramaswamy [100] presented an online prefix-preserving anonymization algorithm– top-
58

hash subtree-replicated anonymization– with low processing requirements and small space
complexity.
Figure 3.1 presents the geometric interpretation of prefix-preserving anonymization
function: (a) represents nine addresses from a 4-bit address space as a binary tree; (b) shows
a randomly chosen anonymization function, that is, a set of nodes in the tree are flipped to
generate anonymized addresses; (c) shows the anonymized 4-bit addresses produced by
applying the anonymization function from (b).
Unlike the above bitwise-preserving approaches, Pang’s approach [93] remaps the IP
addresses differently based on the type of addresses, either external addresses or inter-
nal addresses. All external addresses– the IP addresses that do not belong to the trace
publishing organization– are remapped using the IP address anonymization algorithm in
Crypto-PAn. All internal addresses– the IP addresses that belong to the trace publishing
organization– are divided into the subnet portion and host portion. These two portions
are remapped independently and preserve only whether two addresses belong to the same
subnet. This means that all hosts in a given subnet in the original trace will also appear
in the same subnet in the anonymized trace. Note that this mapping does not preserve the
relationship between subnets. For example, two 24-bit subnet numbers that share a 20-bit
prefix in the original trace will not necessarily also have a 20-bit common prefix in the
anonymized trace. Pang suggested that this anonymization approach can also be applied to
the MAC address.
However, several researchers have criticized current prefix-preserving techniques. Ylo-
nen demonstrates that the prefix-preserving anonymization in TCPdpriv with the “A50”
59

Figure 3.1: Geometric interpretation of prefix-preserving anonymization function.
60

option is not necessarily good enough to keep a well-informed adversary from determin-
ing where the data were collected [129]. In Crypto-PAn’s prefix-preserving anonymiza-
tion, any given bit of the anonymized address is dependent on all previous bits of the
unanonymized addresses; Coull et al. argue that this kind of dependence causes a single
de-anonymization to affect all anonymized addresses that share a common prefix with the
true unanonymized addresses [28]. Moreover, Brekne et al. present a set of attacks employ-
ing active packet injection and frequency analysis to systematically compromise individual
IP addresses protected by the anonymization techniques implemented in TCPdpriv and
Crypto-PAn [16, 89]. They propose transaction-specific anonymization schemes that use
stream ciphers to encrypt each bit of an IP address and do not preserve the one-to-one map-
ping between the original and the anonymized IP addresses at all. By individually perform-
ing pseudo-random permutation on the subnet and host portions of internal IP addresses,
Pang’s approach reduces linkability among anonymized addresses more than Crypto-PAn’s
approach and is more robust against Coull’s attack [28]. However, Coull shows that some
sensitive information, such as network topology and network servers, can still be inferred
from traces anonymized by Pang’s approach [28].
3.2.2 Sanitization tools
Many network trace sanitization techniques have been proposed; some of these techniques
are also implemented as software tools. As mentioned above, Crypto-PAn implements
the cryptography-based prefix-preserving anonymization technique proposed by Fan and
61

Xu [42, 125]. It uses the Rijndael cipher (AES algorithm) as its underlying pseudorandom
function and has the following properties: a one-to-one mapping from unanonymized to
anonymized IP addresses, a prefix-preserving mapping, and consistent address mapping
across traces. TCPurify [13] is a packet-capture program with sanitization capabilities. Af-
ter recognizing the Ethernet or IP header, it removes all data payload before storing the
packet (except for certain protocols), and does a reversible randomization on IP addresses
without preserving network prefix information. TCPdpriv [81] also anonymizes packet
traces, with several options to process IP address and TCP/UDP port numbers. TCPdpriv
provides prefix-preserving anonymization of IP addresses using a prefix table on a per-trace
basis, and thus may not provide a consistent mapping: a particular address will likely be
anonymized to different pseudonym addresses in different traces. CANINE (Converter and
ANonymizer for Investigating Netflow Events) provides multiple format conversion utili-
ties and integrates several sanitization methods, such as IP anonymization and timestamp
sanitization, on NetFlow logs [73, 75]. AnonTool, an open-source implementation of a set
of anonymization APIs, aims to build an anonymization assembly line, up to the applica-
tion level, by expressing the anonymization policy as several sets of sequential function
calls [63].
Compared to the sanitization tools above, tcpmkpub [93] and FLAIM [110] provide a
more comprehensive and flexible solution. Both of them implement a generic framework
for sanitizing network traces. These two frameworks have several common characteristics:
(1) User-defined sanitization policies are described by a set of explicit rules using a ded-
icated language. Figure 3.2 gives an example of PCAP header sanitization rule used in
62

Figure 3.2: PCAP header sanitization rules used in FLAIM [110].
tcpmkpub. The XML-based language used by FLAIM is called the Module Schema Lan-
guage. A snippet of this language is shown in Figure 3.3. (2) The framework follows a
modular design and is extensible. Many sanitization primitives and common algorithms,
such as truncation and prefix preserving, are implemented and integrated into the frame-
work. Users can also develop their new sanitization techniques as modules and plug these
new modules into the framework. (3) tcpmkpub supports sanitization for multiple layers:
link layer, network layer and transport layer. FLAIM supports sanitization for several types
of logs. For each type of log, FLAIM implements a parser module respectively.
It is important to mention that all available sanitization tools can only do a “one-way
job”. That is, they can only sanitize a network trace, but they can not provide the user
any feedback about the quality of sanitization, such as how much privacy information has
been removed or kept in the trace. The goal of sanitization is to pursue a balance between
63

Figure 3.3: TCP sanitization rules used in tcpmkpub [93].
protecting privacy and preserving trace’s utility. Since no perfect sanitization techniques
exist, choosing and tuning these techniques affects the final sanitization result greatly. As
noted by many researchers [26,93,110,125], exploring the relationship between the strength
and utility of sanitization is an important task for future research. Our own NetSANI [44]
project aims to develop a toolkit for exploring such tradeoffs.
3.3 De-sanitization
“Worst-case analysis” is a term widely used in the security research community that as-
sumes an adversary has almost unlimited resources and knowledge to launch an attack on
the examined target. Due to the intrinsic complexity of network trace sanitization, we must
admit that there are few, if any, available network-trace sanitization schemes that can pro-
vide a water-tight guarantee under the worst-case analysis. That we hold this opinion is
not to degrade the value of sanitization research presented in Section 3.2 but rather to em-
phasize that current de-sanitization research has been remarkably creative and successful.
According to the attack strategies employed by an adversary, we classify current de-
64

sanitization research into two categories: direct attacks that exploit the limitations of an
anonymization algorithm [16,28,89], and indirect attacks that use implicit information con-
tained in the trace [9,28,45,69,92], auxiliary information obtained from other sources [28,
69,92], and new techniques from other research fields, such as machine learning and pattern
recognition [9, 14, 25, 92], to uncover sensitive information from the anonymized network
trace.
One example of a direct attack exploits a flaw in Crypto-PAn [125]. As mentioned in
Section 3.2, Crypto-PAn implements a strict bitwise-prefix-preserving anonymization algo-
rithm, and any given bit of the address anonymized by Crypto-PAn depends on all previous
bits of the anonymized addresses. This dependence enables a de-anonymization on one
address to affect all anonymized addresses that share a common prefix with the true ad-
dress [28]. For instance, if an anonymized address a = a1a2 . . . an−1an is deanonymized to
reveal its true address t = t1t2 . . . tn−1tn, then the adversary also learns that the anonymized
address of another true address t∗ = t1t2 . . . tn−1t∗n. should be a∗ = a1a2 . . . an−1a
∗n. Be-
cause t and t∗ have a common prefix of n − 1 bits, their anonymized addresses a and a∗
must also have the same (n − 1)-bit prefix. Based on this idea, Brekne et al. proposed an
attack against Crypto-PAn that uses packet injection and frequency analysis to compromise
individual addresses in multilinear time [16, 89]. Pang’s “divide-and-conquer” approach is
regarded as an improvement over Crypto-PAn by processing the subnet and host portions
of internal IP address respectively, and thus it decreases the linkability among anonymized
addresses [93].
From a trace publisher’s view, an indirect attack is probably more dangerous and much
65

harder to defend than a direct attack. Although Pang’s tcpmkpub [93] is regarded as one
of the most state-of-art and comprehensive sanitization solutions, Coull’s work [28] shows
that this solution is far from enough to provide a “water-proof” protection for a lot of
sensitive information. For instance, a “dominant state analysis” characterizes the behavior
of each host and then classifies these hosts into logical groups, such as a possible server
or an ordinary client, based on their behavior profiles. The subnet clustering algorithm
takes advantage of the prefix-preserving anonymization to extract information about the
underlying network topology. By associating the above information extracted from the
anonymized trace with other auxiliary information, such as DNS records, SMTP traffic,
ARP traffic and publicly available website information, their experiment shows that they
can not only completely deanonymize some public hosts but also depict detailed traffic
properties at some observation points.
Moreover, recent research has extended such indirect de-sanitization attacks to the
wireless-network domain. Many researchers have shown that an IEEE 802.11 wireless
device’s chipset, the firmware or the driver can be identified by either passive fingerprint-
ing [9, 45] (in which the adversary simply observes network traffic) or active fingerprint-
ing [14] (in which the adversary sends out probes and observes the responses). Whether
passive or active, these techniques work by building a database of the unique variations in
protocol behaviors, as seen across different vendors or implementations, and later discern-
ing the make and model of an unknown Wi-Fi network interface by observing this behavior
in network traffic. Knowledge of the brand used by a Wi-Fi user may, when combined with
other external information, allow an adversary to de-anonymize that user’s traffic within a
66
trace. Using auxiliary location information, Kumar’s work shows the possibility to cate-
gorize Wi-Fi users based on their gender [69]. As a further step, Pang et al. demonstrate
that by using so-called “implicit identifiers”, such as network destinations, SSID probes,
broadcast packet size and IEEE 802.11 MAC protocol fields, an adversary can accurately
pin down user identities in some circumstances [92].
The above de-sanitization research shows that there is no one sanitization technique
that can handle all situations. Any flaw in an anonymization algorithm can lead to dis-
astrous privacy leakage. Beyond the robustness of the anonymization algorithm applied,
a desirable outcome depends on the properties of the original unanonymized trace, such
as the type and volume of implicit information contained in the trace. To maximally de-
fend against an indirect attack, the trace publisher should have a comprehensive view of
the anonymization problem. This means that when sanitizing a trace, the trace publisher
should not only focus on the trace itself but also take all auxiliary information into consid-
eration. As shown above, the combination of auxiliary information plays a vital role in a
de-sanitization. We regard the progress in network trace de-sanitization as a valuable and
indispensable complement to anonymization research.
3.4 Evaluation of Sanitization
Methods to evaluate the efficacy of sanitization methods seem somewhat underdeveloped
compared to the wide variety of actual suppression techniques and attacks. Most evalua-
tion papers naturally focus on both quantitative and qualitative measures [18, 26, 132], but
67

some consider the aspects of traces that can be exploited in the sanitization process. For
example, the remote and local port features reveal more distinguishing information than the
timestamp feature, and therefore re-examining the anonymization policy on these features
may improve the efficacy of sanitization [26]. Settling on a particular metric of sanitization
effectiveness is difficult, in part due to the variety of features in network traces. It is not
immediately clear, for example, how one might meaningfully compare the sanitization of
IP addresses with the anonymization of user browsing profiles.
There seem to be two broad types of metric. First, sanitization metrics measure how
well the sanitization method has fulfilled predefined requirements. In view of the definition
of sanitization, the predefined requirements may be those for privacy or secrecy. Second,
usefulness metrics measure how well the sanitized traces remain useful to the researchers
for the purpose of trace analysis.
Coull et al. [26] evaluate two well-known anonymization methods, CryptoPAn [125]
and Pang [93], in terms of the privacy requirement. For the evaluation, they de-anonymize
the sanitized data on a few selected fields to quantify the anonymity of the data. They
defined the anonymity of each object (e.g., each host) with respect to a feature (e.g., port
number) by calculating the entropy of the “similarity” distribution. For an object A, the
similarity distribution consists of the probability PF (A, i) overN objects. This probability
expresses how similar the object A is to an unanonymized object i with respect to the
feature F . If the anonymity of the object A (in this case, the entropy of the object A)
is close to its minimum value (zero), then there probably exists an unanonymized object
that is similar to A with respect to the feature F . Otherwise, if the anonymity of the
68
object A is close to its maximum value, logN , then the object is not more similar to any
one unanonymized object than any other unanonymized object.
Yurcik et al. compare a variety of sanitization methods in terms of how they trade-off
anonymity and usefulness [132]. They use the SCRUB-tcpdump network packet anonymiza-
tion tool [131] to perform various anonymization methods on all fields of the data. The
anonymization methods include replacing values with a predefined constant (black marker),
mapping values to any valid permutation (pure randomization), hashing values with a small
key (keyed randomization), and classifying values into groups (grouping). They examine,
as the usefulness metric, the difference in the number of alarms from the Snort IDS, an
intrusion-detection system [103], before and after a trace is anonymized.
They showed that some fields (Transport Protocol Number and Total Packet Length)
have a zero-sum tradeoff, meaning that “the more network data is anonymized for privacy-
protection, the less valuable the network data may be for security analysis” [132]. However,
most of the other fields have a more complex tradeoff (not zero sum), suggesting that both
privacy and usefulness can be achieved in certain cases.
More recently, Burkhart et al. investigated the tradeoff between data utility for anomaly
detection and the risk of host identification for IP address truncation [18]. They evaluated
the risk of de-anonymizing individual IP addresses using a metric based on conditional
entropy [11, 65]. For measuring data utility, they compared the detection rates of the DoS
and Scan attacks based on IP-based detection metrics (e.g., unique address counts and
Shannon entropy) computed on the original traces with those based on IP-based detection
metrics computed on anonymized traces. According to their results, truncation effectively
69

prevents host identification but degrades the utility of data for anomaly detection.
They found that the degree of utility degradation depends on the detection metrics used
for anomaly detection (e.g., unique address counts vs. entropy) [18]. For example, the
entropy detection metrics are more resistant to truncation than unique address counts be-
cause the entropy detection metrics better represent the distribution of flows per IP address
than the unique address counts metrics, even when the IP addresses are truncated. They
also noticed that the detection quality of anomalies degrades much faster in internal ad-
dresses than in external addresses. Specifically, the usefulness of internal address counts is
lost even for truncation of only 4 bits while the usefulness of external address entropy is
virtually unchanged even for truncation of 20 bits.
Research on methods to evaluate the efficacy of sanitization methods is obviously in its
infancy, and many research questions remain. Among them, two issues draw our attention
more than others: first, only a few evaluation metrics, either sanitization metrics or useful-
ness metrics, have been suggested that can precisely quantify the efficacy of network data
sanitization. Second, even when a metric can give a precise measure of the sanitization
efficacy, there may exist a large gap between the semantics of the metric and the semantics
understood by users of the sanitization tool, or of the network trace. We discuss these two
issues more deeply in Sections 3.5.2 and 3.5.3.
70

3.5 Challenges and open problems
Sanitizing network traces is about managing risk [93]. The amount of risk depends on both
the trace publisher’s policies and assumptions about the attacker’s knowledge and capabil-
ity. The trace publisher drafts sanitization policies according to his/her specific privacy or
secrecy concerns, and these sanitization policies are mapped to a set of sanitization tech-
niques and their configuration. Generally the trace publisher has a “benign wish” when
sanitizing traces, that is, to preserve the trace’s usefulness as much as possible. However,
there is a tradeoff between privacy and usefulness during sanitization. In choosing a saniti-
zation approach, the trace publisher balances privacy and usefulness, informally evaluating
the risk that an adversary will be motivated and capable of exposing sensitive information
by leveraging benign information the publisher chooses to leave in the trace. Therefore, a
top-level challenge for trace-sanitization research is to help trace publishers deal with the
tradeoff between anonymity and usability.
In this section, we discuss several challenges to achieve this goal. The challenges in-
clude how to quantify private or sensitive information, what metrics to use for evaluating
the sanitization result, and how to interpret the sanitization result.
3.5.1 Quantifying sensitive information
To protect personal or proprietary interests, the trace publisher would like to know how
much private or proprietary information is contained in the trace. This may be difficult,
however, for two reasons.
71
First, the boundary between sensitive and insensitive fields is obscure and changing
over time. Some fields of a packet are obviously “sensitive,” while others are not. It is well
known that a port number is useful to identify a specific service, a MAC address is enough
to identify a unique NIC, and an IP address may be useful to identify a specific host. For
some other fields, the degree of sensitivity is not clear at first glance, but they actually
may contain private information. For example, recent research shows that an attacker can
fingerprint a physical host by using only the clock drift in TCP timestamps [61]. The length
of an HTTP/TCP connection can identify the web server (if a well-known public server),
and the order of IP addresses contained in SYN packets can be used to partly reconstruct
the anonymized IP addresses [64]. The point here is that with the development of new
techniques, fields that seem to be safe today may become sensitive in the future.
Second, in addition to the explicit values described in each field of a packet or an entry
in a log, there is information “implicitly” contained in the network traces. For example,
such information includes the traffic pattern of a host, the topology of the traced network,
and the mutual relationships between hosts. Previous sanitization research mainly focused
on anonymizing explicit values, and neglected this implicit information. As a result, some
de-sanitization techniques, such as dominant state analysis and subnet clustering [28], can
dig out valuable information.
We think a great amount of information exists intrinsically in the traces or is intention-
ally preserved by the specific sanitization technique, such as the network topology discov-
ered by subnet clustering but preserved by Pang’s prefix-preserving method [93]. Although
trace publishers who intentionally preserve such useful information may be willing to take
72

the risk of de-sanitization, others may not realize that they are preserving such information,
or that new methods can extract more than they expect. Nevertheless, we regard this kind
of de-sanitization research to be important, if only to inspire new sanitization methods and
to help determine the privacy bounds of those methods.
3.5.2 Metrics for evaluating sanitization results
Trace publishers sanitize their traces to achieve both their “sanitization” goals (to pro-
tect both personal and operational information) and “usefulness” goals (to protect research
value); after sanitization, presumably, they would like to know whether their goals are
actually achieved. To evaluate whether their goals are achieved, we need metrics for mea-
suring the degree of sanitization and usefulness of the sanitized traces. It would be even
better if these metrics could also be used to help control the tradeoff between the degree of
sanitization and usefulness.
Although several generic “anonymity” metrics have been suggested [23, 36, 104, 106],
and some were specifically suggested for network traces [26], we have yet to find any
generic metric for the “usefulness” of a trace for network analysis. For specific applications
like security analysis, some approaches define and exploit a usefulness metric [132, for
example].
Different research interests have different understandings of and requirements for the
usefulness of network traces. For example, network-security research for wired networks
pays most attention to the TCP/IP layers and above, and does not often address the link
73

layer. In the wireless-network security world, however, the focus is largely on the link
layer [10]. Even for the same feature in a network trace, such as timestamp, Quality-of-
Service research may require micro-second resolution [101], while other research, such as
Delay Tolerant Networks, may be satisfied with minute-level resolution. Because of diverse
research interests, it is infeasible to generalize the notion of “usefulness” by including the
semantics of all possible usages. We think that there is another avenue for future research
on the usefulness metric: we need a range of possible metrics that each apply to one or
more trace features, then we need a framework that allows one to compose these per-feature
metrics to provide an overall metric for the trace’s usefulness.
3.5.3 Interpreting sanitization results
Although some evaluation papers report comparison results [26, for example], such as
which sanitization method is most effective for a given trace and what kind of trace is
most effectively sanitized when the same sanitization method is applied, there needs to be
more research on how to develop an explicit evaluation stage that informs the trace pub-
lisher about the quality of the sanitization result in terms of various sanitization metrics,
and on methods to effectively communicate the results to the trace publisher.
Indeed, trace publishers may find it difficult to interpret a sanitization result in terms
of sanitization metrics. Generally, publishers are most interested in how to use sanitization
methods or tools and how well the methods or tools achieve the publishers’ initial goals,
that is, for anonymity and usefulness. Therefore, they may prefer an intuitive interpretation
74
of the sanitization result rather than rigorous metrics expressed in complicated mathemat-
ics. For example, although entropy has been used often in anonymity research [23,36,106],
it may be difficult for trace publishers to intuitively interpret an entropy-based metric.
Thus, it remains an open problem to present the evaluation results as high-level feed-
back about the quality and limits of the sanitization. The feedback may report how well
each of the user-specified sanitization goals is achieved, and if any goal fails, to identify a
reason and to recommend a method that may resolve the conflict resulting from the tradeoff
between anonymity and usability.
3.6 Summary and conclusion
It can be technically and logistically challenging to collect large amounts of real network
data. Sharing such data with the larger research community becomes an imperative for
advancing scientific progress. Similarly, network operators and engineers look for ways
to reliably share network traces to help analyze network problems. Unfortunately, legal,
ethical, and privacy concerns complicate these sharing efforts.
In this chapter, we survey methods for sanitizing traces, methods for de-sanitizing
traces, and methods for evaluating sanitization algorithms and tools. We discuss much
of the research that describe methods to (or demonstrate the failure of methods to) protect
the privacy of network users and the confidentiality of certain network properties.
Although this body of work contains numerous examples of methods for sanitizing a
particular feature or set of fields (that is, identifying such information and blanking it out
75

or transforming it in some way to suppress it), these methods are often bypassable by de-
sanitization techniques that consider inter-feature or inter-record relationships or external
information.
We hypothesize that, because researchers and network operators who want to share
trace data have access to only a few tools for quantitatively assessing the quality of a
particular sanitization technique or resulting data set, it is difficult for much substantial
progress to be made on anticipating and defeating de-sanitization attacks. In essence, the
risks of certain classes of sanitization methods are not well understood because metrics for
evaluating the efficacy of classes of de-sanitization attacks are in their infancy.
Efforts to improve our ability to measure the efficacy of sanitization are of paramount
concern. As we note above, metrics, be they simple measures of a particular feature or com-
plicated mathematical models, face an underlying problem: there is a large gap between
their semantics and the semantics understood by users of the sanitization tool, or of the net-
work trace. The key problem is that the semantics of sanitization success remains unclear
and unintuitive for trace producers and (legitimate) trace consumers. Any such metric must
simultaneously convey (1) how well sensitive information has been suppressed (that is, the
level of effort for an attacker to recover this information) and (2) the potential loss for legit-
imate research or operational uses. Metrics that have these semantics can then be used with
confidence in decisions about which traces, portions thereof, or derivative statistics can or
should be shared with various consumers.
76

Chapter 4
Privacy analysis on user-association logs
In many large-scale wireless local area networks (WLANs), user-association logs keep
a record of each association and disassociation event between users’ wireless devices and
the network’s access points (APs). Such traces collected from production networks, when
made available for research, play a critical role in understanding user activity patterns,
analyzing network protocol dynamics, and evaluating the performance, reliability, and se-
curity of new network designs [32, 105, 111]. We have monitored a campus-wide WLAN
for almost one decade and some of our collected traces have been made public through
our CRAWDAD website [29]. These network traces have been extensively studied by the
wireless research community.
To preserve users’ privacy, a trace publisher must sanitize the network traces before
sharing them with the public (Chapter 3). Although many network sanitization techniques
have been proposed and developed, recent research has shown that many of these tech-
niques provide limited protection against user (or host) re-identification attacks. Existing
sanitization techniques usually deal with explicit sensitive fields in the dataset, such as
IP/MAC addresses, port number, and TCP/UDP payloads, but ignore implicit information
77

that can be potentially extracted and used to identify an anonymized user (or host). For
an enterprise-wide network with thousands of users, privacy analysis on wired network
traces has been widely studied to understand the severity of some potential trace-sharing
risks [16,28,89]. However, similar research is scarce for enterprise-wide, large-scale wire-
less networks [68, 116]. As the edge of the Internet is increasingly becoming wireless, and
because wireless networks have some unique characteristics, such as user mobility, it is
important to evaluate privacy threats posed due to shared wireless network traces.
In this chapter, we conduct privacy analysis on one of the simplest wireless network
traces, a user-association log, collected from a large-scale WLAN. Compared to other se-
mantically rich wireless-network traces, we would hope the simplicity of the user-association
log could make it more resistant to potential privacy risks. We consider the following two
questions: (1) Using only the “insensitive” information in an anonymized user-association
log, is it possible to build a unique signature for each user? These signatures, when com-
bined with some auxiliary information, such as a short-term un-anonymized log, can be
used to distinguish users and infer some sensitive information from the anonymized log.
(2) If privacy breach is possible, how effective is a proposed mitigation approach in pre-
venting an adversary from building such signatures?
In a nutshell, we make three major contributions in this chapter. First, we simulate the
role of an adversary and propose a “correlation attack” – a method based on Conditional
Random Field (CRF) – that can be used to breach user privacy from a released WLAN
user-association log. Second, we use extensive experiments to demonstrate the effective-
ness of the CRF-based correlation attack. Using an anonymized campus-wide WLAN
78

user-association log with more than four thousand users and millions of user-association
records, and a short-term observation of the victim’s association activities, we show that the
CRF-based correlation attack, under certain circumstances, can reveal the victim’s identity
in the released dataset with a probability as high as 70%, or narrow down the victim’s
identity to 20 candidates with a probability close to 100%. Third, we evaluate the effec-
tiveness of standard sanitization techniques, including generalization and perturbation, in
mitigating the proposed correlation attack; the results reveal only limited success of these
methods, suggesting that more thorough treatment is needed when anonymizing wireless
user-association logs before the public release.
4.1 Related work
As noted in Chaper 1, “sanitization” is a superset of “anonymization”: “anonymization”
attempts to protect the privacy of network users, and “sanitization” attempts to protect
the privacy of network users and the secrecy of operational network information. In this
chapter, because we only focus on analyzing the potential threats against network users’
privacy when sharing a user-association log, we may use these two terms, “sanitization”
and “anonymization”, interchangeably.
Due to the intrinsic complexity of network trace sanitization, however, recent research
has revealed that there are few, if any, available network-trace sanitization schemes that can
provide a water-tight guarantee under the worst-case analysis. These works often mimic
the role of an adversary that tries to launch a de-sanitization attack against the sanitized
trace. According to the employed attack strategies, these de-sanitization research results
79

can be classified into two categories. Direct attacks exploit the limitations of a sanitization
algorithm [16,28,89]. Indirect attacks use implicit information contained in the trace [9,28,
45, 92], auxiliary information obtained from other sources [28, 69, 92], or new techniques
from other research fields, such as machine learning [9, 14, 25, 92], to uncover sensitive
information from anonymized network traces.
In the domain of wireless networks, many physical-device-fingerprinting techniques
could potentially be used to launch de-sanitization attacks [9, 14, 45]. Because most of
these techniques work by monitoring unique variations in protocol behaviors, such as those
seen across different vendors or device-driver implementations, they often require very-
high-resolution data or even special measurement equipment. Such requirements greatly
limit their applicability for de-sanitization on most types of released traces. Some other
researchers have focused on how to fingerprint users. For instance, Pang et al. demonstrated
that by combining information from multiple sources together, such as destination address,
broadcast packet size and IEEE 802.11 MAC protocol fields, an adversary could uniquely
identify users under certain circumstances [92]. Their techniques, however, rely on much
more abundant trace semantics than our work and have only been evaluated with much
smaller wireless network traces than the one we used. Most close to this work, Kumar
and Helmy have recently shown that it is possible to breach privacy from WLAN user-
association logs [68]. Their attack model assumes that the adversary can inject data into
the wireless network during the trace collection or has some out-of-band information such
as the victim’s academic major and gender. In practice, these conditions may be difficult to
satisfy. The type of attacks we discuss in this chapter do not require these assumptions.
80
Location privacy has been investigated in diverse communication networks in the past
few years. Krumm presented a comprehensive survey of computational location privacy,
in which users’ location data are treated as geometric information [66]. Hoh et al. ana-
lyzed a set of week-long GPS traces from 233 vehicles and showed that applying previous
privacy algorithms either led to inaccurate results or failed to satisfy privacy guarantees;
they further proposed an uncertainty-aware algorithm that is able to preserve privacy for all
vehicles [52]. In comparison, the trace used in our work covered thousands of users and
more than two months. Location privacy in sensor networks has also been studied under
different adversarial models [80,88,90]. Our work differs from this line of research because
it considers location privacy in a different network environment, which leads to a different
threat model. For example, we do not assume that the adversary is capable of monitoring
the entire network traffic in our work.
Narayanan et al. proposed a method to robustly de-anonymize a large dataset [85].
Their work is based on the assumption that the studied dataset is highly sparse; for example,
in their studied Netflix dataset, the number of attributes (movies) is twenty times more than
the number of potential targets (Netflix subscribers). In our study, we make no assumptions
about the sparsity of user-association logs.
4.2 WLAN user-association logs
At Dartmouth College, we have been monitoring the campus-wide WLAN network usage
since 2001. As of January 2010, this WLAN network consists of over 1300 Aruba APs that
81

provide 54Mbps coverage to the entire campus. These Aruba APs are connected with and
controlled by a small set of Aruba Mobility Controllers. We poll every controller every 5
minutes using the SNMP protocol and receive replies. In addition to traffic statistics, these
replies contain a list of devices associated with every AP. After processing these replies,
each row of the resulting user-association log collected, which we call a user-association
record, has 4 comma-separated fields: the MAC address of the wireless card, the name of
the AP that the wireless card has connected with, and the start and end POSIX timestamp of
this connection. The following is a snippet of the user-association log that we extract from
the SNMP information (it shows anonymized MAC addresses to protect user privacy):
001d4f3bc496,14.5.1, 1251690285,1251691544002608e4cdf7,80.3.2, 1251690458,12516915440021e9082bfd,142.6.1,1251689384,12516915440016cf29eb6d,76.5.3, 1251691151,1251691544001cb3b51b58,188.4.6,1251689569,12516915440016cf295f33,206.5.7,1251688817,1251691544
There are a few things worth noting. First, although it is possible that a wireless card
may have been used in multiple devices or a device has been used by multiple people, we
assume that such cases are rare in our dataset. As in earlier chapters, we use a “wireless
card” and a “network user” (or a “user”) interchangeably. Second, because the Aruba
Mobility Controller only generates the start timestamp for each connection and we poll
the controller every 5 minutes, the connection’s end timestamp is only an estimated value,
whose error is therefore bounded by 5 minutes. Third, we use a hierarchical naming scheme
for APs in the dataset. For an AP named x.y.z, x is its building number, y is its floor
number, and z is its serial number within the floor.
82

Sanitization. When sanitizing the user-association logs, we use a one-to-one perfect
one-way mapping function to rename the MAC addresses in the original dataset. Hence,
the anonymized MAC addresses in the sanitized dataset do not have any physical meaning
and are thus only symbolic names; a similar sanitization scheme has been used in other
work [68]. Here, we use the word “perfect one-way mapping” to emphasize the fact that
our proposed method will succeed without needing to reverse the mapping function; no
matter how good such a one-to-one mapping is, our proposed method will still work. In
some cases, by taking advantage of the hierarchical naming scheme for APs, we truncate
an AP’s name according to different sanitization levels. For example, if we want to only
keep building and floor information, we truncate each AP’s name from x.y.z to x.y.
4.3 Threat model and problem formulation
Complying with Narayanan’s definition of a privacy breach [85], the threat that we study
here is whether the limited insensitive information left in a sanitized association log could
still form implicit signatures for individual users. These implicit signatures, when com-
bined with auxiliary information, may provide the adversary the knowledge that the san-
itization process has aimed to protect, such as whether an anonymized ID in the released
dataset corresponds to a specific user. We make the following three assumptions in our
threat model:
Assumption 1: The adversary has access to a sanitized WLAN user association log Ls,
which is shared to the public by a trace publisher. There are Ns users in this association
83

log. All users’ real MAC addresses are anonymized in Ls as follows: during the trace pub-
lisher’s sanitization process, each real MAC address has been replaced with a new identifier
IDi (1 ≤ i ≤ Ns) according to some one-to-one one-way mapping function. Hence, given
an anonymized MAC address IDi, the adversary cannot find the real MAC address that
is mapped to IDi. The AP’s name can be either preserved or truncated. The rest of the
fields, such as the start and end timestamp of each connection, are preserved during the
sanitization process.
Assumption 2: The adversary knows a sequence of association records about a victim
user’s device. This sequence of records, Q, need not be collected during the same time
period as Ls (otherwise the problem will be trivial). It is important to note that the infor-
mation provided in Q can be rather coarse. For example, the adversary may only need to
know which buildings1 the victim has visited rather than which exact APs the victim has
associated with.
There are a few ways for the adversary to obtain such information: (1) The adversary
has some general knowledge about the victim. For example, the adversary knows the victim
often stays in the library in the morning for 2 hours and then goes to the classroom around
3pm in the afternoon. (2) The adversary can manage to install some trojan software on the
victim’s device through some social engineering techniques (e.g., email attachments) or
exploiting software vulnerabilities on the victim’s device. The trojan secretly monitors the
network association/disassociation activities of the device and reports them to the adversary
through covert channels. (3) The adversary follows the victim physically and monitors the
1In this chapter, a building can be a library, a dormitory, or an office building, etc.
84
victim’s network association/disassociation activities. For instance, when the victim opens
a laptop, usually the laptop will automatically find the closest AP and connect to it, which
leads to an association record. (4) The adversary can obtain the user-association records
of the victim user from a different dataset L′, which may or may not be published by the
same publisher as Ls. L′ may be produced using a weak anonymization scheme (or even no
sanitization at all) so that it is easier for the adversary to identify the victim’s AP association
records in it than in Ls.
Assumption 3: The adversary knows that the sanitized dataset Ls must contain the
victim’s AP association records. In many cases, Ls is published at an organization level
(e.g., by a university) and thus contains complete AP association logs of the organization’s
wireless users. Hence, if the adversary knows that the victim was a member of the organi-
zation when Ls was collected, it is easy for him to know that Ls should contain the victim’s
AP association records.
Given the three assumptions in the adversarial model, the (exact) correlation attack
problem is then formulated as follows: givenLs andQ, which anonymized identity IDi (1 ≤
i ≤ Ns) in Ls has also generated Q? In practice, however, due to incomplete data for
training or inference, or some intra- and inter-user association activity variations, finding
an algorithm to solve the exact correlation attack problem is difficult or even impossible.
In this work, we consider a relaxed and more practical version of this problem. The (re-
laxed) correlation attack problem is formulated as follows: given Ls and Q, which subset
of anonymized identities would contain the one that generated Q with high probability?
It is important to emphasize the difference between the correlation attack problem and
85

the mobility anomaly detection problem [113, 126]. The latter one is stated as follows:
given the mobility history of a mobile user H, is a test mobility record R generated from
the same user? Although both problems are related to human mobility, the distinction
in their conditions (i.e., prior knowledge) suggests the difference: The mobility anomaly
detection problem is essentially a statistical hypothesis test, whose solution does not require
the knowledge of other users’ mobility history. In contrast, the correlation attack problem
is about classification: considering that there are Ns classes and we know each class’s
association records, we want to find the correct class for the observed association sequence
Q. Their difference can further be explained with an example. It is possible that the
observed association sequence Q does not exhibit the user’s regular mobility pattern and
can thus be treated as an anomaly in the mobility anomaly detection problem. But as long
as no other users have association records closer to Q, we may still be able to find the
correct class for Q in the correlation attack problem.
4.4 Algorithm description
The intuition behind the proposed algorithm is that human activities often follow certain
regularities. These regularities are inherent in the temporal and spatial information of the
association log, whether or not the log is sanitized. Different users may have different
association patterns, and we can use such differences to fingerprint and distinguish users.
To this end, we build a model that not only characterizes such inter-user differences but also
is robust to intra-user variations. In the previous section, we formulate the correlation attack
86

as a classification problem, in which the two key components are feature representation and
the learning algorithm. We use association activity templates to represent user-association
logs and employ CRF as the learning algorithm.
4.4.1 Data representation
Previously, there are two general approaches to represent user-association activities: direct
representation and abstract representation. The method proposed by Song et al. [111],
for instance, is a typical direct representation that puts all visited APs in an AP transition
vector and the corresponding duration at each AP in a duration vector. Suppose that a user
has traveled from AP1 to AP2 to AP3 sequentially and connected with each AP for 30, 45,
25 minutes respectively. Then, the corresponding AP transition vector is [AP1, AP2, AP3]
and the duration vector is [30 min, 45 min, 25 min]. While this method captures every
AP association transition, it ignores other potentially valuable information, such as when
the connection took place. On the other hand, an abstract representation method, such as
Hsu et al.’s normalized association vector [53], aims to capture the overall trend of AP
association changes at the expense of losing many details during the abstraction process.
As the previous data representation methods ignore details that are important to clas-
sification, we propose a new approach that uses association activity templates to represent
user-association logs. In this method, we first split each user’s association log into day-to-
day pieces and then for each day build an individual association activity template, because
human activities often exhibit regularities associated with days of the week. An association
87

Day 1 Day 2 Day 3 Day N......
AP3 AP 5 AP 7 AP 5 AP 6
Feature 1
Feature2
Feature 3
...
Associationactivity
template
AP 1 T 1 T 2 AP 3 T 3 T 4 AP 6 T 8 T 9......User
association log
Day-to-daylog
......
Feature 1
Feature2
Feature 3
...
Feature 1
Feature2
Feature 3
...
Feature 1
Feature2
Feature 3
...
Feature 1
Feature2
Feature 3
...
......
......
Associationactivity
tag
Associationactivityvector
Figure 4.1: Represent an user’s association log using association activity template.
activity template is a collection of association activity tags and their corresponding associ-
ation activity vectors. As shown in Figure 4.1, the association activity tag is the name of the
visited AP. Each element in an association activity vector is called a feature. In the current
implementation, we let an activity vector have six features: duration, day of week, starting
time, previous AP, next to previous AP, and next AP. Table 4.1 explains these features.
Several things are worth noting here. First, an association activity vector does not cor-
respond one-to-one with an AP association record (i.e., a row in the user association log).
This is because an association activity vector resides in an association activity template
that only holds association information for a specific 24-hour calendar day. Thus, if an
AP association record spans multiple days, it is divided into several association activity
88

templates and represented by multiple association activity vectors inside these templates.
The duration feature in an association activity vector follows this manner. If a connection
is entirely contained in a 24-hour calendar day, the value of duration is the end timestamp
less the start timestamp. If a connection spans several days, the value of duration is equal
to this connection’s cumulative amount of time in the corresponding 24-hour calendar day.
Given the duration feature’s maximum value is 24 hours, it is intrinsically normalized on
a 24-hour base. Second, instead of assigning an exact time (hour, minute and second) to
the starting time feature, we divide a day into six 4-hour slots (midnight, dawn, morning,
afternoon, evening, and night) and use the name of these slots as the coarse start time. As
shown in Kim’s work [59], although user-association behaviors have periodic patterns, they
also have some variations. Compared to the exact representation, representing the time at
a coarse level adds some tolerance for these variations. Third, at the beginning of each
day, we assign a special string “NA” to the previous AP and next-to-previous AP features;
similarly, we let the next AP feature be “NA” at the end of a day. Fourth, if a user is offline
all day, no association activity template is generated for her that day.
4.4.2 Algorithm procedure
To best communicate the “big picture” about the workings of the correlation attack, we
describe the attack algorithm in this section and defer the introduction to CRF to Sec-
tion 4.4.3.
Step 1. For each user in Ls, split his/her association log into day-to-day pieces and rep-
89

Table 4.1: Features of an association activity vectorFeature Meaning Value Commentsduration Adjusted connec-
tion durationInteger Normalized, inspired by
Hsu’s work [53]day of week Day of the week
of this recordEnum. type, from Mon-day to Sunday
To represent periodicpatterns, inspired by Kim’swork [59]
startingtime
Time slot of a dayof this record
Enum. type, from Mid-night to Night
previousAP
The AP in theprevious record
String, AP’s name
To represent contextinformation, inspired bySong’s work [111] andYamCha [67]
next-to-previousAP
The AP in thenext-to-previousrecord
next AP The AP in thenext record
resent each day’s log using an association activity template as described in Section
4.4.1.
Step 2. Feed each user’s association activity templates into a linear-chain CRF to model
this user’s association behavior. As there are Ns users in Ls, we build Ns CRF
models. The input fed to a CRF model is a sequence of association activity vectors
(Figure 4.1) and the output is a sequence of association activity tags, which are ac-
tually AP names. Let CRFi(V) denote the output from the i-th user’s CRF model,
where 1 ≤ i ≤ Ns and V denotes the sequence of association activity vectors fed to
the CRF model.
Step 3. For the observed user-association record Q, we preprocess it as described in Sec-
tion 4.4.1 to obtain an association activity template T . Let VT and GT denote the
sequence of association activity vectors and the sequence of association activity tags
in template T , respectively.
90

Step 4. We feed VT to all CRF models trained in Step 2 and count the number of tags
that overlap between GT and CRFi(VT ) (1 ≤ i ≤ Ns), a score we denote wi.
The intuition applied here is that the victim’s CRF model is more likely to produce
correct activity association tags from her observed activity association vectors in Q,
and therefore score wi is higher than the others if IDi is the victim’s identifier in the
released user-association log.
Step 5. We sort all users based on score wi in non-increasing order and the algorithm
outputs this sorted list.
Ideally the top identifier on the sorted list should be treated as the sole candidate that
generated the observed user association sequence Q. In practice, however, due to incom-
plete data for training or inference, or some intra- and inter-user association activity varia-
tions, the top identifier may not correspond to the victim who produced Q. As mentioned
earlier, we tackle the relaxed correlation attack problem instead and thus use a small num-
ber of top identifiers on the sorted list. Clearly, from the attacker’s perspective, the smaller
the number of top identifiers needed to include the victim’s, the more successful his attack.
4.4.3 Conditional random field
One may wonder why we chose CRF models to characterize users’ AP association behav-
iors. We explain this choice by analyzing the nature of the correlation attack problem and
also provide a brief introduction to CRF.
Let X = (X1, X2, ..., Xn) denote a random variable of an observed sequence, each
91

element of which has k features. In our problem, a realization of X is a sequence of
association activity vectors with the six features described in Table 4.1. Let Y denote
a random variable of a label sequence. A label here is actually an association activity
tag that indicates an AP name. According to Figure 4.1, each association activity vector
corresponds to an association activity tag. Hence, given an observed sequence of X (i.e.,
sequence VT in Step 3 of the algorithm shown in Section 4.4.2), we need to produce a label
sequence for it. It is thus a task of assigning label sequences to observation sequences,
which is common to many applications in bioinformatics, computational linguistics and
speed recognition [39, 79, 98].
We now explain why here we do not use Hidden Markov Model (HMM), a popular
probabilistic sequence model that characterizes the joint distribution p(X, Y ) directly [99].
HMM is known to be a generative model in the field of graphical models. The challenge
facing HMM is that it has to model the entire set of observation sequences p(X) explicitly,
which is intractable in our case (and many other domains) for two reasons. First, the
limited data collected from real-life network measurement makes it difficult to obtain a
full-fledged p(X). Second, the features inX (the features in the association activity vector)
can be highly correlated. For example, Song’s work shows that there is a strong correlation
between the lastest three APs visited by an user [111]. Kim’s work demonstrates that
the time and the location that a user will visit may follow a periodic pattern [59]. Such
dependences among features are difficult to model within an HMM. To circumvent the
problem, generative models like HMM and Naive Bayes make independence assumptions
that may not be realistic in practice.
92

Note, however, that modeling the joint distribution for X and Y (i.e., p(X, Y )) is not
important for the sequence labeling problem at all, because the observation sequences have
already been available to us. What we need is to find the conditional probability p(Y |X)
from the training dataset. Although it is possible to derive p(Y |X) as p(Y )p(X|Y )p(X)
based on
Bayes’ rule, the need to model the marginal distribution p(X) makes it a difficult approach.
The CRF method, in contrast, eliminates the necessity of knowing p(X) by building models
to predict label sequences Y conditional on observation sequences X . Hence, CRF is
indifferent to the dependence among features in X because X is now treated as given (i.e.,
a condition). Because CRF models the conditional probability p(Y |X) instead of the joint
distribution p(X, Y ), it is a discriminative approach rather than a generative one.
CRF is a special type of undirected graphic model. Let C denote the entire set of cliques,
which are fully connected subgraphs, in a CRF graph. A clique C ∈ C contains variables
from X , denoted XC , and also variables from Y , denoted YC . For a generic CRF, the goal
is to learn the following conditional distribution from the training data:
p(Y |X) =1
Z(X)
∏C∈C
ψC(YC , XC), (4.1)
where Z(X), sometimes called the partition function, is a normalization factor and is given
by:
Z(X) =∑Y
∏C∈C
ψC(YC , XC). (4.2)
Furthermore, ψC is a real-valued potential function on clique C; a commonly used
93

function is:
ψC(YC , XC) = exp(∑i
λifi(YC , XC)), (4.3)
where fi is a feature function and λi is the weight of feature function fi.
There is a special type of CRF models, called linear-chain CRF models, which are
particularly useful for solving sequence-labeling problems. Linear-chain CRF models are
conditionally trained as linear chains, instead of generic undirected graphical models. In
Figure 4.2, we show a linear-chain CRF, where the node representing X generated from
the model. In a linear-chain CRF, the set of cliques C contains every node (cliques of
size 1) and every edge (cliques of size 2) in the graph. Hence, the conditional probability
distribution is given by:
p(Y |X) =1
Z(X)
n∏i=1
ψi(Yi, X)ψ′i(Yi, Yi−1, X), (4.4)
where
ψi(Yi, X) = exp(k∑
j=1
θjsj(Yi, X, i)) (4.5)
ψ′i(Yi, Yi−1, X) = exp(k∑
j=1
λjtj(Yi−1, Yi, X, i)). (4.6)
In the above equations, sj is a state feature function of a label variable, and tj is a transition
feature function that depends on two consecutive label variables; θj and λj are parameters
for the linear-chain CRF. As there is no transition from Y0 to Y1, we can simply let λ1 be 0.
In this work, we used CRFsuite [86], a linear-chain CRF implementation for parameter es-
94

Y2 Y3 Yn−1 YnY1
...
1 2 n−1X=X , X , ..., X , Xn
Label variable Observed variable
Figure 4.2: Illustration of linear-chain CRF.
timation and inference, and defined the state feature function and transition feature function
as boolean functions, which are similar to those in Sutton and McCallun’s book [114]. It is
worth noting that many methods have been proposed to train linear-chain CRF models and
use them for inference. Due to limited space, we refer interested readers to the literature
for more thorough treatment on the topic of CRF [70, 114, 120].
4.5 Evaluation
In this section, we evaluate the effectiveness of the CRF-based method for correlation at-
tacks. We use the user-association log extracted from the SNMP log collected at Dartmouth
College between January 4, 2010 and March 6, 2010, which in total covered 62 days cor-
responding to one academic term. In the original dataset, there were 19,579 distinct MAC
addresses, which contributed to 3,076,318 association records. Because the WLAN at
Dartmouth College is an open network, any one physically at the campus site can use this
network for free, and thus a great portion of MAC addresses belong to visitors who have
appeared in the logs for only a short period of time. Because training CRF models for these
95

transient users would be difficult due to insufficient data, we filtered out those users who
were active in fewer than 45 days during this 62-day period, and the resulting dataset still
contained 79.7% of the user-association records with 4,285 distinct users and 1,364 distinct
APs. We used this reduced dataset for the experiments below. All the experiments were
performed on four commodity PCs, which took around four days to finish.
We use the Minimum Size of Candidate Identifier Set (MSCIS) as the metric to measure
the attack efficiency. Consider the relaxed correlation attack problem with a sanitized user
association dataset Ls and an observed sequence of AP association records Q. For each
IDi where 1 ≤ i ≤ Ns in Ls, we compute score wi according to Step 4 in the CRF-based
method. Suppose that IDj is the user ID of the victim who generated Q. The MSCIS is
defined as the number of user IDs whose scores are no smaller than wj . MSCIS establishes
an upper bound on how many candidate user IDs need be considered in order to contain
the victim’s user ID in the sanitized dataset. Note that if a user has the same score as the
victim’s (i.e., wj), his ID should also be counted into MSCIS.
We perform 10-round leave-one-out experiments. The 62-day user-association log is
partitioned into 10 bins of approximately the same length for each user. In the j-th round
(1 ≤ j ≤ 10), we use the j-th bin of each user’s association records as the testing dataset
(Lu) and the remaining nine as the training dataset (Ls) to build the CRF models. The
results shown below are the 10-round averages.
To set up a baseline case for comparison, we developed a simple distance-based method
described as follows:
Step 1. For each user in Ls, we build a time vector each day that contains how much time
96

this user spent at each AP. The length of a time vector is equal to the total number of
unique APs in the trace, and the number of time vectors for a given user is equal to
the number of days that the user appeared in Ls.
Step 2. Similarly, we compute a set of daily time vectors for each user in Lu.
Step 3. For each user in Lu, we compute the Euclidean distance between each of her time
vectors and every user’s time vectors in Ls, to obtain an average score for every user
in Ls.
Step 4. For each user in Lu, we sort the scores derived from Step 3 in non-decreasing
order to obtain a sorted list of user IDs in Ls, then compute the MSCIS for each user
in Lu.
Figure 4.3 compares the results of the CRF-based method and the distance-based method.
We initially sanitize the data by anonymizing only the MAC addresses but leaving the other
fields intact (other sanitization strategies are examined in Section 4.6). When the length of
Q is 5-6 days, the CRF-based method significantly outperforms the distance-based method
in attack efficiency: 73.2% of the 4,285 users can be pinpointed exactly from Ls; for 80.1%
of the users, their MSCIS is no more than 2, meaning that the victim’s ID appears among
the top two candidates according to the CRF-based method; for 99.7% of the users, their
MSCIS is no more than 20. Hence, using the CRF-based method, the adversary could al-
most surely narrow down the victim’s possible user ID into a set of 20 candidates from
the user association dataset with more than 4,000 users. The above results can be inter-
preted in the plain text as the following: an adversary has a 2-month-long anonymized
97
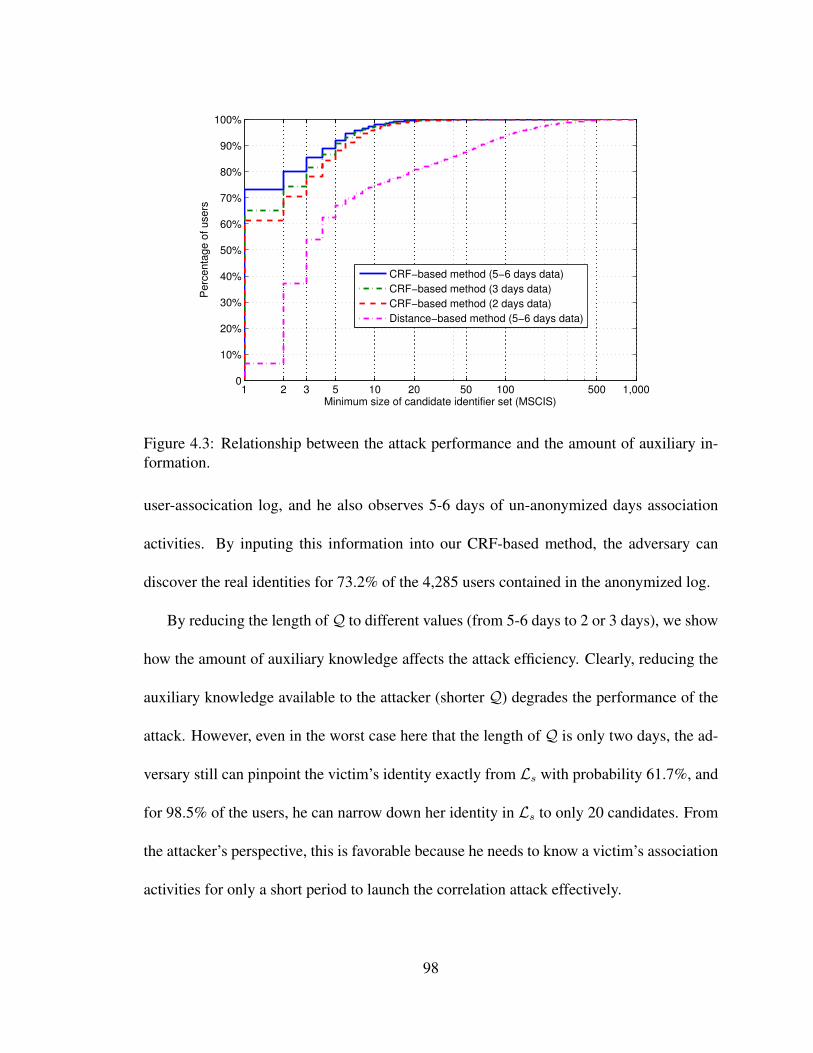
1 2 3 5 10 20 50 100 500 1,0000
10%
20%
30%
40%
50%
60%
70%
80%
90%
100%
Minimum size of candidate identifier set (MSCIS)
Perc
enta
ge o
f users
CRF−based method (5−6 days data)
CRF−based method (3 days data)
CRF−based method (2 days data)
Distance−based method (5−6 days data)
Figure 4.3: Relationship between the attack performance and the amount of auxiliary in-formation.
user-assocication log, and he also observes 5-6 days of un-anonymized days association
activities. By inputing this information into our CRF-based method, the adversary can
discover the real identities for 73.2% of the 4,285 users contained in the anonymized log.
By reducing the length ofQ to different values (from 5-6 days to 2 or 3 days), we show
how the amount of auxiliary knowledge affects the attack efficiency. Clearly, reducing the
auxiliary knowledge available to the attacker (shorter Q) degrades the performance of the
attack. However, even in the worst case here that the length of Q is only two days, the ad-
versary still can pinpoint the victim’s identity exactly from Ls with probability 61.7%, and
for 98.5% of the users, he can narrow down her identity in Ls to only 20 candidates. From
the attacker’s perspective, this is favorable because he needs to know a victim’s association
activities for only a short period to launch the correlation attack effectively.
98

4.6 Mitigation strategies
In the previous section, we play an adversary’s role and evaluate the effectiveness of the
CRF-based correlation attack under different amount of auxiliary information. We are also
interested in how well standard sanitization measures can prevent such privacy breaches.
Generally speaking, there are four categories of approaches to anonymizing datasets to
protect privacy: suppression-based methods remove information from the data, generalization-
based methods coarsen the level of information released in the data, perturbation-based
methods add noise into the data, and permutation-based methods swap sensitive associa-
tions between entities [24]. Because the information provided in a user-association record
is already limited, removing any field in it would make a released dataset hard to use.
On the other hand, the identity information in released AP association records has been
anonymized and thus swapping identity information between different users does not pre-
vent correlation attacks discussed in this work. Therefore, in the following we focus on
analyzing the effectiveness of generalization-based and perturbation-based methods in mit-
igating correlation attacks.
4.6.1 Generalization
Recall that the AP-naming scheme in the user-association logs uses a hierarchical structure:
building ID, floor level, and AP serial number. Hence, it is natural to apply generalization
on the AP names. We consider two generalization schemes here: one keeping only the
building information of each AP, and the other keeping both the building ID and the floor
99
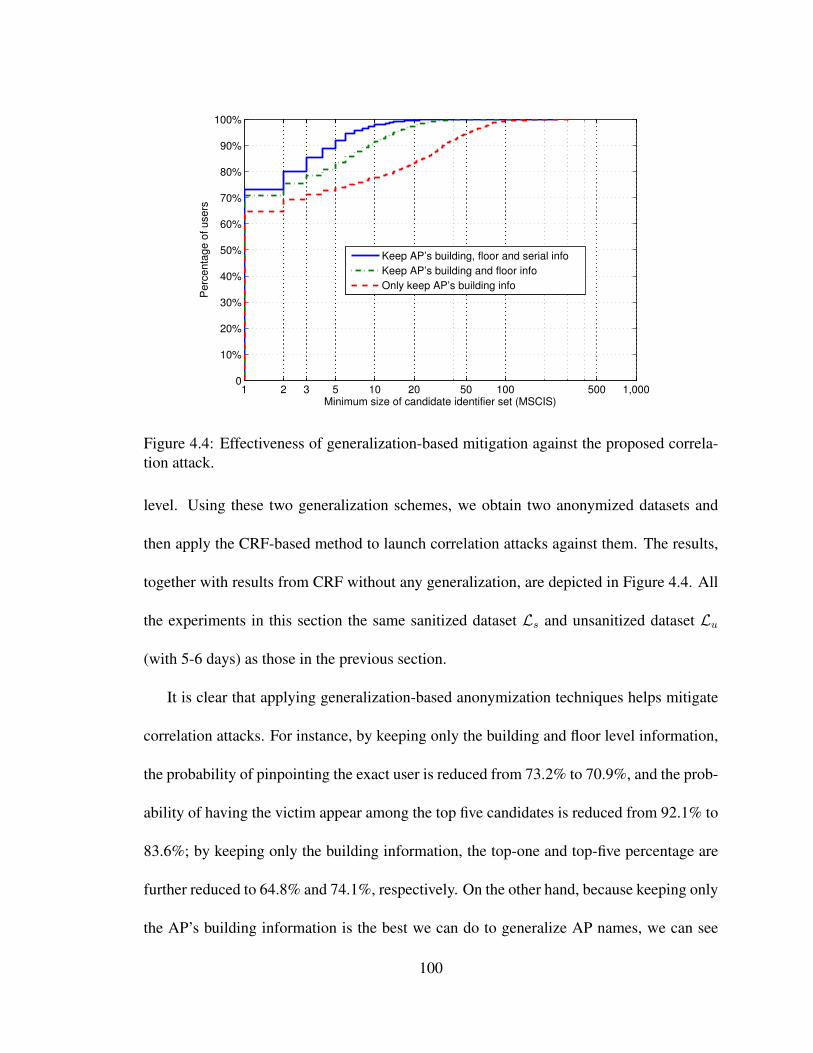
1 2 3 5 10 20 50 100 500 1,0000
10%
20%
30%
40%
50%
60%
70%
80%
90%
100%
Minimum size of candidate identifier set (MSCIS)
Perc
enta
ge o
f users
Keep AP’s building, floor and serial info
Keep AP’s building and floor info
Only keep AP’s building info
Figure 4.4: Effectiveness of generalization-based mitigation against the proposed correla-tion attack.
level. Using these two generalization schemes, we obtain two anonymized datasets and
then apply the CRF-based method to launch correlation attacks against them. The results,
together with results from CRF without any generalization, are depicted in Figure 4.4. All
the experiments in this section the same sanitized dataset Ls and unsanitized dataset Lu
(with 5-6 days) as those in the previous section.
It is clear that applying generalization-based anonymization techniques helps mitigate
correlation attacks. For instance, by keeping only the building and floor level information,
the probability of pinpointing the exact user is reduced from 73.2% to 70.9%, and the prob-
ability of having the victim appear among the top five candidates is reduced from 92.1% to
83.6%; by keeping only the building information, the top-one and top-five percentage are
further reduced to 64.8% and 74.1%, respectively. On the other hand, because keeping only
the AP’s building information is the best we can do to generalize AP names, we can see
100

only limited effectiveness of generalization-based schemes in mitigating correlation attacks
on user-association logs.
It is possible to replace an AP’s real name (building, floor, and serial information) with
a pseudo name in the released user-association logs. This approach will completely deter
our proposed CRF-based attack method because our method relies on the AP’s real name
to build the association activity tag (Section 4.4.1) and then use the tag to train a CRF
model. However, this method is still not perfect. Recent research [130] has shown that
by using additional techniques, it is easy for a dedicated adversary to re-identify the real
building information even though they have been anonymized in our previously published
trace [51].
4.6.2 Perturbation
Perturbation is another commonly used technique for data sanitization. Its key idea is to
add some noise into the original dataset such that user privacy can be preserved while the
usability of the dataset is still ensured. Based on the characteristics of the user association
logs, we consider two perturbation methods: spatial perturbation and temporal perturba-
tion.
• The spatial perturbation method changes the AP information in the original dataset
as follows. Let Si denote the sequence of user IDi’s AP association records, sorted
in increasing order of starting timestamps. For each record Rj in Si, we change the
AP in Rj to the AP in Rj−1 with probability 15%, change it to the AP in Rj+1 with
101

probability 15%, or keep it intact with probability 70%.
• The temporal perturbation method changes the start and end timestamps in the orig-
inal dataset as follows. For each AP association record, we add Gaussian noise with
mean 0 and standard deviation 3600 seconds to its start and end timestamps. Dur-
ing the process of adding noise, we do it sequentially on each user’s AP association
records and ensure that the starting timestamp of the current AP association record
is always greater than the end timestamp of the previous AP association record after
noise is added.
The effectiveness of both methods in mitigating correlation attacks is illustrated in Fig-
ure 4.5. Not surprisingly, both methods make it more difficult for the adversary to launch
correlation attacks. Using spatial perturbation, the probability of pinpointing the exact user
is reduced from 73.2% to 67.1%, and the probability of having the victim appear among
the top five candidates is reduced from 92.1% to 88.0%. On the other hand, if temporal per-
turbation is applied, the top-one and top-five percentage are reduced to 60.8% and 85.8%,
respectively.
Considering the results in Figures 4.4 and 4.5, we conclude that for all the mitiga-
tion techniques evaluated, their effectiveness in mitigating CRF-based correlation attacks
is rather limited. For instance, none of these methods is able to reduce the probability of
pinpointing the exact user ID below 55%. Although adding more noise in the perturbation-
based methods can further constrain the adversary’s capability in launching correlation
attacks, it may also damage the usability of the released user-association datasets.
102

1 2 3 5 10 20 50 100 500 1,0000
10%
20%
30%
40%
50%
60%
70%
80%
90%
100%
Minimum size of candidate identifier set (MSCIS)
Perc
enta
ge o
f users
Original data
Spatial perturbation
Temporal perturbation
Figure 4.5: Effectiveness of perturbation-based mitigation against the proposed correlationattack.
4.7 Conclusion
User-association logs collected from real-world WLANs have played an important role
in understanding these networks. Sharing them with the public, however, poses potential
risks to the privacy of the users involved. In this work, we show that people’s association
behaviors form implicit signatures for individual users. When combined with auxiliary
information, such signatures can help reveal the true identities of anonymized IDs in a
sanitized WLAN user-association log. This fact depicts two fundamental challenges in
sanitizing wireless-network traces: (1) A wireless-network trace may be more difficult to
sanitize properly than a wired-network trace, because it contains additional information,
such as location. Some information that is unique to a wireless network, such as a user
mobility pattern, may impose a severe privacy threat in sanitizing a wireless-network trace.
103

(2) Standard sanitization techniques, such as generalization and perturbation, are unable to
effectively mitigate some powerful de-sanitization attacks, such as our CRF-based attack.
This result calls for more thorough study of potential privacy risks when sharing wireless-
network traces with the public.
104

Chapter 5
Case study: evaluating the tradeoffbetween utility and privacy onuser-association logs
It takes great effort and care to correctly sanitize traces. In a survey that we conducted
among network researchers [127], only 34% of survey participants with experience sani-
tizing traces used a third-party tool; the rest either used home-grown software or manually
edited the traces. These solutions are inevitably likely to include errors affecting the privacy
or utility of the resulting trace. Moreover, 84% of those with experience sanitizing traces
stated that they did not use any quantitative metrics to measure sanitization strength. In this
chapter, we conduct a case study that evaluates the tradeoff between privacy and utility in
the process of sanitizing a user-association log. We focus on the following questions: To
what degree will the trace sanitization affect the research utility of a trace? In an extreme
case, will the research draw a different conclusion on the sanitized trace than it would on
an unsanitized trace? What changes made by the sanitization result in such a disparity?
105

5.1 Utility metric: Markov handoff predictor
The utility of network traces is an abstract concept; it is only “instantiated” when attached
to a specific research task. Different research tasks use network traces in different ways,
and these researchers have different understandings of and requirements for the “utility” of
network traces. Furthermore a development of a global utility metric to apply to network
traces is difficult due to the inherent complexity and interdependent nature of a network
trace. An application-dependent utility metric is more feasible than a global metric. In this
chapter we choose handoff prediction in the wireless network as our application scenario,
a Markov handoff predictor as our utility metric [111], and the accuracy of such a predictor
as the indicator of trace utility.
To compare the trace utility before and after a sanitization, it is important to distinguish
between the concepts of the indicator of utility and the utility metric. In this case study, the
indicator of utility tells what is the prediction accuracy of a Markov predictor applied on a
dataset. It is a local view. The utility metric tells how well this Markov predictor behaves
compared to other Markov predictors. It is a global observation, or we say a research
conclusion. As to the utility of a trace, we care about the research conclusion drawn from
it (“Which Markov predictor is the best?”) instead of the specific numbers (“What is the
accuracy of this predictor?”).
Due to the limited propagation range of Wi-Fi radio waves, each AP can only cover a
limited geographical area. In such an environment, a wireless device associates with one
Access Point (AP) at any time to maintain the access to the network. When a wireless
106

device moves from one place to another, it needs to disassociate from the previous AP and
associate with a new, closer AP. This procedure is named “handoff”, which also occurs in
other large-scale networks, such as cellular networks. Here, we focus on the “handoff” in
enterprise wireless networks, and we use the terms “location” and “AP” interchangeably.
With the increasing popularity of large-scale enterprise wireless networks, handoff predic-
tion for wireless devices becomes one of fundamental problems in mobile computing. For
more information about the importance of handoff prediction, interested readers may refer
to Song’s work [111, 112].
The goal of handoff prediction is to predict the next location where the wireless device
will move, based on the current location and the location history of this device. Many
location-prediction algorithms have been proposed in recent years, including Markov pre-
dictors, LZ-based predictors, and Prediction by Partial Matching (PPM) predictors. Here
we focus on the family of Markov predictors, which are convenient to implement and also
have performance comparable to (or even better than) more complex predictors [112].
An order-k (denoted as “O(k)”) Markov predictor predicts the next location from cur-
rent context, that is, the sequence of k most recent locations in the location history. A
wireless device’s location history to date is presented as a sequence L = loc0, loc1, ..., locn,
where loc0 is the AP associated at the beginning of history, locn is the AP where the device
is associated now, and each loci in the sequence represents a handoff to a different AP. If
the device leaves the network area, or turns off, a special loc =“OFF” is used.
Let subsequence L(i, j) = loci, loci+1, ..., locj for any 0 ≤ i ≤ j ≤ n. Let X be
the random variable of a device location, and X(i, j) be the sequence of random variables
107

Xi, Xi+1, ..., Xj for any 0 ≤ i ≤ j ≤ n. Let L be the set of all possible locations. Define
the context c = L(n − k + 1, n). The Markov predictor is built on the validity of the
following equations, for any location l ∈ L,
P (Xn+1 = l | X(1, n) = L)
= P (Xn+1 = l | X(n− k + 1, n) = c)
= P (Xi+k+1 = l | X(i+ 1, i+ k) = c)
where P (Xi = l|...) is the conditional probability that Xi takes the value l given the cur-
rent context. These equations can be interpreted to mean that the probability that a de-
vice will move to a new location “l” only depends on the context of the k most recently
visited locations. We can generate an estimate of P , denoted by P , using the equation
P (X = l|L) = N(cl, L)/N(c, L) where N(s′, s) denotes the number of occurrences of the
subsequence s′ in the sequence s. When we use the O(k) Markov predictor to predict the
next location where a device will move, we choose a location l (l ∈ L) that produces the
maximum probability P (X = l|L). It is worth noting that if the location l has never ap-
peared in the history before, the estimated probability is 0, and we name this phenomenon
“a missed prediction”.
108

5.2 Privacy metric: LKC privacy
When sharing data, privacy is a relative concept because the data publishers often have
limited or no controls on the adversary’s background knowledge. Most researchers have
adopted a relaxed and more practical approach to privacy by confining the types of at-
tacks and the amount of background knowledge that are available to the adversary. Many
privacy metrics have been proposed and proven to be useful in database-privacy research
community, such as k-anonymity, (α, k)-anonymity, and l-diversity. However, these pri-
vacy metrics are not easily applicable to network traces, because network traces are high-
dimensional, sparse, and sequential. As a generalization of multiple traditional privacy
models, LKC privacy [82–84] is a newly proposed privacy model that tries to characterize
such high-dimensional, sparse, and sequential data.
Before we define LKC privacy, let us introduce the concept of “trajectory data” as an
example of sequential data. A trajectory dataset T is a collection of trajectory records,
where each record follows the form:
〈(loc0, t0)→ ...→ (locn, tn)〉 : s0, ..., sp : d0, ..., dm
where 〈(loc0, t0)→ ...→ (locn, tn)〉 is a path; (loci, ti) represents the fact that a given
object visited the location loci at time ti; si ∈ Si are sensitive attributes, and di ∈ Di are
quasi-identifying attributes associated with the object.
LKC privacy is built on the basic assumption that because of the practical difficulty
in a real-life attack, an adversary is not able to know a victim’s complete path sequence
〈(loc0, t0)→ ...→ (locn, tn)〉 but only part of it, and the adversary’s knowledge is bounded
109

by L pairs of (loci, ti) in this victim’s path sequence. LKC privacy is then formally defined
as follows:
Definition 1 LKC privacy. Let L be the maximum length of the adversary’s background
knowledge. Let S be a set of sensitive attributes. A trajectory dataset T satisfies LKC
privacy if and only if for any sequence q = 〈(loci, ti) → ... → (locj, tj)〉 with |q| =
(j − i+ 1) ≤ L,
1. T (q) ≥ K, where K > 0 is an integer anonymity threshold, and
2. P (s|q) ≤ C for any s ∈ S, where 0 ≤ C ≤ 1 is a real number confidence threshold.
Here, sequence q is a snippet of a path in T , T (q) is the number of paths in dataset T
that contain sequence q, and P (s|q) is the conditional probability that a sensitive attribute
s may appear in the given sequence q.
By setting L, K, and C to different values, LKC privacy can achieve different-strength
tradeoffs between data utility and data privacy, or between data utility and adversary’s
knowledge. Decreasing L and K, or increasing C, will preserve data utility at the expense
of data privacy. Increasing L and K, or decreasing C, will improve data privacy while
jeopardizing data utility.
To measure how well a trajectory dataset fulfills LKC privacy, we introduce another
two concepts: violating sequence and minimum violating sequence.
Definition 2 Violating sequence. Let q be a sequence in T with |q| ≤ L. The sequence q is
a violating sequence with respect to a LKC-privacy requirement if (1) q is non-empty, and
(2) |T (q)| ≤ K or P (s|q) > C for any sensitive value s ∈ S.
110

Definition 3 Minimal violating sequence. A violating sequence q is a minimal violating
sequence (MVS) if every proper subsequence of q is not a violating sequence.
It is obvious that a trajectory dataset will satisfy a given LKC privacy requirement if all
minimal violating sequences are removed from the dataset [82].
5.3 Experiment
To study the privacy-utility tradeoff using the Markov predictor and LKC privacy, we con-
ducted our experiments on the user-association logs collected at Dartmouth College be-
tween January 4, 2010 and March 6, 2010. This dataset contained 19,579 distinct MAC
addresses, which contributed 3,076,318 association records. We used the whole dataset
and did not filter out filter out any transient users. As noted in previous chapters, the AP-
naming scheme in the user-association logs uses a hierarchical structure: building ID, floor
level, and AP serial number. Here we only used buildingID as the location identifier.
There were 185 unique buildingIDs in the trace. If a wireless device disconnected from
the network at anytime, we regarded this device as in the “OFF” state during that time, and
we introduced the “OFF” state as a special location identifier. So in this experiment there
were 186 unique locations to which a wireless device could travel.
We built a Markov handoff predictor for each wireless device incrementally, as in the
prior literature: the predictor builds the Markov transition probability table, over time, as
the device moves to each new location. This practice, necessary in any practical location
predictor, results in some perturbation to the estimation of P (X = l|L) because this esti-
111

mated value evolves over time. So given the same context, the predictor may predict loci
as the next most probable location at time ti, but it may predict a different location locj at
a later time tj . This observation does not invalidate the Markov equations in Section 5.1,
because they are still valid at any given time for all the transitions they have seen until that
time.
We regarded the wireless device’s MAC address as the only sensitive attribute s0, in
LKC privacy, so there were 19,579 sensitive attributes considered. To be consistent with
the information available to the Markov predictor, we used the trajectory record that omit-
ted the time information and followed the form 〈(loc0) → ... → (locn)〉 : s0, where loci
was the buildingID, and s0 was the wireless device’s MAC address. All association activ-
ities of a given wireless device form one row in the trajectory dataset. Because the MAC
address is the only sensitive attribute, and each MAC address has one row of record in the
trajectory dataset, this leads to C = 1/K for the LKC-privacy analysis on these logs. For
a given LKC-privacy setting, after we identified all minimum violating sequences (MVSs)
using the algorithm proposed by Mohammed [82], we sanitized the trace by substituting
each occurrence of MVS with a special location identifier “B”. Not only does this global
substitution have the same effect as removing all MVSs to enforce LKC privacy, but also
it makes obvious the existence of sanitization to the trace users. When we applied Markov
predictor on such a sanitized trace, we treated the identifier “B” as the termination of a con-
text: we did not consider it as part of a context to build a prediction, and we did not predict
a destination noted by “B”. After leaving a “B” state, the device’s context began again as
empty, growing up to the length K as the device continued to move to new locations.
112

Figure 5.1 is the empirical CDF plot of the correct prediction ratio on the unsanitized
original and various sanitized traces. The x and y axes are the correct prediction ratio and
the percentage of wireless devices respectively. The correct prediction ratio is defined for
each device as:
Correct prediction ratio = Number of correct predictionsNumber of predictions
where Number of predictions = Number of correct + wrong + missed predictions. Fol-
lowing this manner, the wrong and missing prediction ratios are defined as:
Wrong prediction ratio = Number of wrong predictionsNumber of predictions
Missed prediction ratio = Number of missed predictionsNumber of predictions
The Markov handoff predictor achieved better prediction accuracy on the sanitized
traces than it did on the original unsanitized trace. That is, CDF curves for different LKC-
privacy settings (L = 5 and K = 5, L = 10 and K = 5) all stayed closer to the bottom
right than the CDF curves generated on the original trace. The Markov predictor also
improved the prediction accuracy along with the increased privacy strength (increasing L
from 5 to 10). This trend is easy to understand because after applying stronger LKC pri-
vacy, the more infrequent sequences were filtered out; these infrequent sequences tend to
be violating sequences and are difficult to predict. Thus not only did the number of unique
contexts decrease, but also for a given context in the Markov predictor, the number of prob-
able next locations decreased. This made the prediction easier because the predictor had
fewer choices. Figure 5.2 compares the number of unique contexts in the original and the
sanitized trace.
Song’s research [111, 112] illustrated that even though a longer context provides more
113

00.1
0.2
0.3
0.4
0.5
0.6
0.7
0.8
0.9
10
10%
20%
30%
40%
50%
60%
70%
80%
90%
100%
Corre
ct p
redic
tion ra
tio
Percentage of users
Em
piric
al C
DF
O(2
)
O(3
)
O(4
)
L5K
5 O
(2)
L5K
5 O
(3)
L5K
5 O
(4)
L10K
5 O
(2)
L10K
5 O
(3)
L10K
5 O
(4)
Figure 5.1: Correct prediction ratio on unsanitized and sanitized traces.
114

10
010
110
210
310
40
10%
20%
30%
40%
50%
60%
70%
80%
90%
100%
Num
ber o
f uniq
ue c
onte
xts
encounte
red
Percentage of users
Em
piric
al C
DF
O(2
)
O(3
)
O(4
)
L10K
5 O
(2)
L10K
5 O
(3)
L10K
5 O
(4)
Figure 5.2: Comparison of number of unique contexts.
115

information than a shorter one to the handoff predictor, it may not benefit the prediction
accuracy in practice. He evaluated Markov predictors with different context lengths and
observed that the O(2) Markov predictor outperformed both O(3) and O(4) Markov pre-
dictors. In Figure 5.1, our results followed the same trend as his observation on both the
original unsanitized trace (the green curves) and one sanitized trace (the red curves, L = 5
and K = 5). The consistent trend among the results was a useful phenomenon, because
it demonstrated that we could probably achieve a good balance between trace privacy and
trace utility: on one hand we could sanitize the original trace to improve its privacy, and
on the other hand such a sanitization could preserve the trace’s research utility, that is, the
conclusion drawn from the original trace is the same as the one drawn from the sanitized
trace. Ideally, we hoped the trend to hold no matter what sanitization was applied. How-
ever, after enforcing a stricter LKC privacy by increasing L from 5 to 10, the O(3) Markov
predictor replaced O(2) to be the new performance winner. This result overturned Song’s
result that O(2) was better than O(3) predictors.
Why would a stricter LKC privacy setting change the relative performance of Markov
predictors? Figure 5.3 and Figure 5.4 are the CDF plot of wrong- and missed- prediction
ratios, respectively. LKC privacy’s trace-filtering effect was visible in Figure 5.3, showing
that a longer context always had fewer wrong predictions (curves closer to the top-left
corner) no matter whether the trace was sanitized or not. However, this plot alone could
not explain why the O(3) Markov predictor outperformed the O(2) predictor on the 〈L =
10, K = 5〉 sanitized trace. Figure 5.4 provides the answer. The O(2) Markov predictor
has the fewest missing predictions on the original trace (the left subplot), while the O(3)
116

00.1
0.2
0.3
0.4
0.5
0.6
0
10%
20%
30%
40%
50%
60%
70%
80%
90%
100%
Wro
ng p
redic
tion ra
tio
Percentage of users
Em
piric
al C
DF
O(2
)
O(3
)
O(4
)
L5K
5 O
(2)
L5K
5 O
(3)
L5K
5 O
(4)
L10K
5 O
(2)
L10K
5 O
(3)
L10K
5 O
(4)
Figure 5.3: Wrong-prediction ratio on unsanitized and sanitized traces.
117

Figure 5.4: Missed-prediction ratio on unsanitized and sanitized traces.
118

Markov predictor has the fewest missing predictions on 〈L = 10, K = 5〉 sanitized trace.
We know that the following equation is always true:
Correct prediction ratio = 1 - (Wrong + Missed prediction ratios).
On the 〈L = 10, K = 5〉 sanitized trace, although the O(3) predictor had more wrong
predictions than the O(2) predictor, it had fewer missed predictions, which compensated
its disadvantage in wrong prediction. On the original unsanitized trace, the situation was
reversed. Overall, the O(2) Markov predictor was the winner on the original trace, but
the O(3) predictor replaced it on this sanitized trace. A missed prediction only happens
when the handoff predictor sees a given context for the first time. When a stricter LKC
privacy setting was applied, it had two opposite effects on the trace. First, it filtered out
infrequent sequences and reduced the number of unique contexts (as shown in Figure 5.2).
This effect led the Markov predictor to have better overall performance on the sanitized
traces than that on the original trace. Second, the “infrequency” of those filtered-out se-
quences is solely decided by the LKC privacy setting, not by the Markov predictor. Thus a
sequence regarded as “infrequent” by LKC-privacy might be a “frequent” one in the view
of a Markov predictor. After applying a stricter LKC privacy setting, many such sequences
are marked as violating sequence and then removed. This results in the decreased number
of unique (and “Markov-frequent”) contexts, and thus a Markov predictor’s performance is
jeopardized.
119

5.4 Summary
In this chapter, we present a case study that evaluates the tradeoff between privacy and util-
ity on a user-association log, by using the LKC privacy and Markov predictors. While san-
itization will unavoidably alter a user-association log, it is possible to preserve the trace’s
utility for handoff-prediction application and fulfill the designated LKC-privacy require-
ment at the same time. However, maintaining a good tradeoff between privacy and utility
is not an easy task. The trace publisher must cautiously plan and configure the privacy set-
tings when sanitizing a user-association log, otherwise an overwhelming privacy require-
ment may jeopardize the trace’s utility and overturn the corresponding research conclu-
sions. Similarly, the trace user (researcher) must carefully consider whether their planned
use of the trace may be affected by the transformations used to sanitize the trace. Cur-
rently my colleagues and I are developing the NetSANI (Network Trace Sanitization and
ANonymization Infrastructure) framework for automatic analysis and fine-tuning of the
privacy/utility tradeoff in network trace sanitization [44].
120
Chapter 6
Summary and future work
In this chapter, we summarize our research on building a large-scale, distributed WLAN
measurement system, and analyzing potential privacy threats with a user-association log.
We also discuss future research directions in these fields.
6.1 Summary of contributions
As an important part of the Internet edge, enterprise-wide WLANs are increasingly used for
many mission-critical tasks. An understanding of WLAN usage and network behavior is
valuable for both network management and research. To study a large production WLAN
involves two fundamental difficulties: building a scalable, secure, and efficient WLAN
measurement system, and ensuring user privacy when sharing the collected wireless net-
work traces with other researchers. In this dissertation, we make important contributions to
both of these challenges.
In Chapter 2 we introduced the design, implementation, evaluation, and application of
DIST, our distributed large-scale WLAN measurement system. In the MAP project [107],
121
the predecessor of the DIST project, we implemented a building-wide WLAN monitoring
system. However, when an attempt was made to scale the deployment from a building to a
campus, the MAP system could no longer meet the required levels of efficiency, scalability,
security and manageability. Our new measurement system, DIST, was designed to address
these challenges. I designed and built two major components in DIST: Saluki and DIST-
SANI. Saluki is a high-performance distributed sniffing system [115]. Compared to our
previous implementation and to other available sniffing programs, Saluki has the follow-
ing advantages: (1) its small footprint makes it suitable for a resource-constrained Linux
platform, such as those in commercial Wi-Fi access points; (2) the frame-capture rate in-
creased more than three-fold with minimal frame loss; (3) all traffic between the sniffer and
the back-end server was secured using 128-bit encryption; and (4) under the same frame-
capture rate, the traffic load on the backbone network was reduced to only 30% of that in
our previous implementation. DISTSANI is an online network trace sanitization and dis-
tribution program. It receives the network trace captured by Saluki, sanitizes several fields
in the frame/packet headers, and distributes the processed trace to different destinations,
according to user specifications – either to a trace file on local hard drives or to a live UDP
stream forwarded to data subscribers.
We conducted a long-term (62 days) experiment to evaluate the performance of DIST.
206 out of 210 AMs were used for this evaluation, and 412 Saluki instances were running
on 412 radio interfaces. Our DIST system collected 3.7 terabytes of traces in gzip com-
pressed format (24 terabytes in uncompressed form) and sustained 42,727 fps peak frame
rate. By using only 14% to 25% CPU on a 5-year-old-server, one instance of DISTSANI
122

was able to handle the aggregated traffic streams from 412 Saluki instances. All these
proved the stability and efficiency of our DIST system in a production environment.
DIST provides us an efficient, general-purpose platform to study large-scale WLANs in
a refined manner. As one application of DIST for security study, we built the DIST Active
Protection System to mitigate the ongoing security threats on enterprise-wide WLANs.
The DIST APS uses several denial-of-service (DoS) attacks in a “benign” way that pre-
vents users from connecting to an unauthorized AP, or forces them to break an existing
connection. This system achieved 351-millisecond response time and used only 1.5 Mbps
bandwidth to protect all nearby client devices from an unauthorized AP.
Creating and operating a large-scale network measurement infrastructure is a daunt-
ing task. To fully take advantage of such a prohibitive investment, sharing network traces
becomes an essential feature of wireless network research. To preserve network users’ pri-
vacy, a trace publisher must sanitize the network traces before sharing them with the public.
For an enterprise-wide network with thousands of users, privacy analysis on wireless net-
work traces is necessary to understand the severity of potential trace-sharing risks.
In Chapter 4, we conduct privacy analysis on one of the simplest wireless network
traces, a user-association log collected from a large-scale WLAN. User-association logs
record where and when a user has used the network. Such information plays an impor-
tant role in wireless network research. By simulating an adversary’s role, we propose an
algorithm based on conditional random fields in which the adversary uses the anonymized
association log to build signatures for each user, and then leverages auxiliary information
to use these signatures to identify users within the anonymized log. The intuition behind
123

the proposed algorithm is that human activities often follow certain regularities. These reg-
ularities are inherent in the temporal and spatial information of the association log, whether
or not the log is sanitized. Different users may have different association patterns, and we
can use such differences to fingerprint and distinguish users.
Using a user-association log that contains 4,285 distinct users and 1,364 distinct APs,
we demonstrate that this attack technique, under certain circumstances, was able to pin-
point the victim’s identity exactly with a probability as high as 70%, or narrow it down to
a set of 20 candidates with a probability close to 100%. We further evaluate the effective-
ness of standard anonymization techniques, including generalization and perturbation, in
mitigating correlation attacks; our experimental results reveal only limited success of these
methods, suggesting that more thorough treatment is needed when anonymizing wireless
user association logs before public release.
Thus, one should take great care to effectively sanitize network traces. However, a
trace publisher can not blindly increase the sanitization strength without considering the
utility left in the sanitized trace. Chapter 5 presents a case study to evaluate the tradeoff be-
tween privacy and utility on a user-association log, by using the LKC privacy and Markov
predictors. We observed that it was possible to achieve a balance between preserving the
trace’s utility for handoff-prediction application and fulfilling the predefined LKC-privacy
requirement. A stronger privacy setting does not always mean better: as shown in Chap-
ter 5, an overwhelming privacy requirement may not only jeopardize the trace’s utility but
also overturn the corresponding research conclusions.
124

6.2 Future work
The following are some promising extensions of our work in wireless network measure-
ment and trace analysis:
• We could merge the packet data collected by DIST with those collected from other
sources, such as SNMP logs, to provide a unified view about the monitored wireless
network.
• We could find more efficient ways to store, retrieve, and analyze the huge volume of
data collected by DIST.
• We could integrate DIST with other 3rd-party tools, such as Wireshark, to provide a
user-friendly, convenient, and real-time analysis solution for network administrators.
• We could expand the DIST infrastructure to monitor more kinds of wireless network
traffic, such as Bluetooth and ZigBee traffic.
• We could develop a virtualization approach that enables DIST to be used for multiple
research tasks simultaneously.
• Besides network monitoring, we could leverage the wide deployment of DIST to
carry out other interesting wireless network research, such as mesh networks.
• To reduce the huge investment in building a large-scale WLAN monitoring system,
we could migrate the software components of DIST to commercial WLAN infras-
tructure, possibly combining the sniffing capability with the AP’s main responsibility
for managing client associations and bridging traffic.
125

• We could apply the proposed correlation-attack algorithm to traces other than Dart-
mouth WLAN’s user-association log, such as cellphone-association logs.
• We could find a more effective approach to sanitize user-association logs.
• We could find a more powerful privacy metric than LKC privacy that could incorpo-
rate domain knowledge.
• We could find an automatic approach that discovers the optimal tradeoff between
privacy and utility in sanitizing network traces.
126

Bibliography
[1] AUSCERT Advisory. Denial of service vulnerability in IEEE 802.11 wireless de-
vices. Online at http://www.auscert.org.au/render.html?it=4091, visited 2011.
[2] Mikhail Afanasyev, Tsuwei Chen, Geoffrey M. Voelker, and Alex C. Snoeren. Anal-
ysis of a mixed-use urban Wi-Fi network: when metropolitan becomes neapolitan.
In Proceedings of the 8th ACM SIGCOMM Conference on Internet Measurement
(IMC), pages 85–98. ACM, 2008. DOI 10.1145/1452520.1452531.
[3] Charu C. Aggarwal and Philip S. Yu. Privacy-Preserving Data Mining: Models and
Algorithms. Springer-Verlag, 2008.
[4] Brad Antoniewicz. Wi-Fi: Rogue AP detection and AP im-
personation. Online at http://blogs.mcafee.com/mcafee-labs/
wifi-rogue-ap-detection-and-ap-impersonation, visited 2007.
[5] Aruba Networks Air Monitors, 2010. Online at http://www.arubanetworks.com.
[6] Information Technology Laboratory at National Institute of Standards and Tech-
nology. The Keyed-Hash Message Authentication Code (HMAC). Online at
127

http://csrc.nist.gov/publications/fips/fips198/fips-198a.pdf, visited 2011.
[7] Paramvir Bahl, Ranveer Chandra, Jitendra Padhye, Lenin Ravindranath, Manpreet
Singh, Alec Wolman, and Brian Zill. Enhancing the security of corporate Wi-Fi
networks using DAIR. In Proceedings of the 4th International Conference on Mobile
Systems, Applications and Services (MobiSys), pages 1–14. ACM, 2006. DOI 10.
1145/1134680.1134682.
[8] Anand Balachandran, Geoffrey M. Voelker, Paramvir Bahl, and P. Venkat Rangan.
Characterizing user behavior and network performance in a public wireless LAN.
SIGMETRICS Performance Evaluation Review, 30(1):195–205, 2002. DOI 10.1145/
511399.511359.
[9] Kevin Bauer, Damon Mccoy, Ben Greenstein, Dirk Grunwald, and Douglas Sicker.
Using wireless physical layer information to construct implicit identifiers. In Pro-
ceedings of the Hot Topics in Privacy Enhancing Technologies (HotPETS), July
2008. Online at http://petsymposium.org/2008/hotpets/mccoyd hotpets2008.pdf.
[10] John Bellardo and Stefan Savage. 802.11 denial-of-service attacks: Real vulnera-
bilities and practical solutions. In Proceedings of the USENIX Security Symposium,
pages 15–28. USENIX, August 2003. Online at http://www.usenix.org/publications/
library/proceedings/sec03/tech/bellardo.html.
[11] Michele Bezzi. An entropy based method for measuring anonymity. In Pro-
ceedings of the International Conference on Security and Privacy in Communica-
128

tions Networks and the Workshops (SecureComm), pages 28–32, Sept. 2007. DOI
10.1109/SECCOM.2007.4550303.
[12] Matt Bishop, Rick Crawford, Bhume Bhumiratana, Lisa Clark, and Karl Levitt.
Some problems in sanitizing network data. In Proceedings of the IEEE International
Workshops on Enabling Technologies: Infrastructure for Collaborative Enterprises
(WETICE), pages 307–312. IEEE Press, 2006. DOI 10.1109/WETICE.2006.62.
[13] Ethan Blanton. TCPurify: A “sanitary” sniffer, 2000. Online at http://masaka.cs.
ohiou.edu/∼eblanton/tcpurify/.
[14] Sergey Bratus, Cory Cornelius, David Kotz, and Daniel Peebles. Active behav-
ioral fingerprinting of wireless devices. In Proceedings of the ACM Conference
on Wireless Network Security (WiSec), pages 56–61. ACM Press, 2008. DOI
10.1145/1352533.1352543.
[15] Sergey Bratus, David Kotz, Keren Tan, William Taylor, Anna Shubina, Bennet
Vance, and Michael E. Locasto. Dartmouth Internet Security Testbed (DIST): build-
ing a campus-wide wireless testbed. In Proceedings of the Workshop on Cyber Se-
curity Experimentation and Test (CSET). USENIX Association, August 2009.
[16] Tønnes Brekne, Andre Arnes, and Arne Øslebø. Anonymization of IP traffic mon-
itoring data: Attacks on two prefix-preserving anonymization schemes and some
proposed remedies. In Proceedings of the International Symposium on Privacy En-
hancing Technologies (PET), volume 3856 of Lecture Notes in Computer Science,
pages 179–196. Springer-Verlag, 2005. DOI 10.1007/11767831 12.
129
[17] Justin Brickell and Vitaly Shmatikov. The cost of privacy: destruction of data-mining
utility in anonymized data publishing. In Proceedings of the ACM SIGKDD Interna-
tional Conference on Knowledge Discovery and Data Mining (KDD), pages 70–78.
ACM, August 2008. DOI 10.1145/1401890.1401904.
[18] Martin Burkhart, Daniela Brauckhoff, Martin May, and Elisa Boschi. The risk-
utility tradeoff for IP address truncation. In Proceedings of the ACM Workshop
on Network Data Anonymization (NDA), pages 23–30. ACM, October 2008. DOI
10.1145/1456441.1456452.
[19] Aaron J. Burstein. Toward a culture of cybersecurity research. Technical Report
1113014, UC Berkeley Public Law Research Paper, 2008. Online at http://ssrn.com/
abstract=1113014.
[20] Cooperative Association for Internet Data Analysis (CAIDA). Online at http://www.
caida.org/, visited 2008.
[21] Yu-Chung Cheng, John Bellardo, Peter Benko, Alex C. Snoeren, Geoffrey M.
Voelker, and Stefan Savage. Jigsaw: solving the puzzle of enterprise 802.11 anal-
ysis. SIGCOMM Computer Communication Review, 36(4):39–50, 2006. DOI
10.1145/1151659.1159920.
[22] V. Ciriani, S. De Capitani di Vimercati, S. Foresti, and P. Samarati. k-Anonymity.
In T. Yu and S. Jajodia, editors, Secure Data Management in Decentralized Systems.
Springer-Verlag, 2007.
130

[23] Sebastian Clauß. A framework for quantification of linkability within a privacy-
enhancing identity management system. In Guter Muller, editor, Proceedings of
Emerging Trends in Information and Communication Security, volume 3995 of
Lecture Notes in Computer Science, pages 191–205. Springer-Verlag, 2006. DOI
10.1007/11766155 14.
[24] G. Cormode and D. Srivastava. Anonymized data: generation, models, usage. In
Proceedings of the 35th SIGMOD International Conference on Management of Data
(SIGMOD), pages 1015–1018. ACM, 2009. DOI 10.1145/1559845.1559968.
[25] S. E. Coull, M. P. Collins, C. V. Wright, F. Monrose, and M. K. Reiter. On web
browsing privacy in anonymized netflows. In Proceedings of the USENIX Secu-
rity Symposium, pages 1–14. USENIX, 2007. Online at http://www.usenix.org/
publications/library/proceedings/sec03/tech/bellardo.html.
[26] Scott Coull, Charles Wright, Fabian Monrose, Angelos Keromytis, and Michael
Reiter. Taming the Devil: Techniques for evaluating anonymized network data.
In Proceedings of the Annual Symposium on Network and Distributed System Se-
curity (NDSS). IEEE Press, February 2008. Online at http://www.isoc.org/isoc/
conferences/ndss/08/papers/08 taming the devil.pdf.
[27] Scott E. Coull, Fabian Monrose, Michael K. Reiter, and Michael D. Bailey. The
Challenges of Effectively Anonymizing Network Data. In Proceedings of the Cyber-
security Applications & Technology Conference For Homeland Security (CATCH),
131

pages 230–236, March 2009. Online at http://www.cs.unc.edu/∼scoull/CATCH09.
pdf.
[28] Scott E. Coull, Charles V. Wright, Fabian Monrose, Michael P. Collins, and
Michael K. Reiter. Playing Devil’s advocate: Inferring sensitive information from
anonymized network traces. In Proceedings of the Annual Symposium on Network
and Distributed System Security (NDSS). IEEE Press, February 2007. Online at
http://www.isoc.org/isoc/conferences/ndss/07/papers/playing devils advocate.pdf.
[29] Community Resource for Archiving Wireless Data At Dartmouth (CRAWDAD),
2010. Online at http://www.crawdad.org/.
[30] R. Crawford, M. Bishop, B. Bhumiratana, L. Clark, and K. Levitt. Sanitization mod-
els and their limitations. In Proceedings of the Workshop on New Security Paradigms
(NSPW), pages 41–56. ACM Press, 2007. DOI 10.1145/1278940.1278948.
[31] Internet measurement data catalog (DatCat). Online at http://www.datcat.org, visited
2010.
[32] E. C. R. de Oliveira and C. V. N. de Albuquerque. NECTAR: a DTN routing protocol
based on neighborhood contact history. In Proceedings of the 2009 ACM Symposium
on Applied Computing (SAC), pages 40–46. ACM, 2009. DOI 10.1145/1529282.
1529290.
[33] Udayan Deshpande, Tristan Henderson, and David Kotz. Channel sampling strate-
gies for monitoring wireless networks. In Proceedings of the Second International
132

Workshop on Wireless Network Measurement (WiNMee). IEEE Computer Society
Press, April 2006. DOI 10.1109/WIOPT.2006.1666486.
[34] Udayan Deshpande, Chris McDonald, and David Kotz. Coordinated sampling to
improve the efficiency of wireless network monitoring. In Proceedings of the 15th
IEEE International Conference on Networks (ICON), pages 353–358. IEEE Com-
puter Society Press, November 2007. DOI 10.1109/ICON.2007.4444112.
[35] Udayan Deshpande, Chris McDonald, and David Kotz. Refocusing in 802.11 wire-
less measurement. In Proceedings of the Passive and Active Measurement Con-
ference (PAM 2008), volume 4979 of Lecture Notes in Computer Science, pages
142–151. Springer-Verlag, April 2008. DOI 10.1007/978-3-540-79232-1 15.
[36] Claudia Dıaz, Stefaan Seys, Joris Claessens, and Bart Preneel. Towards measuring
anonymity. In Proceedings of the International Symposium on Privacy Enhancing
Technologies (PET), volume 2482 of Lecture Notes in Computer Science, pages 54–
68. Springer-Verlag, 2002. DOI 10.1007/3-540-36467-6 5.
[37] Dartmouth Internet Security Testbed. Online at http://www.cs.dartmouth.edu/∼dist/,
visited 2010.
[38] DHSIELD. Online at http://www.dshield.org/, visited 2008.
[39] R. Durbin, S. Eddy, A. Krogh, and G. Mitchison. Biological Sequence Analysis:
Probabilistic Models of Proteins and Nucleic Acids. Cambridge University Press,
1998.
133

[40] Patrik Ekdahl and Thomas Johansson. A new version of the stream cipher SNOW.
In Revised Papers from the 9th Annual International Workshop on Selected Areas
in Cryptography (SAC), pages 47–61, London, UK, 2003. Springer-Verlag. DOI
10.1007/3-540-36492-7 5.
[41] The Enron email data set. Online at http://www.cs.cmu.edu/∼enron/, visited 2008.
[42] Jinliang Fan, Jun Xu, Mostafa H. Ammar, and Sue B. Moon. Prefix-preserving
IP address anonymization: measurement-based security evaluation and a new
cryptography-based scheme. Computer Networks, 46(2):253–272, 2004. DOI
10.1016/j.comnet.2004.03.033.
[43] FastLZ, 2010. Online at http://www.fastlz.org.
[44] Phil Fazio, Keren Tan, Jihwang Yeo, and David Kotz. Short paper: The NetSANI
framework for analysis and fine-tuning of network trace sanitization. In Proceedings
of the ACM Conference on Wireless Network Security (WiSec), pages 5–10. ACM
Press, June 2011. DOI 10.1145/1998412.1998416.
[45] Jason Franklin, Damon McCoy, Parisa Tabriz, Vicentiu Neagoe, Jamie Van Rand-
wyk, and Douglas Sicker. Passive data link layer 802.11 wireless device driver
fingerprinting. In Proceedings of the USENIX Security Symposium. USENIX, 2006.
Online at http://www.usenix.org/event/sec06/tech/franklin.html.
134

[46] Shantanu Gattani and Thomas E. Daniels. Reference models for network data
anonymization. In Proceedings of the ACM Workshop on Network Data Anonymiza-
tion (NDA), pages 41–48. ACM Press, 2008. DOI 10.1145/1456441.1456454.
[47] Olivier Gay. HMAC-SHA2. Online at http://www.ouah.org/ogay/hmac/, visited
2011.
[48] Saul Hansell. AOL removes search data on group of web users. Online at http:
//www.nytimes.com/2006/08/08/business/media/08aol.html, visited 8 August 2006.
[49] M. Harvan and J. Schonwalder. Prefix- and lexicographical-order-preserving IP ad-
dress anonymization. In Proceedings of the IEEE/IFIP Network Operations and
Management Symposium (NOMS), pages 519–526, 2006. DOI 10.1109/NOMS.
2006.1687580.
[50] Tristan Henderson, David Kotz, and Ilya Abyzov. The changing usage of a mature
campus-wide wireless network. Computer Networks, 52(14):2690–2712, October
2008. DOI 10.1016/j.comnet.2008.05.003.
[51] Tristan Henderson, David Kotz, Ilya Abyzov, and Jihwang Yeo. CRAW-
DAD trace set dartmouth/campus/snmp (v. 2004-11-09). Downloaded from
http://crawdad.cs.dartmouth.edu/dartmouth/campus/snmp, November 2004.
[52] Baik Hoh, Marco Gruteser, Hui Xiong, and Ansaf Alrabady. Preserving privacy in
GPS traces via uncertainty-aware path cloaking. In Proceedings of the ACM Con-
135

ference on Computer and Communications Security (CCS), pages 161–171. ACM
Press, 2007. DOI 10.1145/1315245.1315266.
[53] W. J. Hsu, D. Dutta, and A. Helmy. Mining behavioral groups in large wireless
LANs. In Proceedings of the 13th annual ACM International Conference on Mobile
Computing and Networking (MobiCom), pages 338–341. ACM, 2007. DOI 10.1145/
1287853.1287899.
[54] Iperf, 2010. Online at http://sourceforge.net/projects/iperf/.
[55] Vijay S. Iyengar. Transforming data to satisfy privacy constraints. In Proceedings
of the ACM SIGKDD International Conference on Knowledge Discovery and Data
Mining (KDD), pages 279–288, 2002. DOI 10.1145/775047.775089.
[56] Jonathan Katz and Yehuda Lindell. Introduction to Modern Cryptography. Chapman
& Hall/CRC, 2007.
[57] Douglas J. Kelly, Richard A. Raines, Michael R. Grimaila, Rusty O. Baldwin, and
Barry E. Mullins. A survey of state-of-the-art in anonymity metrics. In Proceedings
of the ACM Workshop on Network Data Anonymization (NDA), pages 31–40. ACM
Press, 2008. DOI 10.1145/1456441.1456453.
[58] Daniel Kifer and Johannes Gehrke. Injecting utility into anonymized datasets. In
Proceedings of the ACM International Conference on Management of Data (SIG-
MOD), pages 217–228. ACM, 2006. DOI 10.1145/1142473.1142499.
136

[59] M. Kim and D. Kotz. Periodic properties of user mobility and access-point popular-
ity. Journal of Personal and Ubiquitous Computing, 11(6):465–479, August 2007.
Special Issue of papers from LoCA 2005, DOI 10.1007/s00779-006-0093-4.
[60] Kismet, 2010. Online at http://www.kismetwireless.net.
[61] Tadayoshi Kohno, Andre Broido, and KC Claffy. Remote physical device finger-
printing. Proceedings of the IEEE Symposium on Security and Privacy (S&P), pages
211–225, 2005. DOI 10.1109/SP.2005.18.
[62] David Kotz and Kobby Essien. Analysis of a campus-wide wireless network. Wire-
less Networks, 11(1–2):115–133, January 2005. DOI 10.1007/s11276-004-4750-0.
[63] D. Koukis, S. Antonatos, D. Antoniades, E. P. Markatos, and P. Trimintzios. A
generic anonymization framework for network traffic. In Proceedings of the IEEE
International Conference on Communications (ICC), volume 5, Istanbul, Turkey,
June 2006. IEEE Press. DOI 10.1109/ICC.2006.255113.
[64] D. Koukis, Spyros Antonatos, and Kostas G. Anagnostakis. On the privacy risks
of publishing anonymized IP network traces. In Proceedings of the International
Conference on Communications and Multimedia Security (CMS), volume 4237 of
Lecture Notes in Computer Science, pages 22–32. Springer-Verlag, 2006. DOI 10.
1007/11909033 3.
137

[65] A. Kounine and M. Bezzi. Accessing disclosure risk in anonymized datasets. In Flo-
Con 2008, January 2008. Online at http://www.cert.org/flocon/2008/presentations/
Bezzi Kounine Flocon.pdf.
[66] J. Krumm. A survey of computational location privacy. Personal and Ubiquitous
Computing, 13(6):391–399, 2009. DOI 10.1007/s00779-008-0212-5.
[67] T. Kudoh and Y. Matsumoto. Use of support vector learning for chunk identification.
In Proceedings of CoNLL-2000 and LLL-2000, pages 142–144, 2000. DOI 10.3115/
1117601.1117635.
[68] U. Kumar and A. Helmy. Human behavior and challenges of anonymizing
WLAN traces. In Proceedings of the IEEE Global Telecommunications Conference
(GLOBECOM), 2009. DOI 10.1109/GLOCOM.2009.5426081.
[69] U. Kumar, N. Yadav, and A. Helmy. Gender-based feature analysis in campus-wide
WLANs. SIGMOBILE Mobile Computing and Communications Review, 12(1):40–
42, 2008. DOI 10.1145/1374512.1374525.
[70] J. Lafferty, A. McCallum, and F. Pereira. Conditional random fields: probabilistic
models for segmenting and labeling sequence data. In Proceedings of the Interna-
tional Conference on Machine Learning (ICML), 2001.
[71] Kristen Lefevre, David Dewitt, and Raghu Ramakrishnan. Workload-aware
anonymization. In Proceedings of the ACM SIGKDD International Conference
138

on Knowledge Discovery and Data Mining (KDD), 2006. DOI 10.1145/1150402.
1150435.
[72] Ninghui Li, Tiancheng Li, and Suresh Venkatasubramanian. t-closeness: Privacy
beyond k-anonymity and `-diversity. In Proceedings of the International Confer-
ence on Data Engineering (ICDE), pages 106–115, 2007. DOI 10.1109/ICDE.2007.
367856.
[73] Y. Li, Adam Slagell, K. Luo, and W. Yurcik. CANINE: A combined conversion
and anonymization tool for processing netflows for security. In Proceedings of the
International Conference on Telecommunication Systems, Modeling and Analysis,
November 2005. Online at http://laim.ncsa.uiuc.edu/downloads/li05.pdf.
[74] libpcap with MMAP, 2010. Online at http://public.lanl.gov/cpw/.
[75] K. Luo, Y. Li, Adam Slagell, and W. Yurcik. CANINE: A netflow con-
verter/anonymizer tool for format interoperability and secure sharing. In Proceed-
ings of FLOCON Network Flow Analysis Workshop, September 2005. Online at
http://laim.ncsa.uiuc.edu/downloads/luo05.pdf.
[76] Ashwin Machanavajjhala, Johannes Gehrke, Daniel Kifer, and Muthuramakrishnan
Venkitasubramaniam. `-diversity: Privacy beyond k-anonymity. In Proceedings of
the International Conference on Data Engineering (ICDE), pages 24–85, 2006. DOI
10.1109/ICDE.2006.1.
[77] MadWifi Project, 2010. Online at http://madwifi-project.org.
139
[78] Ratul Mahajan, Maya Rodrig, David Wetherall, and John Zahorjan. Analyzing the
MAC-level behavior of wireless networks in the wild. SIGCOMM Computer Com-
munication Review, 36(4):75–86, 2006. DOI 10.1145/1151659.1159923.
[79] A. McCallum, D. Freitag, and F. Pereira. Maximum entropy Markov models for
information extraction and segmentation. In Proceedings of the International Con-
ference on Machine Learning (ICML), 2000.
[80] K. Mehta, D. Liu, and M. Wright. Location privacy in sensor networks against
a global eavesdropper. In Proceedings of the IEEE International Conference on
Network Protocols (ICNP), 2007. DOI 10.1109/ICNP.2007.4375862.
[81] Greg Minshall. TCPdPriv: Program for eliminating confidential information from
traces, 2005. Online at http://ita.ee.lbl.gov/html/contrib/tcpdpriv.html.
[82] Noman Mohammed, Benjamin C.M. Fung, and Mourad Debbabi. Walking in the
crowd: anonymizing trajectory data for pattern analysis. In Proceeding of the ACM
Conference on Information and Knowledge Management (CIKM), pages 1441–
1444. ACM, 2009. DOI 10.1145/1645953.1646140.
[83] Noman Mohammed, Benjamin C.M. Fung, and Mourad Debbabi. Preserving pri-
vacy and utility in RFID data publishing. Technical Report 6850, Concordia Univer-
sity, Montreal, QC, Canada, October 2010.
[84] Noman Mohammed, Benjamin C.M. Fung, Patrick C.K. Hung, and Cheuk-kwong
Lee. Anonymizing healthcare data: a case study on the blood transfusion service.
140
In Proceedings of the ACM International Conference on Knowledge Discovery and
Data Mining (SIGKDD), pages 1285–1294. ACM, 2009. DOI 10.1145/1557019.
1557157.
[85] Arvind Narayanan and Vitaly Shmatikov. Robust de-anonymization of large sparse
datasets. In Proceedings of the IEEE Symposium on Security and Privacy (S&P),
pages 111–125. IEEE Press, 2008. DOI 10.1109/SP.2008.33.
[86] N. Okazaki. CRFsuite: a fast implementation of Conditional Random Fields (CRFs).
http://www.chokkan.org/software/crfsuite/, 2007.
[87] OpenWrt, 2010. Online at http://openwrt.org.
[88] Y. Ouyang, Z. Le, D. Liu, J. Ford, and F. Makedon. Source location privacy against
laptop-class attacks in sensor networks. In Proceedings of the 4th International
Conference on Security and Privacy in Communication Netowrks (SecureComm),
pages 1–10. ACM, 2008. DOI 10.1145/1460877.1460884.
[89] Lasse Overlier, Tonnes Brekne, and Andre Arnes. Non-expanding transaction spe-
cific pseudonymization for IP traffic monitoring. In Yvo Desmedt, Huaxiong Wang,
Yi Mu, and Yongqing Li, editors, Proceedings of Cryptology and Network Secu-
rity (CANS), volume 3810 of Lecture Notes in Computer Science, pages 261–273.
Springer-Verlag, 2005. DOI 10.1007/11599371 22.
[90] C. Ozturk, Y. Zhang, and W. Trappe. Source-location privacy in energy-constrained
sensor network routing. In Proceedings of the 2nd ACM workshop on Security of
141

Ad Hoc and Sensor Networks (SASN), pages 88–93. ACM, 2004. DOI 10.1145/
1029102.1029117.
[91] Linux packet mmap. Online at http://wiki.ipxwarzone.com/index.php5?title=Linux
packet mmap, visited 2011.
[92] Jeffrey Pang, Ben Greenstein, Ramakrishna Gummadi, Srinivasan Seshan, and
David Wetherall. 802.11 user fingerprinting. In Proceedings of the ACM Inter-
national Conference on Mobile Computing and Networking (MobiCom), pages 99–
110. ACM Press, 2007. DOI 10.1145/1287853.1287866.
[93] Ruoming Pang, Mark Allman, Vern Paxson, and Jason Lee. The devil and
packet trace anonymization. ACM SIGCOMM Computer Communication Review,
36(1):29–38, 2006. DOI 10.1145/1111322.1111330.
[94] Andreas Pfitzmann and Marit Hansen. Anonymity, unobservability, and
pseudonymity: A consolidated proposal for terminology, February 2008. Version
0.31, Online at http://dud.inf.tu-dresden.de/Anon Terminology.shtml.
[95] Phillip Porras and Vitaly Shmatikov. Large-scale collection and sanitization of
network security data: risks and challenges. In Proceedings of the Workshop
on New Security Paradigms (NSPW), pages 57–64. ACM Press, 2007. DOI
10.1145/1278940.1278949.
[96] Protected Repository for the Defense of Infrastructure against Cyber Threats (PRE-
DICT). Online at http://www.predict.org, visited 2010.
142

[97] QuickLZ, 2010. Online at http://www.quicklz.com.
[98] L. Rabiner and B. H. Juang. Fundamentals of speech recognition. In Prentice Hall
Signal Processing Series. Prentice-Hall, Inc., 1993.
[99] L. R. Rabiner. A tutorial on hidden Markov models and selected applications in
speech recognition. Proceedings of the IEEE, 77(2):257–285, February 1989.
[100] Ramaswamy Ramaswamy and Tilman Wolf. High-speed prefix-preserving IP ad-
dress anonymization for passive measurement systems. ACM/IEEE Transactions on
Networking (TON), 15(1):26–39, January 2007. DOI 10.1109/TNET.2006.890128.
[101] Maxim Raya, Jean-Pierre Hubaux, and Imad Aad. DOMINO: Detecting MAC layer
greedy behavior in IEEE 802.11 hotspots. IEEE Transactions on Mobile Computing,
5(12):1691–1705, December 2006. DOI 10.1109/TMC.2006.183.
[102] Matthew Robshaw. The eSTREAM project. In New Stream Cipher Designs: The
eSTREAM Finalists, pages 1–6. Springer-Verlag, Berlin, Heidelberg, 2008. DOI
10.1007/978-3-540-68351-3 1.
[103] Martin Roesch. Snort: A free, open source network intrusion detection and preven-
tion system, 1998. Online at http://www.snort.org/.
[104] P. Samarati and L. Sweeney. Protecting privacy when disclosing information: k-
anonymity and its enforcement through generalization and suppression. Technical
Report SRI-CSL-98-04, Computer Science Laboratory, SRI International, 1998. On-
line at http://www.csl.sri.com/papers/sritr-98-04/.
143

[105] S. Sarat and A. Terzis. On the detection and origin identification of mobile worms.
In Proceedings of the 2007 ACM Workshop on Recurring Malcode (WORM), 2007.
DOI 10.1145/1314389.1314401.
[106] Andrei Serjantov and George Danezis. Towards an information theoretic metric for
anonymity. In Proceedings of the International Symposium on Privacy Enhancing
Technologies (PET), volume 2482 of Lecture Notes in Computer Science, pages 41–
53. Springer-Verlag, 2002. DOI 10.1007/3-540-36467-6 4.
[107] Yong Sheng, Guanling Chen, Hongda Yin, Keren Tan, Udayan Deshpande, Bennet
Vance, David Kotz, Andrew Campbell, Chris McDonald, Tristan Henderson, and
Joshua Wright. MAP: A scalable monitoring system for dependable 802.11 wireless
networks. IEEE Wireless Communications, 15(5):10–18, October 2008. DOI 10.
1109/MWC.2008.4653127.
[108] Yong Sheng, Keren Tan, Guanling Chen, David Kotz, and Andrew Campbell. De-
tecting 802.11 MAC layer spoofing using received signal strength. In Proceedings of
the 27th Annual Joint Conference of the IEEE Computer and Communications So-
cieties (INFOCOM), pages 1768–1776. IEEE Computer Society Press, April 2008.
DOI 10.1109/INFOCOM.2007.239.
[109] Douglas C. Sicker, Paul Ohm, and Dirk Grunwald. Legal issues surrounding mon-
itoring during network research. In Proceedings of the Internet Measurement Con-
ference (IMC), pages 141–148. ACM Press, 2007. DOI 10.1145/1298306.1298307.
144

[110] Adam Slagell, Kiran Lakkaraju, and Katherine Luo. FLAIM: A multi-level
anonymization framework for computer and network logs. In Proceedings of the
USENIX Large Installation System Administration Conference (LISA), December
2006. Online at http://www.usenix.org/events/lisa06/tech/slagell.html.
[111] L. Song, D. Kotz, R. Jain, and X. He. Evaluating next cell predictors with extensive
Wi-Fi mobility data. IEEE Transactions on Mobile Computing, 5(12):1633–1649,
December 2006. DOI 10.1109/TMC.2006.185.
[112] Libo Song. Evaluating Mobility Predictors in Wireless Networks for Improving
Handoff and Opportunistic Routing. PhD thesis, Dartmouth College Computer Sci-
ence, Hanover, NH, January 2008. Available as Dartmouth Computer Science Tech-
nical Report TR2008-611.
[113] B. Sun, F. Yu, K. Wu, Y. Xiao, and V. C. M. Leung. Enhancing security using
mobility-based anomaly detection in cellular mobile networks. IEEE Transactions
on Vehicular Technology, 55(3):1385–1396, 2006. DOI 10.1109/TVT.2006.874579.
[114] C. Sutton and A. McCallum. Introduction to Conditional Random Fields for Rela-
tional Learning. MIT Press, 2006.
[115] Keren Tan and David Kotz. Saluki: a high-performance Wi-Fi sniffing program.
In Proceedings of the International Workshop on Wireless Network Measurements
(WiNMee), pages 591–596. IEEE Computer Society Press, May 2010.
145

[116] Keren Tan, Guanhua Yan, Jihwang Yeo, and David Kotz. A correlation attack against
user mobility privacy in a large-scale WLAN network. In Proceedings of the ACM
MobiCom’10 S3 workshop, pages 33–35, September 2010. DOI 10.1145/1860039.
1860050.
[117] Keren Tan, Guanhua Yan, Jihwang Yeo, and David Kotz. Privacy analysis of user
association logs in a large-scale wireless LAN. In Proceedings of the 30th Annual
Joint Conference of the IEEE Computer and Communications Societies (INFOCOM)
mini-conference, pages 31–35. IEEE Computer Society Press, April 2011. DOI
10.1109/INFCOM.2011.5935168.
[118] Keren Tan, Jihwang Yeo, Michael E. Locasto, and David Kotz. Catch, clean, and
release: A survey of obstacles and opportunities for network trace sanitization. In
Francesco Bonchi and Elena Ferrari, editors, Privacy-Aware Knowledge Discovery:
Novel Applications and New Techniques, chapter 5, pages 111–141. Chapman and
Hall/CRC Press, January 2011.
[119] tcpdump/libpcap public repository, 2010. Online at http://www.tcpdump.org.
[120] H. M. Wallach. Conditional random fields: An introduction. Technical Report MS-
CIS-04-21, University of Pennsylvania CIS, 2004.
[121] Ke Wang, Benjamin C. M. Fung, and Philip S. Yu. Template-based privacy
preservation in classification problems. In Proceedings of the 5th IEEE Interna-
tional Conference on Data Mining (ICDM’05), pages 466–473. IEEE, 2005. DOI
10.1109/ICDM.2005.142.
146

[122] T. A. Welch. A technique for high-performance data compression. Computer,
17(6):8–19, 1984. DOI 10.1109/MC.1984.1659158.
[123] DefCon Wi-Fi shootout champions crowned: 125 miles. Online at http://boingboing.
net/2005/07/31/defcon-wifi-shootout.html, visited 2005.
[124] Wireshark, 2010. Online at http://www.wireshark.org.
[125] Jun Xu, Jinliang Fan, M. H. Ammar, and S. B. Moon. Prefix-preserving IP address
anonymization: measurement-based security evaluation and a new cryptography-
based scheme. In Proceedings of the IEEE International Conference on Network
Protocols (ICNP), pages 280–289, November 2002. DOI 10.1109/ICNP.2002.
1181415.
[126] G. Yan, S. Eidenbenz, and B. Sun. Mobi-watchdog: you can steal, but you can’t
run! In Proceedings of the Second ACM Conference on Wireless Network Security
(WiSec), pages 139–150. ACM, 2009. DOI 10.1145/1514274.1514295.
[127] Jihwang Yeo, Keren Tan, and David Kotz. User survey regarding the needs of net-
work researchers in trace-anonymization tools. Technical Report TR2009-658, Dept.
of Computer Science, Dartmouth College, Hanover, NH, November 2009. Online at
http://www.cs.dartmouth.edu/reports/TR2009-658.pdf.
[128] Jihwang Yeo, Moustafa Youssef, and Ashok Agrawala. A framework for wireless
LAN monitoring and its applications. In Proceedings of the 3rd ACM Workshop
147

on Wireless Security (WiSec), pages 70–79. ACM, 2004. DOI 10.1145/1023646.
1023660.
[129] Tatu Ylonen. Thoughts on how to mount an attack on tcpdpriv’s “-a50” option.
Online at http://ita.ee.lbl.gov/html/contrib/attack50/attack50.html, visited 2009.
[130] J. Yoon, B. D. Noble, M. Liu, and M. Kim. Building realistic mobility models
from coarse-grained traces. In Proceedings of the 4th International Conference on
Mobile Systems, Applications and Services (MobiSys), pages 177–190. ACM, 2006.
DOI 10.1145/1134680.1134699.
[131] William Yurcik, Clay Woolam, Greg Hellings, Latifur Khan, and Bhavani Thurais-
ingham. SCRUB-tcpdump: A multi-level packet anonymizer demonstrating pri-
vacy/analysis tradeoffs. In Proceedings of the IEEE International Workshop on
the Value of Security through Collaboration (SECOVAL), pages 49–56. IEEE Press,
September 2007. DOI 10.1109/SECCOM.2007.4550306.
[132] William Yurcik, Clay Woolam, Greg Hellings, Latifur Khan, and Bhavani M. Thu-
raisingham. Toward trusted sharing of network packet traces using anonymization:
Single-field privacy/analysis tradeoffs. Technical Report 0710.3979v2, arXiv, 2007.
Online at http://arxiv.org/abs/0710.3979.
[133] Jianqing Zhang, Nikita Borisov, and William Yurcik. Outsourcing security analysis
with anonymized logs. In Proceedings of the International Workshop on the Value
of Security through Collaboration (SECOVAL). IEEE Press, 2006. DOI 10.1109/
SECCOMW.2006.359577.
148

[134] Qianli Zhang and Xing Li. An IP address anonymization scheme with multiple
access levels. In Ilyoung Chong and Kenji Kawahara, editors, Proceedings of In-
formation Networking: Advances in Data Communications and Wireless Networks
(ICOIN), volume 3961 of Lecture Notes in Computer Science, pages 793–802.
Springer-Verlag, 2006. DOI 10.1007/11919568 79.
149