larry cook consulting pty ltd
TRANSCRIPT

Larry Cook Consulting Pty Ltd (ABN 27 159 132 055)
PO Box 8146 TUMBI UMBI NSW 2261
Office: 02 4340 0193 Mobile: 0428 884645 Email: [email protected]
CONCEPT WASTEWATER MANAGEMENT PLAN
PROPOSED GREYHOUND TREATMENT/RECOVERY/RETRAINING
FACILITY – ‘BYLONG PARK’
Lot 2 in DP1088704 Martindale Road Martindale
for
Greyhound Racing NSW
Distribution
Greyhound Racing NSW Ref. 21073-B
Warren Smith & Partners 23rd September 2021

Wastewater Management Plan Page ii Lot 2 in DP1088704 Martindale Road Martindale
Larry Cook Consulting 23.9.21 21073-B
CONTENTS
Page
1. INTRODUCTION AND PROJECT DESCRIPTION ...................................................... 1
2. INVESTIGATOR .......................................................................................................... 1
3. EXISTING DEVELOPMENT ........................................................................................ 2
4. PROPOSED DEVELOPMENT .................................................................................... 3
5. SITE INFORMATION ................................................................................................... 4
6. SITE ASSESSMENT ................................................................................................... 4
7. ON-SITE WASTEWATER DISPOSAL MANAGEMENT PLAN .................................... 5
7.1 INTRODUCTION ............................................................................................ 5
7.2 CLIMATE ........................................................................................................ 6
7.3 SOIL ASSESSMENT ...................................................................................... 7
7.4 DESIGN HYDRAULIC LOAD ........................................................................ 15
7.5 SYSTEM SELECTION .................................................................................. 16
7.6 ASSESSMENT OF EXISTING ON-SITE SEWAGE MANAGEMENT
SYSTEMS.................................................................................................................. 17
8. WASTE TREATMENT OPTIONS .............................................................................. 19
8.1 INTRODUCTION .......................................................................................... 19
8.2 DOG KENNELS (PODS) .............................................................................. 19
8.2.1 Solid Waste .............................................................................................. 19
8.2.2 Washdown Water ..................................................................................... 20
8.2.3 Commercial Laundry Water and Dog Food Preparation Area .................. 20
8.3 HUMAN WASTE ........................................................................................... 20
9. CLIENT PREFERRED WASTEWATER TREATMENT SYSTEM .............................. 20
9.1 DESCRIPTION ............................................................................................. 20
9.2 DESIGN HYDRAULIC LOAD ........................................................................ 21
9.3 WASTEWATER FROM COTTAGES AND CENTER .................................... 21
9.4 WASTEWATER DISPOSAL – SURFACE SPRAY IRRIGATION ................. 22
9.4.1 Introduction ............................................................................................... 22
9.4.2 Calculations .............................................................................................. 22
9.5 NUTRIENT CALCULATIONS ....................................................................... 24
9.6 SURFACE SPRAY IRRIGATION .................................................................. 27
10. RESERVE APPLICATION AREA .............................................................................. 28
11. BUFFER DISTANCES ............................................................................................... 28
12. CONCLUSIONS AND RECOMMENDATIONS .......................................................... 29
12.1 GENERAL ..................................................................................................... 29

Wastewater Management Plan Page iii Lot 2 in DP1088704 Martindale Road Martindale
Larry Cook Consulting 23.9.21 21073-B
12.2 SURFACE SPRAY IRRIGATION .................................................................. 29
13. REFERENCES .......................................................................................................... 30
TABLES
Table 1 Key Elements of Development Table 2 Summary Climate Statistics – Paterson Table 3 Summary Soil Profile – BH 2 Table 4 Summary Soil Profile – BH 4 Table 5 Descriptions of the Various Soil Tests Table 6 Summary Results – Field Soil Testing Table 7 Design Hydraulic Load Estimates Table 8 Summary Design Hydraulic Load Table 9 Assessment of Limitations Table 10 Summary Disposal Area Calculations Table 11 Summary Results of Nutrient Calculations Table 12 Guideline Buffer Distances
FIGURES
Figure 1 Lot Plan Figure 2 Topographic Plan Figure 3 Enlarged Topographic Plan Figure 4 Site Plan Figure 5 Aerial Photo Showing Existing Conditions Figure 6 Key Elements of development Figure 7 Farmstead Plan Figure 8 Enlarged Farmstead Plan Figure 9 Geology Plan Figure 10 Locations Soil Test Holes Figure 11 Typical Anaerobic Baffled Reactor Figure 12 Locations Available Disposal Areas Figure 13 Location Proposed Land Application Area Figure 14 Aerial Photo - Proposed Land Application Area
APPENDICES
Appendix A Design Parameters and Calculations – Surface and Sub-surface Application
Appendix B Soil Bore Logs Appendix C Specifications - ultraWELL 1000 pump well

Wastewater Management Plan Page iv
Lot 2 in DP1088704 Martindale Road Martindale
Larry Cook Consulting 23.9.21 21073-B
PLATES
Plate 1 Main Cottage Plate 2 Secondary Cottage Plate 3 View from Cottages Looking East Plate 4 Soil Profile BH1 Plate 5 Soil Profile BH2 Plate 6 Soil Profile BH3 Plate 7 Soil Profile BH4 Plate 8 Soil Profile BH5 Plate 9 Soil Profile BH6 Plate 10 Septic Tank – Main Cottage Plate 11 Septic Tank – Secondary Cottage Plate 12 ‘Old’ Septic Tank – Secondary Cottage

Wastewater Management Plan Page 1
Lot 2 in DP1088704 Martindale Road Martindale
Larry Cook Consulting 23.9.21 21073-B
1. INTRODUCTION AND PROJECT DESCRIPTION
As requested by Consulting Engineers Warren Smith & Partners on behalf of Greyhound Racing NSW (the owner), Larry Cook Consulting has conducted a concept wastewater treatment and disposal investigation on ‘Bylong Park’ identified as Lot 2 in DP1088704 Martindale Road Martindale, upper Hunter Valley New South Wales (herein referred to as the Site). The location of the Site is shown on a Google Earth lot plan presented in Figure 1 and on a topographic plan shown in Figure 2. An enlarged topographic plan is shown in Figure 3 and a plan of the Site prepared by Tzannes is presented in Figure 4.
A summary of the key elements of the project is as follows:
• The owner proposes to construct a facility to house, treat, recover, and retrain greyhounds for eventual adoption. It is understood that the proposal is for the housing of up to 400 dogs in specially designed kennels and runs.
• Initially, it is proposed that the development will incorporate 20 separate dog kennels in modules each housing 20 dogs. Each module will be approximately 620 m2 in area.
• Each Kennel Building/Module will have one staff member during the day with a total of approximately 24 personnel working in the facility daily.
• Support infrastructure will include an office (administration), a veterinary facility, car park, rehabilitation pool, kitchen and toilet/ basin/shower amenities, multipurpose function space, laundry for dog sheets and a manager/caretaker’s accommodation.
• Two existing cottages on the Site will be utilised for manager and managerial staff accommodation.
The municipal sewerage scheme is not available to the Site and, as such, the local consent authority (Muswellbrook Shire Council) requires the preparation of a Wastewater Management Plan (WMP) assessing the suitability and capability of the Site to accept treated wastewater from the proposed development. The WMP incorporates a design for an On-Site Sewage Management system (OSSM) for the purpose.
The OSSM system is designed to:
1. Dispose of treated effluent on-site using an approved and effective methodology in accordance with the Environmental Health Protection Guidelines (DLG 1998), AS/NZS 1547:2012 (SAI & NZS 2012) and the requirements of the Muswellbrook Shire Council’s DCP Section 23 (Onsite Sewage Management Systems).
2. Meet the environmental and health Performance Objectives documented in the Environmental Health Protection Guidelines (DLG 1998) which ensure that on-site sewage management for single households is appropriate and will not affect public health or the environment.
These objectives are detailed in Section 7.1.
2. INVESTIGATOR
Larry Cook, an environmental scientist and geoscientist undertook the effluent disposal management investigation. Larry Cook is qualified to carry out such investigations.

Wastewater Management Plan Page 2
Lot 2 in DP1088704 Martindale Road Martindale
Larry Cook Consulting 23.9.21 21073-B
3. EXISTING DEVELOPMENT
The Site is a mostly historically cleared and developed parcel of rural land divided into four sections separated by relatively narrow easements. An aerial photo (Near Maps image) over the Site showing existing conditions is presented in Figure 5. A small cluster of two cottages with proximal machinery sheds and ancillary rural structures are located in the central western part of the Site close to the western Martindale Creek boundary. The cottages are shown in Plates 1 and 2.
Plate 1 – Main Cottage
Plate 2 – Secondary Cottage

Wastewater Management Plan Page 3
Lot 2 in DP1088704 Martindale Road Martindale
Larry Cook Consulting 23.9.21 21073-B
Two relatively small farm dams are located in the central northern part and in the central southern part (Figure 5). A network of farm tracks provide access to a series
of paddocks in the Site.
It is understood that wastewater generated from the existing cottages is directed to septic tanks, treated to primary standard and discharged under gravity into absorption
trenches of unknown locations and dimensions.
4. PROPOSED DEVELOPMENT
The owner proposes to redevelop the existing infrastructure centred on the precinct incorporating the cottages and rural buildings and construct a network of dog kennels and runs immediately east of the farmstead area.
The key elements of the proposed development are listed in Table 1 and shown in Figures 6, 7 and 8.
Table 1 Key Elements of Development
Component Elements
Farmstead Precinct • Two cottages (manager’s residence and managerial staff)
• Administration center and reception
• Vet facility
• Kitchen
• Toilet/shower amenities,
• Multipurpose function space,
• Commercial laundry
Dog Kennels (Pods) • Indoor Kennels
• Outdoor Kennels
• Night runs
• Day runs
• Shared social runs
• Circulation zones
• Washdown areas
• Flexible space
• Preparation benches and storage facilities
It is understood that the owners hold an active surface water license to extract water
for the operations from the Martindale Creek system.

Wastewater Management Plan Page 4
Lot 2 in DP1088704 Martindale Road Martindale
Larry Cook Consulting 23.9.21 21073-B
5. SITE INFORMATION
The site is a multi-sided but very broadly rectangular parcel of rural land approximately 1.4 km2 in area located by right-of-way 800 m east of Martindale Road approximately 15 km south of the intersection with Bureen Road. The Site is in the Parish of Wybong, County of Brisbane and in the Muswellbrook Shire Council local government area.
The Site is surrounded by mostly developed rural properties. There is mains power connected to the land but no town water or municipal sewerage system. Tank water is used.
6. SITE ASSESSMENT
The Site is located in the base of the upper part of the Martindale Creek valley system approximately 17 km south of its confluence between Martindale Creek and the Hunter River (Figure 2). Several defined generally westerly-flowing tributaries of Martindale Creek dissect the Site (Figure 3). The Site is, in the main, gently undulating with the ground sloping down from the western boundary at the base of the Martindale Range down to the western Martindale Creek boundary. The exception is the northernmost rectangular portion which is relatively steep sloping down from the northern part to the south. Elevations in the main part of the Site range from approximately 193 m Australian Height Datum (AHD) in the central eastern part down to the sinuous Martindale Creek western boundary at between approximately 138 and 140 m AHD. The ground slope immediately east of the homestead area where disposal of treated wastewater may be suitable is approximately 1 in 30 (3 %)
The reader is referred to the results of geological mapping in the region carried out in the 1980s and early 1990s by the NSW state government (Glen R.A. and Beckett J., 1993). A geology plan is presented in Figure 9. The Site is underlain by a thick sequence of Permian sedimentary rocks which belong to the Wollombi Coal Measures. The sequence consists of stacked and interbedded coal seams, claystone, siltstone, sandstone and conglomerate.
Triassic age Narrabeen Group sedimentary rocks overlie the Permian sedimentary sequence and are observed to form the uplands and valley sides (and escarpments) in the district. The Triassic sequence comprises interbedded sandstone, siltstone and claystone. Quaternary alluvial deposits are associated with the former and present
Martindale Creek system.
The majority of the Site has been historically cleared with scattered tress across parts. However, the northern steeper part of the Site remains covered with tall open eucalypt
forest. Tree communities are also observed along the full trace of Martindale Creek.
Wastewater Management Plan Page 5
Lot 2 in DP1088704 Martindale Road Martindale
Larry Cook Consulting 23.9.21 21073-B
7. ON-SITE WASTEWATER DISPOSAL MANAGEMENT PLAN
7.1 INTRODUCTION
As referenced in Section 1, the objectives of a Wastewater Disposal Management
Plan are to:
1. Dispose of treated effluent on-site using an approved and effective methodology in accordance with the Environmental Health Protection Guidelines (DLG 1998), AS/NZS 1547:2012 (SAI & NZS 2012) and the requirements of the Muswellbrook
Shire Council’s DCP Section 23 (Onsite Sewage Management Systems).
2. Meet the environmental and health Performance Objectives documented in the Environmental Health Protection Guidelines (DLG 1998) which ensure that on-site sewage management for single households is appropriate and will not affect public
health or the environment. These objectives are summarised as follows:
➢ Prevention of public health risk. Contact with effluent should be minimised or eliminated, particularly for children. Residuals, such as composted material, should be handled carefully. Treated sewage should not be used on edible crops that are consumed raw
➢ Protection of lands - on-site sewage management systems should not cause deterioration of land and vegetation quality through soil structure degradation,
salinisation, waterlogging, chemical contamination or soil erosion
➢ Protection of surface waters - on-site sewage management systems should be selected, sited, designed, constructed, operated and maintained so that surface waters are not contaminated by any flow from treatment systems and land application areas (including effluent, rainfall run-off and contaminated groundwater flow)
The following works were undertaken:
• Review recent state government colour aerial photographs and remotely sensed data acquired over the district,
• Describe the physical setting (geomorphology),
• Establish, assess and describe local and district hydrogeological conditions,
• Calculate the total design hydraulic load for the proposed development,
• Acquire and utilise relevant Bureau of Meteorology (BOM) climate data and calculate a water balance,
• Assess and rank any potential impacts from the on-site disposal of treated wastewater on the groundwater system and environment.
The following works are planned when access to the Site under the NSW Covid 19
Health orders can be obtained.
• Undertake a site inspection and site walkover of the site,
• Establish subsurface conditions including soil investigations and assessments (soil types, soil depth and soil permeability) and estimate depth to bedrock (if possible) and depth to groundwater,
• Submit soil samples for selected laboratory testing,

Wastewater Management Plan Page 6
Lot 2 in DP1088704 Martindale Road Martindale
Larry Cook Consulting 23.9.21 21073-B
• Establish soil parameters including pH, Electrical Conductivity (EC), Phosphorus Sorption (PSorp), Cation Exchange Capacity (CEC), Exchangeable Sodium Capacity (ESP) and Modified Emerson Class,
• Provide recommendations for the method, location and size of any disposal area/s.
7.2 CLIMATE
Sun and wind exposure over the Site is excellent. No temperature, evaporation and rainfall data are available for the Site. Based on temperature data from the official BOM station at Peats Ridge (Station No. 061351), mean daily maximum temperatures for the land are expected to be always greater than 15oC (Table 2). Paterson station was used because it is by far the closest official weather station with official pan evaporation data. Rainfall statistics for Paterson are also provided in Table 2.
The water balance calculations utilised in the hydraulic balance (Appendix A) are based on the temperature, rainfall and mean monthly pan evaporation data acquired from Paterson and is believed to be the best meteorological values available for the
subject land.
Table 2 Summary Climate Statistics – Paterson (Tocal AWS) (Station 061250)
Jan Feb Mar Apr May Jun Jul Aug Sep Oct Nov Dec Annual Years
Temperature
Mean maximum
temperature (°C)
29.7 28.7 26.9 24.2 20.7 17.8 17.3 19.3 22.3 25.0 26.7 29.1 24.0 37 1967 2011
Mean minimum
temperature (°C)
17.6 17.6 15.6 12.4 9.7 7.5 6.1 6.5 8.9 11.4 13.9 16.2 12.0 37 1967 2011
Rainfall
Mean rainfall (mm)
105.9 119.4 116.7 78.5 74.5 73.5 39.9 36.7 49.2 67.3 79.6 79 921.7 43 1967 2011
Decile 5 (median) rainfall (mm)
79.4 81.1 97 63.2 62.3 52.4 32 28.4 32.7 48.8 70.9 68.4 947 43 1967 2011
Mean number of
days of rain ≥ 1 mm
11.7 11.3 12 9.9 11 10.6 9.2 7.8 8.1 9.8 11.4 10.1 122.9 43 1967 2011
Evaporation
Mean Evaporation
(mm) 192.2 148.4 130.2 99 74.4 63 74.4 105.4 132 161.2 177 210.8 1568 37
1967 2011

Wastewater Management Plan Page 7
Lot 2 in DP1088704 Martindale Road Martindale
Larry Cook Consulting 23.9.21 21073-B
7.3 SOIL ASSESSMENT
A preliminary desktop study revealed that the soils are developed atop Permian sedimentary rocks belonging to the Wollombi Coal Measures. However, as documented in Section 6, Quaternary alluvial deposits may be associated with the former and present Martindale Creek system.
The reader is referred to the 1:100,000 Hunter Coalfield Regional Geology (Glen R.A. and Beckett J., 1993). The soils beneath the Site are developed atop Triassic
age sedimentary rocks in this area belonging to the Narrabeen Group.
The whole Site is underlain by variably thick colluvial soils derived from the Permian age Wollombi Coal Measures and the overlying Triassic age Narrabeen Group sedimentary rocks which form the uplands and valley sides (and escarpments) in the district. A network of investigation hand auger holes were drilled on 30th August 2021 in the central northern and south-eastern part of the Site either side of the proposed location of the pods where possible irrigation of treated wastewater may be possible. Testing was undertaken in order to describe and classify the soil and determine the depth of the soil profile developed atop the sedimentary rock sequence The locations of six representative investigation soil test holes are shown in Figure 10. The soil investigations revealed a moderately well-developed soil profile of greater than approximately 0.90 m thickness. Soil test logs are provided in Appendix B.
In summary, the soil profile encountered consists of approximately 0.20 m of generally brown to yellow-brown, organic bearing, dry and loose, silty sandy loam topsoil and colluvium overlying, on average 0.50 to 0.80 m of brown to pale brown to mottled yellow orange gravelly/gritty sandy loam containing common sub-rounded quartz pebbles and sub-angular fragments of strongly weathered sandstone. This gravelly layer commonly overlies clayey loam that is likely associated with the underlying flat-lying fine grained sedimentary rocks associated with the Wollombi Coal measures.
The distinctly gravelly and gritty sandy loam containing the rounded pebbles is directly related to the weathering of the Triassic ‘cliff forming’ pebbly sandstone and conglomerate that forms the upland areas and escarpment on the flanks of the valley structure. Downslope migration of the eroding sandstone forms the distinct debri slopes in these valleys (Plate 3).

Wastewater Management Plan Page 8
Lot 2 in DP1088704 Martindale Road Martindale
Larry Cook Consulting 23.9.21 21073-B
Plate 3 – View from Cottages Looking East
Shallow Groundwater (perched water) is associated with the base of the gritty sandy loam layer which in turn overlies strongly weathered fine grained sedimentary rocks
where a marked permeability contrast exists.
The soils were classified according to the textural classification in AS/NZS 1547:2012. A summary soil classification for the areas either side of the pod layout based on the
results of the soil investigations is presented in Tables 3 and 4.
Table 3 Summary Soil Profile – BH 2
TOPSOIL/ COLLUVIAL
0.00 - 0.20 Silty Sandy LOAM. Brown to yellow brown. Gravelly. Abundant amounts of organic material. Loose and moist. Average thickness: 0.20 m Average interval: 0.00 - 0.20 m
COLLUVIAL
0.20 - 1.10 Sandy LOAM. Pale brown to pale yellow-brown. Gravelly/gritty. Minor to locally common amounts of organic material. Loose to semi dense and moist. From 0.70 m, grades down into gravelly moist mottled red-orange sandy loam. Common amounts of strongly weathered sandstone to 15mm. Includes rounded quartz pebbles to 15 mm. Sub rounded quartz pebbles and rock fragments to 15 mm. Average thickness: > 0.90 m Average interval: 0.20 - > 1.10 m

Wastewater Management Plan Page 9
Lot 2 in DP1088704 Martindale Road Martindale
Larry Cook Consulting 23.9.21 21073-B
Table 4 Summary Soil Profile – BH 4
TOPSOIL/ COLLUVIAL
0.00 - 0.20 Silty Sandy LOAM. Brown to grey brown. Abundant amounts of organic material. Dry and loose. Average thickness: 0.20 m Average interval: 0.00 - 0.20 m
COLLUVIAL
0.20 - 0.50 Sandy LOAM. Grey to pale brown. Gritty. Rounded quartz pebbles to 25 mm. Minor amounts of organic material. Semi dense and moist. Wet at base of interval. Average thickness: 0.30 m Average interval: 0.20 - 0.50 m
COLLUVIAL
0.50 - 0.90 Sandy Clayey LOAM. Yellow brown to yellow. Gritty and gravelly. Rounded rock fragments to 5 mm. Mottled orange. Semi dense and moist. Average thickness: > 0.40 m Average interval: 0.50 - > 0.90 m
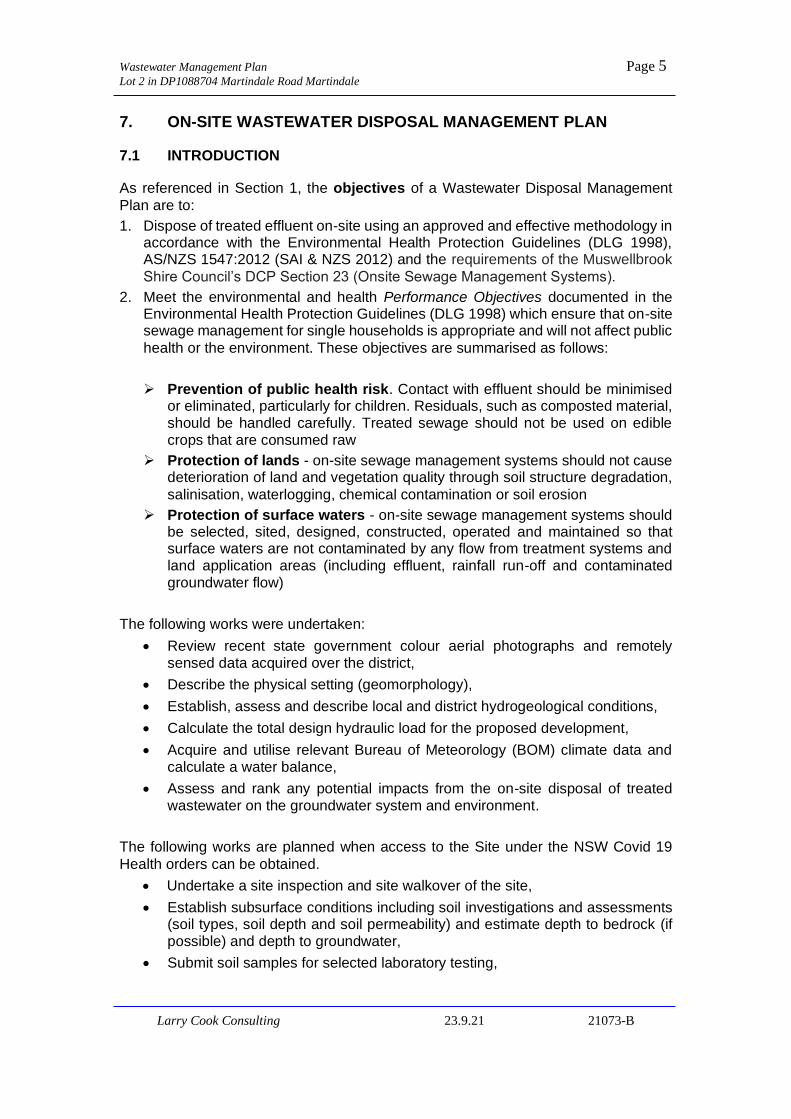
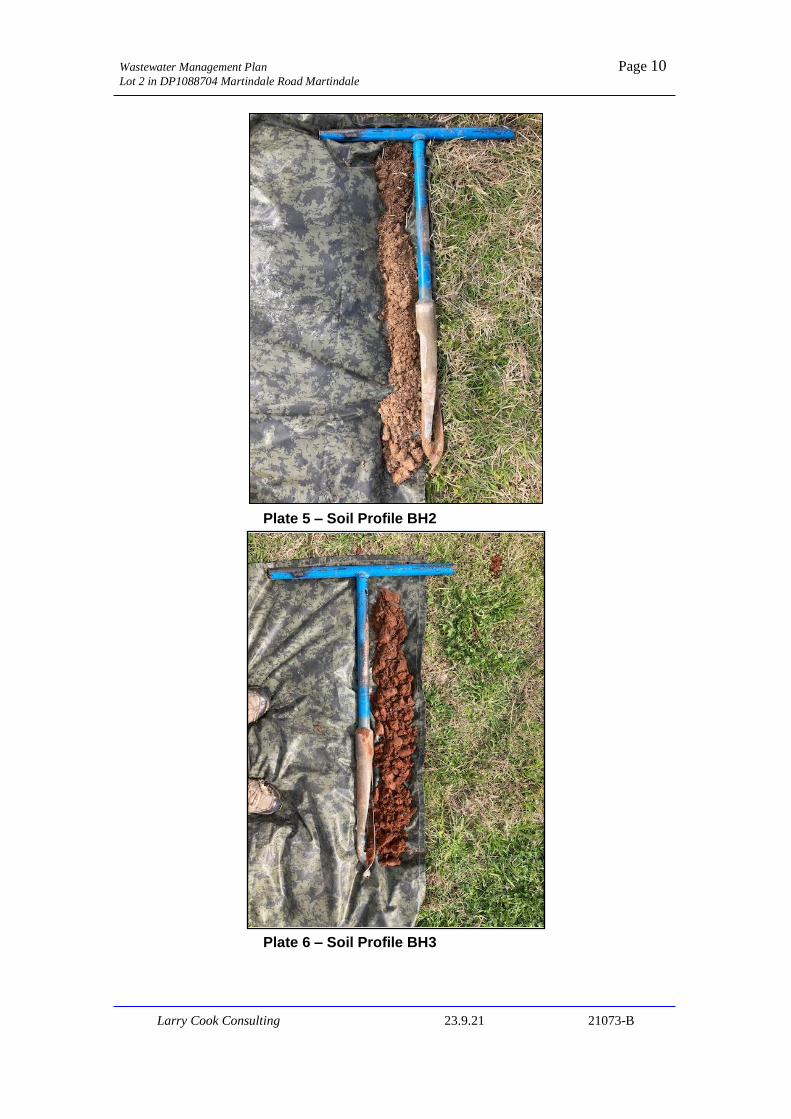
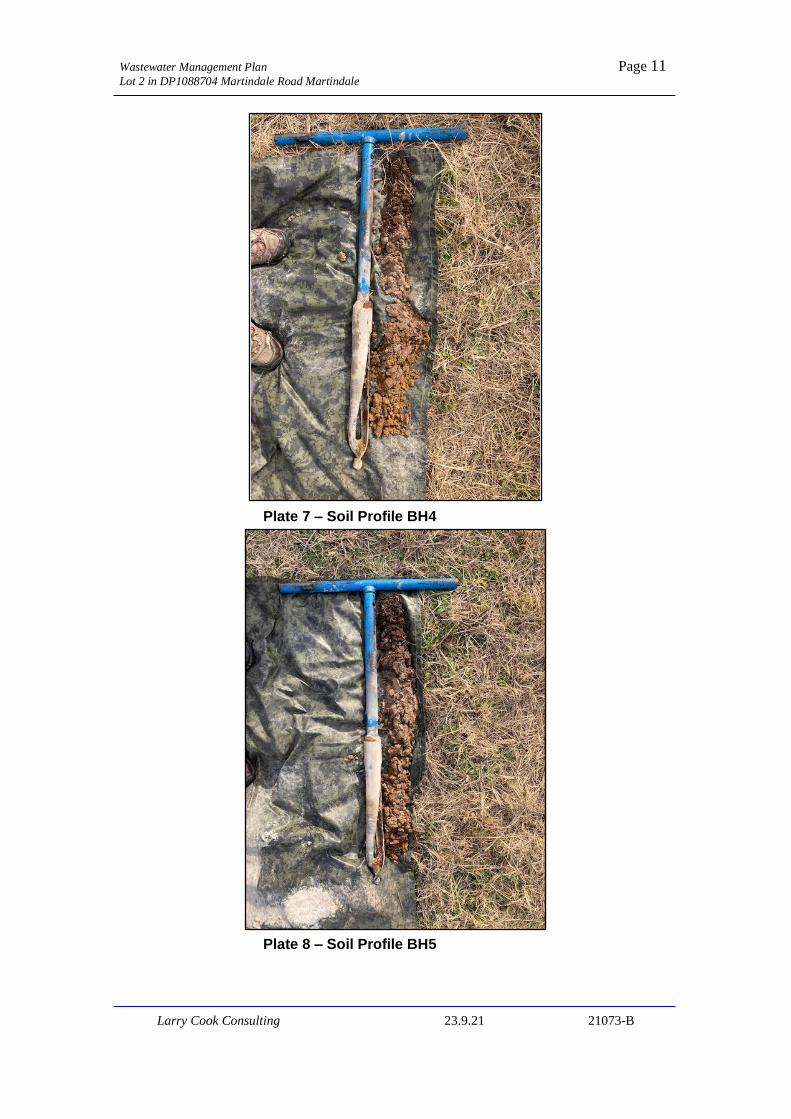
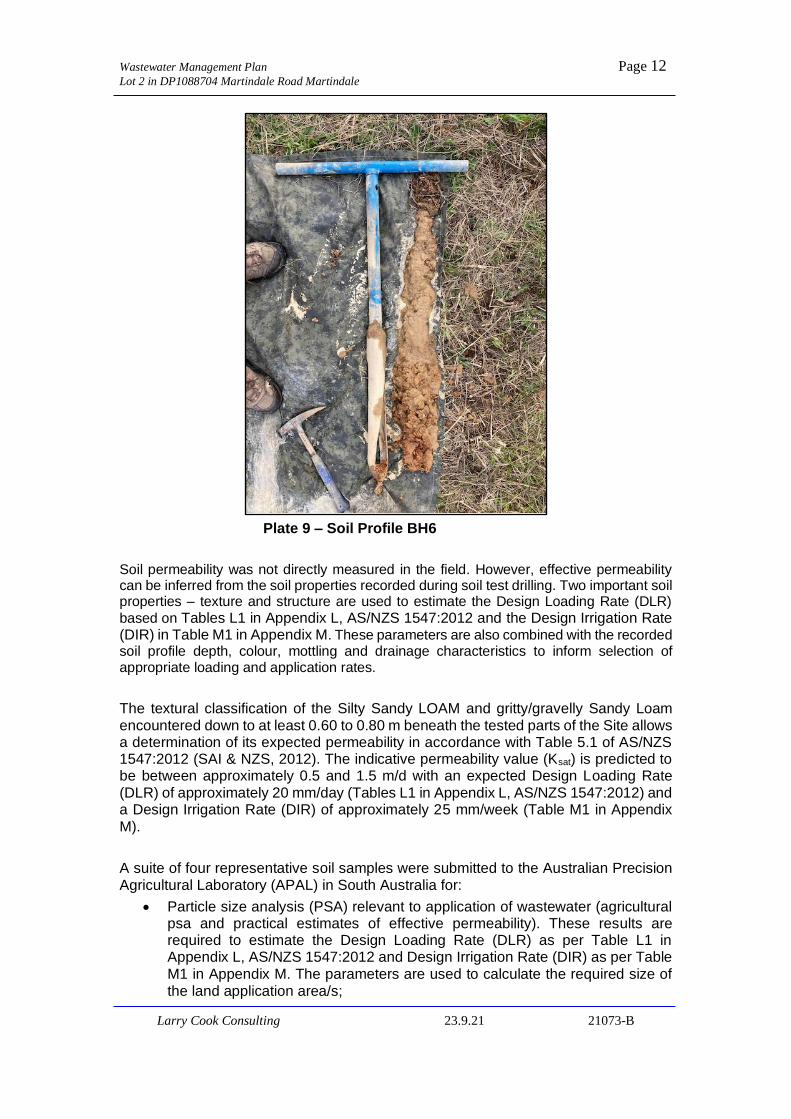
Images of the soil profiles intersected in the six representative test holes are provided in Plates 4 to 9.
Plate 4 – Soil Profile BH1
Wastewater Management Plan Page 10
Lot 2 in DP1088704 Martindale Road Martindale
Larry Cook Consulting 23.9.21 21073-B
Plate 5 – Soil Profile BH2
Plate 6 – Soil Profile BH3
Wastewater Management Plan Page 11
Lot 2 in DP1088704 Martindale Road Martindale
Larry Cook Consulting 23.9.21 21073-B
Plate 7 – Soil Profile BH4
Plate 8 – Soil Profile BH5
Wastewater Management Plan Page 12
Lot 2 in DP1088704 Martindale Road Martindale
Larry Cook Consulting 23.9.21 21073-B
Plate 9 – Soil Profile BH6
Soil permeability was not directly measured in the field. However, effective permeability can be inferred from the soil properties recorded during soil test drilling. Two important soil properties – texture and structure are used to estimate the Design Loading Rate (DLR)
based on Tables L1 in Appendix L, AS/NZS 1547:2012 and the Design Irrigation Rate (DIR) in Table M1 in Appendix M. These parameters are also combined with the recorded soil profile depth, colour, mottling and drainage characteristics to inform selection of appropriate loading and application rates.
The textural classification of the Silty Sandy LOAM and gritty/gravelly Sandy Loam encountered down to at least 0.60 to 0.80 m beneath the tested parts of the Site allows a determination of its expected permeability in accordance with Table 5.1 of AS/NZS 1547:2012 (SAI & NZS, 2012). The indicative permeability value (Ksat) is predicted to be between approximately 0.5 and 1.5 m/d with an expected Design Loading Rate (DLR) of approximately 20 mm/day (Tables L1 in Appendix L, AS/NZS 1547:2012) and a Design Irrigation Rate (DIR) of approximately 25 mm/week (Table M1 in Appendix M).
A suite of four representative soil samples were submitted to the Australian Precision Agricultural Laboratory (APAL) in South Australia for:
• Particle size analysis (PSA) relevant to application of wastewater (agricultural psa and practical estimates of effective permeability). These results are required to estimate the Design Loading Rate (DLR) as per Table L1 in Appendix L, AS/NZS 1547:2012 and Design Irrigation Rate (DIR) as per Table M1 in Appendix M. The parameters are used to calculate the required size of the land application area/s;

Wastewater Management Plan Page 13
Lot 2 in DP1088704 Martindale Road Martindale
Larry Cook Consulting 23.9.21 21073-B
• measurements of pH, Electrical Conductivity (EC) and Modified Emerson Class; and
• determination of Phosphorus Sorption (PSorp), Cation Exchange Capacity (CEC) and Exchangeable Sodium Capacity (ESP).
Descriptions of the various soil tests are provided in Table 5.
Table 5 Descriptions of the Various Soil Tests
Parameter Description
pH The pH value of a soil influences soil conditions and vegetation growth. Soil pH affects the solubility and fixation of some nutrients in soils. Soils with a pH of between 4.5 and 8.5 should pose no constraints for land application areas.
Electrical Conductivity (EC) High electrical conductivity (EC) in soils usually correspond to elevated concentrations of soluble salt. This is considered undesirable for vegetation growth. Salt concentration in soil is indicated by the EC of an extract from a 1:5 soil:water mix. To convert EC 1:5 deciSiemens per metre (dS/m) to ECe a multiplier factor related to the soil texture is required (see Hazelton & Murphy 1992). The tolerance of vegetation species to soil salinity varies among vegetation types. An ECeof greater than 4 ds/m is suggested as a limit above which vegetation growth problems can occur.
Sodicity (Exchangeable
Sodium Percentage - ESP)
The concentration of exchangeable sodium cations in a soil is known as sodicity which relates to likely dispersion on wetting and shrink/swell properties. Sodic soils tend to have low infiltration capability, low hydraulic conductivity, and a high susceptibility to erosion.
Exchangeable sodium percentage (ESP) is used as a measure of sodicity
Cation Exchange Capacity (CEC)
Solid particles in soil commonly have a negative surface charge. The overall neutrality of the system is maintained by the presence of cations close to the surface of the solid particles. These cations may be exchanged with others. This process is referred to as adsorption, a reversible surface phenomenon that does not involve a chemical reaction. Adsorbed cations may be retained by the soil, or utilised by vegetation. The cation exchange capacity is the total number of cations a soil can retain on its adsorbent complex at

Wastewater Management Plan Page 14
Lot 2 in DP1088704 Martindale Road Martindale
Larry Cook Consulting 23.9.21 21073-B
a given pH, and is therefore a good measure of a soil’s ability to retain specific pollutants. The most abundant cations in soil are calcium, magnesium, potassium and sodium, and hydrogen and aluminium in acid soils. A cation exchange capacity of greater than 15 cmol+/kg is recommended for land application systems.
Phosphorus Sorption
Capacity (PSorp)
The capacity of a soil to adsorb phosphorus is expressed as its phosphorus sorption capacity. A medium to high sorption capacity is greater than the equivalent of 6,000 kg/ha (considered to be active to a depth of approximately 100 cm below the level of wastewater application) and is preferred for land application areas. Phosphorus sorption by the soil is expected to occur up to approximately 25 to 50% of the phosphorus sorption capacity above which leaching of phosphorus can occur if the phosphorus is not used by vegetation uptake. A soil with a phosphorus sorption capacity of at least 50 years (in terms of mg P/g soil), based on the expected phosphorus load, is recommended for land application areas.
Modified Emerson Aggregate Class
The Emerson Aggregate Test is a measure of soil dispersibility and susceptibility to erosion and structural degradation. It assesses the physical changes that occur in a single ped of soil when immersed in water, specifically whether the soil slakes and falls apart or disperses and clouds the water. For example, an Emerson Class of 7 or 8 indicates low dispersion potential. This does not present a significant constraint for effluent application; however, it can be overcome by the addition of gypsum to the soil.
The results of field soil tests are summarised in Table 6.

Wastewater Management Plan Page 15
Lot 2 in DP1088704 Martindale Road Martindale
Larry Cook Consulting 23.9.21 21073-B
Table 6 Summary Results – Field Soil Testing
Description
BH 2 (0.4 m) Sandy LOAM
Result Limitation
pH (pH units) 6.2 Minor
E.C. (dS/m) 0.11 Minor
Modified Emerson Class 6 Minor
A Phosphorus Sorption (P Sorp) value of 580 mg/L is adopted in the calculations of the size of the required application area.
At the time of preparing this management plan the soil test results are awaited due to Covid-19 delays. The results will be incorporated in a revised management plan and issued accordingly.
7.4 DESIGN HYDRAULIC LOAD
Details of the design hydraulic load supplied by Warren Smith & Partners is provided in Table 7.
taff usage to 62l based on a 5minute shower (45l), 2 WC flushes and a 5 litre washing.
Table 7 Design Hydraulic Load Estimates
Components No. Unit
volume (L)
Daily wastewater allowance
(L)
Kennel Pods Washdowns 400 dog kennels 40 16,000
Dog bath washes 20 dogs/day 50 1,000
Hand washing 12 washes/person/day 0.5 120
Administration,
Center
Laundry (dog
bedding) 32 wash cycle 1401 4,480
Staff 25 permanent staff 627 1,550
Dog food preparation
400 dogs 0.5 200
Dishwasher 10 washes 102 100
Sinks 6 washes 753 450
Rinse water 3 rinses 1804 540

Wastewater Management Plan Page 16
Lot 2 in DP1088704 Martindale Road Martindale
Larry Cook Consulting 23.9.21 21073-B
Visitors 30 visitors 65 180
Vet Facility Surgery general 32 hand washes 10 320
Washing machine
4 washes 170 680
Residential Cottages
Cottage I 3 persons 1206 360
Cottage II 3 persons 1206 360
Total Daily Estimate (L) 26,340
A summary of the design hydraulic loadings is provided in Table 8.
Table 8 Summary Design Hydraulic Load
Components Frequency &
Usage
Daily wastewater allowance
(L)
Kennel Pods1 Washdown, dog and hand washes
7 days/week
(100% usage)
17,120
Homesteads, administration center, vet facility, kitchen, toilet/shower amenities, multi-purpose function space, laundry
Manager, management, visitors and
staff2
2,450
Dog food preparation kitchen
200
Washing and Rinsing
1,090
Commercial laundry
4,480
Vet facility 1,000
7.5 SYSTEM SELECTION
In terms of the application of treated wastewater on the Site, the potential limitations for the Site have been reviewed, assessed and the results summarised in Table 9. Positive site attributes include excellent sun and wind exposure over the whole Site, gentle ground slopes. Soil limitations will be assessed following on-site soil investigations and testing. Several potential limitations will be assessed when access to the Site can be obtained under the NSW Covid 19 Health orders.

Wastewater Management Plan Page 17
Lot 2 in DP1088704 Martindale Road Martindale
Larry Cook Consulting 23.9.21 21073-B
Table 9 Assessment of Limitations for On-site Disposal of Treated Wastewater
Lot 2 in DP1088704 Martindale Road Martindale
Feature Site Capable level (Low Limitation)
Marginal Level (Mod. Limitation)
Unsuitable
Level (High Limitation)
Proximity to any surface water bodies
>40 m X
Depth to bedrock (m) >1.10 m X
Depth to Water Table (m) >1.10 m X
Soil Permeability 0.5-1.5 m/day X
Soil Drainage Good X
Coarse Fragments (%) <20 X
Bulk Density (g/cm3) Approx. 1.5 X
Electrical Conductivity (dS/m)
0.11 X
Phosphorus Sorption (kg/ha) 6090 X
Emerson Aggregate Test Class 6 X
Sun/wind Exposure Excellent X
Flood Potential nil X
Slope (%) Approx. 3 % X
Landform Gradual slope X
Run-on seepage Low X
Erosion Potential Low X
Site Drainage Good X
Site Fill Nil X
Practical Available Land (m2) > 20,000 m2 X
7.6 ASSESSMENT OF EXISTING ON-SITE SEWAGE MANAGEMENT SYSTEMS
It is understood that wastewater generated from the two existing cottages is directed to ‘old’ concrete septic tanks, treated to primary standard and discharged under gravity into proximal absorption trenches of unknown locations and dimensions. The general locations of the septic tanks are shown in Figure 5.
A photo of the septic tank attached to the principal cottage (northern building) is shown in Plate 10. The tank is an ‘old style’ brick structure historically constructed on-site, the capacity of which no longer complies with current standards.

Wastewater Management Plan Page 18
Lot 2 in DP1088704 Martindale Road Martindale
Larry Cook Consulting 23.9.21 21073-B
Plate 10 – Septic Tank – Main Cottage.
A photo of the septic tank attached to the secondary cottage is shown in Plate 11. The tank is a poly device, the capacity of which complies with current standards.
Plate 11. – Septic Tank – Secondary Cottage.
An ‘older’ bricked septic tank with a historically placed replacement concrete lid is
located close to the secondary cottage (Plate 12).

Wastewater Management Plan Page 19
Lot 2 in DP1088704 Martindale Road Martindale
Larry Cook Consulting 23.9.21 21073-B
Plate 12. – ‘old’ Septic Tank – Secondary Cottage.
The proposed development incorporates an upgrade of the existing OSSMs which is discussed in Section 8.3. The client-preferred solution documented in Section 9 is
8. WASTE TREATMENT OPTIONS
8.1 INTRODUCTION
The two main types of waste associated with the proposed development are:
• waste generated from the cleaning of dog kennels (pods) and wastewater from laundry activities (dog bedding) and kitchen used for dog food preparation; and
• human waste generated from a combination of amenities in the center and everyday living in the cottages.
8.2 DOG KENNELS (PODS)
8.2.1 Solid Waste
Solid dog waste is usually managed as solid waste and not treated in the treatment system used for the other wastewater streams. Solid waste is usually collected and composted or landfilled either on-site or off-site subject to local Council approval. It is understood that an option is to process the high-COD dog waste (and all waste streams) in an anaerobic membrane wastewater treatment system (anaerobic digester/reactor) to potentially generate power (bioenergy) for the development. A description of a client preferred anaerobic digester/reactor is provided in Section 9.1.

Wastewater Management Plan Page 20
Lot 2 in DP1088704 Martindale Road Martindale
Larry Cook Consulting 23.9.21 21073-B
8.2.2 Washdown Water
The management of washdown water from dog kennels and veterinary clinics is not usually included in state government regulations. Vet clinic medicines must be prohibited from entering the treatment system. Waste from these types of activities should not present to the same treatment systems that treat human waste.
Washdown water from dog kennels typically has high levels of ammonia nitrogen from urine and variable amounts of hair and sanitizer.
It is considered that a conventional Aerated Wastewater Treatment System (AWTS) is not the ideal treatment strategy. The effective operation of an AWTS requires organic carbon which is largely missing in washdown water. An effective solution is considered to be passive treatment in a baffled septic tank system, a baffled anaerobic reactor. A description of a client preferred anaerobic digester/reactor is provided in Section 9.1.
Fine grates, baskets or screens should be installed on all floor drains and sumps to catch any small particles and dog hair. Additional septic tank capacity could be installed to catch hair not captured in the primary screens/baskets. A commercial-size effluent filter (designed for high-strength waste) could be placed on the outlet of the tank system.
8.2.3 Commercial Laundry Water and Dog Food Preparation Area
A description of a client preferred anaerobic digester/reactor is provided in Section 9.1.
8.3 HUMAN WASTE
There are several options available for the treatment of solid and liquid human waste generated from the amenities in the center and cottages, and kitchen waste from the center.
Wastewater treatment to minimum secondary standard using a commercial scale AWTS is the conventional approach.
A description of a client preferred anaerobic digester/reactor is provided in Section 9.1.
9. CLIENT PREFERRED WASTEWATER TREATMENT SYSTEM
9.1 DESCRIPTION
It is understood that the client preferred waste treatment system is an anaerobic digestion waste to energy plant designed by Inoplex. The treatment plant recommended by Inoplex is an anaerobic baffled reactor (ABR) with an added membrane filtration system (mABR). The approximate location of the mABR is annotated in Figure 6.

Wastewater Management Plan Page 21
Lot 2 in DP1088704 Martindale Road Martindale
Larry Cook Consulting 23.9.21 21073-B
A typical cross section of a ABR after Tilley (2014) is shown in Figure 11. Inoplex state that anaerobic wastewater treatment is an alternative approach that consumes much less energy and produces heat and power. Inoplex informs that the ABR is designed to treat all waste including:
• washdown water,
• dog washing water,
• hand washing,
• laundry water,
• wastewater generated from preparation of dog food,
• commercial dishwasher, sinks and rinse water,
• vet clinic water,
• toilets and showers
• function center,
• pool backwash water, and
• all wastewater generated from the cottages. According to Inoplex, all wastewater generated on the Site including dog faeces and food scraps will be flushed into the mABR which converts the carbon-based waste into biogas. The combined heat and power generator draws the biogas to create grid synchronised power and water heating for the facilities. The cleaned purified water is then discharged on-site via irrigation. Inoplex state that the Combined Heat and Power plant will provide 20 KW hours of renewable power per day and 48 KW.hours of hot water heating.
9.2 DESIGN HYDRAULIC LOAD
The daily wastewater flow for the project documented by Inoplex is 27,500 L.
Maximum Design Hydraulic Load: 27,500 L/day
9.3 WASTEWATER FROM COTTAGES AND CENTER
It is proposed to decommission the ‘old’ septic tanks attached to the two cottages. An earlier considered option was to install standalone aerated wastewater treatment systems (AWTSs) on each building or a commercial AWTS that treated wastewater from the cottages and center with treatment to minimum secondary standard. Disposal would be achieved via an approved method such as surface spray irrigation, sub-
surface spray irrigation, absorption trenches or pressure dosed beds.
However, the client-preferred mABR will, according to the Inoplex documentation treat all wastewater generated from the center and cottages. In this regard, there is insufficient fall to gravity drain the wastewater from the center and cottages up to the mABR. The solution is installation of a new compliant pump well of minimum 1,000 L capacity is proposed downslope of the cottages and proposed center. In this way all wastewater from the cottages and center can be directed under gravity to the new
pump well then pumped upgradient to the mABR.

Wastewater Management Plan Page 22
Lot 2 in DP1088704 Martindale Road Martindale
Larry Cook Consulting 23.9.21 21073-B
An example of a compliant pump well is an ultraWELL 1000 pump well manufactured by Wastewater Australia. Specifications are provided in Appendix C. The pump well has a 1,000 L capacity and incorporates a macerator pump and float switch. The pump well, delivery line (and connections) from the cottages and center and connection to the mABR must be undertaken by a licensed plumber with experience in ‘pump to sewer’ connections.
The key elements of the connection to the mABR are considered to be:
• 50mm-diameter pressure PVC pipe or suitable delivery pipe between the outlet on the pump well and mABR connection point;
• The macerator pump must have sufficient head to overcome the hydraulic head and any friction losses. The licensed plumber should advise.
The alternative is installation of a larger capacity package pump station.
9.4 WASTEWATER DISPOSAL – SURFACE SPRAY IRRIGATION
9.4.1 Introduction
The preferred method of disposal of treated wastewater is surface spray irrigation. It is proposed to divide the Land Application Area into equi-sized panels located in the central northern part of the Site immediately north of the proposed pods which has excellent sun and wind exposure and suitable soil development. The network of panels would be fed by an indexing (sequencing) system which enables intermittent resting between dosing and even distribution of treated wastewater.
The daily wastewater flow estimated in this WMP is 25,540 L. The daily wastewater flow documented by Inoplex and used in this WMP is 27,500 L.
The predicted quality of the wastewater discharged from the mABR, in particular nutrients, is not available. In lieu of establishing the chemistry of the discharged wastewater, a concentrations of 20 mg/L Total Nitrogen (Total N) and 8 mg/L Total Phosphorus (Total P) is adopted in this management plan.
9.4.2 Calculations
Design parameters and calculations for the surface spray irrigation are provided in
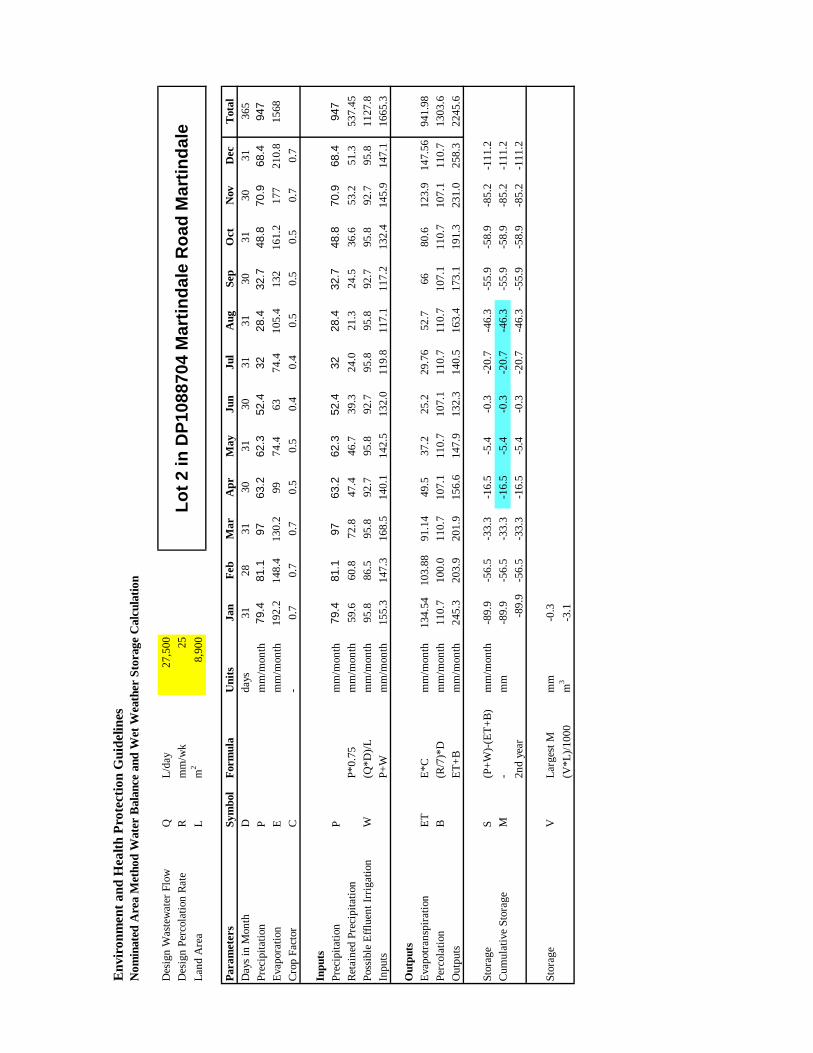
Appendix A. The water balance used is a monthly model adapted from the “Nominated Area Method” described in DLG (1998). These calculations determine the minimum irrigation area sizes for given effluent loads for each month of the year. The water balance can be expressed by the following equation: Precipitation + Effluent Applied = Evapotranspiration + Percolation + Storage Ideally, irrigation areas are calculated to achieve no net excess of water and hence zero storage for all months.

Wastewater Management Plan Page 23
Lot 2 in DP1088704 Martindale Road Martindale
Larry Cook Consulting 23.9.21 21073-B
The calculations of the size of the disposal area proposed for the Site are summarised in Table 10.
The locations considered suitable for the construction of primary irrigation panels on the Site are shown in Figure 12. The preferred Land Application Area is shown in Figures 13 and 14.
Table 10 Summary Disposal Area Calculations
Design Hydraulic Load (L/day) 27,500
Area (m2)
Minimum Area Method 5,876
Nominated Area Method with full
wet weather storage 8,900
100 % Nitrogen Uptake 8,088
50-year Phosphorus Life 3,337
Proposed Application Area (Most Limiting)
8,900 m2
Adopted Application Area 9,000 m2
Parameters and Assumptions:
1. 2. 3. 4. 5. 6. 7.
Total N Total P Indicative Permeability: Design Irrigation Rate (DIR): Effective Absorption Depth: Soil Phosphorus Sorption Capacity: Soil Treatment:
20 mg/L 8 mg/L 0.5 and 1.5 m/d 25 mm/wk 0.70 m 6,090 kg/ha nil
Therefore, the proposed total primary application area required to accept the design hydraulic load of 27,500 L/day with full wet weather storage, a satisfactory 50-year phosphorus adsorption life and the uptake of the total nitrogen is approximately 9,000 m2.
The position of the irrigation system in the central northern part of the Site takes into account the required buffer distances from the property boundaries, existing and proposed buildings, surface water bodies and driveway. The proposed application area will have excellent sun and wind exposure with satisfactory soil development. The
surface spray irrigation area will be grass covered.

Wastewater Management Plan Page 24
Lot 2 in DP1088704 Martindale Road Martindale
Larry Cook Consulting 23.9.21 21073-B
9.5 NUTRIENT CALCULATIONS
The nutrient calculations and results are provided in the third spread sheet in Appendix A. The calculations are comprehensive and take into all relevant parameters and values based on the current literature. The basic formula used to calculate the area requirements based on nitrogen and phosphorus loadings are taken from the Environmental Health Protection Guidelines (DLG 1998) and are provided
below in support of the model calculations in Appendix A.
The critical Total Nitrogen loading rate used in the example on Page 153 in the Environment and Health Protection Guidelines (DLG, 1998) is a ‘nominal’ loading rate of 25 mg/m2/day. The calculations in this WMP adopt a rate of 68 mg/m2/day which is consistent with the calculations used by other workers. According to our literature research, this is considered to be a conservative level and is used in the calculations below. The source publication is a landmark paper on nitrogen in wastewater written by Bob Patterson of Lanfax Laboratories in Armidale (Patterson, 2003). The relevant section relating to critical nitrogen uptake is reproduced below.
“The Environment and Health Protection Guidelines (DLG, 1998) suggest a nominal
nitrogen loading of 25 mg/m2/day (91 kg/ha/year) be applied to land application
systems. When this loading rate is compared with typical plant and microbial uptake
rates, it is difficult to understand the scientific basis for the guideline value. While the
value is called ‘nominal’ the author has had some authorities impose this as the
maximum loading rate. The value is simply the mean of the range of TN for uptake
values of perennial pasture referred to by EPA (1995) as 65-130 kg/ha.yr, which
references a NSW Agriculture 1991 Feedlot Manual.
The revised Feedlot Manual (NSW Agriculture, 1997) indicates that for an irrigated
perennial ryegrass pasture, growing actively March to December, the expected
nitrogen uptake rate is 420 kg/ha.yr. Kikuyu is expected to remove 520 kg/ha.yr.
Removal of the aerial portion of the grasses is required to remove the nitrogen from the
application area. It would follow, although not discussed in the guidelines, that a
further quantity of nitrogen would be stored in the root system as organic nitrogen, in
the microbial biomass and leaching of nitrogen would be restricted to only a portion of
the nitrate-N...”
The critical phosphorus loading rate used in the example on Pages 153 and 154 in the Environment and Health Protection Guidelines (DLG, 1998) is a ‘nominal’ loading rate of 3 mg/m2/day However, a review of the literature on wastewater chemistry suggests that a more realistic critical loading rate is possibly closer to 7 mg/m2/day. The source publication is a landmark paper on phosphorus in wastewater written by Robert Patterson of Lanfax Laboratories in Armidale (Patterson, 2001). The relevant section relating to phosphorus uptake in soils is reproduced below.
“...In all the (analytical) methods, P sorption only accounts for the addition of labile inorganic P being added and measured at specified pH for a particular period. The
tests do not account for the pH of the effluent added or the other elemental constituents
of the effluent, in particular the proportion of monovalent and divalent cations.

Wastewater Management Plan Page 25
Lot 2 in DP1088704 Martindale Road Martindale
Larry Cook Consulting 23.9.21 21073-B
The addition of organic P components will have no immediate impact on determination
of P sorption, yet substantial masses of organic P can be stored in the soil without loss
by leaching....”
“The purpose of determining P sorption is to predict the capacity of the soil to bind,
and reduce the potential for effluent-applied inorganic P leaching from the soil and
entering surface or groundwater. The results of this testing program do not support the
general discount factor of 70% from measured P sorption to that actually adsorbed.
Since part of the P in effluent is in organic form, a soil’s capacity to adsorb P is greater
than determined for inorganic P sorption....”
The critical phosphorus loading rate adopted in this WMP is 7 mg/m2/day.
The formulae documented in the Environment and Health Protection Guidelines follows in their relevant sections with calculations for the Site.
The following calculations are provided for the 900 L/day hydraulic load scenario.
Determination of Minimum Area Based on Nitrogen Loading
A = 20 x 27,500 / 68
= 8,088 m2
where A = land Area (m2) C = concentration of Total Nitrogen (TN) (20 mg/L) less 20% for
lost to soil processes Q = treated wastewater flow rate (L/day)
Ln = critical TN loading rate (mg/m2/day)
Determination of Area Based on Phosphorus Loading
The determination of the minimum area is based on a phosphorus loading of 10 mg/L. Based on the parameters gleaned from research by Patterson (2001) and used by a leading consultancy in the industry, a phosphorus soil sorption without leaching factor of 0.7, a critical phosphorus uptake rate of 7 mg/m2/day and a recommended phosphorus sorption ability of 50 years is as follows;.
A = P generated / (P adsorbed + P uptake)
A = 6022.5 / (0.426 + 0.128)
= 3,336.5 m2
A = Ln C x Q

Wastewater Management Plan Page 26
Lot 2 in DP1088704 Martindale Road Martindale
Larry Cook Consulting 23.9.21 21073-B
P generated over 50 years = TP x Q x days x years
= 12 x 27,500 x 365 x 50
= 6,022.5 (120.45 kg/year)
where P generated = amount of phosphorus generated (kg) TP = Total Phosphorus concentration in treated wastewater (mg/L) Q = treated wastewater flow rate (L/day)
P adsorbed = P Sorp x 0.7
= 6,090 x 0.7
= 0.426 kg/m2
where P adsorbed = amount of phosphorus that can be adsorbed without leaching P Sorp = phosphorus sorption capacity (kg/ha)
P uptake over 50 years = CPLR x days x years
= 7 x 365 days x 50 years
= 0.128 kg/m2
where P uptake = amount of phosphorus vegetation uptake CPLR = critical P loading rate (mg/m2/day)
The results are summarised in Table 11.

Wastewater Management Plan Page 27
Lot 2 in DP1088704 Martindale Road Martindale
Larry Cook Consulting 23.9.21 21073-B
Table 11 Summary Results of Nutrient Calculations
Parameter Calculation
Estimated Total Nitrogen Concentration (AWTS) 20 mg/L
Estimated Total Phosphorus Concentration (AWTS) 8 mg/L
Estimated bulk soil density 1500 kg/m3
Phosphorus sorption depth (from field soil testing) 0.70 m
Phosphorus sorption capacity (laboratory testing) 580 mg P/kg (6,090 kg/ha)
Design wastewater load (Inoplex) 27,500 L/day
Adopted application area 9,000 m2
Total nitrogen not assimilated 0 kg/year
Total phosphorus not assimilated 67.43 kg/year
Site phosphorus longevity Greater than 50 years
9.6 SURFACE SPRAY IRRIGATION
It is recommended that the installation of a surface spay irrigation system be carried out by an experienced installer or qualified operator. In summary, treated wastewater should be pulse pumped from the AWTS to the disposal area/s through reinforced 19 mm diameter pipe or approved lilac pipe or appropriate pipe. The disposal area can be divided into two or more panels. Spray treated wastewater via a series of approved sprinkler systems such as butterfly sprinklers, ‘wobblers’, Quick Coupling Valves (QCVs) or similar. Bury irrigation lines should be buried to a depth of approximately
100 mm.
A detailed land application system hydraulic design is beyond the scope of this report; however, this should be prepared upon receipt of development approval and before installation of the system.
A ‘sequencing valve’ (rota valve) should be installed by the licensed plumber or experienced installer close to the mABR to automatically alternate the distribution of the treated wastewater between irrigations panels, the size of which can be informed from the hydraulic design. This will provide suitable resting periods for the irrigation areas and minimise the potential for soil wetting. Separation distance between spray heads approximately 10 to 15 m
The fixed surface spray irrigation disposal method must satisfy the requirements listed in AS/NZS 1547:2012 as follows:
• The spray irrigation system must distribute the effluent evenly within the designated area. This is achieved by installing turf valves with rota sprinklers, butterfly sprinklers or ‘wobblers’ for the design disposal area.

Wastewater Management Plan Page 28
Lot 2 in DP1088704 Martindale Road Martindale
Larry Cook Consulting 23.9.21 21073-B
• The effective coverage of each sprinkler is 78.5 m2. Therefore, a total of 115 sprinklers are required to manage the adopted 9,000 m2 Land Application Area.
• The Land Application Area (LAA) can be divided into several irrigation panels using a sequencing valve (rota valve) or pump sequencing.
• The spray irrigation system must distribute the effluent evenly within the designated area.
• The droplet size, throw and plume height of the sprinkler system is such that the risk of any aerosol dispersion and effect of wind drift distributing any effluent beyond the designated area is negligible. These parameters are achieved by installing relatively ‘low to the ground’ sprinklers that minimise the spray height,
produce large droplets and throw the effluent less than about 5 m radius.
• Two warning signs complying with AS 1319 are fixed to the nearest boundaries of the property adjacent to the irrigation area advising people that recycled water is used; avoid any contact and DO NOT DRINK.
• Ensure that the effluent does not come into contact with people, domestic or farm animals or any crops intended for human consumption. This can be achieved by isolating the irrigation area (fencing).
10. RESERVE APPLICATION AREA
A backup area of similar size may be required by the authorities in the unlikely event that the primary area fails. The results of the desktop and field investigations indicate that, given the size of the property, landform and soils, other suitable areas there are adequate areas for backup wastewater disposal. The reserve areas can be positioned
within the available areas shown in Figure 12.
11. BUFFER DISTANCES
The position of the proposed irrigation areas satisfies the following buffer distances listed in Table 12 and documented in Table 5 of the Environmental Health Protection Guidelines (DLG 1998).
Table 12 Guideline Buffer Distances
From Intermittent Drainages 40 m
From Permanent Drainages 100 m
From Dams 40 m
From Domestic water well (Bore) 250 m
Upgradient of Property Boundary 6 m
Downgradient of Property Boundary 3 m
Upgradient of swimming pools, driveways and buildings 6 m
Downgradient of swimming pools, driveways and buildings 3 m

Wastewater Management Plan Page 29
Lot 2 in DP1088704 Martindale Road Martindale
Larry Cook Consulting 23.9.21 21073-B
12. CONCLUSIONS AND RECOMMENDATIONS
12.1 GENERAL
• The wastewater management plan is developed to meet the environmental and health Performance Objectives documented in the Environmental Health Protection Guidelines (DLG 1998), in particular the avoidance of any impacts on public health or the environment. The design disposal of secondary treated effluent on-site proposes an approved and effective methodology in accordance with the Environmental Health Protection Guidelines (DLG 1998) and AS/NZS 1547:2012
(SAI & NZS 2012).
• The client-preferred preferred method of wastewater treatment for all waste generated from the washdown of the kennel pods, dog wash water, dog faeces, commercial laundry water in the center, human waste generated from the cottages and center, and vet clinic waste is via an Anaerobic Bio Reactor with a
membrane facility (mABR).
• The preferred method of wastewater disposal is via surface spray irrigation.
• There is considered to be sufficient available area in the eastern half of the Site for reserve (backup) disposal.
• The installation of the treatment system and the construction of the Land Application Areas and associated plumbing and hydraulic connections must be undertaken by a qualified plumber/installer with experience in constructing such disposal systems and any relevant codes of practices.
• Upon finalisation of the OSSM design, select the treatment system and complete an Application to Install Sewage Management System including Greywater Treatment System and Greywater Diversion System Sec 68, Chapter 7 LGA 1993. A Council fee applies.
12.2 SURFACE SPRAY IRRIGATION
• The proposed total primary application area required to accept the design hydraulic load of 27,500 L/day with full wet weather storage, a satisfactory 50-year phosphorus adsorption life and the uptake of the total nitrogen is approximately 9,000 m2.
• The spray irrigation system must distribute the effluent evenly within the designated area. This is achieved by installing turf valves with rota sprinklers, butterfly sprinklers or ‘wobblers’ for the design disposal area.
• The effective coverage of each sprinkler is 78.5 m2. Therefore, a total of 115 sprinklers are required to manage the adopted 9,000 m2 Land Application Area.
• The Land Application Area (LAA) can be divided into several irrigation panels using a sequencing valve (rota valve) or pump sequencing.
• The spray irrigation system must distribute the effluent evenly within the designated area.
• The droplet size, throw and plume height of the sprinkler system is such that the risk of any aerosol dispersion and effect of wind drift distributing any effluent beyond the designated area is negligible. These parameters are achieved by installing relatively ‘low to the ground’ sprinklers that minimise the spray height, produce large droplets and throw the effluent less than about 5 m radius.

Wastewater Management Plan Page 30
Lot 2 in DP1088704 Martindale Road Martindale
Larry Cook Consulting 23.9.21 21073-B
• A minimum of two warning signs complying with AS 1319 should be fixed to the nearest boundaries of the property adjacent to the irrigation area advising people that recycled water is used; “avoid any contact and DO NOT DRINK”.
• Ensure that the wastewater does not come into contact with people, domestic or farm animals or any crops intended for human consumption. This can be achieved by isolating the irrigation area possibly by fencing.
• A detailed land application system hydraulic design is beyond the scope of this report; however, this should be prepared upon receipt of development approval and before installation of the system.
13. REFERENCES
DLG. 1998. Environmental Health Protection Guidelines – On Site Sewage Management for Single Households.
Glen R.A. and Beckett J., 1993, Hunter Coalfield Regional Geology 1:100 000, 2nd edition. Geological Survey of New South Wales, Sydney.
Patterson, R.A. 2001 Phosphorus Sorption for On-site Wastewater Assessments in Proceedings of On-site ’01 Conference: Advancing On-site Wastewater Systems by R.A. Patterson and M.J. Jones (Eds). Published by Lanfax Laboratories Armidale. Pp 307-314.
Patterson, R.A. 2003 Nitrogen in Wastewater and its Role in Constraining On-Site Planning in Future Directions for On-site Systems. Best Management Practice. Proceedings of On-site ’03 Conference by Patterson, R.A and Jones, M.J (Eds). Held at University of New England, Armidale 30 th September 2003. Published by Lanfax Laboratories Armidale. Pp 313-
320.
SAI & SNZ. 2012. On-Site Domestic-Wastewater Management. AS/NZS 1547:2000, Australian Standards International & Standards New Zealand.
Sydney Catchment Authority. 2012. Designing and Installing On-Site Wastewater Systems (SCA, 2012).
For and on behalf of Larry Cook Consulting
Larry Cook Environmental Consultant and Hydrogeologist
Larry Cook Consulting 23.9.21 21073-B
APPENDIX A
DESIGN PARAMETERS AND CALCULATIONS
SURFACE/SUB-SURFACE
APPLICATION

En
vir
on
men
t an
d H
ealt
h P
rote
ctio
n G
uid
elin
es
Min
imu
m A
rea M
eth
od
Wate
r B
ala
nce
an
d W
et W
eath
er S
tora
ge
Calc
ula
tio
n
Des
ign W
aste
wat
er F
low
QL
/day
27
,50
0
Des
ign P
erco
lati
on R
ate
Rm
m/w
k2
5
Pa
ram
eter
sS
ym
bol
Form
ula
Un
its
Ja
nF
ebM
ar
Ap
rM
ay
Ju
nJ
ul
Au
gS
epO
ctN
ov
Dec
Tota
l
Day
s in
Month
Dday
s3
12
83
13
03
13
03
13
13
03
13
03
13
65
Pre
cip
itat
ion
Pm
m/m
onth
79
.48
1.1
97
63
.26
2.3
52
.43
22
8.4
32
.74
8.8
70
.96
8.4
94
7
Evap
ora
tion
Em
m/m
onth
19
2.2
14
8.4
13
0.2
99
74
.46
37
4.4
10
5.4
13
21
61
.21
77
21
0.8
15
68
Cro
p F
acto
rC
-0
.70
.70
.70
.50
.50
.40
.40
.50
.50
.50
.70
.7
Ou
tpu
ts
Evap
otr
ansp
irat
ion
ET
E*
Cm
m/m
onth
13
4.5
41
03
.88
91
.14
49
.53
7.2
25
.22
9.7
65
2.7
66
80
.61
23
.91
47
.56
94
1.9
8
Per
cola
tion
B(R
/7)*
Dm
m/m
onth
11
0.7
10
0.0
11
0.7
10
7.1
11
0.7
10
7.1
11
0.7
11
0.7
10
7.1
11
0.7
10
7.1
11
0.7
13
03
.6
Outp
uts
ET
+B
mm
/month
24
5.3
20
3.9
20
1.9
15
6.6
14
7.9
13
2.3
14
0.5
16
3.4
17
3.1
19
1.3
23
1.0
25
8.3
22
45
.6
Inp
uts
Pre
cip
itat
ion
Pm
m/m
onth
79
.48
1.1
97
63
.26
2.3
52
.43
22
8.4
32
.74
8.8
70
.96
8.4
94
7
Ret
ained
Pre
cip
itat
ion
P*
0.7
5m
m/m
onth
59
.66
0.8
72
.84
7.4
46
.73
9.3
24
.02
1.3
24
.53
6.6
53
.25
1.3
53
7.4
5
Poss
ible
Eff
luen
t Ir
rigat
ion
W(E
T+
B)-
Pm
m/m
onth
18
5.7
14
3.1
12
9.1
10
9.2
10
1.2
93
.01
16
.51
42
.11
48
.61
54
.71
77
.92
07
.01
70
8.1
Act
ual
Eff
luen
t Ir
rigat
ion
IH
/12
mm
/month
14
2.3
14
2.3
14
2.3
14
2.3
14
2.3
14
2.3
14
2.3
14
2.3
14
2.3
14
2.3
14
2.3
14
2.3
17
08
.1
Inp
uts
P+
Im
m/m
onth
20
1.9
20
3.2
21
5.1
18
9.7
18
9.1
18
1.6
16
6.3
16
3.6
16
6.9
17
8.9
19
5.5
19
3.6
22
45
.6
Sto
rage
S(P
+I)
-(E
T+
B)
mm
/month
-43
.4-0
.71
3.2
33
.14
1.2
49
.32
5.9
0.2
-6.3
-12
.4-3
5.5
-64
.6
Cum
ula
tive
Sto
rage
M-
mm
-43
.4-0
.71
3.2
46
.38
7.5
13
6.8
16
2.7
16
2.9
15
6.6
14
4.2
10
8.7
44
.1
Irri
gat
ion A
rea
L3
65
*Q
/Hm
25
87
6.4
Sto
rage
VL
arges
t M
mm
16
2.9
(V*
L)/
10
00
m3
95
7.2
Lo
t 2
in
DP
10
88
70
4 M
art
ind
ale
Ro
ad
Ma
rtin
da
le
En
vir
on
men
t a
nd
Hea
lth
Pro
tecti
on
Gu
ideli
nes
Nom
inate
d A
rea M
eth
od
Wate
r B
ala
nce
an
d W
et W
eath
er S
tora
ge
Calc
ula
tio
n
Des
ign
Was
tew
ater
Flo
wQ
L/d
ay2
7,5
00
Des
ign
Per
cola
tion
Rat
eR
mm
/wk
25
Lan
d A
rea
Lm
28
,90
0
Pa
ram
ete
rs
Sym
bol
Form
ula
Un
its
Ja
nF
eb
Ma
rA
pr
Ma
yJ
un
Ju
lA
ug
Sep
Oct
Nov
Dec
Tota
l
Day
s in
Mon
thD
day
s3
12
83
13
03
13
03
13
13
03
13
03
13
65
Pre
cipit
atio
nP
mm
/mon
th79.4
81.1
97
63.2
62.3
52.4
32
28.4
32.7
48.8
70.9
68.4
947
Evap
ora
tion
Em
m/m
on
th1
92
.21
48
.41
30
.29
97
4.4
63
74
.41
05
.41
32
16
1.2
17
72
10
.81
56
8
Cro
p F
acto
rC
-0
.70
.70
.70
.50
.50
.40
.40
.50
.50
.50
.70
.7
Inp
uts
Pre
cipit
atio
nP
mm
/mon
th79.4
81.1
97
63.2
62.3
52.4
32
28.4
32.7
48.8
70.9
68.4
947
Ret
ain
ed P
reci
pit
atio
nP
*0.7
5m
m/m
on
th5
9.6
60
.87
2.8
47
.44
6.7
39
.324
.02
1.3
24
.53
6.6
53
.25
1.3
53
7.4
5
Poss
ible
Eff
luen
t Ir
rigat
ion
W(Q
*D
)/L
mm
/mon
th9
5.8
86
.59
5.8
92
.79
5.8
92
.795
.89
5.8
92
.79
5.8
92
.79
5.8
11
27
.8
Inp
uts
P+
Wm
m/m
on
th1
55
.31
47
.31
68
.51
40
.11
42
.51
32
.011
9.8
11
7.1
11
7.2
13
2.4
14
5.9
14
7.1
16
65
.3
Ou
tpu
ts
Evap
otr
ansp
irat
ion
ET
E*C
mm
/mon
th1
34
.54
10
3.8
89
1.1
44
9.5
37
.22
5.2
29
.76
52
.76
68
0.6
12
3.9
14
7.5
69
41
.98
Per
cola
tion
B(R
/7)*
Dm
m/m
on
th1
10
.71
00
.01
10
.71
07
.11
10
.71
07
.111
0.7
11
0.7
10
7.1
11
0.7
10
7.1
11
0.7
13
03
.6
Ou
tputs
ET
+B
mm
/mon
th2
45
.32
03
.92
01
.91
56
.61
47
.91
32
.314
0.5
16
3.4
17
3.1
19
1.3
23
1.0
25
8.3
22
45
.6
Sto
rage
S(P
+W
)-(E
T+
B)
mm
/mon
th-8
9.9
-56
.5-3
3.3
-16
.5-5
.4-0
.3-2
0.7
-46
.3-5
5.9
-58
.9-8
5.2
-11
1.2
Cu
mula
tive
Sto
rage
M-
mm
-89
.9-5
6.5
-33
.3-1
6.5
-5.4
-0.3
-20
.7-4
6.3
-55
.9-5
8.9
-85
.2-1
11
.2
2n
d y
ear
-89
.9-5
6.5
-33
.3-1
6.5
-5.4
-0.3
-20
.7-4
6.3
-55
.9-5
8.9
-85
.2-1
11
.2
Sto
rage
VL
arges
t M
mm
-0.3
(V*L
)/1000
m3
-3.1
Lo
t 2 i
n D
P1088704
Ma
rtin
da
le R
oa
d M
art
ind
ale

Mon
thly
Nu
trie
nt
Ba
lan
ce C
alc
ula
tio
n
Nu
trie
nt
& S
oil
Pa
ram
ate
rs
Est
imat
ed T
ota
l -
N c
on
cen
trat
ion
(m
g/L
)20
Hyd
rau
lic
Load
an
d D
isp
osa
l A
rea P
ara
met
ers
Eff
luen
t T
ota
l P
Con
cen
trat
ion
(m
g/L
)8
Des
ign w
aste
wat
er l
oad
(L
/day
)27,5
00
Des
ign A
ppli
cati
on A
rea
(m2)
8,9
00
Com
pu
ted
Para
met
ers
Eff
luen
t O
rgan
ic -
N c
on
cen
trat
ion
(m
g/L
) (1
5%
tota
l N
)3
Am
monia
N L
oad
(kg/y
ear)
137.5
1
Eff
luen
t O
xid
ised
- N
con
cen
trat
ion
(m
g/L
) (3
0%
tota
l N
)6
Org
anic
N l
oad
(kg/y
ear)
3.0
1
Org
anic
N c
onver
sion
to a
mm
on
ia (
%)
90
Oxid
ised
N l
oad
(kg/y
ear)
54.2
0
Am
monia
loss
th
rou
gh
vola
tili
sati
on
(%)
25
Eff
ecti
ve
tota
l N
load
(kg/y
ear)
194.7
3
Oxid
ised
N l
oss
th
rou
gh
den
itri
fica
tion
(%
)10
Phosp
horu
s lo
ad (
kg/y
ear)
80.3
0
Cri
tica
l T
ota
l N
itro
gen
Load
ing R
ate
(mg/m
2/d
ay)
68
Soil
phosp
horu
s so
rpti
on c
apac
ity
(kg/h
a)6090
Res
ult
s S
um
mary
Cri
tica
l P
hosp
horu
s L
oad
ing R
ate
(mg/m
2/d
ay)
7T
ota
l nit
rogen
not
assi
milat
ed (
kg/y
ear)
69
.69
Est
imat
ed S
oil
Bu
lk D
ensi
ty (
kg/m
3)
1500
Per
cent
of
nit
rogen
not
assi
milat
ed (
%)
35
Ass
um
ed P
hosp
horu
s S
orp
tion
Dep
th (
m)
0.7
0T
ota
l phosp
horu
s not
assi
milat
ed (
kg/y
ear)
67
.43
Lab
-det
erm
ined
P-S
orp
cap
acit
y (m
g P
/kg s
oil
) 580
Sit
e phosp
horu
s lo
ngev
ity (
yea
rs)
80
Month
Day
s in
Month
Gro
wth
Rat
e
Fac
tor
(0-
1)
Nit
rogen
Load
(kg/m
on
th)
Cro
p N
itro
gen
Up
tak
e
(kg/a
rea/
mon
th)
Nit
rogen
Bal
anac
e
(kg/m
onth
)
Phosp
horu
s
Load
(kg/m
onth
)
Cro
p P
hosp
horu
s
Upta
ke
(kg/a
rea/
month
)
Phosp
horu
s
Bal
ance
(kg/m
onth
)
Posi
tive
Ph
osp
horu
s
Bal
ance
(kg/m
onth
)
Jan
31
0.7
16
.54
13
.13
3.4
16.6
91.3
55.3
45.3
4
Feb
28
0.7
14
.94
11
.86
3.0
86.6
91.2
25.4
75.4
7
Mar
31
0.7
16
.54
13
.13
3.4
16.6
91.3
55.3
45.3
4
Apr
30
0.5
16
.01
9.0
86.9
36.6
90.9
35.7
65.7
6
May
31
0.5
16
.54
9.3
87.1
66.6
90.9
75.7
35.7
3
Jun
30
0.4
16
.01
7.2
68.7
46.6
90.7
55.9
45.9
4
Jul
31
0.4
16
.54
7.5
09.0
36.6
90.7
75.9
25.9
2
Aug
31
0.5
16
.54
9.3
87.1
66.6
90.9
75.7
35.7
3
Sep
30
0.5
16
.01
9.0
86.9
36.6
90.9
35.7
65.7
6
Oct
31
0.5
16
.54
9.3
87.1
66.6
90.9
75.7
35.7
3
Nov
30
0.7
16
.01
12
.71
3.3
06.6
91.3
15.3
85.3
8
Dec
31
0.7
16
.54
13
.13
3.4
16.6
91.3
55.3
45.3
4
Tota
l365
6.8
19
4.7
31
25
.03
69
.69
80.3
012.8
767.4
367.4
3
11
Eff
luen
t A
mm
on
ia -
N c
on
cen
trat
ion
(m
g/L
) (5
5%
tota
l N
)
3.4
1
69.6
9
7.1
6
6.9
3
7.1
6
3.3
0
6.9
3
7.1
6
8.7
4
9.0
3
Posi
tive
Nit
rogen
Bal
ance
(kg/m
onth
)
3.4
1
3.0
8
3.4
1
0.0
0
2.0
0
4.0
0
6.0
0
8.0
0
10
.00
12
.00
14
.00
Jan
Ma
rM
ay
Jul
Sep
Nov
Nutrient Load/Balance (kg/month)
Nitro
gen B
ala
nce
Nitro
ge
n B
ala
na
ce
(kg
/mon
th)
Cro
p N
itro
gen
Up
take (
kg
/are
a/m
on
th)
0.0
0
1.0
0
2.0
0
3.0
0
4.0
0
5.0
0
6.0
0
7.0
0
Jan
Ma
rM
ay
Jul
Sep
Nov
Nutrient Load/Balance (kg/month)
Phosphoru
s B
ala
nce
Pho
sp
ho
rus B
ala
nce
(kg
/mo
nth
)
Cro
p P
ho
sp
ho
rus U
pta
ke
(kg/a
rea
/mo
nth
)

Larry Cook Consulting 23.9.21 21073-B
APPENDIX B
SOIL TEST BORE LOGS

Job No: 21073
Hole No: BH 1
Sheet 1 of 1
LOG OF TEST HOLEClient: Greyhound Racing NSW Test Bore Location: Ref. Figure 10
Project: Wastewater Management Investigations Test Method: Hand Auger
Project Location: Lot 2 DP1088704 Easting:
Martindale Road Martindale Northing:
'Bylong Park' Logged by: LLC
Gro
undw
ate
r
Sam
ple
s/
Fie
ld T
ests
Depth
(m
)
Gra
phic
Log
Unifie
d
Cla
ssific
ation
Description
Mois
ture
Conditio
n
Consis
tency/
Rel. D
ensity
Depth
(m
)
N L TOPSOIL/COLLUVIAL
I COLLUVIAL
L B T
0.5 0.5
B T
1.0 1.0
BH 1 terminated at 1.00 m depth.
1.5 1.5
2.0 2.0
2.5 2.5
3.0 3.0
3.5 3.5
Explanatory Notes:
Consistency Density Index Samples Moisture
VS Very Soft VL Very Loose B Bulk Sample D Dry
S Soft L Loose D Disturbed Sample M Moist
F Firm MD Medium Dense U50 Undisturbed Sample W Wet
St Stiff D Dense (50mm diam.) Wp Plastic Limit
VSt Very Stiff VD Very Dense N S.P.T. Value Wl Liquid Limit
H Hard
0.10 - 1.00 Silty Sandy LOAM. Brown to red-oramge-
brown. Minor to common amounts of organic material.
Loose to semi dense and dry.
From 0.70 m, grades down into clayey moist silty sandy
loam. Sub rounded quartz pebbles and rock fragments to
15 mm.
D
M
SD
SD
Additional Comments
D
Larry Cook Consulting Pty Ltd
Coordinates
(MGA Grid)
Date: Aug 2021
0.00 - 0.10 Silty Sandy LOAM. Orange brown. Gravelly.
Abundant amounts of organic material. Loose and dry.
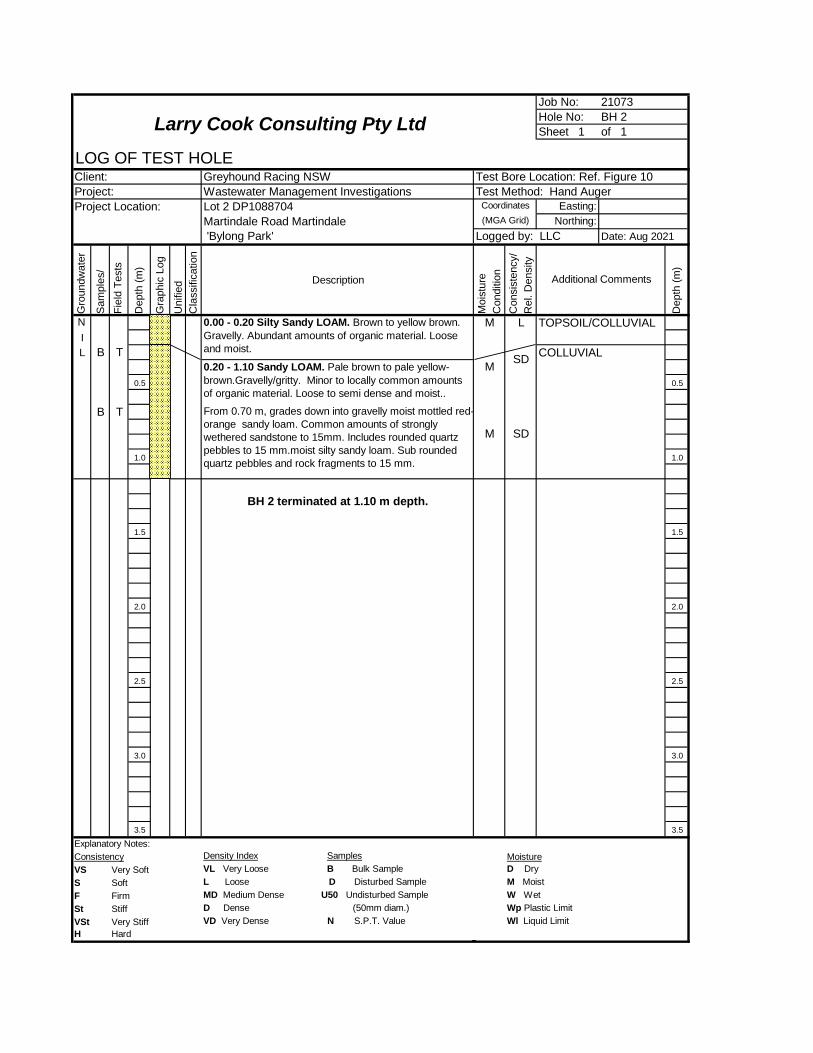
Job No: 21073
Hole No: BH 2
Sheet 1 of 1
LOG OF TEST HOLEClient: Greyhound Racing NSW Test Bore Location: Ref. Figure 10
Project: Wastewater Management Investigations Test Method: Hand Auger
Project Location: Lot 2 DP1088704 Easting:
Martindale Road Martindale Northing:
'Bylong Park' Logged by: LLC
Gro
undw
ate
r
Sam
ple
s/
Fie
ld T
ests
Depth
(m
)
Gra
phic
Log
Unifie
d
Cla
ssific
ation
Description
Mois
ture
Conditio
n
Consis
tency/
Rel. D
ensity
Depth
(m
)
N L TOPSOIL/COLLUVIAL
I
L B T COLLUVIAL
0.5 0.5
B T
1.0 1.0
BH 2 terminated at 1.10 m depth.
1.5 1.5
2.0 2.0
2.5 2.5
3.0 3.0
3.5 3.5
Explanatory Notes:
Consistency Density Index Samples Moisture
VS Very Soft VL Very Loose B Bulk Sample D Dry
S Soft L Loose D Disturbed Sample M Moist
F Firm MD Medium Dense U50 Undisturbed Sample W Wet
St Stiff D Dense (50mm diam.) Wp Plastic Limit
VSt Very Stiff VD Very Dense N S.P.T. Value Wl Liquid Limit
H Hard
0.00 - 0.20 Silty Sandy LOAM. Brown to yellow brown.
Gravelly. Abundant amounts of organic material. Loose
and moist.
From 0.70 m, grades down into gravelly moist mottled red-
orange sandy loam. Common amounts of strongly
wethered sandstone to 15mm. Includes rounded quartz
pebbles to 15 mm.moist silty sandy loam. Sub rounded
quartz pebbles and rock fragments to 15 mm.
M
M SD
Additional Comments
M
0.20 - 1.10 Sandy LOAM. Pale brown to pale yellow-
brown.Gravelly/gritty. Minor to locally common amounts
of organic material. Loose to semi dense and moist..
SD
Larry Cook Consulting Pty Ltd
Coordinates
(MGA Grid)
Date: Aug 2021
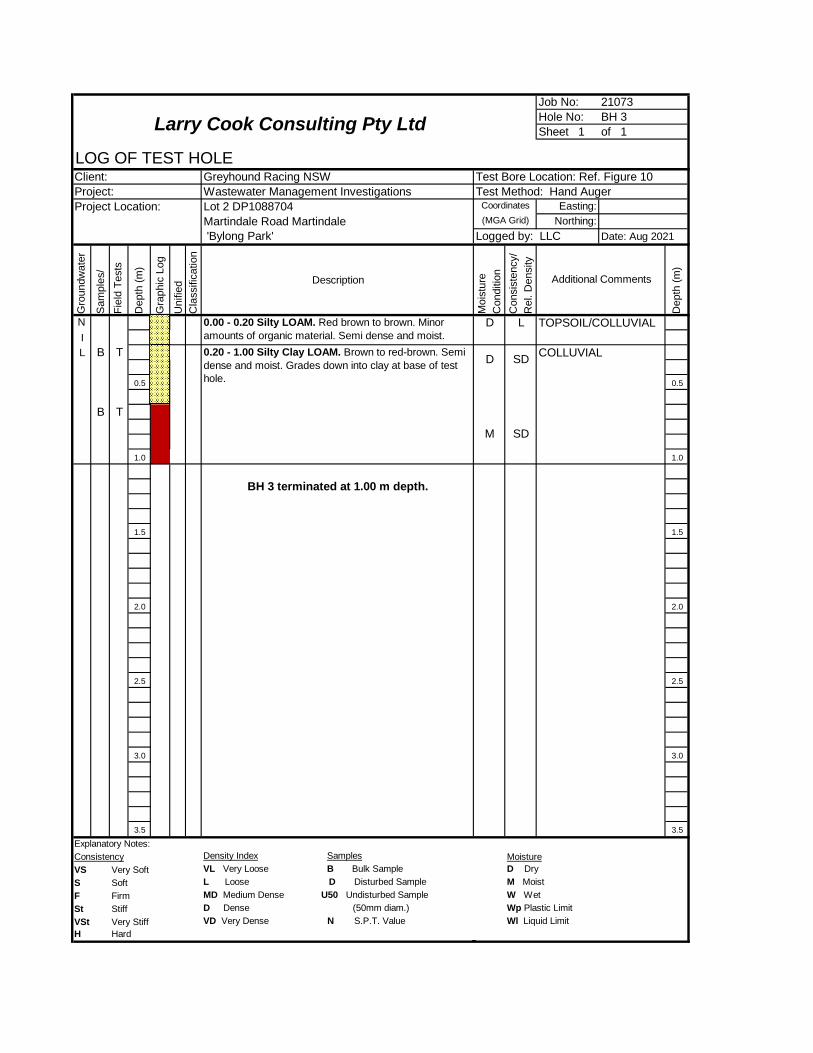
Job No: 21073
Hole No: BH 3
Sheet 1 of 1
LOG OF TEST HOLEClient: Greyhound Racing NSW Test Bore Location: Ref. Figure 10
Project: Wastewater Management Investigations Test Method: Hand Auger
Project Location: Lot 2 DP1088704 Easting:
Martindale Road Martindale Northing:
'Bylong Park' Logged by: LLC
Gro
undw
ate
r
Sam
ple
s/
Fie
ld T
ests
Depth
(m
)
Gra
phic
Log
Unifie
d
Cla
ssific
ation
Description
Mois
ture
Conditio
n
Consis
tency/
Rel. D
ensity
Depth
(m
)
N L TOPSOIL/COLLUVIAL
I
L B T COLLUVIAL
0.5 0.5
B T
1.0 1.0
BH 3 terminated at 1.00 m depth.
1.5 1.5
2.0 2.0
2.5 2.5
3.0 3.0
3.5 3.5
Explanatory Notes:
Consistency Density Index Samples Moisture
VS Very Soft VL Very Loose B Bulk Sample D Dry
S Soft L Loose D Disturbed Sample M Moist
F Firm MD Medium Dense U50 Undisturbed Sample W Wet
St Stiff D Dense (50mm diam.) Wp Plastic Limit
VSt Very Stiff VD Very Dense N S.P.T. Value Wl Liquid Limit
H Hard
M SD
Additional Comments
0.00 - 0.20 Silty LOAM. Red brown to brown. Minor
amounts of organic material. Semi dense and moist.
D
0.20 - 1.00 Silty Clay LOAM. Brown to red-brown. Semi
dense and moist. Grades down into clay at base of test
hole.
D SD
Larry Cook Consulting Pty Ltd
Coordinates
(MGA Grid)
Date: Aug 2021

Job No: 21073
Hole No: BH 4
Sheet 1 of 1
LOG OF TEST HOLEClient: Greyhound Racing NSW Test Bore Location: Ref. Figure 10
Project: Wastewater Management Investigations Test Method: Hand Auger
Project Location: Lot 2 DP1088704 Easting:
Martindale Road Martindale Northing:
'Bylong Park' Logged by: LLC
Gro
undw
ate
r
Sam
ple
s/
Fie
ld T
ests
Depth
(m
)
Gra
phic
Log
Unifie
d
Cla
ssific
ation
Description
Mois
ture
Conditio
n
Consis
tency/
Rel. D
ensity
Depth
(m
)
N L TOPSOIL/COLLUVIAL
I
L B T
0.5 0.5
B T
1.0 1.0
BH 4 terminated at 0.90 m depth.
Refusal on weathered rock?
1.5 1.5
2.0 2.0
2.5 2.5
3.0 3.0
3.5 3.5
Explanatory Notes:
Consistency Density Index Samples Moisture
VS Very Soft VL Very Loose B Bulk Sample D Dry
S Soft L Loose D Disturbed Sample M Moist
F Firm MD Medium Dense U50 Undisturbed Sample W Wet
St Stiff D Dense (50mm diam.) Wp Plastic Limit
VSt Very Stiff VD Very Dense N S.P.T. Value Wl Liquid Limit
H Hard
0.50 - 0.90 Sandy Clayey LOAM. Yellow brown to
yellow. Gritty and gravelly. Rounded rock fragments to 5
mm. Mottled orange. Semi dense and moist. .
COLLUVIAL
COLLUVIAL
M SD
Additional Comments
0.00 - 0.20 Silty Sandy LOAM. Brown to grey brown.
Abundant amounts of organic material. Dry and loose.
D
0.20 - 0.50 Sandy LOAM. Grey to pale brown. Gritty.
Rounded quartz pebbles to 25 mm. Minor amounts of
organic material. Semi dense and moist. Wet at base of
interval.
M SD
Larry Cook Consulting Pty Ltd
Coordinates
(MGA Grid)
Date: Aug 2021

Job No: 21073
Hole No: BH 5
Sheet 1 of 1
LOG OF TEST HOLEClient: Greyhound Racing NSW Test Bore Location: Ref. Figure 10
Project: Wastewater Management Investigations Test Method: Hand Auger
Project Location: Lot 2 DP1088704 Easting:
Martindale Road Martindale Northing:
'Bylong Park' Logged by: LLC
Gro
undw
ate
r
Sam
ple
s/
Fie
ld T
ests
Depth
(m
)
Gra
phic
Log
Unifie
d
Cla
ssific
ation
Description
Mois
ture
Conditio
n
Consis
tency/
Rel. D
ensity
Depth
(m
)
N L TOPSOIL/COLLUVIAL
I
L B T COLLUVIAL
0.5 0.5
B T
COLLUVIAL
1.0 1.0
BH 5 terminated at 0.90 m depth.
Refusal on clay
1.5 1.5
2.0 2.0
2.5 2.5
3.0 3.0
3.5 3.5
Explanatory Notes:
Consistency Density Index Samples Moisture
VS Very Soft VL Very Loose B Bulk Sample D Dry
S Soft L Loose D Disturbed Sample M Moist
F Firm MD Medium Dense U50 Undisturbed Sample W Wet
St Stiff D Dense (50mm diam.) Wp Plastic Limit
VSt Very Stiff VD Very Dense N S.P.T. Value Wl Liquid Limit
H Hard
0.20 - 0.70 Sandy LOAM. Grey to pale brown. Gritty.
Minor amounts of organic material. Semi dense and
moist. Wet at base of interval. Yellow patches below 0.50
m depth.
0.70 - 0.90 Sandy Clay LOAM. Orange-red and patchy
yellow. Gritty and gravelly. Grades down into clay.
Rounded quartz pebbles to 15mm. Semi dense and
moist. .
M SD
Additional Comments
0.00 - 0.20 Silty Sandy LOAM. Brown. Abundant
amounts of organic material. Gritty. Dry and loose.
D
M SD
Larry Cook Consulting Pty Ltd
Coordinates
(MGA Grid)
Date: Aug 2021

Job No: 21073
Hole No: BH 6
Sheet 1 of 1
LOG OF TEST HOLEClient: Greyhound Racing NSW Test Bore Location: Ref. Figure 10
Project: Wastewater Management Investigations Test Method: Hand Auger
Project Location: Lot 2 DP1088704 Easting:
Martindale Road Martindale Northing:
'Bylong Park' Logged by: LLC
Gro
undw
ate
r
Sam
ple
s/
Fie
ld T
ests
Depth
(m
)
Gra
phic
Log
Unifie
d
Cla
ssific
ation
Description
Mois
ture
Conditio
n
Consis
tency/
Rel. D
ensity
Depth
(m
)
N L TOPSOIL/COLLUVIAL
I
L B T COLLUVIAL
0.5 0.5
B T
1.0 1.0
BH 6 terminated at 1.00 m depth.
Refusal on clay
1.5 1.5
2.0 2.0
2.5 2.5
3.0 3.0
3.5 3.5
Explanatory Notes:
Consistency Density Index Samples Moisture
VS Very Soft VL Very Loose B Bulk Sample D Dry
S Soft L Loose D Disturbed Sample M Moist
F Firm MD Medium Dense U50 Undisturbed Sample W Wet
St Stiff D Dense (50mm diam.) Wp Plastic Limit
VSt Very Stiff VD Very Dense N S.P.T. Value Wl Liquid Limit
H Hard
COLLUVIAL0.70 - 1.00 Sandy Clay LOAM. Orange-red and patchy
yellow. Gritty and gravelly. Grades down into clay.
Rounded quartz pebbles to 15mm. Semi dense and
moist. .
M SD
Additional Comments
0.00 - 0.20 Silty Sandy LOAM. Brown. Abundant
amounts of organic material. Gritty. Dry and loose.
D
0.20 - 0.70 Sandy LOAM. Grey to pale brown. Gritty.
Minor amounts of organic material. Semi dense and
moist. Wet at base of interval. Yellow patches below 0.50
m depth.
M SD
Larry Cook Consulting Pty Ltd
Coordinates
(MGA Grid)
Date: Aug 2021

Larry Cook Consulting 23.9.21 21073-B
APPENDIX C
Specifications ultraWELL 1000 pump well

560
560
1420
300
RIS
ER
1150
O
1280
O
600
O
118_
1510
�1.1
1/03
/201
2
Rem
ovab
le L
id
Ris
er
Inle
t
Ove
rflo
w
Pum
p ou
tlet
Pum
pFlo
at S
witc
h
300m
m s
how
n, 1
00m
man
d 20
0mm
als
o av
aila
ble
at ti
me
of o
rder
ing
425
±50
ultr
aWE
LL 1
000
pum
pwel
l

Larry Cook Consulting 23.9.21 21073-B
FIGURES

Scale: As shown
FIGURE 1
Larry Cook Consulting
PO Box 8146
Tumbi Umbi NSW 2261
Phone 02 4340 0193
Property Boundary
Wastewater Management Plan
Lot 2 in DP1088704
Martindale Road Martindale
Lot Plan
Nm 5000
Lot 2

NS
cale
: A
s sh
ow
nL
arr
y C
ook C
on
sult
ing
PO
Box 8
146
Tu
mb
iU
mb
iN
SW
2261
Ph
on
e 0
2 4
340 0
193
FIG
UR
E 2
Wast
ewate
r M
an
agem
ent
Pla
nL
ot
2 in
DP
1088704
Marti
nd
ale
Road
Marti
nd
ale
Topogra
phic
Pla
n
Nkm
10

Scale: As shown
FIGURE 3
Larry Cook Consulting
PO Box 8146
Tumbi Umbi NSW 2261
Phone 02 4340 0193
Property Boundary
Wastewater Management Plan
Lot 2 in DP1088704
Martindale Road Martindale
Enlarged Topographic Plan
Nm 5000

Scale: As shown
FIGURE 4
Larry Cook Consulting
PO Box 8146
Tumbi Umbi NSW 2261
Phone 02 4340 0193
Property Boundary
Wastewater Management Plan
Lot 2 in DP1088704
Martindale Road Martindale
Site Plan
Nm 2000
Pods

Scale: As shown
FIGURE 5
Larry Cook Consulting
PO Box 8146
Tumbi Umbi NSW 2261
Phone 02 4340 0193
Wastewater Management Plan
Lot 2 in DP1088704
Martindale Road Martindale
Aerial Photo Showing Existing Conditions
Nm 2000
Proposed
PodsCottages and
machinery sheds
with proximal
septic tanks
Dam
Dam
Available Areas for Wastewater Disposal

Scale: As shown
FIGURE 6
Larry Cook Consulting
PO Box 8146
Tumbi Umbi NSW 2261
Phone 02 4340 0193
Property Boundary
Wastewater Management Plan
Lot 2 in DP1088704
Martindale Road Martindale
Key Elements of Development
Nm 2000After Warren Smith Consulting (2021)

Scale: As shown
FIGURE 7
Larry Cook Consulting
PO Box 8146
Tumbi Umbi NSW 2261
Phone 02 4340 0193
Property Boundary
Wastewater Management Plan
Lot 2 in DP1088704
Martindale Road Martindale
Farmstead Plan
Nm 200After Warren Smith Consulting (2021)

Scale: As shown
FIGURE 8
Larry Cook Consulting
PO Box 8146
Tumbi Umbi NSW 2261
Phone 02 4340 0193
Property Boundary
Wastewater Management Plan
Lot 2 in DP1088704
Martindale Road Martindale
Enlarged Farmstead Plan
Nm 200After Warren Smith Consulting (2021)

Scale: As shown
FIGURE 9
Larry Cook Consulting
PO Box 8146
Tumbi Umbi NSW 2261
Phone 02 4340 0193
Wastewater Management Plan
Lot 2 in DP1088704
Martindale Road Martindale
Geology Plan
Nkm 50
Rn
Psl
Qa
Rn
Psl
Psl
Psl
Qa
Qa Quaternary Alluvium
Rn Narrabeen Group
Psl Wollombi Coal Measures
Lot 2
Qa
Qa
Psl

Scale: As shown
FIGURE 10
Larry Cook Consulting
PO Box 8146
Tumbi Umbi NSW 2261
Phone 02 4340 0193
Wastewater Management Plan
Lot 2 in DP1088704
Martindale Road Martindale
Locations Soil Test Holes
Nm 2000BH 1Soil Test Hole
BH 1BH 2
BH 3
BH 4BH 6
BH 5
Proposed
Pods

NS
cale
: A
s sh
ow
nL
arr
y C
ook C
on
sult
ing
PO
Box 8
146
Tu
mb
iU
mb
iN
SW
2261
Ph
on
e 0
2 4
340 0
193
FIG
UR
E 1
1
Wast
ewate
r M
an
agem
ent
Pla
nL
ot
2 in
DP
1088704
Marti
nd
ale
Road
Marti
nd
ale
Typic
al A
nae
robic
Baf
fled
Rea
ctor

Scale: As shown
FIGURE 12
Larry Cook Consulting
PO Box 8146
Tumbi Umbi NSW 2261
Phone 02 4340 0193
Wastewater Management Plan
Lot 2 in DP1088704
Martindale Road Martindale
Locations Available Disposal Areas
Nm 2000
61,300 m2
73,400 m2
Cottages and
machinery sheds
Dam
Dam
Available Areas for Wastewater Disposal
Proposed
Pods

Scale: As shown
FIGURE 13
Larry Cook Consulting
PO Box 8146
Tumbi Umbi NSW 2261
Phone 02 4340 0193
Property Boundary
Wastewater Management Plan
Lot 2 in DP1088704
Martindale Road Martindale
Location Proposed Land Application Area
Nm 2000
9,000 m2
Proposed Area for Wastewater Disposal
Pods

Scale: As shown
FIGURE 14
Larry Cook Consulting
PO Box 8146
Tumbi Umbi NSW 2261
Phone 02 4340 0193
Wastewater Management Plan
Lot 2 in DP1088704
Martindale Road Martindale
Aerial Photo - Proposed Land Application Area
Nm 2000
Proposed Area for Wastewater Disposal
Note: Proposed area compiles with guideline buffer setback distances
9,000 m2
Proposed
Pods