larsenandtoubro-130914065740-phpapp01
TRANSCRIPT

8/13/2019 larsenandtoubro-130914065740-phpapp01
http://slidepdf.com/reader/full/larsenandtoubro-130914065740-phpapp01 1/64
PRESENTED BY :
• ROHIT VERMA 111268
• SHUBHI JAIN 111338
• SHUBHAM DWIVEDEE 111339
• ANKIT SAHA 1113401

8/13/2019 larsenandtoubro-130914065740-phpapp01
http://slidepdf.com/reader/full/larsenandtoubro-130914065740-phpapp01 2/64
2

8/13/2019 larsenandtoubro-130914065740-phpapp01
http://slidepdf.com/reader/full/larsenandtoubro-130914065740-phpapp01 3/64
3
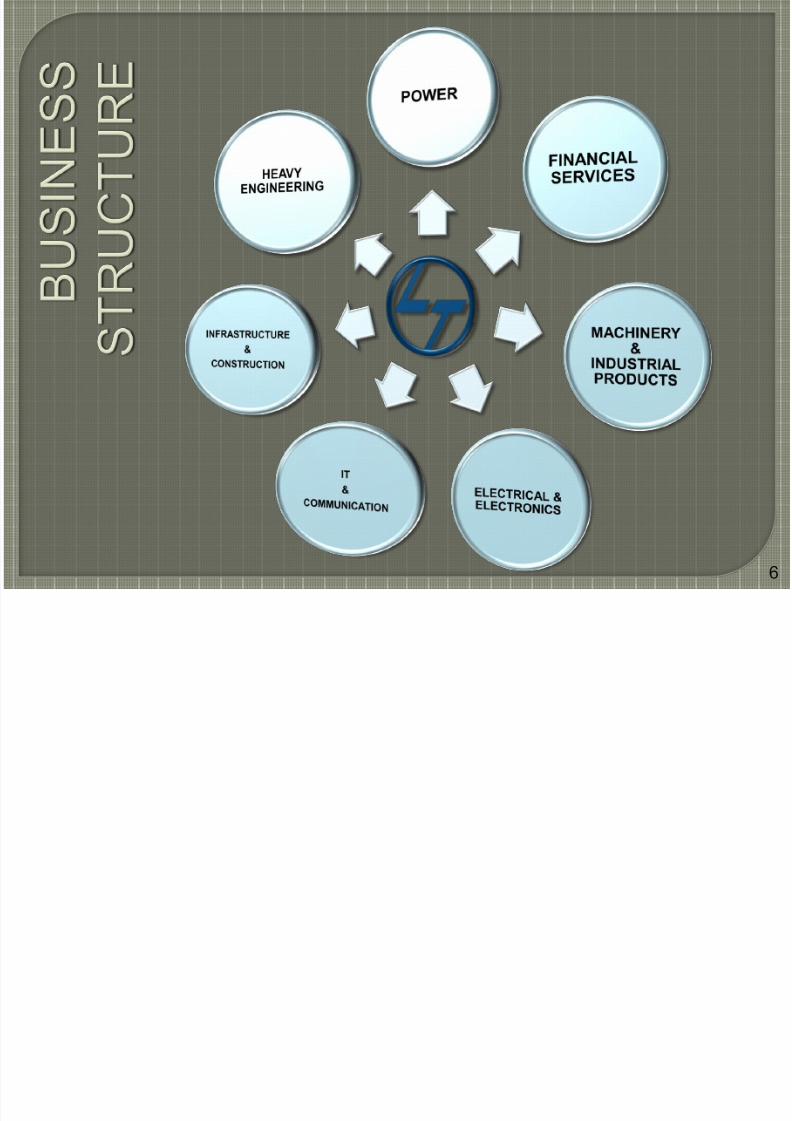
Larsen & Toubro Limited (L&T) is amongst one of the India’s largest technology,
engineering construction and manufacturing conglomerate.
• L&T is considered to be the "bellwether of India's engineering sector“, and wasrecognized as the company of the year in 2010.
• L&T’s business structure has a dominant presence in India's infrastructure,power, hydrocarbon, machinery, shipbuilding and railwaysectors.
• L&T has an international presence. The company's businesses are supported by
a wide marketing and distribution network, and have established a reputation forstrong customer support.
• With more than a seven decades of dedicated customer-focused service andcontinuous quest for world class quality have established them as the leader of theE&C sector in India.

8/13/2019 larsenandtoubro-130914065740-phpapp01
http://slidepdf.com/reader/full/larsenandtoubro-130914065740-phpapp01 4/64
4
The evolution of L&T into the country's largest engineering and constructionorganization is among the most remarkable success stories in Indian industry.
• L&T was founded in Bombay (Mumbai) in 1938 by two Danish engineers,Henning Holck-Larsen and Soren Kristian Toubro. Both of them were strongly
committed to developing India's engineering capabilities to meet thedemands of industry.
• In the year 1950, L&T became a Public Company with a paid-up capital of Rs.2million and a sales turnover of Rs.10.9 million that year. And now, In 2012 the company generated a total revenue of US $13.5 billion.

8/13/2019 larsenandtoubro-130914065740-phpapp01
http://slidepdf.com/reader/full/larsenandtoubro-130914065740-phpapp01 5/64
5
8/13/2019 larsenandtoubro-130914065740-phpapp01
http://slidepdf.com/reader/full/larsenandtoubro-130914065740-phpapp01 6/64
6

8/13/2019 larsenandtoubro-130914065740-phpapp01
http://slidepdf.com/reader/full/larsenandtoubro-130914065740-phpapp01 7/647

8/13/2019 larsenandtoubro-130914065740-phpapp01
http://slidepdf.com/reader/full/larsenandtoubro-130914065740-phpapp01 8/648
RATIO ANALYSIS
LIQUIDITYRATIOS
LEVERAGERATIOS
TURNOVERRATIOS
PROFITABILITYRATIOS
VALUATIONRATIOS

8/13/2019 larsenandtoubro-130914065740-phpapp01
http://slidepdf.com/reader/full/larsenandtoubro-130914065740-phpapp01 9/64
Current Ratio
Quick Ratio
Can they meettheir currentobligations??
9

8/13/2019 larsenandtoubro-130914065740-phpapp01
http://slidepdf.com/reader/full/larsenandtoubro-130914065740-phpapp01 10/64
0.00
0.20
0.40
0.60
0.80
1.00
1.20
1.40
2006 2007 2008 2009 2010 2011
CR
CR
It is a measure of the firm’s short term solvency i.e., it indicates the availabilityof current assets in rupees for every one rupee of current liability. It representsa margin of safety for the creditors of the firm.
CR
(times)
YEAR
1.10 2006
1.03 2007
0.92 2008
1.18 2009
1.02 2010
1.02 2011 10

8/13/2019 larsenandtoubro-130914065740-phpapp01
http://slidepdf.com/reader/full/larsenandtoubro-130914065740-phpapp01 11/64
0.00
0.10
0.20
0.30
0.40
0.50
0.60
0.70
0.80
0.90
2006 2007 2008 2009 2010 2011
QR
QR
Quick Ratio a.k.a. Acid-Test Ratio establishes relationship between quickassets and current liabilities, where quick assets refer to those assets whichcan be converted into cash immediately or reasonably soon without loss ofvalue.
QR
(times)
YEAR
0.79 2006
0.71 2007
0.61 2008
0.86 2009
0.69 2010
0.60 2011 11

8/13/2019 larsenandtoubro-130914065740-phpapp01
http://slidepdf.com/reader/full/larsenandtoubro-130914065740-phpapp01 12/6412
Liquidity refers to the readiness of assets to be converted to cash. They givea general idea of the firm's ability to pay its short-term debts.
Ideally the current ratio should be greater than 1.5. Though there can beexceptions, some good companies can have less than 1 or even a negativecurrent ratio when they receive money faster from their customers than theyhave to pay to their vendors.
So, we can say that L&T will not be able to meet its current obligations as long
as they do not use their inventories efficiently as its inventories form a large partof their current assets.
ANALYSIS: (LIQUDITY RATIOS)

8/13/2019 larsenandtoubro-130914065740-phpapp01
http://slidepdf.com/reader/full/larsenandtoubro-130914065740-phpapp01 13/64
Financial
LeverageRatios
• Debt Ratio• Debt-Equity Ratio
• Debt-Asset Ratio
CoverageRatios
• Interest CoverageRatio
13
What debt-equity mix dothey prefer ??

8/13/2019 larsenandtoubro-130914065740-phpapp01
http://slidepdf.com/reader/full/larsenandtoubro-130914065740-phpapp01 14/64
DR
(times)
YEAR
15.88 2006
17.91 2007
22.63 200825.67 2009
23.53 2010
19.33 2011 1414
0.00
5.00
10.00
15.00
20.00
25.00
30.00
2006 2007 2008 2009 2010 2011
DR
DR
It tells us about the proportion of the interest-bearing debt in the capitalstructure of the firm. Total debt will include short & long-term borrowings fromfinancial institutions, debentures/bonds, deferred payment arrangements , bankborrowings, public deposits, etc.
DEBT RATIO

8/13/2019 larsenandtoubro-130914065740-phpapp01
http://slidepdf.com/reader/full/larsenandtoubro-130914065740-phpapp01 15/64
8/13/2019 larsenandtoubro-130914065740-phpapp01
http://slidepdf.com/reader/full/larsenandtoubro-130914065740-phpapp01 16/64
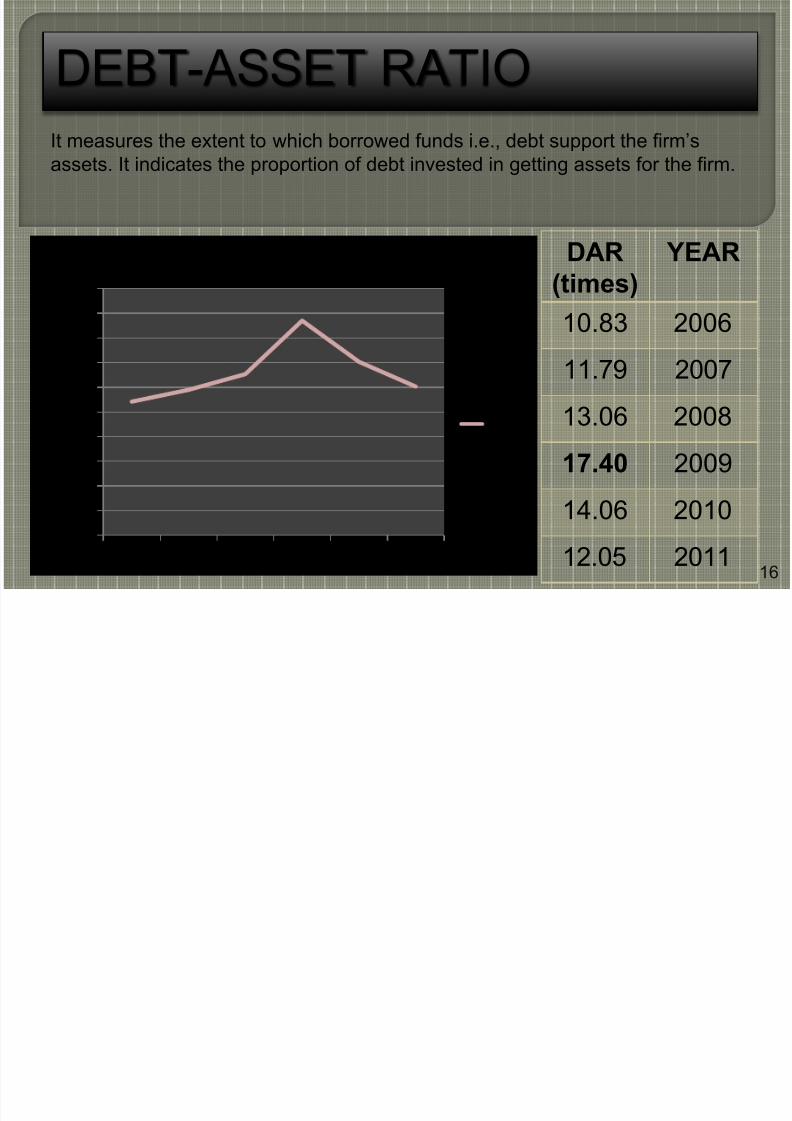
DAR
(times)
YEAR
10.83 2006
11.79 2007
13.06 2008
17.40 2009
14.06 2010
12.05 2011 16
0.00
2.00
4.00
6.00
8.0010.00
12.00
14.00
16.00
18.00
20.00
2006 2007 2008 2009 2010 2011
DAR
DAR
DEBT-ASSET RATIO
It measures the extent to which borrowed funds i.e., debt support the firm’sassets. It indicates the proportion of debt invested in getting assets for the firm.

8/13/2019 larsenandtoubro-130914065740-phpapp01
http://slidepdf.com/reader/full/larsenandtoubro-130914065740-phpapp01 17/64
17
ANALYSIS: (FINANCIAL LEVERAGES)
Financial leverage indicates the reliability of a business on its debts in order tooperate.
Lower value of debt ratio is favorable and a higher value indicates that higherportion of company's assets are claimed by it creditors which means higher riskin operation.
In case debt ratio is less than 0.5.This indicates that company’s assets are
financed through equity and less of debt, lower values of debt-to-equity ratio are
favorable indicating less risk. Thus, the company is less riskier.
L&T has low proportion of debt in its capital structure and thus the assetssupported by them and cost of debt against a rupee of equity show a similartrend.

8/13/2019 larsenandtoubro-130914065740-phpapp01
http://slidepdf.com/reader/full/larsenandtoubro-130914065740-phpapp01 18/64
ICR
(times)
YEAR
12.47 2006
24.29 2007
28.63 200812.94 2009
13.47 2010
10.90 2011 18
0.00
5.00
10.00
15.00
20.00
25.00
30.00
35.00
2006 2007 2008 2009 2010 2011
ICR
ICR
INTEREST COVERAGE
RATIOICR a.k.a. times-interest-earned is used to test the firm’s debt servicing
capacity. It shows the number of times the interest charges are covered byfunds that are ordinarily available for their payment.
8/13/2019 larsenandtoubro-130914065740-phpapp01
http://slidepdf.com/reader/full/larsenandtoubro-130914065740-phpapp01 19/64
19
ANALYSIS: (COVERAGE RATIOS)
The higher the coverage ratios the less a company is burdened by debt. If acompany has no debt or the loan interest is being paid by interest income frominvestments or other activities the ratio is zero which of course is excellent.
A negative ratio tells us that the company cannot even pay its interest on loansfrom its operating income, stay far away from such companies.
In case of L&T the ratios are comparatively moderate.

8/13/2019 larsenandtoubro-130914065740-phpapp01
http://slidepdf.com/reader/full/larsenandtoubro-130914065740-phpapp01 20/64
Inventory Turnover Ratio
Debtors Turnover Ratio
Average Collection Period Asset Turnover Ratios
• Days of Inventory Holding
• Total Assets Turnover Ratio20
What do theturnoversdepict??

8/13/2019 larsenandtoubro-130914065740-phpapp01
http://slidepdf.com/reader/full/larsenandtoubro-130914065740-phpapp01 21/64
ITR
(times)
YEAR
6.80 2006
5.99 2007
5.88 20085.92 2009
4.84 2010
3.54 2011 21
0.00
1.00
2.00
3.00
4.00
5.00
6.00
7.008.00
2006 2007 2008 2009 2010 2011
ITR
ITR
INVENTORY TURNOVER
RATIOIt indicates the efficiency of the firm in producing and selling its product. Itshows how rapidly the inventory is turning into receivables through sales.

8/13/2019 larsenandtoubro-130914065740-phpapp01
http://slidepdf.com/reader/full/larsenandtoubro-130914065740-phpapp01 22/64
DIH
(days)
YEAR
53 2006
60 2007
61 200861 2009
74 2010
102 2011 22
0.00
10.00
20.00
30.0040.00
50.00
60.00
70.00
80.00
2006 2007 2008 2009 2010 2011
DIH
DIH
Days of Inventory Holding
It gives us an idea of the stock management of the company.

8/13/2019 larsenandtoubro-130914065740-phpapp01
http://slidepdf.com/reader/full/larsenandtoubro-130914065740-phpapp01 23/64
DTR
(times)
YEAR
2.98 2006
2.61 2007
1.96 20081.11 2009
1.05 2010
0.93 2011 23
0.00
0.50
1.00
1.50
2.00
2.50
3.00
3.50
2006 2007 2008 2009 2010 2011
DTR
DTR
DEBTORS TURNOVER
RATIOThe debtors turnover ratio is the is the relationship between net sales andaverage debtors. It is also called account receivable turnover ratio because wedebtor and bill receivables' total is used for calculation.

8/13/2019 larsenandtoubro-130914065740-phpapp01
http://slidepdf.com/reader/full/larsenandtoubro-130914065740-phpapp01 24/64
ACP
(months)
YEAR
4.02 2006
4.59 2007
6.11 200810.84 2009
11.38 2010
12.91 2011 24
0.00
2.00
4.00
6.00
8.00
10.00
12.00
14.00
2006 2007 2008 2009 2010 2011
ACP
ACP
AVERAGE COLLECTION
PERIODThe average collection period is the ratio of the number of days in a period andthe inventory turnover ratio.

8/13/2019 larsenandtoubro-130914065740-phpapp01
http://slidepdf.com/reader/full/larsenandtoubro-130914065740-phpapp01 25/64
ATR
(times)
YEAR
1.12 2006
0.85 2007
0.55 20080.40 2009
0.31 2010
0.25 2011 25
0.00
0.20
0.40
0.60
0.80
1.00
1.20
2006 2007 2008 2009 2010 2011
ATR
ATR
ASSET TURNOVER RATIO
The asset turnover ratio is the measure of the ability of a company or a firm touse its assets efficiently in order to generate sales.

8/13/2019 larsenandtoubro-130914065740-phpapp01
http://slidepdf.com/reader/full/larsenandtoubro-130914065740-phpapp01 26/64
26
ANALYSIS: (TURNOVER RATIOS)
A low turnover implies poor sales and, therefore, excess inventory. A highratio implies either strong sales or ineffective buying. From the year 2006 to2008 the ratio is high but for the latter part the ratio is low.
Debtors turnover indicates the velocity of debt collection of a firm.Lower debtor turnover ratio is bad because it means, slowly, money isbeing collected and liquidity position will become weak.
Companies with low profit margins tend to have high asset turnover, whilethose with high profit margins have low asset turnover. Thus, the companyhas high profit margins.

8/13/2019 larsenandtoubro-130914065740-phpapp01
http://slidepdf.com/reader/full/larsenandtoubro-130914065740-phpapp01 27/64
• Gross Profit Margin Ratio• Net Profit Margin Ratio• Expenses Ratio
ProfitMarginRatios
• Return on Investment
• Return on Equity• Earnings per Share• Dividend per Share• Dividend-Payout Ratio
Rate ofReturnRatios
• Operating Expenses Ratio
27
How are theprofitsshaping up?

8/13/2019 larsenandtoubro-130914065740-phpapp01
http://slidepdf.com/reader/full/larsenandtoubro-130914065740-phpapp01 28/64
GPM
(%)
YEAR
9.20 2006
11.15 2007
12.56 200813.56 2009
15.76 2010
13.13 2011 28
0.00
2.00
4.00
6.008.00
10.00
12.00
14.00
16.00
18.00
2006 2007 2008 2009 2010 2011
GPM
GPM
GROSS PROFIT MARGIN
RATIOThe gross profit margin reflects the efficiency with which managementproduces each unit of product. It implies how cost efficiently a firm can produceits goods.

8/13/2019 larsenandtoubro-130914065740-phpapp01
http://slidepdf.com/reader/full/larsenandtoubro-130914065740-phpapp01 29/64
NPM
(%)
YEAR
6.73 2006
7.80 2007
8.59 200810.13 2009
11.70 2010
8.93 2011 29
0.00
2.00
4.00
6.00
8.00
10.00
12.00
14.00
2006 2007 2008 2009 2010 2011
NPM
NPM
NET PROFIT MARGIN RATIO
It establishes a relationship between net profit and sales and indicates the firmsefficiency in manufacturing, administering and selling its products.

8/13/2019 larsenandtoubro-130914065740-phpapp01
http://slidepdf.com/reader/full/larsenandtoubro-130914065740-phpapp01 30/64
OER
(%)
YEAR
90.44 2006
89.98 2007
91.21 200887.88 2009
85.57 2010
87.70 201130
82.0083.0084.0085.0086.00
87.0088.0089.0090.0091.0092.00
2006 2007 2008 2009 2010 2011
OER
OER
OPERATING EXPENSES
RATIOIt indicates the operating expenses incurred by the company in its productionand working.

8/13/2019 larsenandtoubro-130914065740-phpapp01
http://slidepdf.com/reader/full/larsenandtoubro-130914065740-phpapp01 31/64
31
ANALYSIS: (PROFIT MARGIN RATIOS)
Since the profitability ratios are high, it indicates that the company has anefficient management.
It also indicates that the cost of goods sold remains constant and there is anincrease in the proportionate volume of higher margin items.
The company has increasing profits till the year 2010 after which there is aslight depreciation which can be a result of the global economic slowdown.

8/13/2019 larsenandtoubro-130914065740-phpapp01
http://slidepdf.com/reader/full/larsenandtoubro-130914065740-phpapp01 32/64
32
ROI
ROTA RONA
Return on Investment

8/13/2019 larsenandtoubro-130914065740-phpapp01
http://slidepdf.com/reader/full/larsenandtoubro-130914065740-phpapp01 33/64
ROTA
(%)
YEAR
7.54 2006
7.95 2007
7.92 20089.24 2009
9.04 2010
6.66 2011 33
0.00
2.00
4.00
6.00
8.00
10.00
2006 2007 2008 2009 2010 2011
ROTA
ROTA
Return on Total Assets
ROTA tells us about the how effectively the investment in the firm i.e., pool offunds supplied by shareholders and lenders is being used in terms of totalassets.

8/13/2019 larsenandtoubro-130914065740-phpapp01
http://slidepdf.com/reader/full/larsenandtoubro-130914065740-phpapp01 34/64
RONA
(%)
YEAR
76.73 2006
79.97 2007
74.53 200884.62 2009
79.67 2010
59.56 2011 34
0.00
10.00
20.00
30.00
40.00
50.00
60.00
70.00
80.00
90.00
2006 2007 2008 2009 2010 2011
RONA
RONA
Return on Net Assets
RONA tells us about the how effectively the investment in the firm i.e., pool offunds supplied by shareholders and lenders is being used in terms of netassets.

8/13/2019 larsenandtoubro-130914065740-phpapp01
http://slidepdf.com/reader/full/larsenandtoubro-130914065740-phpapp01 35/64
ROE
(%)
YEAR
22.04 2006
24.47 2007
22.81 200828.00 2009
23.92 2010
18.13 2011 35
0.00
5.00
10.00
15.00
20.00
25.00
30.00
2006 2007 2008 2009 2010 2011
ROE
ROE
Return on Equity
ROE indicates how well the firm has used the resources of owners. It iscalculated to see the profitability of owner’s investment in the firm.

8/13/2019 larsenandtoubro-130914065740-phpapp01
http://slidepdf.com/reader/full/larsenandtoubro-130914065740-phpapp01 36/64

8/13/2019 larsenandtoubro-130914065740-phpapp01
http://slidepdf.com/reader/full/larsenandtoubro-130914065740-phpapp01 37/64
EPS
(Rs.)
YEAR
7.36 2006
4.95 2007
7.43 20085.94 2009
7.27 2010
6.50 2011 37
0.00
1.00
2.00
3.004.00
5.00
6.00
7.008.00
2006 2007 2008 2009 2010 2011
EPS
EPS
Earnings Per Share
This is the amount of income that the common stockholders are entitled toreceive (per share of stock owned). This income may be paid out in theform of dividends, retained and reinvested by the company, or acombination of both.

8/13/2019 larsenandtoubro-130914065740-phpapp01
http://slidepdf.com/reader/full/larsenandtoubro-130914065740-phpapp01 38/64
DPS
(Rs.)
YEAR
1.17 2006
0.66 2007
0.63 20080.57 2009
0.64 2010
0.65 2011 38
0.00
0.20
0.40
0.60
0.80
1.00
1.20
1.40
2006 2007 2008 2009 2010 2011
DPS
DPS
Dividend Per Share
Dividend per share (DPS) is the total dividends paid out over an entire year(including interim dividends but not including special dividends) divided bythe number of outstanding ordinary shares issued.

8/13/2019 larsenandtoubro-130914065740-phpapp01
http://slidepdf.com/reader/full/larsenandtoubro-130914065740-phpapp01 39/64
DPR YEAR
0.16 2006
0.13 2007
0.09 2008
0.10 2009
0.09 2010
0.19 2011 39
0.00
0.02
0.04
0.06
0.08
0.10
0.12
0.14
0.16
0.180.20
2006 2007 2008 2009 2010 2011
DPR
DPR
Dividend-Payout Ratio
The percentage of earnings paid to shareholders in dividends.

8/13/2019 larsenandtoubro-130914065740-phpapp01
http://slidepdf.com/reader/full/larsenandtoubro-130914065740-phpapp01 40/64
40
ANALYSIS: (EPS, DPS, D/P)
Having a growing in the dividend per share can be a sign that thecompany's management believes that the growth can be sustained.
More mature companies tend to have a higher payout ratio. A stabledividend payout ratio indicates a solid dividend policy by the company's
board of directors. Thus, the company is stable.

8/13/2019 larsenandtoubro-130914065740-phpapp01
http://slidepdf.com/reader/full/larsenandtoubro-130914065740-phpapp01 41/64

8/13/2019 larsenandtoubro-130914065740-phpapp01
http://slidepdf.com/reader/full/larsenandtoubro-130914065740-phpapp01 42/64
0.00
1.00
2.00
3.00
4.00
5.00
6.00
2006 2007 2008 2009 2010 2011
PER
PER
PER
(times)
YEAR
4.54 2006
4.09 2007
4.39 20083.57 2009
4.18 2010
5.51 2011 42
The P/E ratio reflects the price currently being paid by the marketfor each rupee of currently reported EPS. It is widely used by thesecurity analysts to analyze the firm’s performance as expected by the
investors.

8/13/2019 larsenandtoubro-130914065740-phpapp01
http://slidepdf.com/reader/full/larsenandtoubro-130914065740-phpapp01 43/64
43
ANALYSIS: (VALUATION RATIOS)
Valuation ratio measures different ways of looking at the relative value of acompany's stock.
A high P/E ratio may signify that the company is overvalued, which means thateventually market forces will drive the price down.
On the other hand, a high P/E could indicate great earning power and thepossibility that profitability will increase over time, justifying the higher price.Thus, the company has high earning power.

8/13/2019 larsenandtoubro-130914065740-phpapp01
http://slidepdf.com/reader/full/larsenandtoubro-130914065740-phpapp01 44/64
44

8/13/2019 larsenandtoubro-130914065740-phpapp01
http://slidepdf.com/reader/full/larsenandtoubro-130914065740-phpapp01 45/64

8/13/2019 larsenandtoubro-130914065740-phpapp01
http://slidepdf.com/reader/full/larsenandtoubro-130914065740-phpapp01 46/64

8/13/2019 larsenandtoubro-130914065740-phpapp01
http://slidepdf.com/reader/full/larsenandtoubro-130914065740-phpapp01 47/64
47
YEAR 2006 2007 2008 2009 2010 2011
Net Worth 100 124.88 207.59 270.98 398.54 475.59
Borrowings 100 142.94 246.56 451.03 467.87 492.66
Current Liabilities
&
Provisions
100 134.56 197.35 256.02 321.25 419.86
Deferred Tax Liability 100 97.66 116.46 207.43 185.55 262.04
Total Liabilities 100 131.35 204.38 280.70 360.38 442.89

8/13/2019 larsenandtoubro-130914065740-phpapp01
http://slidepdf.com/reader/full/larsenandtoubro-130914065740-phpapp01 48/64
48
YEAR 2006 2007 2008 2009 2010 2011
Sales 100 118.54 166.33 232.65 252.95 293.39
EBDITA 100 138.76 215.74 330.43 418.04 433.48
EBDTA 100 144.65 226.36 331.48 420.74 428.03
EBT 100 144.92 229.95 336.89 426.13 420.56
PAT 100 138.62 214.84 344.17 432.50 391.19
EPS 100 67.26 101.01 80.77 98.71 88.31

8/13/2019 larsenandtoubro-130914065740-phpapp01
http://slidepdf.com/reader/full/larsenandtoubro-130914065740-phpapp01 49/64
49
FINDINGS:
Index analysis of a company's financial statements is important to be able todetermine whether a company is growing or shrinking.
The positive inter-annual trends in the income statement components, bothincome and expense, have lifted the company's profit margins.
In the case of L&T, it experienced a major increase in sales for the periodreviewed and was also able to control the expense side of its business. That'sa sign of a very efficient management.

8/13/2019 larsenandtoubro-130914065740-phpapp01
http://slidepdf.com/reader/full/larsenandtoubro-130914065740-phpapp01 50/64
50

8/13/2019 larsenandtoubro-130914065740-phpapp01
http://slidepdf.com/reader/full/larsenandtoubro-130914065740-phpapp01 51/64
51
Financial statement analysis displays all items as percentages of acommon base figure.
This type of financial statement allows for easy analysis betweencompanies or between time periods of a company.

8/13/2019 larsenandtoubro-130914065740-phpapp01
http://slidepdf.com/reader/full/larsenandtoubro-130914065740-phpapp01 52/64

8/13/2019 larsenandtoubro-130914065740-phpapp01
http://slidepdf.com/reader/full/larsenandtoubro-130914065740-phpapp01 53/64

8/13/2019 larsenandtoubro-130914065740-phpapp01
http://slidepdf.com/reader/full/larsenandtoubro-130914065740-phpapp01 54/64

8/13/2019 larsenandtoubro-130914065740-phpapp01
http://slidepdf.com/reader/full/larsenandtoubro-130914065740-phpapp01 55/64
55
FINDINGS:
Formatting financial statements in this way reduces the bias that can occur whenanalyzing companies of differing sizes.
It also allows for the analysis of a company over various time periods, revealing,for example, what percentage of sales is cost of goods sold and how that valuehas changed over time.
In this case, the sales had been considerably good till 2010 and then from theyear 2010 to 2011 the income or the earnings of the company decreased.

8/13/2019 larsenandtoubro-130914065740-phpapp01
http://slidepdf.com/reader/full/larsenandtoubro-130914065740-phpapp01 56/64
56

8/13/2019 larsenandtoubro-130914065740-phpapp01
http://slidepdf.com/reader/full/larsenandtoubro-130914065740-phpapp01 57/64

8/13/2019 larsenandtoubro-130914065740-phpapp01
http://slidepdf.com/reader/full/larsenandtoubro-130914065740-phpapp01 58/64
58
• In spite of L&T’s global presence, it is not verypopular in the international market.
• The customer service staff still needs training
specially in the delivery and help desk areas, that
threaten inviting new clients.• Sectoral growth is constrained due to low
unemployment levels and competition for staff.
• There are some gaps in range for certain sectors
like global delivery management, processes andsystems, that somehow have management issues.

8/13/2019 larsenandtoubro-130914065740-phpapp01
http://slidepdf.com/reader/full/larsenandtoubro-130914065740-phpapp01 59/64
59
• Demand of its services in Middle East, Europe andSouth-East Asia.
• L&T is good at converting adversities into
opportunities and continue it’s march of progress .
• The end-users respond positively to new ideas, sothere exists a great possibility that L&T could
extend to overseas broadly.
• Mainframe management capabilities will give
opportunity to L&T-Ites to go for largeinfrastructure deals and hosting biz.

8/13/2019 larsenandtoubro-130914065740-phpapp01
http://slidepdf.com/reader/full/larsenandtoubro-130914065740-phpapp01 60/64
60
• Legislation could make an impact over L&T’sbusiness proceedings.
• In spite of being among the most dominant
conglomerate in the country, L&T may be
vulnerable to reactive attack by its majorcompetitors.
• Lack of infrastructure in rural areas could
constrain investment.
• The high volume/low cost market is intenselycompetitive.

8/13/2019 larsenandtoubro-130914065740-phpapp01
http://slidepdf.com/reader/full/larsenandtoubro-130914065740-phpapp01 61/64

8/13/2019 larsenandtoubro-130914065740-phpapp01
http://slidepdf.com/reader/full/larsenandtoubro-130914065740-phpapp01 62/64
62

8/13/2019 larsenandtoubro-130914065740-phpapp01
http://slidepdf.com/reader/full/larsenandtoubro-130914065740-phpapp01 63/64
63
• Wikipedia• www.larsentoubro.com
• www.moneycontrol.com • www.cnbc.com • Financial Management by I M Pandey

8/13/2019 larsenandtoubro-130914065740-phpapp01
http://slidepdf.com/reader/full/larsenandtoubro-130914065740-phpapp01 64/64
so much for bearing us for the past 20 minutes..