laser ablation aerosol particle time-of-flight mass
TRANSCRIPT

Atmos. Meas. Tech., 11, 2325–2343, 2018https://doi.org/10.5194/amt-11-2325-2018© Author(s) 2018. This work is distributed underthe Creative Commons Attribution 4.0 License.
Laser ablation aerosol particle time-of-flight mass spectrometer(LAAPTOF): performance, reference spectra andclassification of atmospheric samplesXiaoli Shen1,2, Ramakrishna Ramisetty1, Claudia Mohr1,a, Wei Huang1,2, Thomas Leisner1, and Harald Saathoff1
1Institute of Meteorology and Climate Research (IMK-AAF), Karlsruhe Institute of Technology (KIT),Hermann-von-Helmholtz-Platz 1, 76344 Eggenstein-Leopoldshafen, Germany2Institute of Geography and Geoecology (IfGG), Karlsruhe Institute of Technology (KIT), Kaiserstr. 12,76131 Karlsruhe, Germanyanow at: Department of Environmental Science and Analytical Chemistry, Stockholm University,Stockholm, 11418, Sweden
Correspondence: Harald Saathoff ([email protected])
Received: 18 September 2017 – Discussion started: 8 November 2017Revised: 2 February 2018 – Accepted: 28 March 2018 – Published: 24 April 2018
Abstract. The laser ablation aerosol particle time-of-flightmass spectrometer (LAAPTOF, AeroMegt GmbH) is ableto identify the chemical composition and mixing state ofindividual aerosol particles, and thus is a tool for eluci-dating their impacts on human health, visibility, ecosys-tem, and climate. The overall detection efficiency (ODE)of the instrument we use was determined to range from∼ (0.01± 0.01) to ∼ (4.23± 2.36) % for polystyrene latex(PSL) in the size range of 200 to 2000 nm, ∼ (0.44± 0.19)to ∼ (6.57± 2.38) % for ammonium nitrate (NH4NO3), and∼ (0.14± 0.02) to ∼ (1.46± 0.08) % for sodium chloride(NaCl) particles in the size range of 300 to 1000 nm. Ref-erence mass spectra of 32 different particle types relevantfor atmospheric aerosol (e.g. pure compounds NH4NO3,K2SO4, NaCl, oxalic acid, pinic acid, and pinonic acid; in-ternal mixtures of e.g. salts, secondary organic aerosol, andmetallic core–organic shell particles; more complex particlessuch as soot and dust particles) were determined. Our re-sults show that internally mixed aerosol particles can result inspectra with new clusters of ions, rather than simply a combi-nation of the spectra from the single components. An exem-plary 1-day ambient data set was analysed by both classicalfuzzy clustering and a reference-spectra-based classificationmethod. Resulting identified particle types were generallywell correlated. We show how a combination of both meth-ods can greatly improve the interpretation of single-particledata in field measurements.
1 Introduction
Atmospheric aerosol particles impact visibility, interact withtrace gases, can act as cloud condensation and ice nuclei, andinfluence the Earth’s radiation budget (Seinfeld and Pandis,2006). Especially the continuously evolving chemical com-position of aerosol particles is of scientific interest, as it in-fluences all aerosol effects (Burkholder et al., 2017; Pöschl,2005). However, large knowledge gaps still exist related tothe chemical composition of the organic and inorganic com-ponents and their mutual interaction (Jimenez et al., 2009;Murphy et al., 2006; Schill and Tolbert, 2013; Zhang et al.,2007).
Aerosol particles can contain various components, rang-ing from volatile to refractory species (Pratt and Prather,2012). The global aerosol mass burden was estimated toconsist of 73.6 % dust, 16.7 % sea salt, 2.8 % biogenicsecondary organic aerosols (SOA), 2.3 % primary organicaerosols (POA), 1.3 % sulfate, 1.3 % ammonium, 1.2 % ni-trate, 0.4 % black carbon (soot), 0.2 % anthropogenic SOA,and 0.2 % methane sulfonic acid (Tsigaridis et al., 2006).During the ambient aerosols’ lifetime, ranging from hours toa few weeks (Pöschl, 2005), the complexity of their chemi-cal composition usually increases by coagulation, cloud pro-cessing, and chemical reactions (Seinfeld and Pandis, 2006;Usher et al., 2003). This modifies the particles’ mixing state,with both internal (individual particles consisting of mixed
Published by Copernicus Publications on behalf of the European Geosciences Union.
2326 X. Shen et al.: Single-particle reference mass spectra and classification of atmospheric particles
compounds, e.g. coating structures) and external mixtures,e.g. mixture of particles consisting of different compounds(Li et al., 2016). The aforementioned findings underscore theimportance of measuring aerosol chemical composition andits changes on short timescales and on a single-particle basis,which can be realized by online mass spectrometry.
Online mass spectrometry includes bulk and single-particle measurements (Pratt and Prather, 2012). Single-particle mass spectrometry, which can be dated back to the1970s, aims at in situ and real-time identification of thechemical composition of individual aerosol particles, herebyelucidating a particle’s external and internal mixing proper-ties (Noble and Prather, 2000). Online single-particle massspectrometers (SPMSs) commonly use pulsed lasers for par-ticle desorption and ionization (LDI), with the advantage ofionizing nearly all atmospheric particle components, includ-ing both non-refractory and refractory materials (Kulkarni etal., 2011). To the best of our knowledge, so far there is noquantitative analysis of particle composition by SPMS, sincethe ablation/ionization laser cannot interact with the entireparticle and the generated ion fragments/clusters are suscep-tible to matrix effects (Ramisetty et al., 2017). In addition,ionization mechanisms are not fully understood (Murphy,2007). SPMSs have identified many different ambient par-ticle types in different regions of the atmosphere, such as el-emental carbon and organic carbon (ECOC), organic sulfate,aged sea salt, biological, soil dust, and different metal domi-nated types (Dall’Osto et al., 2016; Moffet et al., 2008; Mur-phy et al., 2006; Schmidt et al., 2017). These measurementsall confirmed the complexity of individual particles’ mixingstate and demonstrated the usefulness of single-particle massspectra for apportionment of individual particle sources, in-cluding e.g. fossil fuel and biomass burning combustion,cooking, marine, and shipping sources (Arndt et al., 2017;Schmidt et al., 2017).
Currently, there are only two commercially availableSPMSs, i.e. the single-particle aerosol mass spectrometer(SPAMS, Hexin Analytical Instrument Co., Ltd., China; Li etal., 2011; Lin et al., 2017) and the laser ablation aerosol parti-cle time-of-flight mass spectrometer (LAAPTOF, AeroMegtGmbH, Germany). LAAPTOF uses two laser diodes (405 nmwavelength, ∼ 40 mW, ∼ 50 µm beam spot diameter; Mars-den et al., 2016; Zawadowicz et al., 2017) for optical count-ing and size recording by light scattering, and one excimerlaser (ArF, 193 nm, ∼ 4 mJ) for one-step ablation/ionization.The overall detection efficiency (ODE) of this instrument,defined as the number of single-particle mass spectra ob-tained from the total number of aerosol particles in the sam-pled air, was determined to range from ∼ 0.15 to ∼ 2.2 %for polystyrene latex (PSL) particles with geometric diame-ters (dp) between 350 nm and 800 nm (Gemayel et al., 2016;Marsden et al., 2016). The instrument used by Gemayelet al. (2016) exhibited a maximum ODE of ∼ 2.2 % forPSL particle diameters of 450 nm, while ∼ 1 % at 600 nmwas the peak ODE reported by Marsden et al. (2016) be-
fore the instrument modification. Neither the response of theLAAPTOF to spherical PSL particles smaller than 350 nmand bigger than 800 nm nor the response to other particletypes with different shapes has been investigated systemat-ically. The scattering efficiency (SE), defined as the numberfraction of particles detected by light scattering compared tothe number of particles in the sampled air in front of the aero-dynamic inlet lens (ADL) of the instrument (refer to Fig. 1),is determined by the laser diodes, the detection optics, andthe photomultiplier tubes (PMT), and it has a strong influ-ence on the ODE of the instrument. Therefore, several groupshave tried to improve this part of the instrument. Marsden etal. (2016) modified the detection stage geometry by replacingthe detection laser with a fibre-coupled 532 nm, 1 W Nd:YAGsolid-state laser system with a collimated laser beam, accom-plishing an order-of-magnitude improvement in light detec-tion sensitivity to PSL particles with 500–800 nm diameter.Zawadowicz et al. (2017) modified the optical path of thelaser diodes with a better laser beam of < 1 mrad full-angledivergence and 100 µm detection beam spot size, and appliedlight guides to enhance the scattered-light collection. Thisresulted in improvement of 2–3 orders of magnitude in op-tical counting efficiency of incident PSL particles with 500–2000 nm vacuum aerodynamic diameter (dva). There are onlyvery few studies so far that discuss mass spectral patterns ofdifferent particle types measured by LAAPTOF. Gemayel etal. (2016) presented spectra from ambient particles collectedin the city centre of Marseille, France; spectra (positive only)from pure soot and SOA-coated soot particles were shownby Ahern et al. (2016); spectra from potassium rich feldspar,soot, Argentinian soil dust, and Snomax (commercial ice nu-clei) were shown by Zawadowicz et al. (2017); PSL andpotassium rich feldspar spectra were measured by Marsdenet al. (2018); and radiolytically formed particles spectra weremeasured by Wonaschuetz et al. (2017). Reitz et al. (2016)presented peak assignments for pure ammonium nitrate andsulfate particles, as well as for ambient particles measuredat a suburban site of Düsseldorf, Germany, but did not showany spectra. Marker ions generated from SPMS are likely in-strument specific, as pointed out by Schmidt et al. (2017).Therefore, there is a need for publicly available spectral in-formation of this relatively new instrument.
There exists several techniques to group the large num-ber of individual particle types and spectra resulting fromSMPS measurements – such as k-means, c-means, and hier-archical clustering algorithms; neural-network-based meth-ods such as ART2-A; and the most recent algorithm ofordering points to identify the clustering structure (OP-TICS) – to help analyse the data (Hinz et al., 1999; Mur-phy et al., 2003; Reitz et al., 2016; Zelenyuk et al., 2006b;Zhao et al., 2008). There also exist target (reference spec-tra/predefined clusters)-oriented methods (Hinz et al., 1999;Gleanta GmbH; LAAPTOF AnalysisPro, AeroMegt GmbH).
In this paper we have characterized our LAAPTOF in-strument with respect to its ODE for PSL, NH4NO3, and
Atmos. Meas. Tech., 11, 2325–2343, 2018 www.atmos-meas-tech.net/11/2325/2018/

X. Shen et al.: Single-particle reference mass spectra and classification of atmospheric particles 2327
Figure 1. Schematic of the LAAPTOF instrument and the experimental setup for measuring standard samples (method A), e.g. PSL,NH4NO3, and K2SO4 particles, which were generated from a nebulizer, passed through two dryers, were size-selected by a differentialmobility analyser (DMA), and were then measured by LAAPTOF.
sodium chloride (NaCl) particles for a wide size range (dm:200–2000 nm PSL; 300–1000 nm NH4NO3 and NaCl). Wepresent laboratory-based reference spectra for aerosol parti-cles containing atmospherically relevant components, whichwere grouped into three categories: (1) particles consisting ofpure compounds, e.g. NH4NO3, K2SO4, and organic acids;(2) particles consisting of well-defined mixtures of pure saltsand mixtures of organic compounds, e.g. α-pinene SOA, andPSL internally mixed with K2SO4, as well as other core–shell type of particles; and (3) particles consisting of com-plex mixtures, e.g. soot and dust particles. These referencespectra may also provide other users comprehensive refer-ences for comparison purposes and thus help better interpretambient data. An example of field data analysis based on ref-erence spectra as well as fuzzy c-means clustering will begiven in Sect. 3.3.
2 Methods
2.1 The LAAPTOF instrument
The LAAPTOF has been described in several recent pub-lications (Ahern et al., 2016; Gemayel et al., 2016; Mars-den et al., 2016, 2018; Reitz et al., 2016; Wonaschuetz etal., 2017; Zawadowicz et al., 2017). Therefore, here weonly briefly review the general operation steps that yieldsize and composition information of individual aerosol par-ticles. The LAAPTOF instrument used in this study wasdelivered in April 2015 and may differ in a few techni-cal aspects from earlier or later versions. A schematic ofthe main LAAPTOF components is given in Fig. 1. Par-ticles with a vacuum aerodynamic diameter (dva) between∼ 70 nm and 2.5 µm are sampled with a sampling flow rateof ∼ 80 standard cubic centimetres per minute (SCCM);focused and accelerated by an ADL (LPL-2.5, AeroMegtGmbH) with close to 100 % transmission efficiency for par-ticles with dva 100 nm to 2 µm (http://www.aeromegt.com/#products?LPL-2.5_details, last access: 16 April 2018); andthen pass through the particle time-of-flight (PTOF) chamber
in which the individual particle can be detected by two sizinglaser beams (405 nm continuous wave, 40 mW) separated by11.3 cm. Based on the particle time of flight between the twolaser beams, its dva can be determined and recorded. Afterdetection by the second sizing laser, a nanosecond excimerlaser pulse (wavelength: 193 nm; pulse duration: 4 to 8 ns;maximum pulse energy: ∼ 8 mJ; beam diameter: ∼ 300 µmwhen it hits the particle (Ramisetty et al., 2017); power den-sity: ∼ 109 W cm−2; ATLEX-S, ATL Lasertechnik GmbH)can be triggered to desorb and ionize particle compounds.A laser pulse energy of 4 mJ was used for all the measure-ments in this study. More details about the ionization re-gion geometry are given by Ramisetty et al. (2017). Theresulting ions are analysed by a bipolar time-of-flight massspectrometer (BTOF-MS; TOFWERK AG; mass resolutionof m/1m∼ 600 to 800 at 184 Th, mass range m/q = 1 upto ∼ 2000 Th). The cations and anions are detected by cor-responding microchannel plate arrays (MCPs), producing apair of positive and negative spectra for each single particle.
2.2 Aerosol particle generation and experimental setupin the laboratory
The laboratory-based aerosol particles measured in this study(summarized in Table 1) were generated in four differentways (A, B1, B2, and S).
Method A: samples for pure particles and homogeneousand heterogeneous mixtures were dissolved/suspended in pu-rified water and nebulized (ATM 221, Topas GmbH) with drysynthetic air, passed through two diffusion dryers (cylinderfilled with Silica gel, Topas GmbH), and then size-selectedby a differential mobility analyser (DMA 3080, TSI GmbH)before being sampled by LAAPTOF.
Method B1: particles were sampled from the 84.5 m3 sim-ulation chamber AIDA (Aerosol Interactions and Dynamicsin the Atmosphere) of KIT (Saathoff et al., 2003). SOA parti-cles were formed in the 3.7 m3 stainless-steel Aerosol Prepa-ration and Characterization (APC) chamber via ozonolysis(∼ 6 ppm ozone) of α-pinene (∼ 2.2 ppm) and then trans-ferred into AIDA. Soil dust samples were dispersed by a ro-
www.atmos-meas-tech.net/11/2325/2018/ Atmos. Meas. Tech., 11, 2325–2343, 2018
2328 X. Shen et al.: Single-particle reference mass spectra and classification of atmospheric particles
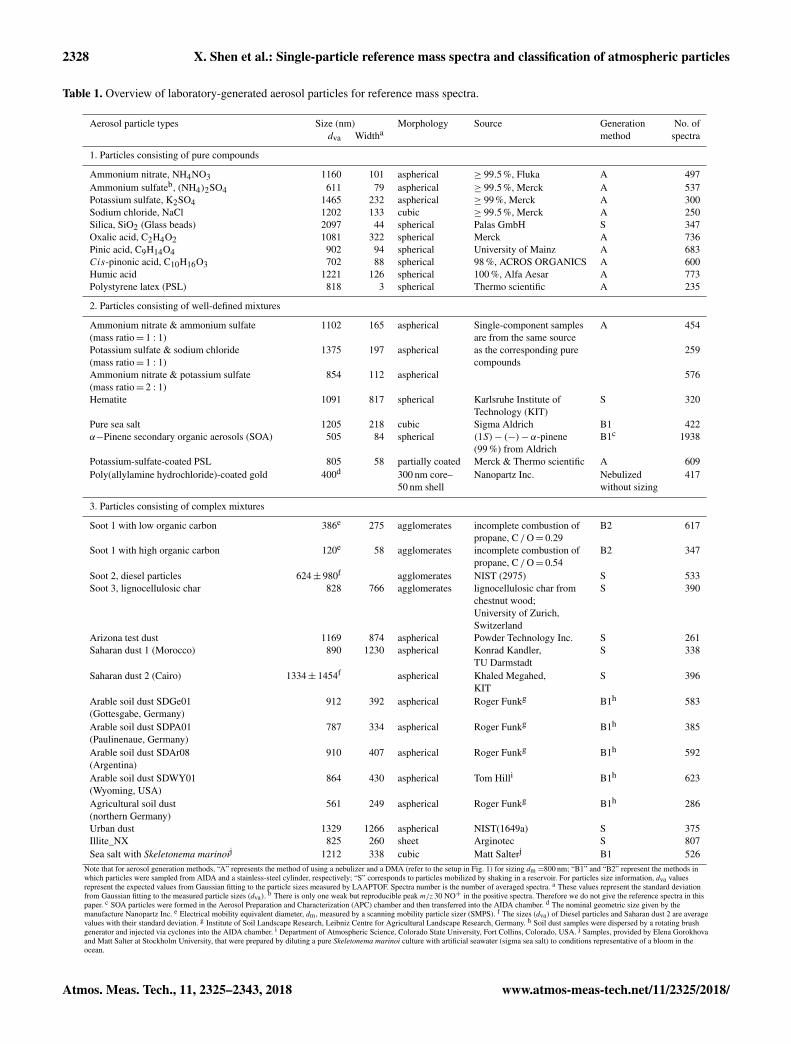
Table 1. Overview of laboratory-generated aerosol particles for reference mass spectra.
Aerosol particle types Size (nm) Morphology Source Generation No. ofdva Widtha method spectra
1. Particles consisting of pure compounds
Ammonium nitrate, NH4NO3 1160 101 aspherical ≥ 99.5%, Fluka A 497Ammonium sulfateb, (NH4)2SO4 611 79 aspherical ≥ 99.5%, Merck A 537Potassium sulfate, K2SO4 1465 232 aspherical ≥ 99%, Merck A 300Sodium chloride, NaCl 1202 133 cubic ≥ 99.5%, Merck A 250Silica, SiO2 (Glass beads) 2097 44 spherical Palas GmbH S 347Oxalic acid, C2H4O2 1081 322 spherical Merck A 736Pinic acid, C9H14O4 902 94 spherical University of Mainz A 683Cis-pinonic acid, C10H16O3 702 88 spherical 98 %, ACROS ORGANICS A 600Humic acid 1221 126 spherical 100 %, Alfa Aesar A 773Polystyrene latex (PSL) 818 3 spherical Thermo scientific A 235
2. Particles consisting of well-defined mixtures
Ammonium nitrate & ammonium sulfate 1102 165 aspherical Single-component samples A 454(mass ratio= 1 : 1) are from the same sourcePotassium sulfate & sodium chloride 1375 197 aspherical as the corresponding pure 259(mass ratio= 1 : 1) compoundsAmmonium nitrate & potassium sulfate 854 112 aspherical 576(mass ratio= 2 : 1)Hematite 1091 817 spherical Karlsruhe Institute of S 320
Technology (KIT)Pure sea salt 1205 218 cubic Sigma Aldrich B1 422α−Pinene secondary organic aerosols (SOA) 505 84 spherical (1S)− (−)−α-pinene B1c 1938
(99 %) from AldrichPotassium-sulfate-coated PSL 805 58 partially coated Merck & Thermo scientific A 609Poly(allylamine hydrochloride)-coated gold 400d 300 nm core– Nanopartz Inc. Nebulized 417
50 nm shell without sizing
3. Particles consisting of complex mixtures
Soot 1 with low organic carbon 386e 275 agglomerates incomplete combustion of B2 617propane, C /O= 0.29
Soot 1 with high organic carbon 120e 58 agglomerates incomplete combustion of B2 347propane, C /O= 0.54
Soot 2, diesel particles 624± 980f agglomerates NIST (2975) S 533Soot 3, lignocellulosic char 828 766 agglomerates lignocellulosic char from S 390
chestnut wood;University of Zurich,Switzerland
Arizona test dust 1169 874 aspherical Powder Technology Inc. S 261Saharan dust 1 (Morocco) 890 1230 aspherical Konrad Kandler, S 338
TU DarmstadtSaharan dust 2 (Cairo) 1334± 1454f aspherical Khaled Megahed, S 396
KITArable soil dust SDGe01 912 392 aspherical Roger Funkg B1h 583(Gottesgabe, Germany)Arable soil dust SDPA01 787 334 aspherical Roger Funkg B1h 385(Paulinenaue, Germany)Arable soil dust SDAr08 910 407 aspherical Roger Funkg B1h 592(Argentina)Arable soil dust SDWY01 864 430 aspherical Tom Hilli B1h 623(Wyoming, USA)Agricultural soil dust 561 249 aspherical Roger Funkg B1h 286(northern Germany)Urban dust 1329 1266 aspherical NIST(1649a) S 375Illite_NX 825 260 sheet Arginotec S 807Sea salt with Skeletonema marinoij 1212 338 cubic Matt Salterj B1 526
Note that for aerosol generation methods, “A” represents the method of using a nebulizer and a DMA (refer to the setup in Fig. 1) for sizing dm =800 nm; “B1” and “B2” represent the methods inwhich particles were sampled from AIDA and a stainless-steel cylinder, respectively; “S” corresponds to particles mobilized by shaking in a reservoir. For particles size information, dva valuesrepresent the expected values from Gaussian fitting to the particle sizes measured by LAAPTOF. Spectra number is the number of averaged spectra. a These values represent the standard deviationfrom Gaussian fitting to the measured particle sizes (dva). b There is only one weak but reproducible peak m/z 30 NO+ in the positive spectra. Therefore we do not give the reference spectra in thispaper. c SOA particles were formed in the Aerosol Preparation and Characterization (APC) chamber and then transferred into the AIDA chamber. d The nominal geometric size given by themanufacture Nanopartz Inc. e Electrical mobility equivalent diameter, dm, measured by a scanning mobility particle sizer (SMPS). f The sizes (dva) of Diesel particles and Saharan dust 2 are averagevalues with their standard deviation. g Institute of Soil Landscape Research, Leibniz Centre for Agricultural Landscape Research, Germany. h Soil dust samples were dispersed by a rotating brushgenerator and injected via cyclones into the AIDA chamber. i Department of Atmospheric Science, Colorado State University, Fort Collins, Colorado, USA. j Samples, provided by Elena Gorokhovaand Matt Salter at Stockholm University, that were prepared by diluting a pure Skeletonema marinoi culture with artificial seawater (sigma sea salt) to conditions representative of a bloom in theocean.
Atmos. Meas. Tech., 11, 2325–2343, 2018 www.atmos-meas-tech.net/11/2325/2018/

X. Shen et al.: Single-particle reference mass spectra and classification of atmospheric particles 2329
tating brush generator (RBG1000, PALAS) and injected viacyclones into the AIDA chamber. Sea salt particles were gen-erated and injected into AIDA by ultrasonically nebulizingartificial seawater (Sigma Aldrich) and highly concentratedSkeletonema marinoi culture (in artificial seawater), respec-tively, via a droplet separator and two diffusion dryers (Wag-ner et al., 2018).
Method B2 was used only for soot particles, which weregenerated with a propane burner (RSG miniCAST; Jing Ltd.)and injected into and sampled from a stainless-steel cylinderof 0.2 m3 volume.
Method S: silica, hematite, illite NX, Arizona test dust,desert and urban dust, black carbon from chestnut wood(University of Zurich, Switzerland), and diesel soot referenceparticles from NIST were suspended in their reservoir bottlesby shaking them and sampled directly from the headspace(upper part) of these reservoirs through a tube connecting itwith the LAAPTOF.
For all the measurements, except measuring the particlesgenerated by method S, a condensation particle counter (CPC3010, TSI GmbH) was used to record the particle numberconcentration in parallel with the LAAPTOF inlet. The setupin Fig. 1 was specific for particles generated from method A.
2.3 Field measurement
Unusually high particle number concentrations, similar todowntown Karlsruhe (a city in southwest Germany), wereobserved frequently northeast of Karlsruhe by particle coun-ters on board a tram wagon (www.aero-tram.kit.edu, last ac-cess: 16 April 2018) intersecting the city (Hagemann et al.,2014). To study the nature and to identify possible sourcesof these particles, their number, size, chemical composition,associated trace gases, and meteorological conditions weremeasured from 15 July to 1 September 2016 at a rural lo-cation (49◦6′10.54′′ N, 8◦24′26.07′′ E), next to the tram linenorth of the village of Leopoldshafen, Germany. Ambientaerosol particles were sampled through a PM2.5 inlet (SH2.5–16, Comde-Derenda GmbH) with 1 m3 h−1, a fraction ofwhich was guided into the LAAPTOF, which was deployedfor ∼ 5 weeks from 26 July to 31 August. LAAPTOF mea-surements provided information on size and mass spectralpatterns for individual particles. In this paper we use datafrom 1 day as an example of the potential interpretation ofLAAPTOF spectral data using reference spectra.
2.4 Efficiency calculations
In the literature, two definitions of detection efficiency (DE)of SPMS are used: one is equal to the scattering efficiency(SE) of the detection lasers (Brands et al., 2011; Gaie-Levrelet al., 2012; Su et al., 2004; Zelenyuk and Imre, 2005; Ze-lenyuk et al., 2009), which is the fraction of particles detectedby the scattering optics in the detection region of the instru-ment; the other one is the product of SE and hit rate (HR)
of the ablation/ionization laser (Su et al., 2004; Gemayel etal., 2016; Marsden et al., 2016). The hit rate is the fractionof particles detected actually leading to a useful mass spec-trum. In this paper we use ODE, defined by the followingequations:
ODE= SE×HR× 100% (1)SE=Nd/N0× 100% (transmission efficiency
of ADL is included), (2)HR=Ns/Nd × 100% (ionization efficiency
is included), (3)N0 = Cn× flow rate × time, (4)
whereNd is the number of particles detected by light scatter-ing, N0 is the number of particles in front of the ADL, Ns isthe number of bipolar spectra, Cn is the particle number con-centration (cm−3) measured by a CPC in front of the ADL,and the flow rate is the LAAPTOF sample flow rate.
2.5 Spectral and size data analysis
For each type of laboratory-generated aerosol particles, wemeasured at least 300 mass spectra. Data analysis is donevia the Igor LAAPTOF data analysis software (version 1.0.2,AeroMegt GmbH). There are five main steps for the basicanalysis procedure: (a) removal of the excimer laser ring-ing signal from the raw mass spectra; (b) determination ofthe signal baseline; (c) filtering for empty spectra; (d) masscalibration; and (e) stick integration, that is, the integra-tion of nominal masses for peaks. It should be noted thatspectrum-to-spectrum differences in peak positions for thesame ion fragments/clusters complicate the mass calibra-tions. This may be caused by differences in kinetic energyof the ions produced; however this effect is typically com-pensated in the TOFs with reflectron (Kulkarni et al., 2011).Spectrum-to-spectrum peak shifts, especially in the positivespectra in our study, are mainly because of variance in theposition of particle–laser interaction, which cannot be cor-rected with the existing AeroMegt software or the LAAPTOFinstrument (Ramisetty et al., 2017). Details can be found in“Procedure 1” in the Supplement. Spectra presented in thispaper were typically normalized to the sum of ion signal be-fore further aggregation.
For ambient data analysis, we used two different classifi-cation methods. The first one is fuzzy c-means clustering al-gorithm embedded in the Igor LAAPTOF data analysis soft-ware, commonly used to do classification based on the simi-larities of the individual spectra. The number of the classes ischosen manually; afterwards the particle spectra with a min-imum distance between their data vectors and a cluster cen-tre are grouped into a specific class (Hinz et al., 1999; Re-itz et al., 2016). Since each spectrum can belong to multipleclasses (Reitz et al., 2016), the resulting fraction/percentagefor each class represents the information about the degree of
www.atmos-meas-tech.net/11/2325/2018/ Atmos. Meas. Tech., 11, 2325–2343, 2018
2330 X. Shen et al.: Single-particle reference mass spectra and classification of atmospheric particles
similarity between aerosol particles in one particular class,not a number percentage. The second method developed inthis study is based on the correlation between each ambientspectrum and our reference spectra. The resulting Pearson’scorrelation coefficient (r) is used as the criterion to groupparticles into different types (here we use “types” insteadof “classes” in order to differentiate these two classificationmethods). When r is higher than a threshold value of 0.6, theambient spectrum is considered to have high correlation withthe corresponding reference spectrum. For simplification wechose 10 positive and 7 negative reference spectra. For ex-ample, we only use German soil dust as the reference forarable soil dust, rather than using four arable soil dust sam-ples from different places. More details about the procedurefor this method as well as the corresponding equations anduncertainties estimation can be found in “Procedure 2” in theSupplement.
In addition, particle size (dva) was recorded for individualparticles. The corresponding size distribution can be plottedas dva histogram, a Gaussian fit of which yields number meandva values and the standard deviation (width).
3 Results and discussion
3.1 LAAPTOF performance
3.1.1 Hit rate, scattering efficiency, and overalldetection efficiency for standard samples
HR, SE, and ODE for spherical PSL particles as a functionof electrical mobility equivalent diameter dm are plotted inFig. 2. It should be noted that the LAAPTOF detection be-haviour may vary depending on the alignment of the ADLand the optical components (especially the detection laserdiodes), which is difficult to reproduce. We therefore showresults for PSL particles based on two repeated experimentsafter three alignments each and thus a total of six experimentsfor each data point. The uncertainty intervals in Fig. 2 arethe difference between the maximum/minimum and the aver-age values obtained from these six experiments. As shown inpanel a of Fig. 2, for particle diameters from 200 to 400 nm,HRPSL exhibits an increase from 69 to 94 %, decreases to83 % for 700 nm particles, and then becomes stable at∼ 85 %for particles with diameters up to 2 µm. The average HRPSL(HRPSL) is ∼ 84 %. SEPSL and ODEPSL show an M-likeshape with two peaks, at 500 nm (SEPSL 3.0 %, ODEPSL2.7 %) and at 1000 nm (SEPSL 4.8 %, ODEPSL 4.2 %) (seepanels b and c of Fig. 2). We attribute this behaviour to acombined effect of the spherical shape of PSL particles andthe optical system of this instrument, e.g. Mie resonances re-lated to particle size and laser wavelength (see Sect. 3.1.2 fordetails). As shown in panel c of Fig. 2, values and trends ofODEPSL in the size range of 300–800 nm of our instrumentare similar to those reported by Gemayel et al. (2016) and
Marsden et al. (2016) for their LAAPTOF instruments. A re-cent LAAPTOF study by Zawadowicz et al. (2017) showscomparable results for PSL particles with dp ≤ 500 nm andan M-like shape of ODE in the size range of 200–2000 nm(after instrument modification).
We also measured mass spectra of non-spherical NH4NO3(χ = 0.8; Williams et al., 2013) and NaCl particles (cubic,χ = 1.06 to 1.17; Zelenyuk et al., 2006a). Similar to PSL par-ticles, NH4NO3 and NaCl particles show relatively high andstable HR with average values of 80 and 66 % (see panel din Fig. 2); thus SE and ODE have a similar trend. No M-likeshape of ODE as a function of particle size is observed dueto the different light scattering properties of the non-sphericalsalt particles (Bohren and Huffman, 2007; see panels e andf in Fig. 2). Comparable results were shown for (NH4)2SO4particles (χ = 1.03 to 1.07; Zelenyuk et al., 2006a) by Za-wadowicz et al. (2017). As shown in Fig. 2e–f, SE and ODEdecrease with increasing shape factor for salt particles of thesame size. We will discuss this in more detail in the followingsection.
3.1.2 Factors influencing overall detection efficiency
There are various factors that can influence the ODE ofLAAPTOF. One of these is particle size. For particles withdiameters below 200 nm, the scattered light becomes tooweak to be detected due to the strong dependence of the scat-tering intensity on particle size (Bohren and Huffman, 2007).For particles with diameters larger than 2 µm, focusing by theADL is much less efficient, resulting in a higher divergenceof the particle beam (Schreiner et al., 1999). This lowers theprobability of larger particles being detected by the detec-tion/scattering laser and/or being hit by the ionization laser.In addition, light scattering of spherical particles like PSLchanges from Rayleigh to Mie to geometric scattering as thesize parameter α = πdp/λ increases from� 1 to ∼ 1 to� 1(Seinfeld and Pandis, 2006). The scattering efficiencies ofPSL particles, based on Mie calculation at the particle sizesand detection laser wavelength relevant to our LAAPTOFmeasurement, validate the M-like shape of SEPSL (refer toFig. S1 in the Supplement). As long as the particle diame-ter (dp) is smaller than the wavelength of the detection laserlight, here 405 nm, the scattered-radiation intensity (propor-tional to d6
p ) will rapidly decrease with decreasing particlesizes, resulting in low ODE. ODE is e.g. 0.01 % for 200 nmPSL particles. For non-spherical particles like salts, their SEand ODE are also size dependent (panel f in Fig. 2), due tosize-dependent light scattering ability and particle beam di-vergence. However, in the size range of 300 to 1000 nm stud-ied here, they do not exhibit Mie resonance and thus do notshow an M-like shape in their scattering efficiency.
Optical properties of the particles have a strong impact onhow light is scattered and absorbed, and thus it should benoted that the optical properties influence not only scatteringefficiency but also absorption and ionization efficiency (or hit
Atmos. Meas. Tech., 11, 2325–2343, 2018 www.atmos-meas-tech.net/11/2325/2018/

X. Shen et al.: Single-particle reference mass spectra and classification of atmospheric particles 2331
Figure 2. Hit rate (HR, a and d), scattering efficiency (SE, b and e), and overall detection efficiency (ODE, c and f) for PSL, ammoniumnitrate (NH4NO3), and sodium chloride (NaCl) salt particles as a function of mobility diameter, dm. Aerosol particles in this study weregenerated from a nebulizer and size-selected by DMA. In (b) and (e), OCEs for PSL and ammonium sulfate ((NH4)2SO4) at the detectionbeam from the study by Zawadowlcz et al. (2017), corresponding to the SE defined in this study, are plotted for comparison. In (c) and (f),ODE for PSL and salt particles from other studies (Gemayel et al., 2016; Marsden et al., 2016; Zawadowicz et al., 2017) are plotted forcomparison. In this figure, dashed lines are used only to guide the eyes.
rate). As shown in Fig. 2f, ODE for NH4NO3 is higher thanthat for NaCl at any size we studied. This is mainly causedby differences in their optical properties of scattering. Freshsoot particles scatter only little light due to their black colourand the small size (typically ∼ 20 nm) of the primary parti-cles forming their agglomerates, and are thus hardly detectedby the detection laser. However they are good light absorbersand thus relatively easy to ablate and ionize. The referencespectra of pure NH4NO3 and (NH4)2SO4 particles showedintensive prominent peaks for pure NH4NO3 particles (referto Fig. 3a) but only one weak peak of m/z 30 NO+ for pure(NH4)2SO4 particles. This indicates that NH4NO3 is a bet-ter absorber than (NH4)2SO4 and thus easier to ablate andionize. For homogeneous mixtures of these two ammoniumsalts, the sulfate species are ablated and ionized much moreeasily (refer to Sect. 3.2.2), due to increased UV light ab-sorption by the nitrate component. Some small organic com-pounds with weak absorption properties are hard to ablateand ionize, e.g. oxalic acid (C2H2O4), pinic acid, and cis-pinonic acid. They exhibited much weaker signals (∼ 80 %lower) than macromolecular organic compounds in PSL orhumic acid particles.
Particle morphology is another important factor. The scat-tering efficiency for non-spherical NH4NO3 is higher thanfor spherical PSL particles in the size range of 300–800 nm(Fig. 2b–e) (Ackerman et al., 2015). For larger particlesizes (dm > 800 nm), beam divergence offsets the shape ef-fect (Murphy, 2007). Apart from that, the increase of surfaceroughness and inhomogeneity can promote the scattering ca-pability of particles (Ackerman et al., 2015).
The incident intensity of radiation, which is another pa-rameter that influences the light scattered by particles (aswell as background signal caused by stray light), is relatedto power and beam dimensions of the detection laser. Cor-responding instrument modifications were done by Marsdenet al. (2016) and Zawadowicz et al. (2017) (refer to Sect. 1).In addition, alignment of the excimer laser focus in the x, y,and z position influences optimum hit rates (Ramisetty et al.,2017).
There are further instrumental aspects that affect the de-tection efficiency. High number concentrations of the incom-ing particles influence the ODE, since there can be morethan one particle present between the two detection lasers.The transmission efficiency of the ADL is included in thescattering efficiency and thus directly influences it. The size
www.atmos-meas-tech.net/11/2325/2018/ Atmos. Meas. Tech., 11, 2325–2343, 2018

2332 X. Shen et al.: Single-particle reference mass spectra and classification of atmospheric particles
Figure 3. Average mass spectra for pure compound aerosol parti-cles: (a) NH4NO3 (dva= 1160 nm), 497 single spectra averaged;(b) K2SO4 (dva= 1465 nm), 300 single spectra averaged; and(c) oxalic acid particles (dva= 1081 nm ), 736 single spectra av-eraged.
range of particles focused by the lens and the particle beamwidth strongly depend on the configuration of the ADL(Canagaratna et al., 2007; Johnston, 2000). Liu lenses andSchreiner lenses can focus the particles in the size rangeof 80–800 and 300–3000 nm, respectively (Kamphus et al.,2008; Liu et al., 1995; Schreiner et al., 1999). The ADLtransmission efficiency of our instrument, as determined bythe manufacturer (AeroMegt GmbH), is close to 100 % forparticles with dva 100–2000 nm.
3.2 LAAPTOF reference spectra oflaboratory-generated particle types
Particles for which reference spectra are presented here arelisted in Table 1. For each type of these aerosol particles, wepresent averaged spectra for typically 300 to 500 single parti-cles. The relative standard deviations (RSDs, SD normalizedto signal) for the characteristic peaks are in the range of 15–186 %, with a median value of 77 %.
Despite the lack of full quantitativeness of the LAAPTOF,mass spectral signal amplitudes show an increase with par-ticle size (refer to Fig. S2). However, no systematic changesin the mass spectral signatures were observed for differentparticle sizes. Therefore, for the samples passing through theDMA, particles in the optimum size range of the LAAPTOF(dm = 800 nm) and with good signal-to-noise ratio were cho-sen to generate reference spectra. For polydisperse particlesgenerated in the AIDA chamber, the corresponding averagespectra include particles of broader size distributions thanthose preselected by the DMA. Information on particle gen-eration or source as well as the sizes is listed in Table 1.
A qualitative comparison between the relative peak inten-sity ratios within a single-particle spectrum and those in an-other spectrum can yield relative quantitation information,as suggested by Gross et al. (2000). We add information ontypical peak ratios to some of our reference spectra to helpidentify specific species.
3.2.1 Pure compound particles
Although particles consisting of one single species only arerarely sampled in the atmosphere, interpretation of massspectra of ambient samples is supported by the knowledgeabout the mass spectra of pure compounds. In the following,mass spectra for a few typical ambient aerosol constituentsare discussed.
Figure 3 shows average spectra for pure compound aerosolparticles. For NH4NO3 particles (panel a), we observed thepositive ions m/z 18 NH+4 and m/z 30 NO+, and the neg-ative ions m/z 46 NO−2 and m/z 62 NO−3 , similar to Reitzet al. (2016). The LAAPTOF is much less sensitive to am-monium than nitrate fragments, leading to a weak NH+4 sig-nal and prominent NO+, NO−2 and NO−3 peaks. The ratio ofNO+ to NH+4 is ∼ 48, and the ratio of NO−2 to NO−3 is ∼ 4.The prominent peak of NO+ arises not only from nitrate (ma-jority), but also from ammonium (Murphy et al., 2006). Inour ammonium nitrate spectra, there are weaker signaturesof m/z 46 NO+2 and m/z 125 HNO3 ·NO−3 (not shown here,but visible and reproducible), which were also observed inPALMS mass spectra (Zawadowicz et al., 2015). For K2SO4particles, we observed the potassium signals at m/z 39 K+
and m/z 41 K+, and a sulfate signature with ion clustersgrouped around m/z 32 S−, m/z 64 SO−2 , m/z 80 SO−3 , andm/z 96 SO−4 . Note that the extra peak at m/z 40+ besidesm/z 39 K+ in Fig. 3b is likely due to the incorrect mass as-
Atmos. Meas. Tech., 11, 2325–2343, 2018 www.atmos-meas-tech.net/11/2325/2018/

X. Shen et al.: Single-particle reference mass spectra and classification of atmospheric particles 2333
signments as a result of peak shifts (refer to Sect. 2.5 and“Procedure 1” in the Supplement). For high-intensity peakssuch as sodium chloride NaCl, extra peaks next to the mainpeak (Fig. S3) may have an additional cause: “ringing” dueto partial saturation of the data acquisition system or signalreflections within the data acquisition circuitry (Gross et al.,2000). The real intensities of m/z 35 Cl− should include itscorresponding side ringing peak. The ratio of m/z 39 K+ tom/z 41 K+ is ∼ 13.2, close to the natural isotopic ratio of∼ 13.9 for 39K / 41K. For pure NaCl particles, the ratio ofm/z 35 Cl− tom/z 37 Cl− is∼ 3.2, similar to the natural iso-topic ratio of ∼ 3.1 for 35Cl / 37Cl. Therefore, these two iso-topic ratios can be used as markers to identify K and Cl mea-sured by LAAPTOF. Another inorganic compound measuredhere is silica (Fig. S4), and its typical peak ratio of (m/z 76SiO−3 +m/z 77 HSiO−3 ) to m/z 60 SiO−2 is ∼ 1.0. The corre-sponding histograms of such ratios for different particle sam-ples can be found in Fig. S5.
High signal intensities in oxalic acid spectra are observedat m/z 18 H2O+, 28 CO+, and 30 CH2O+, as well assome weaker peaks at m/z 40+, 44+, 56+, and 57+. M/z 89C2O4H− is used as a signature ion for oxalic acid in otherSPMS studies (Roth et al., 2016). In our study, a distinct sig-nal at aroundm/z 89− is observed as well, indicating oxalatefragment formation after laser ablation.
In order to identify humic-like substances in the ambientparticles, we measured humic acid particles (Fig. S6) andfound hydrocarbon and elemental carbon fragments, withvery prominent peaks at m/z 24−, 25−, and 26− suggestedto be organic ions (Silva et al., 2000), as well as peaks atm/z 25−, 26−, 49−, and 73− for unsaturated organic com-pounds.
3.2.2 Particles consisting of well-defined internalmixtures
Figure 4 shows average spectra from homogeneously inter-nally mixed particles. The spectrum from the mixture ofNH4NO3 and (NH4)2SO4 (panel a) contains the signaturefrom pure NH4NO3 particles, but with lower relative inten-sities (each peak intensity is normalized to the sum of ionsignal) for NO−2 and NO−3 , due to the formation of anionclusters at ∼m/z= 80 SO−3 and 97 HSO−4 . Compared to thepure NH4NO3 particles, the ratio of NO+ to NH+4 (∼ 34)is ∼ 30 % lower in the spectrum for the mixture, due to itslower molar ratio of nitrate to ammonium, whereas the ra-tio of NO−2 to NO−3 (∼ 7) is 80 % higher. In addition, as al-ready discussed in Sect. 3.1.2, the better UV light absorberNH4NO3 assists in light absorbing for mixed particles, re-sulting in a sulfate signature that could not be observed forpure (NH4)2SO4. This exemplifies potential effects of indi-vidual particle chemical composition on mass spectral per-formance of the LAAPTOF. For the mixture of K2SO4 andNaCl (panel b), similar signatures to those of the pure par-ticles were observed. Compared to the pure NaCl particle
spectra, the signal intensity of Na+ is decreased. This can beexplained by more cations formed from the mixed particles,including from potassium, which has a higher ionization po-tential and lower lattice energy than NaCl. For the mixed par-ticles, expected clusters such as 113/115 K2Cl+, 109 KCl−2 ,and 119 NaSO−4 and a minor fragment 97 KNaCl+ were ob-served, but not 81/83 Na2Cl+ as found in pure NaCl parti-cles. These results show that, compared to pure compounds,mass spectra from aerosol particles consisting of mixturescan feature new ions, while some marker ions for the purecompounds may disappear. These spectra are thus not sim-ply a combination of the spectra from single-component par-ticles. Another example of an inorganic mixture of NH4NO3and K2SO4 is provided in Fig. S7. The α-pinene SOA spec-trum is shown in panel c of Fig. 4. Ablation of α-pineneSOA particles forms different types of organic fragments:(1) hydrocarbon and oxygenated organic fragments CxHyOz(x = 1–6, y = 0–9, z= 0–3; details about the peak assign-ments can be found in Table S1) – except for m/z 59+,83+, 85+, and 95+ – are comparable to the combinationmass spectral patterns for cis-pinonic and pinic acids (re-fer to Fig. S8), which are oxidation products from α-pineneozonolysis (Saathoff et al., 2009; Yu et al., 1999); (2) carbonclusters 12 C+, 24 C+2 , 36 C+3 , and 60 C+5 , with the mostprominent peak in 12 C+, assigned to both soot and organicmatter fragments in another LAAPTOF study (Ahern et al.,2016); and (3) carboxylic acid groups in the negative spec-tra, e.g. 45 COOH−, 59 CH2COOH−, 73 C2H4COOH−, 85C3H4COOH−, and 99 C4H6COOH−.
Figure 5a shows the spectrum for heterogeneously inter-nally mixed K2SO4 and PSL particles (PSL core, K2SO4shell). All signatures for PSL particles – i.e. hydrocarbonfragments in positive spectra; intensive organic signaturem/z 24−, 25−, and 26−; carbon clusters C+/−n ; and m/z 49−
and 73− fragments arising from unsaturated structures suchas aromatic structures – are retained in this spectra (grey la-bels), and the corresponding peak intensities are similar tothe pure PSL particles (Fig. S9). However, the intensities ofmost of the K2SO4 fragments are weaker than pure K2SO4particles, likely due to the quite thin or only partial coat-ing layer of K2SO4 on the PSL core (the nominal geomet-ric size of the PSL particles mixed with the aqueous solu-tion of K2SO4 was 800 nm, which is the same size that wasselected by the DMA prior to sampling by the mass spec-trometer.). The most prominent peak at m/z 39+ with a nor-malized intensity of ∼ 0.46, containing both K+ and C3H+3fragments, is mainly attributed to K+ (intensity ∼ 0.73 forpure K2SO4), since the intensity of C3H+3 (∼ 0.06) for purePSL is much lower (refer to Fig. S9). The still intensive sig-nal from 39 K+, despite the weaker sulfate peaks, corre-sponds to the high sensitivity of the instrument to potassium.Figure 5b shows the average spectrum for poly(allylaminehydrochloride)-coated gold particles. Prominent signaturesof nitrogen-containing compounds (NOCs) are observed atm/z 58 C2H5–NH–CH+2 , 15 NH+, 26 CN−, and 42 CNO−,
www.atmos-meas-tech.net/11/2325/2018/ Atmos. Meas. Tech., 11, 2325–2343, 2018

2334 X. Shen et al.: Single-particle reference mass spectra and classification of atmospheric particles
Figure 4. Average mass spectra for particles of internal mixtures of(a) NH4NO3 and (NH4)2SO4 (dva = 1102 nm), 454 single spec-tra averaged, and (b) NaCl and K2SO4 (dva = 1375 nm), 259 singlespectra averaged, as well as (c) secondary organic aerosol (SOA)particles from α-pinene ozonolysis, which was performed in theAPC chamber, and then the resulting particles were transferred intothe AIDA chamber at 263 K and 95 % RH, dva = 505 nm, 1938 sin-gle spectra averaged. In (a), red, blue, and orange label shadingsrepresent fragments of sulfate, nitrate, and ammonium, respectively.In (b), green and purple label shadings represent fragments fromNaCl and K2SO4 components (see Sect. 3.2.1) in the mixed par-ticles, respectively; yellow label shadings represent the fragmentsonly in the internal mixture of NaCl and K2SO4.
as well as the signatures for unsaturated organic compoundsat m/z 25−, 26−, 49−, and 73−. Strong intensities for m/z(35− plus 36−) and 37− with a ratio of∼ 3.1 can be assignedto Cl isotopes derived from the hydrochloride. We also ob-served small gold peaks at m/z 197+/− both in positive andnegative spectra.
Figure 5. Average mass spectra for core–shell particles of (a) PSLcoated with K2SO4, dva = 805 nm, 609 single spectra averaged,and (b) poly(allylamine hydrochloride)-coated gold (Au) particleswith geometric 300 nm gold core and 50 nm thick organic shell, 417single spectra averaged. In (a), grey and purple label shadings repre-sent the fragments arising from pure PSL and pure K2SO4 compo-nents, respectively; box labels represent the fragments with contri-butions from core and shell compounds. In (b) orange and blue labelshadings represent the fragments arising from nitrogen-containingand unsaturated organic compounds, respectively, and yellow labelshadings represent gold.
Mass spectra for other well-defined compounds, i.e. syn-thetic hematite and pure sea salt particles, are also providedin the Supplement (Figs. S10 and S11).
3.2.3 Particles consisting of complex mixtures
Figure 6 shows the average spectra for different types of sootparticles. All of them show characteristic patterns for ele-mental carbon (EC) Cn+/−. For soot 1 with high organic car-bon (OC) content from propane combustion in the laboratory(panel b), prominent peaks were observed at m/z 28 CO+
and 27 C2H+3 , as well as some other organic carbon signa-tures at m/z 39+, 40+, 44+, and 56+. All the organic signa-tures in soot 1 with high OC were also observed for soot 3,lignocellulosic char from chestnut wood (panel d), indicat-ing that biomass burning soot contains a significant fractionof OC. It should be noted that biomass burning will also formpotassium; thus m/z 39+ contains both K+ and C3H+3 frag-
Atmos. Meas. Tech., 11, 2325–2343, 2018 www.atmos-meas-tech.net/11/2325/2018/

X. Shen et al.: Single-particle reference mass spectra and classification of atmospheric particles 2335
Figure 6. Average mass spectra for soot particles with (a) high elemental carbon (EC) and low organic carbon (OC) content, and (b) low ECand high OC from combustion of propane in a soot generator and transferred to a stainless-steel cylinder of ∼ 0.2 m3 volume, as well as sootparticles of (c) diesel particles (NIST) and (d) lignocellulosic char from chestnut wood. In (a) and (c), the numbers in brackets beside peak36+ and 24− are the exact intensity values for them. The OC signatures are labelled in green. The numbers of spectra averaged for eachspectrum are 617 (a), 347 (b), 533 (c) and 390 (d).
ments. M/z 24−, 25−, and 26− can be observed in all thesoot types, but with slightly different patterns: (1) soot withhigh EC content shows very high m/z 24− (∼ 2 to 3 timesthat of m/z 25−), while (2) soot with high OC shows com-parable or even higher m/z 25− to/than m/z 24−. These pat-terns might help to distinguish EC and OC contributions inthe spectra from ambient particles.
Figure 7 shows spectra for Arizona test dust (milled desertdust) (panel a), arable soil SDGe01 sampled from Gottesgabein Germany (panel b), and agricultural soil dust collectedfrom harvesting machines after rye and wheat harvest (panelc). For Arizona test dust, we observed high mineral signa-tures of aluminium- and silicon-containing clusters, namely27 Al+, 28 Si+, 44 SiO+, 43 AlO−, 59 AlO−2 , 60 SiO−2 , 76SiO−3 , 119 AlSiO−4 , 179 AlSiO4.SiO−2 , and 136 (SiO2)2O−.It should be noted that high 16 O− and 17 OH− accompanythe intensive mineral signatures, attributed to the adsorbedwater on the active surface of mineral particles. In panela, we also observed the following peaks: other mineral re-lated metal clusters (e.g. 7 Li+, 23 Na+, 24 Mg+, 40 Ca+,39/41 K+, 55 Mn+, 56 Fe+, 58 Ni+, and 64 Zn+); metal ox-ides and hydroxides (e.g. 56 CaO+, 57 CaOH+, 96 Ca2O+,and 112 (CaO)+2 , and 88 FeO−2 ); and weak anion clustersof organic signature (m/z 24 C−2 , 25 C2H−, 26 C2H−2 , and42 C2H2O−), NOCs (m/z 26 CN− and 42 CNO−), chloride(m/z 35− and 37−), sulfate (m/z 32−, 48−, 64−, 80−, and97−), phosphate (63 PO−2 and 79 PO−3 ), diacids (oxalate 89
(CO)2OOH− and 117(CO)3OOH−), and an unknown frag-ment m/z 148−. M/z 26+ in panels b and c is much higherthan m/z 24− and 25−, due to the contribution of CN frag-ments from NOCs. Similar signatures can also be observedin the spectra for Saharan dust (Fig. S12).
Most of the mineral and organic fragments of soil dustare similar to those of desert dust; however with differentintensities – e.g. m/z 24−, 25−, 26−, and 42− (labelled ingreen) – they are more intensive than those in desert dust,indicating higher organic compound content. Some peak ra-tios of fragments are similar across the different dust types;e.g. 40 Ca+ to 56 CaO+ is 2.2, 1.1, and 2 for desert dust,arable soil dust and agricultural soil dust, respectively. Com-pared with desert dust, there are different fragments fromsoil dust particles, e.g. EC patterns (labelled in grey), organicacids signatures (blue), ammonium signatures (orange), un-saturated organic fragments (m/z 49− and 73−), and someother unknown fragments (red). For arable soil dust parti-cles, we also measured samples from Paulinenaue in Ger-many (SDPA01), Argentina (SDAr08), and Wyoming in theUSA (SDWY01) (refer to Fig. S13). Dominant mass spectralpeak patterns are similar across all soil dust samples. Theyare located at around m/z 27+, 39+, and 56+ in the posi-tive spectra, and 26−, 42−, 60−, and 76− in negative spec-tra. Less prominent but reproducibly detected are carboxylicacid groups (e.g. COOH−) and EC patterns. The German soildust, however, contains more organic species than soil dust
www.atmos-meas-tech.net/11/2325/2018/ Atmos. Meas. Tech., 11, 2325–2343, 2018
2336 X. Shen et al.: Single-particle reference mass spectra and classification of atmospheric particles
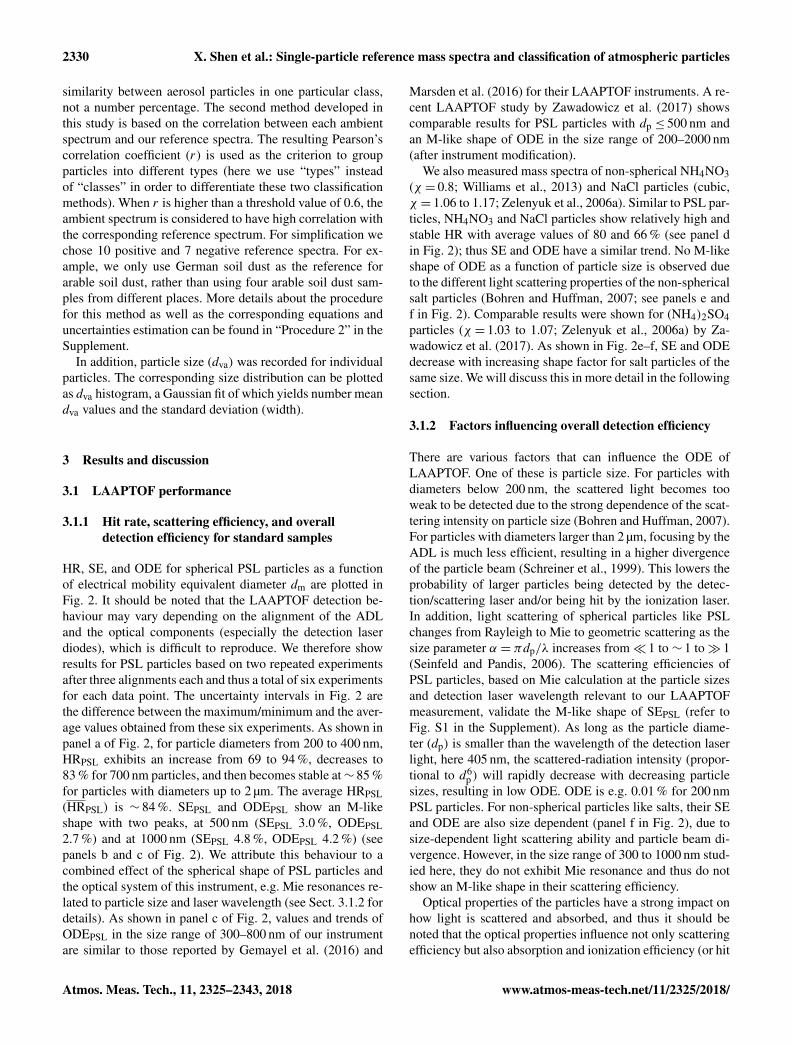
Table 2. Summary of mass spectral patterns.
Species Signature peaks in Signature peaks in Typical peak ratiospositive spectra negative spectra histogram x0 (width)∗
potassium 39 K+, 41 K+ I39 : I41=∼ 13.5 (0.9)calcium 40 Ca+, 56 CaO+
aluminium 27 Al+ 43 AlO−, 59 AlO−2silicon 28 Si+, 44 SiO+ 60 SiO−2 , 76 SiO−3 , 77 HSiO−3 (I76+ I77) : I60=
∼ 1.0 (0.33)silicon & aluminium 27 Al+, 28 Si+, 44 SiO+ 43 AlO−, 59 AlO−2 ,
60 SiO−2 , 76 SiO−3 ,77 HSiO−3 , 119 AlSiO−4 ,179 AlSiO4.SiO−2
ammonium 18 NH4 /H2O+, 30 NO+
nitrate 30 NO+ 46 NO−2 , 62 NO−3sulfate 32 S−, 48 SO−, 64 SO−2 , 80 SO−3 ,
81HSO−3 , 96 SO−4 , 97 HSO−4 ,chloride 35 Cl−, 37 Cl− (I35+ I36) : I37=
∼ 3.1 (0.5)elemental carbon 12n C+n 12nC−norganics 24 C−2 , 25 C2H−, 26 C2H2 /CN−
26 C2H2 /CN−
organic acids 45 COOH−, 59 CH2COOH−,71 CCH2COOH−,73 C2H4COOH−,85 C3H4COOH−,99 C4H6COOH−,117 (CO)3OOH−
nitrogen-containing organics 26 CN−, 42 CNO−
unsaturated organics 25 C2H−, 26 C2H−2 , unknownfragments 49- and 73-
aromatic compounds 77 C6H+5 , 91C7H+7 , 103 C8H+7 / 25 C2H−, 26 C2H−2 , unknown105 C8H+9 , 115 C9H+7 fragments 49- and 73-
∗ We have made histograms for each of the three typical peak ratios (ref. Fig. S5). Histogram x0 is the expected value that indicates the position of the peak resulting fromGaussian fit, and the width is the corresponding standard deviation. I is short for the intensity of the corresponding peak in LAAPTOF spectra; typical peak ratios forpotassium and chloride are based on pure and mixed salt containing K and Cl; typical peak ratios for silicon are based on pure SiO2.
from Argentina and the USA, reflected in higher intensitiesat m/z 24−, 25−, and 26−. Argentinian soil dust contains farfewer mineral species, expressed in much lower intensities ofmineral signatures, e.g. m/z 27+, 28+, 40+, 44+, and 56+.The ratios of m/z 39 K+ and 41 K+ (3.6, 3.8, 3.5, and 5.3for SDGe01, SDPA01, SDAr08, and SDWY01, respectively)are much lower than the typical peak ratio (∼ 13.5) for potas-sium (Table 2), indicating that they are likely contributed toby both potassium isotopes and hydrocarbon fragments.
For agricultural soil dust particles, obviously ammonium(m/z 18 NH+4 and 30 NO+), phosphate (m/z 63 PO−2 , 79PO−3 , and 95 PO−5 ), and potassium signatures (m/z 39 K+
and 41 K+) can be found in the spectra, attributed to fertiliza-tion. Apart from that, typical biological signatures were ob-served: (1) the strong m/z 26−, 42−, and 39+ pattern is sim-ilar to the potassium organo-nitrogen particle type observedby an ATOFMS at an urban site in Barcelona (Dall’Osto etal., 2016), which was assigned to carbohydrates arising from
biogenic species (Schmidt et al., 2017; Silva et al., 2000).(2) 26− and 42− could also be contributed by CN− andCNO− derived from NOCs, i.e. amines, as well as m/z 30CH3NH+, 58 C2H5NHCH+2 , and 59 (CH3)3N+. These bio-logical signatures have also been observed by ALABAMAin the field (Schmidt et al., 2017). (3) Some weak but repro-ducibly detected fragment pattern at around m/z 77 C6H+5 ,91 C7H+7 , 103 C8H+7 , 105 C8H+9 , and 115 C9H+7 might orig-inate from aromatic compounds. Similar patterns can also befound for PSL particles.
Other examples for complex mixtures, i.e. illite and seasalt particles with biological components, are provided in theSupplement (Figs. S14 and S11).
All the peak assignments and mass spectral patterns, likesignature peaks, as well as some stable peak ratios mentionedabove have been summarized in Table S1 in the Supplementand Table 2, respectively. We consider these laboratory-basedreference spectra as useful for the analysis of data obtained
Atmos. Meas. Tech., 11, 2325–2343, 2018 www.atmos-meas-tech.net/11/2325/2018/

X. Shen et al.: Single-particle reference mass spectra and classification of atmospheric particles 2337
Figure 7. Average mass spectra for particles of complex mix-tures: (a) Arizona test dust (desert dust), directly sampled into theLAAPTOF from a shaked bottle (b) arable soil dust, collected fromGottesgabe in Germany, was dispersed by a rotating brush genera-tor and injected via cyclones into the AIDA chamber at 256 K and80 % RH, and (c) agricultural soil dust, collected from harvestingmachines after rye and wheat harvest, were generated by using thesame method as (b). For (b) and (c), fragments labelled in green rep-resent more intensive organic signatures in soil dust particles; greylabels represent EC patterns; blue labels represent organic acids;orange labels represent ammonium salts; red labels represent un-known fragments. The numbers of spectra averaged for each spec-trum are 261 (a), 583 (b), and 286 (c).
also by other LAAPTOF versions and to some extent even forother single-particle mass spectrometers. Similar mass spec-tra are to be expected as long as they use similar ablationand ionization laser pulses (4 mJ, 193 nm), inlet regions forthe mass spectrometer, and mass spectrometer types. In thenear future, we plan to make these laboratory-based refer-
ence spectra publicly available via the EUROCHAMP-2020database (www.eurochamp.org, last access: 16 April 2018).
3.3 Interpretation of field data
Figure 8 shows an example of bipolar mass spectra for sixdifferent particle classes measured in the field campaign ata rural site near Leopoldshafen in southwest Germany. On29 July 2016 within 24 h, 7314 particles were detected andsuccessfully ablated, and mass spectra were generated byLAAPTOF. The 7314 pairs of spectra were then clusteredby the fuzzy c-means algorithm, resulting in six classes. Theresulting number of classes with clearly different features de-pends on the experience of the operating scientist to iden-tify them (please refer to the details of fuzzy clustering inProcedure 1 in the Supplement). The fuzzy results are com-pared with the laboratory-based reference spectra by calcu-lating their correlation coefficients (Fig. 9). All classes ex-hibit a sulfate signature withm/z 97 HSO−4 andm/z 80 SO−3 ;a nitrate signature with m/z 46 NO−2 and 62 NO−3 ; an or-ganic compound signature withm/z 24 C−2 , 25 C2H−, and 26C2H2/CN−; and a NOC signature with m/z 26 CN− and 42CNO− in the negative spectra. More characteristic signaturesfor each particle class can be observed in the positive spec-tra. All particles measured on this day show a 35 % similar-ity to class 5 with obvious signatures for potassium (K) andsulfate, with significant correlation with the reference parti-cles containing potassium and sulfate (Fig. 9). Additionally,class 5 has a significant correlation with some other cationsarising from ammonium, organic compounds, and dust. Theratio of m/z (39++ 40+) to 41+ is ∼ 11, close to the valuefor pure K2SO4 particles (∼ 13.5); thus we assigned them toK+ rather than organic fragments. Further, there is a 15 %similarity to class 4 with prominent ammonium signaturesat m/z 18 NH+4 and 30 NO+, sulfate signatures, and a rel-atively weaker but reproducible nitrate signature. The cor-responding spectrum is similar to the spectrum for the ho-mogeneous mixtures of NH4NO3 and (NH4)2SO4 (panel ain Fig. 4). This class also has strong correlation with bothpositive and negative reference spectra for the mixture ofammonium nitrate and ammonium sulfate particles. Ammo-nium, nitrate, and sulfate are the major secondary inorganicspecies in atmospheric aerosol particles (Seinfeld and Pan-dis, 2006); thus we name this class “secondary inorganic”.It should be noted that this class has a significant correla-tion with ammonium and cations arising from oxalic acid;however class 4 has a weak correlation with the signatureanion, i.e. m/z 89 C2O4H− (oxalate), of oxalic acid. There-fore, we can rule out a significant contribution of oxalic acid.There is also a 15 % similarity to class 2 (sodium rich), witha characteristic pattern of a strong signal at m/z 23 Na+ ac-companied by two weaker peaks at m/z 39 K+ (with typicalpotassium peak ratio of ∼ 12) and 63+ (might contain bothCu+ and C5H+3 fragments). Class 2 has a significant corre-lation with the cations (i.e. Na and K) arising from sea salt
www.atmos-meas-tech.net/11/2325/2018/ Atmos. Meas. Tech., 11, 2325–2343, 2018

2338 X. Shen et al.: Single-particle reference mass spectra and classification of atmospheric particles
Figure 8. Mass spectra for six classes of particles measured on 29 July 2016 during the field campaign TRAM01, based on classificationaccording to the fuzzy c-means algorithm. The percentage in each pair of spectra (a to f) gives us information about the similarity of the totalaerosols to different classes. The red tags represent the signatures for each typical class, but there is no red tag in (b), since this class consistsof more aged particles containing signatures for different classes. Mean particle size: dva (676± 165) nm.
but a weak correlation with its anions, such as m/z 35− and37− chloride isotopes. A sea salt contribution can thus beruled out. Its negative spectrum significantly correlates withnitrate, sulfate, and dust particles. Besides sodium-rich dust,aged sea salt may be an appropriate classification. Class 3 isnamed “aged soot”, since it has a significant correlation withsoot particles, especially diesel soot, and a prominent sulfatesignal. This class has an EC pattern withm/z 12n C+n , similarto those in the reference spectra for soot particles (Fig. 6) aswell as the reference spectra for PSL particles (Fig. S9). Thepatterns at m/z 27 C2H+3 and 28 CO+; m/z 36 C+3 and 39C3H+3 ; and the m/z 24−, 25−, and 26− with higher m/z 26−
indicate an OC contribution. This is supported by the cor-relations, especially with PSL particles, as well as severalother organic compounds, suggesting that this class of par-ticles contains organic species. Class 6 is dominated by cal-cium (Ca) and sulfate with characteristic calcium signaturepeaks at m/z 40 Ca+ and 56 CaO−, also found in the spectrafor dust particles (Figs. 7, S12, and S13). M/z 40+ and 56+
may also contain 40 C2O+ and 56 Fe/C4H+8 fragments, re-spectively. Class 1 contains almost all fragments observed inother classes and is thus named “more aged/mixed particles”.As shown in Fig. 9, class 6 is consequently correlated withalmost all of the reference spectra (both positive and negativeones).
In order to further interpret the field data, we also classi-fied the ambient mass spectra only based on correlation with17 selected laboratory-based reference spectra (10 positive
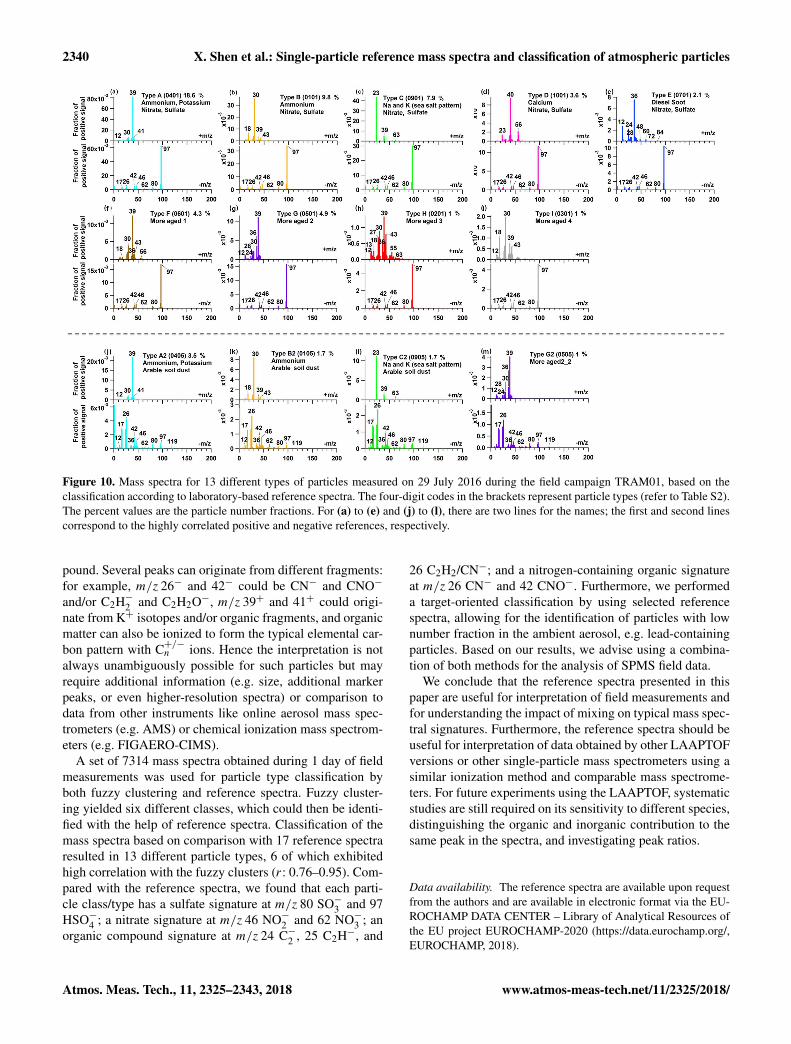
+7 negative spectra) listed in Table S2. This approach re-sulted in 13 particle types, 7 more than were distinguishedby fuzzy clustering. It should be mentioned that at the be-ginning we were able to identify all but the Ca-rich particleclass resulting from fuzzy clustering, since initially we didnot have a reference for this type. We therefore used class6 as an additional reference spectrum for this type of par-ticles, which is among one of the 13 types (here we use“types” instead of “classes” in order to differentiate thesetwo classification methods). Their corresponding spectra areshown in Fig. 10. All the types above the dashed line (pan-els a to i) exhibit more prominent secondary inorganic sig-natures (m/z 97 HSO−4 ) and higher number fractions thanthe ones below the dashed line. Although particle types Ato I all exhibit a more prominent sulfate pattern with m/z 80and 97 than nitrate pattern with m/z 46 and 62, they aremore highly correlated with the mixture of nitrate and sulfatethan either of them. Therefore, we assign the correspondingtypes to nitrate and sulfate. All the types in the lower pan-els (j to m) have significant correlation with arable soil dustin the negative spectra, which have organic signatures (e.g.m/z 24−, 25−, and 26−) as well as some mineral signatureslikem/z 119−. Compared with the negative spectra, the posi-tive spectra are more characteristic, which was also observedin the fuzzy results. Type A, B, C, D, and E are comparablewith fuzzy class 5, 4, 2, 6, and 3, respectively (the correlationcoefficients are 0.89 for type A and class 5, 0.95 for type Band class 4, 0.84 for type C and class 2, 0.76 for type D and
Atmos. Meas. Tech., 11, 2325–2343, 2018 www.atmos-meas-tech.net/11/2325/2018/

X. Shen et al.: Single-particle reference mass spectra and classification of atmospheric particles 2339
Figure 9. Correlation between fuzzy classification results(6 classes, C1 to C6) and laboratory-based reference spectra. (a)and (b) are the correlation results for the positive and negativespectra, respectively. PAH is short for poly(allylamine hydrochlo-ride); biomass burning soot is the lignocellulosic char from chestnutwood.
class 6, and 0.81 for type E and class 3). Types F to I aremore similar to aged/mixed particles, with more fragmentsthan types A to E. Type H is comparable with fuzzy class1. About 10 % of the particles cannot be grouped into anytype. This is most likely because of an incorrect mass assign-ment for the stick spectra, resulting from too-large spectrum-to-spectrum peak shifts for the same ion fragments/clusterswhich cannot be corrected on a single-particle basis with theexisting software (Ramisetty et al., 2017). As shown in thespectra in both Figs. 8 and 10, all organic species were inter-nally mixed with inorganic species.
This reference-spectra-based classification can also beused for identification of particles with low number fractionsamong the huge amount of ambient data, and for selectionof particles containing particular species, e.g. ones to whichthe instrument has a lower sensitivity. This can be achievedby e.g. excluding peaks with high signal, such as m/z 39K/C3H+3 , or by selecting a certain particle size range or massrange. As an example, 55 lead-containing particles (Pb, withisotopes at m/z 206, 207, and 208) (details are given in theProcedure 3 in the Supplement) were identified among the7314 ambient aerosol particles. The resulting spectra of par-ticle classes/types in one field study can also be used as a
reference for other studies. More applications of these pro-cedures for field data interpretation will be presented in anupcoming paper.
In short, fuzzy and reference-spectra-based classificationshave some comparable results with high correlations (r:0.76–0.95) and also have different advantages: fuzzy clas-sification can identify special ambient particle types withoutany existing reference if they have a significant abundanceand signal strength, while reference-spectra-based methodscan identify target particle types even with little abundance.They are complementary to some extent, and thus their com-bination has the potential to improve interpretation of fielddata.
4 Conclusions
In this study, the overall detection efficiency (ODE) ofLAAPTOF was determined to range from ∼ (0.01± 0.01)to ∼ (4.23± 2.36) % for polystyrene latex (PSL), with thesize of 200 to 2000 nm,∼ (0.44± 0.19) to∼ (6.57± 2.38) %for ammonium nitrate (NH4NO3) and ∼ (0.14± 0.02) to∼ (1.46± 0.08) % for sodium chloride (NaCl) particles in thesize range of 300 to 1000 nm. This is a relative good de-tection efficiency compared to earlier versions of the instru-ments, especially when considering the good reproducibilityand stability even during field measurements. A comparisonto other single-particle mass spectrometers is the subject ofanother study and will be discussed in a separate publication.Matrix effects from aerosol particles (e.g. size, morphology,and optical property) and certain instrument influences (e.g.aerodynamic lens, detection system) and their interactionmust be taken into account to evaluate the LAAPTOF per-formance.
In order to facilitate the interpretation of single-particlemass spectra from field measurements, we have measuredvarious well-defined atmospherically relevant aerosol parti-cles in the laboratory and provide here laboratory-based ref-erence spectra for aerosol particles of different complexitywith comprehensive spectral information about the compo-nents (such as organic compounds, elemental carbon, sul-fate, nitrate, ammonium, chloride, mineral compounds, andmetals, as commonly observed in atmospheric aerosol parti-cles). Our results show that the interpretation of spectra fromunknown particle types is significantly supported by usingknown mass spectral patterns like signature peaks for am-monium, nitrate, sulfate, and organic compounds as well astypical peak ratios for e.g. potassium, silicon, and chlorides.Spectra for internally mixed particles may show new clus-ters of ions, rather than simply a combination of the ionsfrom single-component particles. This may be a complica-tion for data interpretation which can be overcome if suit-able reference spectra for correspondingly mixed particlesare available. Organic compounds generally have some ionsin common but exhibit variations depending on the com-
www.atmos-meas-tech.net/11/2325/2018/ Atmos. Meas. Tech., 11, 2325–2343, 2018
2340 X. Shen et al.: Single-particle reference mass spectra and classification of atmospheric particles
Figure 10. Mass spectra for 13 different types of particles measured on 29 July 2016 during the field campaign TRAM01, based on theclassification according to laboratory-based reference spectra. The four-digit codes in the brackets represent particle types (refer to Table S2).The percent values are the particle number fractions. For (a) to (e) and (j) to (l), there are two lines for the names; the first and second linescorrespond to the highly correlated positive and negative references, respectively.
pound. Several peaks can originate from different fragments:for example, m/z 26− and 42− could be CN− and CNO−
and/or C2H−2 and C2H2O−, m/z 39+ and 41+ could origi-nate from K+ isotopes and/or organic fragments, and organicmatter can also be ionized to form the typical elemental car-bon pattern with C+/−n ions. Hence the interpretation is notalways unambiguously possible for such particles but mayrequire additional information (e.g. size, additional markerpeaks, or even higher-resolution spectra) or comparison todata from other instruments like online aerosol mass spec-trometers (e.g. AMS) or chemical ionization mass spectrom-eters (e.g. FIGAERO-CIMS).
A set of 7314 mass spectra obtained during 1 day of fieldmeasurements was used for particle type classification byboth fuzzy clustering and reference spectra. Fuzzy cluster-ing yielded six different classes, which could then be identi-fied with the help of reference spectra. Classification of themass spectra based on comparison with 17 reference spectraresulted in 13 different particle types, 6 of which exhibitedhigh correlation with the fuzzy clusters (r: 0.76–0.95). Com-pared with the reference spectra, we found that each parti-cle class/type has a sulfate signature at m/z 80 SO−3 and 97HSO−4 ; a nitrate signature at m/z 46 NO−2 and 62 NO−3 ; anorganic compound signature at m/z 24 C−2 , 25 C2H−, and
26 C2H2/CN−; and a nitrogen-containing organic signatureat m/z 26 CN− and 42 CNO−. Furthermore, we performeda target-oriented classification by using selected referencespectra, allowing for the identification of particles with lownumber fraction in the ambient aerosol, e.g. lead-containingparticles. Based on our results, we advise using a combina-tion of both methods for the analysis of SPMS field data.
We conclude that the reference spectra presented in thispaper are useful for interpretation of field measurements andfor understanding the impact of mixing on typical mass spec-tral signatures. Furthermore, the reference spectra should beuseful for interpretation of data obtained by other LAAPTOFversions or other single-particle mass spectrometers using asimilar ionization method and comparable mass spectrome-ters. For future experiments using the LAAPTOF, systematicstudies are still required on its sensitivity to different species,distinguishing the organic and inorganic contribution to thesame peak in the spectra, and investigating peak ratios.
Data availability. The reference spectra are available upon requestfrom the authors and are available in electronic format via the EU-ROCHAMP DATA CENTER – Library of Analytical Resources ofthe EU project EUROCHAMP-2020 (https://data.eurochamp.org/,EUROCHAMP, 2018).
Atmos. Meas. Tech., 11, 2325–2343, 2018 www.atmos-meas-tech.net/11/2325/2018/

X. Shen et al.: Single-particle reference mass spectra and classification of atmospheric particles 2341
The Supplement related to this article is available onlineat https://doi.org/10.5194/amt-11-2325-2018-supplement.
Author contributions. XS characterized the LAAPTOF, measuredall the particles samples, did the data analysis, produced all figures,and wrote the manuscript. RR helped to characterize the LAAPTOFand to measure some of the particle samples. CM provided techni-cal and scientific support for characterizing the LAAPTOF as wellas data analysis, and for interpretation and discussion of the results.WH provided scientific support for interpretation and discussion ofthe results. TL gave general advices and comments for this paper.HS provided technical and scientific support for characterizing theLAAPTOF, as well as suggestions for the data analysis, interpreta-tion, and discussion. All authors contributed to the final text.
Competing interests. The authors declare that they have no conflictof interest.
Acknowledgements. The authors gratefully thank the AIDA staffat KIT for helpful discussions and technical support, and the ChinaScholarship Council (CSC) for financial support of Xiaoli Shenand Wei Huang. Special thanks go to Robert Wagner for Mie cal-culation and discussion and comments on the sea salt samples; toThea Schiebel, Kristina Höhler, and Ottmar Möhler for discussionsabout the soil dust samples; to Isabelle Steinke for discussionsregarding the plant samples; to Konrad Kandler for providing theMorocco desert dust samples; to Roger Funk and Thomas Hillfor providing the soil dust samples; to Elena Gorokhova andMatt Salter for providing the sea salt with Skeletonema mari-noi culture; and to AeroMegt GmbH for discussions about theLAAPTOF performance and analysis software.
The article processing charges for this open-accesspublication were covered by a ResearchCentre of the Helmholtz Association.
Edited by: Joachim CurtiusReviewed by: two anonymous referees
References
Ackerman, A. A., Adam, J. A., Cairns, B., Cho, H., Gritsevich,M., Jethva, H., Kacenelenbogen, M., Kandler, K., Knobelspiesse,K., Lanconelli, C., Lupi, A., Mazzola, M., Nousiainen, T., Pel-toniemi, J. I., Platnick, S., Puttonen, E., Savenkov, S. N., Segal-Rosenheimer, M., Sharma, S., Tomasi, C., Torres, O., and Zhang,Z.: Light scattering reviews 9: Light scattering and radiativetransfer, Springer-Praxis, 2015.
Ahern, A. T., Subramanian, R., Saliba, G., Lipsky, E. M., Donahue,N. M., and Sullivan, R. C.: Effect of secondary organic aerosolcoating thickness on the real-time detection and characterizationof biomass-burning soot by two particle mass spectrometers, At-mos. Meas. Tech., 9, 6117–6137, https://doi.org/10.5194/amt-9-6117-2016, 2016.
Arndt, J., Sciare, J., Mallet, M., Roberts, G. C., Marchand,N., Sartelet, K., Sellegri, K., Dulac, F., Healy, R. M., andWenger, J. C.: Sources and mixing state of summertime back-ground aerosol in the north-western Mediterranean basin, At-mos. Chem. Phys., 17, 6975–7001, https://doi.org/10.5194/acp-17-6975-2017, 2017.
Bohren, C. F. and Huffman, R. D.: Absorption and scattering of lightby small particles, WILEY-VCH Verlag GmbH & Co. KGaA,2007.
Brands, M., Kamphus, M., Böttger, T., Schneider, J., Drewnick, F.,Roth, A., Curtius, J., Voigt, C., Borbon, A., Beekmann, M., Bour-don, A., Perrin, T., and Borrmann, S.: Characterization of a newlydeveloped aircraft-based laser ablation aerosol mass spectrome-ter (ALABAMA) and first field deployment in urban pollutionplumes over Paris during MEGAPOLI 2009, Aerosol Sci. Tech.,45, 46–64, 2011.
Burkholder, J. B., Abbatt, J. P. D., Barnes, I., Roberts, J. M.,Melamed, M. L., Ammann, M., Bertram, A. K., Cappa, C. D.,Carlton, A. G., Carpenter, L. J., Crowley, J. N., Dubowski, Y.,George, C., Heard, D. E., Herrmann, H., Keutsch, F. N., Kroll,J. H., McNeill, V. F., Ng, N. L., Nizkorodov, S. A., Orlando, J.J., Percival, C. J., Picquet-Varrault, B., Rudich, Y., Seakins, P.W., Surratt, J. D., Tanimoto, H., Thornton, J. A., Tong, Z., S., T.G., Wahner, A., Weschler, C. J., Wilson, K. R., and Ziemann, P.J.: The essential role for laboratory studies in atmospheric chem-istry, Environ. Sci. Technol., 51, 2519–2528, 2017.
Canagaratna, M. R., Jayne, J. T., Jimenez, J. L., Allan, J. D., Al-farra, M. R., Zhang, Q., Onasch, T. B., Drewnick, F., Coe, H.,Middlebrook, A., Delia, A., Williams, L. R., Trimborn, A. M.,Northway, M. J., DeCarlo, P. F., Kolb, C. E., Davidovits, P., andWorsnop, D. R.: Chemical and microphysical characterization ofambient aerosols with the aerodyne aerosol mass spectrometer,Mass Spectrom. Rev., 26, 185–222, 2007.
Dall’Osto, M., Beddows, D. C. S., McGillicuddy, E. J., Esser-Gietl,J. K., Harrison, R. M., and Wenger, J. C.: On the simultane-ous deployment of two single-particle mass spectrometers atan urban background and a roadside site during SAPUSS, At-mos. Chem. Phys., 16, 9693–9710, https://doi.org/10.5194/acp-16-9693-2016, 2016.
EUROCHAMP: EUROCHAMP DATA CENTER – Library of An-alytical Resources of the EU project EUROCHAMP-2020, avail-able at: https://data.eurochamp.org/, last access: 16 April 2018.
Gaie-Levrel, F., Perrier, S., Perraudin, E., Stoll, C., Grand, N.,and Schwell, M.: Development and characterization of a sin-gle particle laser ablation mass spectrometer (SPLAM) fororganic aerosol studies, Atmos. Meas. Tech., 5, 225–241,https://doi.org/10.5194/amt-5-225-2012, 2012.
Gemayel, R., Hellebust, S., Temime-Roussel, B., Hayeck, N., VanElteren, J. T., Wortham, H., and Gligorovski, S.: The perfor-mance and the characterization of laser ablation aerosol parti-cle time-of-flight mass spectrometry (LAAP-ToF-MS), Atmos.Meas. Tech., 9, 1947–1959, https://doi.org/10.5194/amt-9-1947-2016, 2016.
Gross, D. S., Gälli, M. E., Silva, P. J., and Prather, K. A.: Relativesensitivity factors for alkali metal and ammonium cations in sin-gle particle aerosol time-of-flight mass spectra, Anal. Chem., 72,416–422, 2000.
Hagemann, R., Corsmeier, U., Kottmeier, C., Rinke, R., Wieser, A.,and Vogel, B.: Spatial variability of particle number concentra-
www.atmos-meas-tech.net/11/2325/2018/ Atmos. Meas. Tech., 11, 2325–2343, 2018

2342 X. Shen et al.: Single-particle reference mass spectra and classification of atmospheric particles
tions and NOx in the Karlsruhe (Germany) area obtained with themobile laboratory “AERO-TRAM”, Atmos. Environ., 94, 341–352, 2014.
Hinz, K. P., Greweling, M., Drews, F., and Spengler, B.: Data pro-cessing in on-line laser mass spectrometry of inorganic, organic,or biological airborne particles, J. Am. Soc. Mass Spectr., 10,648–660, 1999.
Jimenez, J. L., Canagaratna, M. R., Donahue, N. M., Prevot, A. S.H., Zhang, Q., Kroll, J. H., DeCarlo, P. F., Allan, J. D., Coe,H., Ng, N. L., Aiken, A. C., Docherty, K. S., Ulbrich, I. M.,Grieshop, A. P., Robinson, A. L., Duplissy, J., Smith, J. D., Wil-son, K. R., Lanz, V. A., Hueglin, C., Sun, Y. L., Tian, J., Laak-sonen, A., Raatikainen, T., Rautiainen, J., Vaattovaara, P., Ehn,M., Kulmala, M., Tomlinson, J. M., Collins, D. R., Cubison, M.J., Dunlea, E. J., Huffman, J. A., Onasch, T. B., Alfarra, M. R.,Williams, P. I., Bower, K., Kondo, Y., Schneider, J., Drewnick,F., Borrmann, S., Weimer, S., Demerjian, K., Salcedo, D., Cot-trell, L., Griffin, R., Takami, A., Miyoshi, T., Hatakeyama, S.,Shimono, A., Sun, J. Y., Zhang, Y. M., Dzepina, K., Kimmel, J.R., Sueper, D., Jayne, J. T., Herndon, S. C., Trimborn, A. M.,Williams, L. R., Wood, E. C., Middlebrook, A. M., Kolb, C.E., Baltensperger, U., and Worsnop, D. R.: Evolution of organicaerosols in the atmosphere, Science, 326, 1525–1529, 2009.
Johnston, M. V.: Sampling and analysis of individual particles byaerosol mass spectrometry, J. Mass Spectrom., 35, 585–595,2000.
Kamphus, M., Ettner-Mahl, M., Brands, M., Curtius, J., Drewnick,F., and Borrmann, S.: Comparison of two aerodynamic lensesas an inlet for a single particle laser ablation mass spectrometer,Aerosol Sci. Tech., 42, 970–980, 2008.
Kulkarni, P., Baron, P. A., and Willeke, K.: Aerosol measurement:Principles,techniques, and applications, Wiley, J & Sons, Inc.,2011.
Li, L., Huang, Z. X., Dong, J. G., Li, M., Gao, W., Nian, H. Q.,Fu, Z., Zhang, G. H., Bi, X. H., Cheng, P., and Zhou, Z.: Realtime bipolar time-of-flight mass spectrometer for analyzing sin-gle aerosol particles, Int. J. Mass Spectrom., 303, 118–124, 2011.
Li, W., Sun, J., Xu, l., Shi, Z., Riemer, N., Sun, Y., Fu, P., Zhang, J.,Lin, Y., Wang, X., Shao, L., Chen, J., Zhang, X., Wang, Z., andWang, W.: A conceptual framework for mixing structures in in-dividual aerosol particles, J. Geophys. Res.-Atmos., 121, 13784–13798, 2016.
Lin, Q., Zhang, G., Peng, L., Bi, X., Wang, X., Brechtel, F. J., Li,M., Chen, D., Peng, P., Sheng, G., and Zhou, Z.: In situ chemicalcomposition measurement of individual cloud residue particles ata mountain site, southern China, Atmos. Chem. Phys., 17, 8473–8488, https://doi.org/10.5194/acp-17-8473-2017, 2017.
Liu, P., Ziemann, P. J., Kittelson, D. B., and McMurry, P. H.: Gen-erating particle beams of controlled dimensions and divergence:II. Experimental evaluation of particle motion in aerodynamiclenses and nozzle expansions, Aerosol Sci. Tech., 22, 314–324,1995.
Marsden, N., Flynn, M. J., Taylor, J. W., Allan, J. D., and Coe,H.: Evaluating the influence of laser wavelength and detec-tion stage geometry on optical detection efficiency in a single-particle mass spectrometer, Atmos. Meas. Tech., 9, 6051–6068,https://doi.org/10.5194/amt-9-6051-2016, 2016.
Marsden, N. A., Flynn, M. J., Allan, J. D., and Coe, H.:Online differentiation of mineral phase in aerosol particles
by ion formation mechanism using a LAAP-TOF single-particle mass spectrometer, Atmos. Meas. Tech., 11, 195–213,https://doi.org/10.5194/amt-11-195-2018, 2018.
Moffet, R. C., de Foy, B., Molina, L. T., Molina, M. J., and Prather,K. A.: Measurement of ambient aerosols in northern Mexico Cityby single particle mass spectrometry, Atmos. Chem. Phys., 8,4499–4516, https://doi.org/10.5194/acp-8-4499-2008, 2008.
Murphy, D. M.: The design of single particle laser mass spectrome-ters, Mass Spectrom. Rev., 26, 150–165, 2007.
Murphy, D. M., Middlebrook, A. M., and Warshawsky, M.: Clusteranalysis of data from the Particle Analysis by Laser Mass Spec-trometry (PALMS) instrument, Aerosol Sci. Tech., 37, 382–391,2003.
Murphy, D. M., Cziczo, D. J., Froyd, K. D., Hudson, P. K., Matthew,B. M., Middlebrook, A. M., Peltier, R. E., Sullivan, A., Thom-son, D. S., and Weber, R. J.: Single-particle mass spectrometryof tropospheric aerosol particles, J. Geophys. Res.-Atmos., 111,D23S32, https://doi.org/10.1029/2006JD007340, 2006.
Noble, C. A. and Prather, K. A.: Real-time single particle massspectrometry: a historical review of a quarter century of thechemical analysis of aerosols, Mass Spectrom. Rev., 19, 248–274, 2000.
Pöschl, U.: Atmospheric aerosols: Composition, transformation,climate and health effects, Angew. Chem. Int. Edit., 44, 7520–7540, 2005.
Pratt, K. A. and Prather, K. A.: Mass spectrometry of atmosphericaerosols-Recent developments and applications. Part II: On-linemass spectrometry techniques, Mass Spectrom. Rev., 31, 17–48,2012.
Ramisetty, R., Abdelmonem, A., Shen, X., Saathoff, H., Leisner,T., and Mohr, C.: Exploring femtosecond laser ablation in singleparticle aerosol mass spectrometry, Atmos. Meas. Tech. Discuss.,https://doi.org/10.5194/amt-2017-357, in review, 2017.
Reitz, P., Zorn, S. R., Trimborn, S. H., and Trimborn, A. M.: Anew, powerful technique to analyze single particle aerosol massspectra using a combination of OPTICS and the fuzzy c-meansalgorithm, J. Aerosol Sci., 98, 1–14, 2016.
Roth, A., Schneider, J., Klimach, T., Mertes, S., van Pinxteren,D., Herrmann, H., and Borrmann, S.: Aerosol properties, sourceidentification, and cloud processing in orographic clouds mea-sured by single particle mass spectrometry on a central Europeanmountain site during HCCT-2010, Atmos. Chem. Phys., 16, 505–524, https://doi.org/10.5194/acp-16-505-2016, 2016.
Saathoff, H., Möhler, O., Schurath, U., Kamm, S., Dippel, B., andMihelcic, D.: The AIDA soot aerosol characterisation campaign1999, J. Aerosol Sci., 34, 1277–1296, 2003.
Saathoff, H., Naumann, K.-H., Möhler, O., Jonsson, Å. M., Hal-lquist, M., Kiendler-Scharr, A., Mentel, Th. F., Tillmann, R., andSchurath, U.: Temperature dependence of yields of secondary or-ganic aerosols from the ozonolysis of α-pinene and limonene,Atmos. Chem. Phys., 9, 1551–1577, https://doi.org/10.5194/acp-9-1551-2009, 2009.
Schill, G. P. and Tolbert, M. A.: Heterogeneous ice nucleationon phase-separated organic-sulfate particles: effect of liquidvs. glassy coatings, Atmos. Chem. Phys., 13, 4681–4695,https://doi.org/10.5194/acp-13-4681-2013, 2013.
Schmidt, S., Schneider, J., Klimach, T., Mertes, S., Schenk, L. P.,Kupiszewski, P., Curtius, J., and Borrmann, S.: Online single par-ticle analysis of ice particle residuals from mountain-top mixed-
Atmos. Meas. Tech., 11, 2325–2343, 2018 www.atmos-meas-tech.net/11/2325/2018/

X. Shen et al.: Single-particle reference mass spectra and classification of atmospheric particles 2343
phase clouds using laboratory derived particle type assignment,Atmos. Chem. Phys., 17, 575–594, https://doi.org/10.5194/acp-17-575-2017, 2017.
Schreiner, J., Schild, U., Voigt, C., and Mauersberger, K.: Focusingof aerosols into a particle beam at pressures from 10 to 150 Torr,Aerosol Sci. Tech., 31, 373–382, 1999.
Seinfeld, J. H. and Pandis, S. N.: Atmospheric chemistry andphysics: From air pollution to climate change, Wiley, J & Sons,Inc., Hoboken, New Jersey, 2006.
Silva, P. J., Carlin, R. A., and Prather, K. A.: Single particle analysisof suspended soil dust from Southern California, Atmos. Envi-ron., 34, 1811–1820, 2000.
Su, Y. X., Sipin, M. F., Furutani, H., and Prather, K. A.: Develop-ment and characterization of an aerosol time-of-flight mass spec-trometer with increased detection efficiency, Anal. Chem., 76,712–719, 2004.
Tsigaridis, K., Krol, M., Dentener, F. J., Balkanski, Y., Lathière, J.,Metzger, S., Hauglustaine, D. A., and Kanakidou, M.: Changein global aerosol composition since preindustrial times, Atmos.Chem. Phys., 6, 5143–5162, https://doi.org/10.5194/acp-6-5143-2006, 2006.
Usher, C. R., Michel, A. E., and Grassian, V. H.: Reactions on min-eral dust, Chem. Rev., 103, 4883–4939, 2003.
Wagner, R., Kaufmann, J., Möhler, O., Saathoff, H., Schnaiter,M., Ullrich, R., and Leisner, T.: Heterogeneous ice nu-cleation ability of NaCl and sea salt aerosol particlesat cirrus temperatures, J. Geophys. Res., 123, 2841–2860,https://doi.org/10.1002/2017JD027864, 2018.
Williams, L. R., Gonzalez, L. A., Peck, J., Trimborn, D., McIn-nis, J., Farrar, M. R., Moore, K. D., Jayne, J. T., Robinson, W.A., Lewis, D. K., Onasch, T. B., Canagaratna, M. R., Trimborn,A., Timko, M. T., Magoon, G., Deng, R., Tang, D., de la RosaBlanco, E., Prévôt, A. S. H., Smith, K. A., and Worsnop, D. R.:Characterization of an aerodynamic lens for transmitting parti-cles greater than 1 micrometer in diameter into the Aerodyneaerosol mass spectrometer, Atmos. Meas. Tech., 6, 3271–3280,https://doi.org/10.5194/amt-6-3271-2013, 2013.
Wonaschuetz, A., Kallinger, P., Szymanski, W., and Hitzenberger,R.: Chemical composition of radiolytically formed particles us-ing single-particle mass spectrometry, J. Aerosol Sci., 113, 242–249, 2017.
Yu, J. Z., Cocker, D. R., Griffin, R. J., Flagan, R. C., and Seinfeld,J. H.: Gas-phase ozone oxidation of monoterpenes: Gaseous andparticulate products, J. Atmos. Chem., 34, 207–258, 1999.
Zawadowicz, M. A., Abdelmonem, A., Mohr, C., Saathoff, H.,Froyd, K. D., Murphy, D. M., LeisnerI, T., and Cziczo, D.J.: Single-particle time-of-flight mass spectrometry utilizing afemtosecond desorption and ionization laser, Anal. Chem., 87,12221–12229, 2015.
Zawadowicz, M. A., Lance, S., Jayne, J. T., Croteau, P., Worsnop,D. R., Mahrt, F., Leisner, T., and Cziczo, D. J.: Quantifying andimproving the performance of the Laser Ablation Aerosol Par-ticle Time of Flight Mass Spectrometer (LAAPToF) instrument,Atmos. Meas. Tech. Discuss., https://doi.org/10.5194/amt-2017-1, 2017.
Zelenyuk, A. and Imre, D.: Single particle laser ablation time-of-flight mass spectrometer: An introduction to SPLAT, AerosolSci. Tech., 39, 554–568, 2005.
Zelenyuk, A., Cai, Y., and Imre, D.: From agglomerates of spheresto irregularly shaped particles: Determination of dynamic shapefactors from measurements of mobility and vacuum aerodynamicdiameters, Aerosol Sci. Tech., 40, 197–217, 2006a.
Zelenyuk, A., Imre, D., Cai, Y., Mueller, K., Han, Y. P., and Im-rich, P.: SpectraMiner, an interactive data mining and visualiza-tion software for single particle mass spectroscopy: A laboratorytest case, Int. J. Mass Spectrom., 258, 58–73, 2006b.
Zelenyuk, A., Yang, J., Choi, E., and Imre, D.: SPLAT II: An aircraftcompatible, ultra-sensitive, high precision instrument for in-situcharacterization of the size and composition of fine and ultrafineparticles, Aerosol Sci. Tech., 43, 411–424, 2009.
Zhang, Q., Jimenez, J. L., Canagaratna, M. R., Allan, J. D., Coe,H., Ulbrich, I., Alfarra, M. R., Takami, A., Middlebrook, A.M., Sun, Y. L., Dzepina, K., Dunlea, E., Docherty, K., De-Carlo, P. F., Salcedo, D., Onasch, T., Jayne, J. T., Miyoshi,T., Shimono, A., Hatakeyama, S., Takegawa, N., Kondo, Y.,Schneider, J., Drewnick, F., Borrmann, S., Weimer, S., Demer-jian, K., Williams, P., Bower, K., Bahreini, R., Cottrell, L.,Griffin, R. J., Rautiainen, J., Sun, J. Y., Zhang, Y. M., andWorsnop, D. R.: Ubiquity and dominance of oxygenated speciesin organic aerosols in anthropogenically-influenced NorthernHemisphere midlatitudes, Geophys. Res. Lett., 34, L13801,https://doi.org/10.1029/2007GL029979, 2007.
Zhao, W. X., Hopke, P. K., and Prather, K. A.: Comparison of twocluster analysis methods using single particle mass spectra, At-mos. Environ., 42, 881–892, 2008.
www.atmos-meas-tech.net/11/2325/2018/ Atmos. Meas. Tech., 11, 2325–2343, 2018