laser induced breakdown spectroscopy in water for elemental analysis. satyanarayan ray pitambar...
TRANSCRIPT

Laser Induced breakdown spectroscopy in Water for
elemental analysis.
Satyanarayan Ray Pitambar Mohapatra
Project Guide: Dr. R.K. Thareja

Advantages of LIBS technique
• Can be used for rapid and remote analysis.
• Real time analysis possible.
• Complete elemental coverage can be achieved.
• The analysis spot size is small.
• Relatively low detection limit ( ppm/ppb).

Possible application
• Detection of elements in nuclear reactors.• Detection of elements inside deep sea.• Space mission; detection of elements in other planets.• Environmental monitoring (soil contamination,
particulates) .• Materials analysis (metals, plastics). • Forensics and biomedical studies (teeth, bones analysis). • Military and safety needs (explosive particles, chemical
and biological warfare agents e.g. Anthrax). • Art restoration/conservation (pigments, precious/ancient
metals).

LIBS on Mars !
• A 300 mJ laser pulse can detect from 25m away.
• A 2 J laser pulse can detect from 100m away.
photo credit:
Chemistry Division , Los Alamos National Laboratory
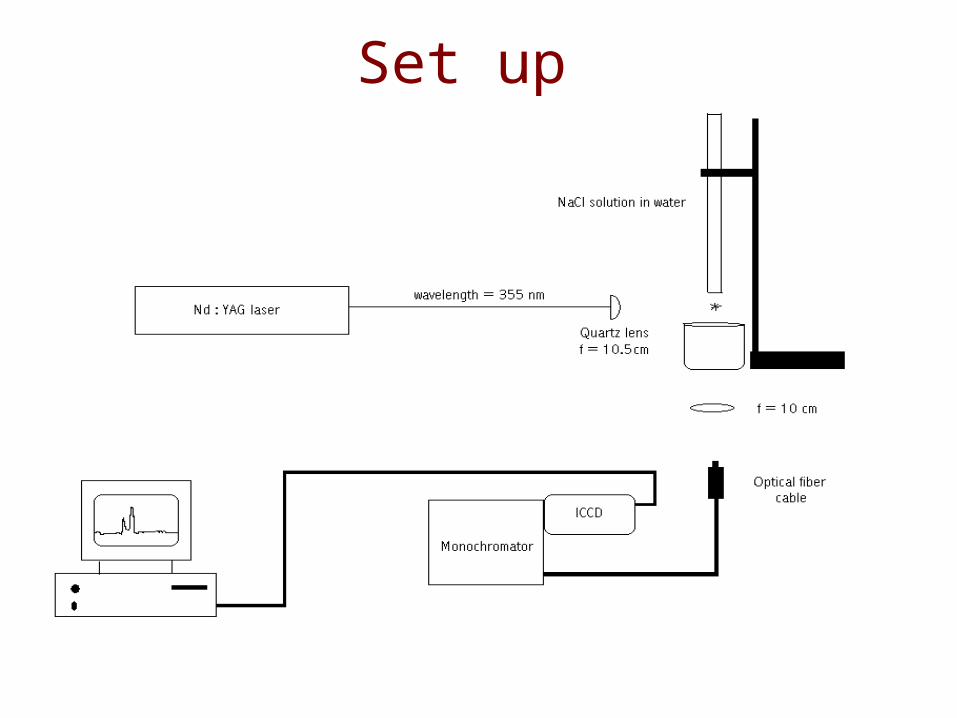
Set up
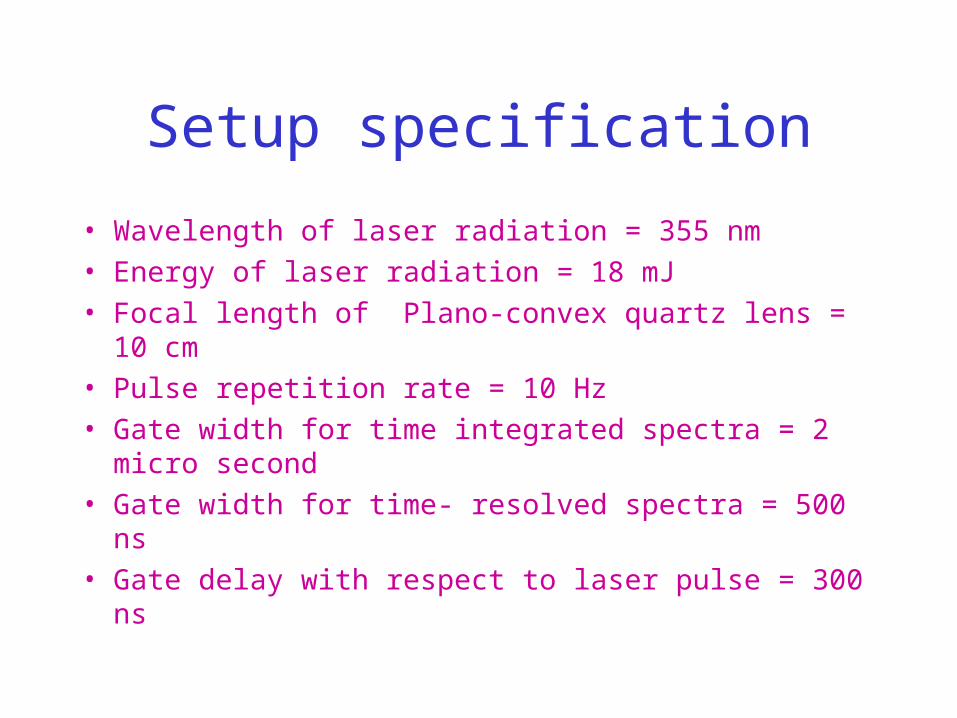
Setup specification
• Wavelength of laser radiation = 355 nm
• Energy of laser radiation = 18 mJ
• Focal length of Plano-convex quartz lens = 10 cm
• Pulse repetition rate = 10 Hz
• Gate width for time integrated spectra = 2 micro second
• Gate width for time- resolved spectra = 500 ns
• Gate delay with respect to laser pulse = 300 ns

Advantages of water based test samples
• Relatively low conc. Solution (ppm) can be prepared.
• Solution in water are more homogeneous than solid ( so spatial variation of concentration is not there).

Why Na ?
• Easily available element to start with.
• To determine the concentration of Na in sea ice.
• Na concentration in blood and cells.

Typical sodium lines time integrated
• Na I 589 nm
( 3s 2S-3p 2P0)( J = 1)
D1 line
• Na I 589.6 nm
( 3s 2S-3p 2P0)( J = 0)
D2 line480 500 520 540 560 580 600 620 640
0
1000
2000
3000
4000
5000
6000
29 Sept. 2003
D2
D1
Sodium lines
Inte
nsi
ty -
-->
Pixel ( wavelength) --->
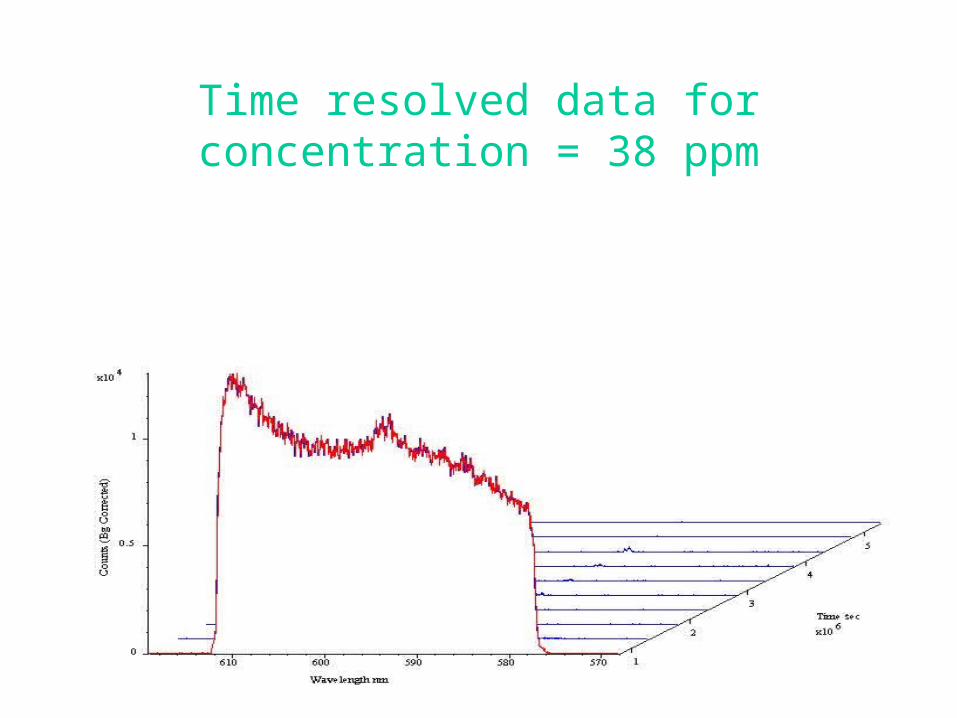
Time resolved data for concentration = 38 ppm

Time resolved observation for concentration = 102 ppm, gate delay = 300 ns

Time resolved data of Sodium line for Concentration = 409 ppm, gate delay = 300 ns

Calibration curve D2 line
• Detection limit = 3σ /m• Detection limit observed
= (123 + 17) ppm
0 200 400 600 800
0
500
1000
1500
2000
2500
3000
3500
4000
29 Sept. 2003
Resolution limit = 3/m = 123 ppm
D2 line of Na
Inte
nsity
(as
num
ber o
f cou
nts)
--->
Conc. in ppm --->

Calibration curve for D1 line
0 200 400 600 800
0
1000
2000
3000
4000
5000
6000
29 Sept. 2003
limit of resolution = 3/B =116
D1 line of NaInte
nsi
ty (
as
nu
mb
er
of c
ou
nts
) --
->
Conc. in ppm --->
• Detection limit = 3σ/m
• Detection limit observed = (116+13) ppm

Calibration curve D2 line
• Detection limit = 3σ/m
• Detection limit observed = (19+ 5) ppm
0 10 20 30 40 50 601200
1400
1600
1800
2000
2200
2400
31 October, 2003
Conc. in ppm
Inte
nsi
ty (
as
nu
mb
er
of
cou
nts
)D2 line of Na

Calibration curve for D1 line
• Detection limit = 3σ/m
• Detection limit observed = (7.8+3) ppm
0 10 20 30 40 50 602000
2200
2400
2600
2800
3000
3200
31 October, 2003
D1 line of Na
Inte
nsity
( a
s nu
mbe
r of
cou
nts)
Conc. in ppm

Detection limit optimization
• Two types of background noise; plasma continuum & detector noise.
• Optimization
Optimum gating time & optimum position
of detector.
Study of temporal and spatial expansion of plasma in air.

Problems to be fixed and future plans
• An actual set up should have the capability to distinguish among several elements.
• For that suitable wavelength of laser radiation to be decided.
• Suitable energy of laser radiation to be determined.• Plasma parameters (plasma temperature, plasma
density) to be determined for different elements.• The LIBS method should be compared with other
standard authentic methods.• Salt solution of sodium and magnesium in the form of
ice cubes to be analyzed.