late miocene to pleistocene paleoceanographic - global change
TRANSCRIPT

www.elsevier.com/locate/palaeo
Palaeogeography, Palaeoclimatology, P
Late Miocene to Pleistocene paleoceanographic records from the
Feni and Gardar Drifts: Pliocene reduction in abyssal flow
N.J.C. Hassold a,*, D.K. Rea a, B.A. van der Pluijm a, J.M. Pares a,
J.D. Gleason a, A.C. Ravelo b
a Department of Geological Sciences, University of Michigan, Ann Arbor, MI, USAb Ocean Sciences Program, University of California, Santa Cruz, Santa Cruz, CA, USA
Received 28 January 2004; received in revised form 2 August 2005; accepted 2 November 2005
Abstract
Magnetic fabric analyses from two North Atlantic drift deposits provide proxies for determining relative variations in the
strength of abyssal flow over the last 10 my. The data show a cessation of current-controlled sedimentation at the shallower Feni
Drift (2417 m) at the time of onset of Northern Hemisphere glaciation (2.6 Ma). Drift formation ended nearly 2 my earlier (4.2 Ma)
at the deeper Gardar Drift (3220 m), implying stepwise reduction in deep-water flow. Relatively light d18O values at the deeper
Gardar Drift indicate a warmer, thus also more salty, water mass site prior to 6 Ma. We interpret this as representing Mediterranean
Sea water, which flowed north at depths greater than that of the Feni Drift Site. The supply of Mediterranean Water to the North
Atlantic was shut off as the Gibraltar Straits closed, causing the Messinian salinity crisis, and never returned to that position in the
water column after the Mediterranean opened again.
D 2005 Elsevier B.V. All rights reserved.
Keywords: DSDP Sites 610 and 611; North Atlantic; Drift deposits; Magnetic fabric; Paleoceanography
1. Introduction
Global climate is greatly influenced by ocean circu-
lation, especially the formation of cold, deep water at
high latitudes and the concomitant movement of warm
surface water away from the equator; this has been
called the ocean bconveyorQ (Broecker, 1991;Wold,
1994; Jansen and Raymo, 1996; Hansen et al., 2004).
In the North Atlantic, the Gulf Stream brings warm,
saline water to the Norwegian–Greenland Sea, where
these waters cool and sink, forming the North Atlantic
0031-0182/$ - see front matter D 2005 Elsevier B.V. All rights reserved.
doi:10.1016/j.palaeo.2005.11.011
* Corresponding author.
E-mail address: [email protected] (N.J.C. Hassold).
Deep Water (NADW) (Howe et al., 1994; Wold, 1994).
Over geologic time, the deepening of the Icelandic
gateways has controlled this formation of NADW, spe-
cifically the subsidence of the Greenland–Iceland–Scot-
land Ridge (Jansen and Raymo, 1996; Wright and
Miller, 1996). Here, waters flowing south from the
Norwegian Sea divide: one branch flows over the Ice-
land–Faeroe Ridge and enters the Iceland Basin; the
other branch flows over the Wyville-Thompson Ridge,
enters the Rockall Trough, flows around the Rockall-
Hatton Bank and then into the Iceland Basin (Fig. 1). In
the Iceland Basin, this water mixes with water from the
flow over the Iceland–Faeroe Ridge, flows along the
Reykjanes Ridge through the Charlie-Gibbs Fracture
Zone and into the western North Atlantic (Fig. 1).
alaeoecology 236 (2006) 290–301

Fig. 1. Location of DSDP Leg 94 Sites 610 (Feni Drift, 2417m depth) and 611 (Gardar Drift, 3220 m depth) (after Kidd and Hill, 1987). Depths
shown in meters.
N.J.C. Hassold et al. / Palaeogeography, Palaeoclimatology, Palaeoecology 236 (2006) 290–301 291
These flows move along the seafloor where they entrain
and transport sediment, commonly depositing them
parallel to the deep-sea topography when the current
velocity decreases, forming drift deposits. Drift deposits
are hundreds of kilometers in length, relatively narrow,
may have wave-like bed forms and are associated with
strong deep-sea currents (Wold, 1994; ODP, Shipboard
Scientific Party, 1998).
Drift deposits contain physical and sedimentological
records of their depositional history. Using anisotropy
of magnetic susceptibility (AMS) and particle size
analysis, Ellwood and Ledbetter (1977, 1979) and Ell-
wood et al. (1979) studied past current flow velocities
in the Vema Channel. In general, they determined a
direct relationship between the magnetic fabric
strength, AMS, grain size and current velocity; stronger
fabric and coarser grain size were indicative of higher
current velocity.
Joseph et al. (1998) combined the use of magnetic
fabric analysis and grain size distribution to estimate
depositional energy fields for samples from the Blake
Outer Ridge and the Bermuda Rise sediment drifts and
the Delgada Deep Sea Fan offshore from northern
California. They found that the combination of mag-
netic fabric and grain-size distribution define specific
sediment depositional fields—eolian, hemipelagic mud,
drift deposits and turbidites. The magnetic fabric
strength is a measure of grain alignment; in samples
where the sediment grains are randomly oriented, there
is no fabric. Abyssal flow aligns the grains; the strength
of the current influences the median grain size and the
grain-size distribution in addition to the strength of the
magnetic fabric (Rea and Hovan, 1995; Joseph et al.,
1998). These methods have successfully been applied
to studies of drift deposits on the Kerguelen Plateau in
the southern Indian Ocean (Joseph et al., 2002) and the
Campbell Plateau, east of New Zealand (Joseph et al.,
2004).
Here we present a reconnaissance study of drift
deposits in the North Atlantic that spans late Miocene
to Pleistocene time, a period that encompasses much of
the late Cenozoic global cooling. In addition to sedi-
ment composition, mass accumulation rate and stable
isotopic signatures of benthic foraminifera, we deter-
mined the magnetic fabric of the bulk sediment. The
radiogenic isotope geochemistry of terrigenous grains
extracted from a few samples provides an indication of
their provenance. These data were obtained with the
goal of examining the general history of late Cenozoic
abyssal flow in the North Atlantic.

Fig. 2. Age models and linear sedimentation rates for Sites 610 and
611. Ages for sediments from Hole 611C and sediments younger than
8 Ma for Hole 610 were determined using the 1995 Cande and Kent
timescale (Cande and Kent, 1995). Approximate biostratigraphic ages
for the four oldest samples from Hole 610 were determined using the
nannofossil zones as given by Takayama and Sato (1987) and refer-
ring to the Berggren et al. (1995) timescale.
N.J.C. Hassold et al. / Palaeogeography, Palaeoclimatology, Palaeoecology 236 (2006) 290–301292
1.1. Geologic setting and samples
Sites occupied during Leg 94 of the Deep Sea
Drilling Project (DSDP) were usually located on drift
deposits (Fig. 1). The Feni Drift lies where Norwegian
Sea Overflow Water (NSOW) flows over the Wyville-
Thompson Ridge and down through the Rockall
Trough. The Gardar Drift is a large (1000 km long)
drift deposit located along the lower eastern flank of the
Reykjanes Ridge, where water from the Iceland Basin
flows south toward the Charlie-Gibbs Fracture Zone
and on into the western Atlantic Basin. Both drifts
have large-scale wave-like bedforms, but Hailwood et
al. (1987) and Kidd and Hill (1987) found no consistent
link between these wave fields and present bottom
water flow. They concluded that the sediment waves
are relict features that migrated during the late Pliocene,
due to a more vigorous NSOW, but that the migration
ceased at the Plio/Pleistocene boundary and ensuing
pelagic sediments drape the sediment waves.
For this reconnaissance investigation of the North
Atlantic drifts, 38 separate sample pairs (adjacent sedi-
ment scoop samples and paleomagnetic cube samples),
17 from the Feni Drift and 21 from the Gardar Drift,
were obtained from cores recovered at DSDP Sites 610
and 611. Site 610 was drilled on the southern end of the
Feni Drift (53813.5VN, 18853.7VW, 2417 m water depth)
and recovered nannofossil ooze and chalk. Accumula-
tion of sediments at the Feni Drift is believed to have
started around the time of the Eocene–Oligocene bound-
ary (Kidd and Hill, 1987; Jansen and Raymo, 1996); the
oldest sediment recovered at Site 610 was late early
Miocene in age (Ruddiman et al., 1987a; Howe et al.,
1994; Wold, 1994). Site 611 was drilled in the trough of
a sediment wave at the southern end of the Gardar Drift
(52850.5VN, 30818.6VW, 3220 m water depth) and re-
covered marly nannofossil chalk. Accumulation on the
Gardar Drift began in the middle to early–late Miocene;
the oldest sediments recovered at this site are late Mio-
cene in age (Ruddiman et al., 1987b; Wold, 1994;
Jansen and Raymo, 1996). For this study, we sampled
cores from Holes 610, 610A and 611C.
2. Methods
2.1. Age and age models
Ages were determined by magnetic reversal stratig-
raphy for all of the sediments from Hole 611C and for
sediments younger than 8 Ma for Hole 610 using the
1995 Cande and Kent timescale (Cande and Kent,
1995). Approximate biostratigraphic ages for the four
oldest samples from Hole 610 were determined using
the nannofossil zones as given by Takayama and Sato
(1987) and referring to the Berggren et al. (1995)
timescale (Fig. 2). Fluxes were calculated using the
linear sedimentation rate (LSR) as shown on Fig. 2
and the dry bulk density (DBD) data for each site
taken from the Leg 94 Initial Reports (Ruddiman et
al., 1987a; Ruddiman et al., 1987b). Mass accumulation
rates (MAR) of the sediment components were calcu-
lated using the % terrigenous component or % CaCO3
and the flux (MAR component=LSR�DBD�% com-
ponent). These data are summarized in Tables 1 and 2.
2.2. Carbonate fraction determination
Carbonate concentrations of the bulk sample were
determined by measuring the volume of CO2 released
when each sample was treated with 3 N HCl–the car-
bonate bomb method–as described by Muller and Gast-
ner (1971). The resulting percentages are accurate to F1 wt.% (Tables 1 and 2).
2.3. Terrigenous fraction determination
Sediment samples were freeze-dried and the terrige-
nous component was isolated using the chemical ex-
traction method described by Rea and Janecek (1981)
as modified by Hovan (1995), which removes carbo-
nates, oxides and hydroxides and biogenic silica.
Weight percent terrigenous component data are accurate
to F 2% to 3% of the values (Tables 1 and 2).

Table 1
Data for Feni Drift Site 610
Sample #
hole-core section
Depth
(mbsf)
Age
(Ma)
Granisize
(U50)
Granisize
(Am)
%
CaCO3
% terrigenous
component
MAR
(g/cm2/ky)
CaCO3 MAR
(g/cm2/ky)
Terrigenous
MAR (g/cm2/ky)
PV T Bulk susc.
(�10�6 SI)d13C
(x)
d18C
(x)
610A-1-3 4.16 0.087 6.4 11.84 43.4 33.1 5.19 2.25 1.72 1.015 0.139 277 0.91 3.83
610A-3-2 20.47 0.426 7.14 7.09 74.5 10.4 5.19 3.87 0.54 1.024 0.048 134
610A-5-3 41.5 0.865 6.38 12.01 28.6 46.4 5.19 1.49 2.41 0.037 0.668 608 0.50 3.83
610A-7-3 61.3 1.277 6.44 11.52 61.3 18.2 5.19 3.19 0.94 1.021 0.126 208 1.02 2.78
610A-9-3 80.04 1.668 6.33 12.43 78.1 8.4 5.19 4.06 0.43 1.034 �0.048 99 1.17 2.99
610A-11-3 98.78 2.058 5.62 20.33 80.2 6.3 5.19 4.17 0.33 1.046 �0.149 66
610A-13-3 118.44 2.468 6.71 9.55 76.8 8.5 5.19 3.99 0.44 1.021 �0.029 152 0.23 2.57
610A-15-3 137.64 2.868 6.35 12.26 82.2 7.5 5.19 4.27 0.39 1.332 �0.206 10
610A-17-3 156.1 3.198 6.23 13.32 93.3 2.5 2.63 2.45 0.07 1.448 0.392 �8 0.41 2.32
610A-19-3 175.86 3.995 5.94 16.29 93.1 2.5 2.63 2.45 0.07 1.275 0.384 �12 1.08 2.43
610A-21-3 194.58 4.750 6.91 8.32 92.8 3.4 2.63 2.44 0.09 1.258 0.372 �13 0.74 2.19
610-10-3 237.22 5.839 6.08 14.78 97.1 3.0 4.04 3.92 0.12 1.257 0.435 �13 0.83 2.19
610-11-2 302.16 7.544 5.3 25.38 95.3 2.3 4.04 3.85 0.09 1.296 0.344 �11 0.97 2.14
610-13-1 359.06 9.037 6.33 12.43 89.9 3.4 4.19 3.76 0.14 2.175 0.486 �4 0.97 2.13
610-14-2 408.32 10.330 5.71 19.10 94.5 13.7 4.19 3.96 0.57 1.355 0.311 �9 1.24 1.77
610-15-3 458 11.634 6.86 8.61 92.6 2.0 4.19 3.88 0.08 1.292 0.331 �11 1.07 1.98
610-16-4 507.87 12.943 6.34 12.34 93.4 6.1 4.19 3.91 0.26 1.409 0.263 �9 1.24 1.80
N.J.C
.Hasso
ldet
al./Palaeogeography,Palaeoclim
atology,Palaeoeco
logy236(2006)290–301
293

Table 2
Data for Gardar Drift Site 611
Sample
# hole-core section
Depth
(mbsf)
Age
(Ma)
Granisize
(U50)
Granisize
(Am)
%
CaCO3
% terrigenous
component
MAR
(g/cm2/ky)
CaCO3 MAR
(g/cm2/ky)
Terrigenous
MAR (g/cm2/ky)
PV T Bulk susc.
(�10�6 SI)d13C
(x)
d18C
(x)
611C-2-2 4.44 0.085 5.7 19.24 74.4 5.8 3.46 2.57 0.20 1.013 0.667 293 0.709 2.757
611C-4-2 14.46 0.277 5.85 17.34 68.1 6.8 3.46 2.35 0.23 1.011 �0.244 423 0.785 3.566
611C-6-2 33.96 0.651 5.88 16.98 54.7 22.7 3.46 1.89 0.78 1.009 0.751 606 0.534 3.295
611C-8-2 53.12 1.018 6.75 9.29 64.4 15.7 3.46 2.23 0.54 1.015 0.651 1007 0.707 27.65
611C-10-2 72.32 1.385 6.68 9.75 55.0 17.6 3.46 1.90 0.61 1.004 �0.236 1282 1.163 29.40
611C-12-2 91.87 1.760 6.52 10.90 53.2 18.1 3.46 1.84 0.62 1.009 �0.256 877
611C-14-2 110.7 2.121 5.7 19.24 48.8 24.5 3.46 1.69 0.85 1.007 0.037 962
611C-16-2 129.94 2.489 6.22 13.42 15.3 32.5 3.46 0.53 1.12 1.008 0.525 1281
611C-18-2 149.68 2.867 6.52 10.90 68.7 8.6 3.46 2.38 0.30 1.011 �0.048 316 0.033 2.434
611C-20-2 168.24 3.223 6.1 14.58 85.7 5.9 3.46 2.96 0.20 1.025 0.112 185 0.793 2.310
611C-22-2 187 3.582 6.82 8.85 77.0 8.8 3.46 2.66 0.30 1.011 �0.434 305 0.765 2.497
611C-24-2 207.08 3.967 7.07 7.44 68.0 9.1 3.46 2.35 0.31 1.011 0.128 509 �0.926 2.607
611C-26-2 225.34 4.317 7.7 4.81 92.1 1.1 3.46 3.18 0.04 1.086 �0.210 37 0.918 2.367
611C-28-2 244.57 4.685 6.8 8.97 84.4 4.6 3.46 2.92 0.16 1.034 �0.101 97 0.507 2.065
611C-30-3 266.19 5.099 5.58 20.91 87.8 2.9 3.46 3.03 0.10 1.187 �0.371 16 0.881 2.020
611C-32-1 282.39 5.410 6.85 8.67 88.5 3.4 3.46 3.06 0.12 1.083 �0.213 35 0.384 2.069
611C-35-1 311.14 5.961 6.19 13.70 83.5 5.4 3.46 2.87 0.19 1.061 0.089 64 0.908 2.142
611C-36-1 320.07 6.132 6.03 15.30 75.2 8.7 3.46 2.60 0.30 1.036 0.042 104
611C-38-2 341.63 6.545 5.8 17.95 84.4 5.4 3.46 2.92 0.19 1.137 �0.297 22 0.837 1.526
611C-40-1 358.83 6.874 6.82 8.85 75.0 8.4 3.46 2.59 0.29 1.107 �0.153 29 0.520 1.316
611C-42-1 377.76 7.237 6.37 12.09 76.8 16.0 3.46 2.65 0.55 1.107 �0.143 28 0.838 1.048
N.J.C
.Hasso
ldet
al./Palaeogeography,Palaeoclim
atology,Palaeoeco
logy236(2006)290–301
294

Table 3
Results from radiogenic isotope analyses for selected sediment samples
Sample Depth (mbsf) Age (Ma) 143Nd/144Nda 2�r eNdb 87Sr/86Sr c 2�r
610A-1-3 4.16 0.08 0.512005 F0.000012 �12.3 0.724321 F0.000018
610A-7-3 61.30 1.18 0.512097 F0.000011 �10.6 0.720435 F0.000017
611C-12-2 91.87 1.93 0.512553 F0.000012 �1.7 0.708139 F0.000017
611C-14-2 110.70 2.29 0.512646 F0.000010 +0.2 0.707196 F0.000015
a 143Nd/144Nd normalized to 146Nd/144Nd=0.7219 (2r errors represent in-run precision by TIMS on 150 ratios).b eNd=10
4[(143Nd/144Nd(measured)) / (143Nd/144Nd(bulk earth))�1], where 143Nd/144Nd(bulk earth)=0.512638.
c 87Sr/86Sr normalized to 86Sr/88Sr=0.1194 (2r errors represent in-run precision by TIMS on 150 ratios).
N.J.C. Hassold et al. / Palaeogeography, Palaeoclimatology, Palaeoecology 236 (2006) 290–301 295
2.4. Radiogenic isotope analysis
Four samples of the extracted terrigenous sediment
component (two from the Feni Drift and two from the
Gardar Drift) were analyzed for radiogenic isotope
geochemistry with the goal of constraining provenance
(Table 3, Fig. 3). Samples were digested in screw-top
Savillex beakers on hot plates using a combination of
HF-HNO3, HClO4 and HCl. Rare earth elements
(REE) were separated by conventional cation ex-
change in HCl medium followed by reverse phase
(HDEHP) chromatography to separate Nd and Sm.
Sr was separated on a strontium-specific crown ether
resin (Sr-Spec) on miniaturized columns. Isotopic ra-
tios were determined at the University of Michigan on
a Finnigan 262 Thermal Ionization Mass Spectrometer
equipped with eight collectors using static mode. The
La Jolla Nd and NBS 987 Sr standards gave mean
values of 143Nd/144Nd=0.511849F0.000008 (N =17)
and 87Sr/86Sr=0.710250F000014 (N =74) over the
course of this study, requiring no corrections to the
data (Gleason et al., 2002).
Fig. 3. Radiogenic isotope values for selected samples of terrigenous
sediment from Sites 610 and 611. Values for Site 611 are indicative of
young oceanic crust, while those for Site 610 are indicative of older
continental crust.
2.5. Stable isotope analysis
Oxygen and carbon isotope analyses of foraminifera
were determined at the University of California, Santa
Cruz, light stable isotope facility on a Prism mass spec-
trometer with an on-line automated common acid car-
bonate reaction device (Tables 1 and 2). Analyses were
conducted on benthic foraminiferal tests of Cibicides,
picked individually from each sample and ultrasonically
cleaned and dried. External precision on an in-house
standard (Carrera Marble) and on NBS carbonate stan-
dards is F 0.05% for d13C and F 0.07% for d18O.
2.6. Magnetic analyses
Samples from the DSDP cores contained in plastic
paleomagnetic sampling cubes were measured on a
KLY-2 Kappa Bridge at the University of Michigan to
determine the bulk magnetic susceptibility and the PVand T parameters of the susceptibility ellipsoid (Tables
1 and 2). These latter values denote the anisotropy of
magnetic susceptibility or magnetic fabric of a sample.
Grains that settle through the water column under no
influence from current are randomly oriented in the
depositional plane, while those deposited under the
influence of a current show a preferred orientation or
fabric (Ellwood and Ledbetter, 1977, 1979; Joseph et
al., 1998). PV is magnitude of the anisotropy of the
sample and describes the strength of the magnetic
fabric. T is the shape parameter of the susceptibility
ellipsoid: when 0bT b1, the ellipsoid is oblate (disk-
shaped), if � 1bT b0, it is prolate (cigar-shaped) (Tar-
ling and Hrouda, 1993; Joseph et al., 1998, 2002).
3. Sedimentary record of the Feni and Gardar Drifts
3.1. Site 610: late Cenozoic changes in the Feni Drift
Feni Drift sediment is calcareous ooze, 80–96%
CaCO3, with the remainder being terrigenous mineral
grains (Fig. 4). eNd and87Sr/86Sr values of these mineral
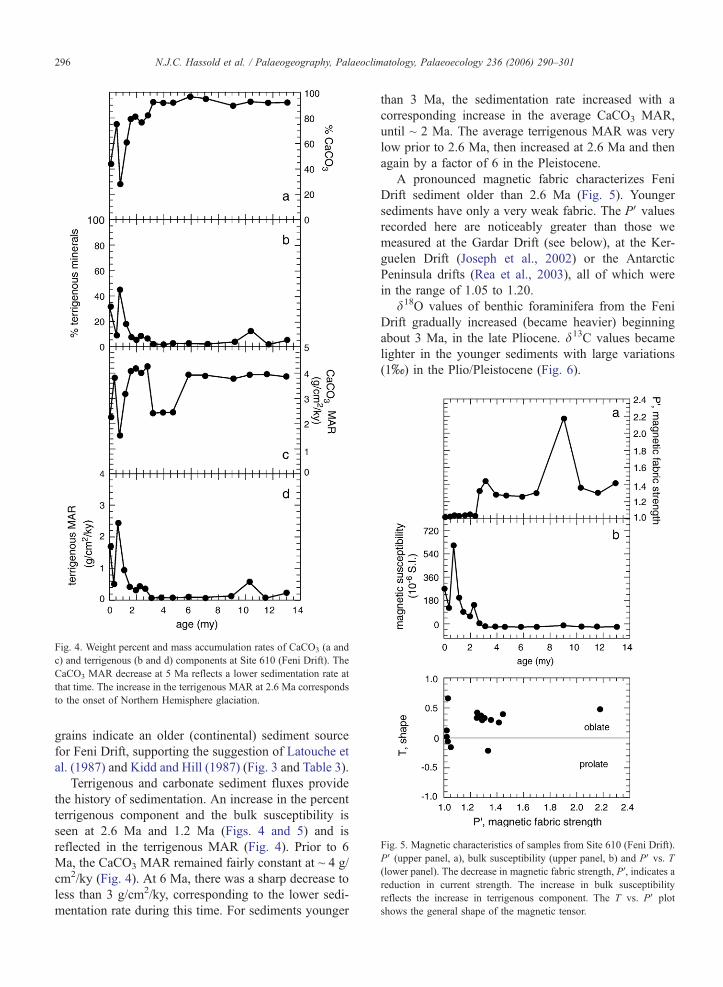
Fig. 4. Weight percent and mass accumulation rates of CaCO3 (a and
c) and terrigenous (b and d) components at Site 610 (Feni Drift). The
CaCO3 MAR decrease at 5 Ma reflects a lower sedimentation rate at
that time. The increase in the terrigenous MAR at 2.6 Ma corresponds
to the onset of Northern Hemisphere glaciation.
Fig. 5. Magnetic characteristics of samples from Site 610 (Feni Drift).
PV (upper panel, a), bulk susceptibility (upper panel, b) and PV vs. T(lower panel). The decrease in magnetic fabric strength, PV, indicates areduction in current strength. The increase in bulk susceptibility
reflects the increase in terrigenous component. The T vs. PV plot
shows the general shape of the magnetic tensor.
N.J.C. Hassold et al. / Palaeogeography, Palaeoclimatology, Palaeoecology 236 (2006) 290–301296
grains indicate an older (continental) sediment source
for Feni Drift, supporting the suggestion of Latouche et
al. (1987) and Kidd and Hill (1987) (Fig. 3 and Table 3).
Terrigenous and carbonate sediment fluxes provide
the history of sedimentation. An increase in the percent
terrigenous component and the bulk susceptibility is
seen at 2.6 Ma and 1.2 Ma (Figs. 4 and 5) and is
reflected in the terrigenous MAR (Fig. 4). Prior to 6
Ma, the CaCO3 MAR remained fairly constant at ~ 4 g/
cm2/ky (Fig. 4). At 6 Ma, there was a sharp decrease to
less than 3 g/cm2/ky, corresponding to the lower sedi-
mentation rate during this time. For sediments younger
than 3 Ma, the sedimentation rate increased with a
corresponding increase in the average CaCO3 MAR,
until ~ 2 Ma. The average terrigenous MAR was very
low prior to 2.6 Ma, then increased at 2.6 Ma and then
again by a factor of 6 in the Pleistocene.
A pronounced magnetic fabric characterizes Feni
Drift sediment older than 2.6 Ma (Fig. 5). Younger
sediments have only a very weak fabric. The PV valuesrecorded here are noticeably greater than those we
measured at the Gardar Drift (see below), at the Ker-
guelen Drift (Joseph et al., 2002) or the Antarctic
Peninsula drifts (Rea et al., 2003), all of which were
in the range of 1.05 to 1.20.
d18O values of benthic foraminifera from the Feni
Drift gradually increased (became heavier) beginning
about 3 Ma, in the late Pliocene. d13C values became
lighter in the younger sediments with large variations
(1x) in the Plio/Pleistocene (Fig. 6).

Fig. 6. d18O (a) and d13C (b) data for Site 610 (Feni Drift). The d18O
values gradually increase beginning around 3 Ma.
Fig. 7. Weight percent and mass accumulation rates of CaCO3 (a and
c) and terrigenous (b and d) components at Site 611 (Gardar Drift)
The CaCO3 MAR decrease occurs around 2 Ma (the very low poin
around 2.5 Ma is an outlier). The terrigenous MAR increases slightly
at 4 Ma and then again at 3 Ma.
N.J.C. Hassold et al. / Palaeogeography, Palaeoclimatology, Palaeoecology 236 (2006) 290–301 297
3.2. Site 611: late Cenozoic changes in the Gardar
Drift
Sediments from the Gardar Drift are also calcareous
ooze with 80–96% CaCO3 and the remainder being
terrigenous material (Fig. 7). Results of the eNd and87Sr/86Sr analyses of the terrigenous component indi-
cate a younger (basaltic) sediment source for the ter-
rigenous minerals in the Gardar Drift (Fig. 3 and Table
3). Bulk susceptibility (Fig. 8) and terrigenous abun-
dance were low during the late Miocene and early
Pliocene and increased at 4.5 Ma and 2.6 Ma (Fig.
7). The CaCO3 MAR was around 2.7 g/cm2/ky and
declined between 4.5 and 2.6 Ma to ~ 2 g/cm2/ky (Fig.
7). Terrigenous MAR increased slightly at 4.5 Ma and
again at 2.6 Ma (Fig. 7).
The magnetic fabric is strong before the early
Pliocene but shows a sharp reduction to low values
beginning about 5.2 Ma, with very low values youn-
ger that 4.2 Ma (Fig. 8). The values prior to 4.2 Ma
are comparable to those obtained by Joseph et al.
(2002) at ODP Site 745 in the southern Indian
Ocean.
At the Gardar Drift, which is the deeper site, d18Ovalues are similar to those at shallower Site 610 in
sediment younger than about 6 Ma. Older samples
show distinctly lighter values for d18O (Fig. 9). d13Cvalues are generally around 0.5x with the exception of
one pronounced negative value of � 1.0x at 4.1 Ma
(Fig. 9).
3.3. Paleoceanography of the North Atlantic drifts
Both sites show changes in the terrigenous and car-
bonate fluxes that occurred around 2.6 Ma,
corresponding to the onset of Northern Hemisphere
glaciation. At the Feni Drift, the terrigenous MAR in-
crease was several-fold (Fig. 4d); the result of increased
continental glacial erosion as evidenced by the geo-
chemistry of the terrigenous grains. The carbonate flux
gradually declined during the late Miocene through the
mid-Pliocene. The sharp decrease to lower carbonate
MAR values at 5 Ma mirrors a decrease in overall
sedimentation rate, which later increased to higher
values between 3 Ma and 1 Ma (Fig. 4c).
.
t
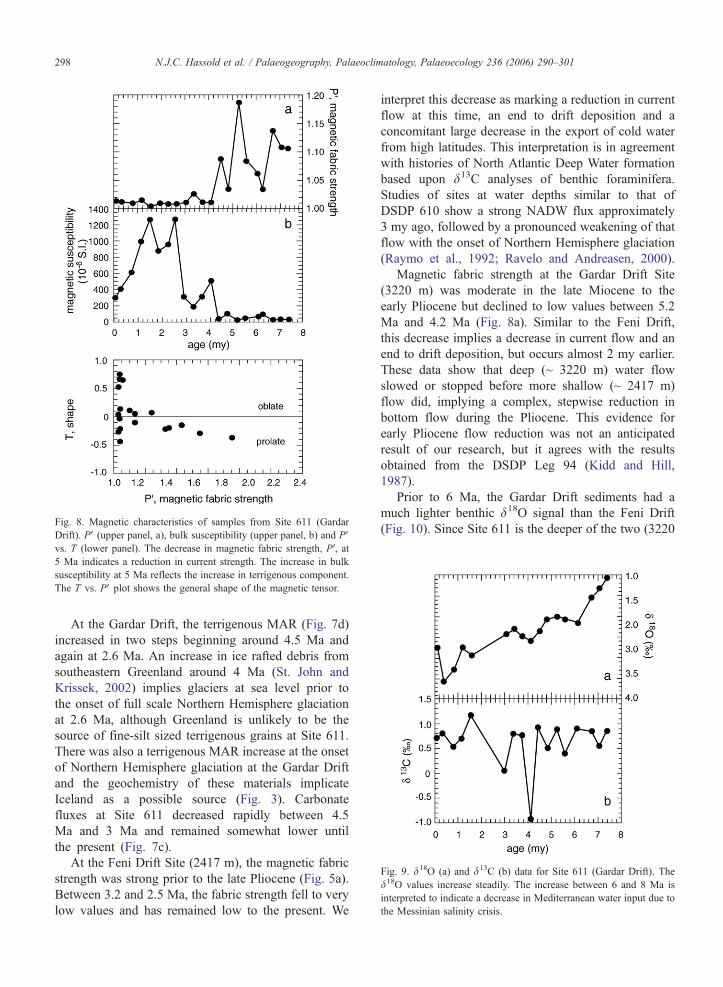
Fig. 8. Magnetic characteristics of samples from Site 611 (Gardar
Drift). PV (upper panel, a), bulk susceptibility (upper panel, b) and PVvs. T (lower panel). The decrease in magnetic fabric strength, PV, at5 Ma indicates a reduction in current strength. The increase in bulk
susceptibility at 5 Ma reflects the increase in terrigenous component.
The T vs. PV plot shows the general shape of the magnetic tensor.
ig. 9. d18O (a) and d13C (b) data for Site 611 (Gardar Drift). The18O values increase steadily. The increase between 6 and 8 Ma is
terpreted to indicate a decrease in Mediterranean water input due to
e Messinian salinity crisis.
N.J.C. Hassold et al. / Palaeogeography, Palaeoclimatology, Palaeoecology 236 (2006) 290–301298
At the Gardar Drift, the terrigenous MAR (Fig. 7d)
increased in two steps beginning around 4.5 Ma and
again at 2.6 Ma. An increase in ice rafted debris from
southeastern Greenland around 4 Ma (St. John and
Krissek, 2002) implies glaciers at sea level prior to
the onset of full scale Northern Hemisphere glaciation
at 2.6 Ma, although Greenland is unlikely to be the
source of fine-silt sized terrigenous grains at Site 611.
There was also a terrigenous MAR increase at the onset
of Northern Hemisphere glaciation at the Gardar Drift
and the geochemistry of these materials implicate
Iceland as a possible source (Fig. 3). Carbonate
fluxes at Site 611 decreased rapidly between 4.5
Ma and 3 Ma and remained somewhat lower until
the present (Fig. 7c).
At the Feni Drift Site (2417 m), the magnetic fabric
strength was strong prior to the late Pliocene (Fig. 5a).
Between 3.2 and 2.5 Ma, the fabric strength fell to very
low values and has remained low to the present. We
interpret this decrease as marking a reduction in current
flow at this time, an end to drift deposition and a
concomitant large decrease in the export of cold water
from high latitudes. This interpretation is in agreement
with histories of North Atlantic Deep Water formation
based upon d13C analyses of benthic foraminifera.
Studies of sites at water depths similar to that of
DSDP 610 show a strong NADW flux approximately
3 my ago, followed by a pronounced weakening of that
flow with the onset of Northern Hemisphere glaciation
(Raymo et al., 1992; Ravelo and Andreasen, 2000).
Magnetic fabric strength at the Gardar Drift Site
(3220 m) was moderate in the late Miocene to the
early Pliocene but declined to low values between 5.2
Ma and 4.2 Ma (Fig. 8a). Similar to the Feni Drift,
this decrease implies a decrease in current flow and an
end to drift deposition, but occurs almost 2 my earlier.
These data show that deep (~ 3220 m) water flow
slowed or stopped before more shallow (~ 2417 m)
flow did, implying a complex, stepwise reduction in
bottom flow during the Pliocene. This evidence for
early Pliocene flow reduction was not an anticipated
result of our research, but it agrees with the results
obtained from the DSDP Leg 94 (Kidd and Hill,
1987).
Prior to 6 Ma, the Gardar Drift sediments had a
much lighter benthic d18O signal than the Feni Drift
(Fig. 10). Since Site 611 is the deeper of the two (3220
F
din
th

Fig. 11. Comparison of d13C values between Hole 610 (Feni Drift
and Hole 611C (Gardar Drift). The reason for the large negative value
at 4 Ma for Hole 611C is not known, but the value is probably real
Other researchers have noted a similar excursion at other sites.
N.J.C. Hassold et al. / Palaeogeography, Palaeoclimatology, Palaeoecology 236 (2006) 290–301 299
m), density considerations indicate a water mass that is
both warmer and more saline. This shift in isotopic
values was also seen at deeper Site 608 (3526 m), but
is less than half as large there (~ 0.5x at 608) (Wright
and Miller, 1996); no similar late Miocene change in
d18O occurred at Site 610 (2417 m) (Fig. 10). The
suggestion of a different water mass before 6 Ma at
Site 611 is consistent with the results of Murray
(1987) and of Thomas (1987) who analyzed benthic
foraminifera assemblages and inferred a latest Mio-
cene change in the nature of the water masses at Site
611. We interpret the light d18O values prior to 6 Ma
at Site 611 as indicating warm, salty Mediterranean-
origin water that flowed out into the Atlantic and
north at a depth greater than 2417 m (the depth of
Feni Drift). Zhang and Scott (1996), in an extensive
stratigraphic study, have documented the presence of
paleo-Mediterranean outflow water in the North At-
lantic prior to the end of the Miocene. Our data
suggest that the main core of this water mass was
below 2417 m and closer to 3220 m (Gardar Drift)
than 3526 m (Site 608). The closing of the Straits of
Gibraltar, which precipitated the Messinian salinity
crisis (Hsu et al., 1973; Krijgsman et al., 1999; Sei-
denkrantz et al., 2000; Duggen et al., 2003), would
have terminated this outflow just after 6 Ma. Since the
reopening of the Straits of Gibraltar, Mediterranean
water flows north along the continental margin of
Europe and shoals in the Norwegian Sea, where it is
incorporated into the NADW (Reid, 1979).
Carbon isotope values (d13C) for both Sites 611 and
610 correspond well for samples younger than about 5
Ma (Fig. 11). Prior to this, the water mass at Site 611
appeared lighter (older) than at Site 610. There is a
large single-point negative value at Site 611, possibly
Fig. 10. Oxygen isotope comparison among Holes 608, 610 and
611C. The values for all three holes track well after 6 Ma. Prior to
6 Ma, values from Hole 611C indicate a warmer, more saline water
mass, probably Mediterranean water.
)
.
the same as seen by Billups (2002), but the cause of this
apparently brief event is not known.
4. Conclusions
Our study of the Feni and Gardar Drifts provides the
following insights into North Atlantic paleoceanogra-
phy. Whereas many of our observations amplify the
work of previous investigators (Kidd and Hill, 1987;
Raymo et al., 1992; Zhang and Scott, 1996; Krijgsman
et al., 1999; Frank et al., 2002; Laberg et al., 2005), the
temporal details of the reductions in deep water outflow
from the region are new. Prior to approximately 6 Ma,
warm salty water from the Mediterranean occupied mid
depths, constrained to between 2400 and 3600 m, in the
North Atlantic. During these late Miocene times, the
Feni and Gardar Drifts were being deposited by deep
currents, with the flow at the shallower Feni Drift site
being relatively stronger than that at the deeper Gardar
Drift site. The gradual closing of the Straits of Gibraltar
at the end of the Miocene precipitated the Messinian
salinity crisis in the Mediterranean basin and shut off
the supply of Mediterranean overflow water to the
North Atlantic (as indicated by the y18O data).
Krijgsman et al. (1999) note that the Mediterranean
became isolated from the North Atlantic between about
5.6 and 5.3 million years ago. Shortly after this time,
the deeper Gardar drift current began to slow and the
flow was nearly completely gone by 4.2 Ma. We sug-
gest that, without the salt supplied by the Mediterranean
outflow water, it was not possible to form waters of
adequate density at 3200m, thus effectively shutting
down abyssal flow along the Gardar Drift at Site 611.
Abyssal flow at the shallower Feni Drift site
remained strong until 3.2 Ma and declined rapidly by
about 2.5 Ma, corresponding to the beginnings of full-

N.J.C. Hassold et al. / Palaeogeography, Palaeoclimatology, Palaeoecology 236 (2006) 290–301300
scale Northern Hemisphere glaciation. The onset of
Northern Hemisphere glaciation is also signaled by
the large increase in the mass accumulation rate of
continentally derived minerals in these North Atlantic
sites.
To the extent that deep outflow waters exiting the
North Atlantic are replaced by the surficial inflow of
relatively warmer waters, the stepwise reduction in flow
along the Gardar and Feni Drifts, beginning when the
Mediterranean became closed to the North Atlantic,
must be intimately associated with the late Cenozoic
global cooling.
Acknowledgments
We wish to thank the ODP East Coast Repository at
Lamont-Doherty Earth Observatory at Columbia Uni-
versity for providing the samples used in this study. We
thank Joel Blum, Andrea Klaue and Marcus Johnson of
the Michigan Radiogenic Isotope Geochemistry Labo-
ratory for their assistance with the isotopic analyses. N.
Hassold was supported by a fellowship from the Rack-
ham Graduate School at the University of Michigan. A
Turner Grant from the Department of Geological
Sciences at the University of Michigan funded the
radiogenic isotope analyses. We also thank Jan Bloe-
mendal and an anonymous reviewer for providing help-
ful comments.
References
Berggren, W.A., Kent, D.V., Swisher, C.C.I., Aubry, M.-P., 1995. A
revised Cenozoic geochronology and chronostratigraphy. In:
Berggren, W.A., Kent, D.V., Hardenbol, J. (Eds.), Geochronology,
Time Scales and Global Stratigraphic Correlations: A Unified
Temporal Framework for an Historical Geology, Special Publica-
tion, vol. 52. Society of Economic Paleontologists and Mineral-
ogists, pp. 129–212.
Billups, K., 2002. Late Miocene through early Pliocene deep water
circulation and climate change viewed from the sub-Antarctic
South Atlantic. Palaeogeography, Palaeoclimatology, Palaeoecol-
ogy 185, 287–307.
Broecker, W.S., 1991. The great ocean conveyor. Oceanography 4,
79–89.
Cande, S.C., Kent, D.V., 1995. Revised calibration of the geomag-
netic polarity timescale for the late Cretaceous and Cenozoic.
Journal of Geophysical Research 100 (B4), 6093–6095.
Duggen, S., Hoernle, K., van den Bogaard, P., Rupke, L., Morgan,
J.P., 2003. Deep roots of the Messinian salinity crisis. Nature 422,
602–606.
Ellwood, B.B., Ledbetter, M.T., 1977. Antarctic bottom water fluc-
tuations in the Vema Channel: effects of velocity changes on
particle alignment and size. Earth and Planetary Science Letters
35, 189–198.
Ellwood, B.B., Ledbetter, M.T., 1979. Paleocurrent indicators in
deep-sea sediment. Science 203, 1335–1337.
Ellwood, B.B., Ledbetter, M.T., Johnson, D.A., 1979. Sedimentary
fabric: a tool to delineate a high-velocity zone within a deep
western Indian Ocean bottom current. Marine Geology 33,
M51–M55.
Frank, M., Whiteley, N., Kasten, S., Hein, J.R., O’Nions, K., 2002.
North Atlantic Deep Water export to the Southern Ocean over the
past 14 Myr: evidence from Nd and Pb isotopes in ferromanga-
nese crusts. Paleoceanography, 17. doi:10.1029/2000PA000606.
Gleason, J.D., Moore, T.C., Rea, D.K., Johnson, R.M., Owen, R.M.,
Blum, J.D., Hovan, S.A., Jones, C.E., 2002. Ichthyolith strontium
isotope stratigraphy of a Neogene red clay sequence: calibrating
eolian dust accumulation rates in the central North Pacific. Earth
and Planetary Science Letters 202, 625–636.
Hailwood, E.A., Kidd, R.B., Dowling, L., 1987. The magnetic fabric
of Neogene and Quaternary sediments on the Feni and Gardar
Drifts, Northeastern Atlantic, Deep Sea Drilling Project Sites 610
and 611. In: Ruddiman, W.F., Kidd, R.B., Thomas, E., et al., Init.
Repts. DSDP, vol. 94. U.S. Government Printing, Washington,
pp. 1083–1089.
Hansen, B., Osterhus, S., Quadfasel, D., Turrell, W., 2004. Already
the day after tomorrow? Science 305, 953–954.
Hovan, S.A., 1995. Late Cenozoic atmospheric circulation intensity
and climatic history recorded by eolian deposition in the eastern
Equatorial Pacific Ocean, Leg 138. In: Pisias, N.G., Mayer, L.A.,
Janecek, T.R., Palmer-Julson, A., van Andel, T.H.Proc. ODP, Sci.
Results vol. 138. Ocean Drilling Program, College Station, TX,
pp. 615–625.
Howe, J.A., Stoker, M.S., Stow, D.A.V., 1994. Late Cenozoic sedi-
ment drift complex, northeast Rockall Trough, North Atlantic.
Paleoceanography 9, 989–999.
Hsu, K.J., Cita, M.B., Ryan, W.B.F., 1973. The origin of the Med-
iterranean evaporites. In: Ryan, W.B.F., Hsu, K.J., et al., Init
Repts. DSDP, vol. 13. U.S. Government Printing, Washington,
pp. 1203–1231.
Jansen, E., Raymo, M.E., 1996. Leg 162: new frontiers on past
climates. In: Jansen, E., Raymo, M.E., Blum, P., et al., Proc.
ODP, Init. Repts, vol. 162. Ocean Drilling Program, College
Station, TX, pp. 5–20.
Joseph, L.H., Rea, D.K., van der Pluijm, B.A., 1998. Use of grain size
and magnetic fabric analyses to distinguish among depositional
environments. Paleoceanography 13, 491–501.
Joseph, L.H., Rea, D.K., van der Pluijm, B.A., Gleason, J.D., 2002.
Antarctic environmental variability since the late Miocene: ODP
Site 745, the East Kerguelen sediment drift. Earth and Planetary
Science Letters 201, 127–142.
Joseph, L.H., Rea, D.K., van der Pluijm, B.A., 2004. Neogene
history of the deep western boundary current at Rekohu Sedi-
ment Drift, Southwest Pacific (ODP Site 1124). Marine Geology
205, 185–206.
Kidd, R.B., Hill, P.R., 1987. Sedimentation on Feni and Gardar sed-
iment drifts. In: Ruddiman, W.F., Kidd, R.B., Thomas, E., et al.,
(Eds.), Init. Repts. DSDP, vol. 94. U.S. Government Printing,
Washington, pp. 1217–1244.
Krijgsman, W., Hilgen, F.J., Raffi, I., Sierro, F.J., Wilson, D.S., 1999.
Chronology, causes and progression of the Messinian salinity
crisis. Nature 400, 652–655.
Laberg, J.S., Dahlgren, K.I.T., Vorren, T.O., 2005. The Eocene–late
Pliocene paleoenvironment in the Vøring Plateau area, Norwegian
Sea—paleoceanographic implications. Marine Geology 214,
269–285.
Latouche, C., Maillet, N., Philipps, I., 1987. X-ray mineralogy of the
clay fraction from Cenozoic strata, Leg 94: comparison with

N.J.C. Hassold et al. / Palaeogeography, Palaeoclimatology, Palaeoecology 236 (2006) 290–301 301
previous North Atlantic data. In: Ruddiman, W.F, Kidd, R.B.,
Thomas, E., et al., Init. Repts. DSDP vol. 94. U.S. Government
Printing Office, Washington, pp. 1089–1102.
Muller, G., Gastner, M., 1971. The dKarbonate-BombeT, a simple
device for the determination of the carbonate content in sediments,
soils and other materials. Neues Jahrbuch fur Mineralogie 10,
466–469.
Murray, J.W., 1987. Benthic foraminifers and Neogene bottom-
water masses at Deep Sea Drilling Project Leg 94 North
Atlantic Sites. In: Ruddiman, W.F., Kidd, R.B., Thomas, E.,
et al., Init. Repts. DSDP, vol. 94. U.S. Government Printing,
Washington, pp. 965–979.
Ravelo, A.C., Andreasen, D.H., 2000. Enhanced circulation during a
warm period. Geophysical Research Letters 27, 1001–1004.
Raymo, M.E., Hodell, D., Jansen, E., 1992. Response of the deep
ocean circulation to initiation of Northern Hemisphere glaciation
(3–2 MA). Paleoceanography 7, 645–672.
Rea, D.K., Hovan, S.A., 1995. Grain size distribution and depo-
sitional processes of the mineral component of abyssal sedi-
ments: lessons from the North Pacific. Paleoceanography 10,
251–258.
Rea, D.K., Janecek, T.R., 1981. Mass-accumulation rates of the non-
authigenic inorganic crystalline (eolian) component of deep-sea
sediments from the western Mid-Pacific Mountains, Deep Sea
Drilling Project Site 463. In: Thiede, J., Vallier, T.L., et al.,
(Eds.), Init, Rept., DSDP 62. U.S. Government Printing, Washing-
ton, pp. 653–659.
Rea, D.K., Hassold, N., Pares, J.M., van der Pluijm, B.A., 2003.
Pliocene reduction in abyssal flow rates from analyses of drift
deposits in the northern and southern oceans. Geological Society
of America Abstracts with Program 35, 1193–1223.
Reid, J.L., 1979. On the contribution of the Mediterranean Sea
outflow to the Norwegian–Greenland Sea. Deep-Sea Research
26A, 1199–1223.
Ruddiman, W.F., Kidd, R.B., Thomas, E., et al., 1987a. Site 610. Init.
Repts. DSDP vol. 94. U.S. Government Printing Office, Washing-
ton, pp. 351–470.
Ruddiman, W.F., Kidd, R.B., Thomas, E., et al., 1987b. Site 611. Init.
Repts. DSDP, vol. 94. U.S. Government Printing Office, Washing-
ton, pp. 471–590.
Seidenkrantz, M.S., Kouwenhoven, T.J., Jorissen, F.J., Shackleton,
N.J., van der Zwaan, G.J., 2000. Benthic foraminifera as indica-
tors of changing Mediterranean–Atlantic water exchange in the
late Miocene. Marine Geology 163, 387–407.
Shipboard Scientific Party, 1998. Introduction. In: Keigwin, L.D.,
Rio, D., Acton, G.D., et al., (Eds.), Proc. ODP, Init. Repts. vol.
172. Ocean Drilling Program, College Station, TX, pp. 7–12.
St. John, K.K., Krissek, L.A., 2002. The late Miocene to Pleistocene
ice—rafting history of southeast Greenland. Boreas 31, 28–35.
Takayama, T., Sato, T., 1987. Coccolith biostratigraphy of the North
Atlantic Ocean, Deep Sea Drilling Project Leg 94. In: Ruddiman,
W.F., Kidd, R.B., Thomas, E., et al., Init. Repts. DSDP vol. 94.
U.S. Government Printing Office, Washington, pp. 651–694.
Tarling, D.H., Hrouda, F., 1993. The Magnetic Anisotropy of Rocks.
Chapman and Hall, New York. 217 pp.
Thomas, E., 1987. Late Oligocene to Recent benthic foraminifers from
Deep Sea Drilling Project Sites 608 and 610, northeastern North
Atlantic. In: Ruddiman, W.F., Kidd, R.B., Thomas, E., et al.,
(Eds.), Init, Repts. DSDP, vol. 94. U.S. Government Printing,
Washington, pp. 997–1015.
Wold, C.N., 1994. Cenozoic sediment accumulation on drifts in the
northern North Atlantic. Paleoceanography 9, 917–941.
Wright, J.D., Miller, K.G., 1996. Control of North Atlantic Deep
Water circulation by the Greenland–Scotland Ridge. Paleoceano-
graphy 11, 157–170.
Zhang, J., Scott, D.B., 1996. Integrated stratigraphy and paleoceano-
graphy of the Messinian (latest Miocene) across the North Atlantic
Ocean. Marine Micropaleontology 26, 1–36.