latent variable modeling - pubh 7435f1 1 x1 e1 1 x2 e2 1 x3 e3 1 f2 x4 e4 1 1 x5 e5 1 x6 e6 1 x7 e7...
TRANSCRIPT

Slide 1
Latent Variable Modeling - PUBH 7435
Improved Name:
Latent variable measurement models and path analysis
9:45 - 11:00 Tuesday and Thursday Fall 2006
Melanie M. Wall
Division of Biostatistics
School of Public Health
University of Minnesota
Office: A426 Mayo
email: [email protected]
Slide 2
What is a latent variable?
• A variable that is not observable or is not directly measurable.
• A variable that is measured with error or can only be measured with error.
• A latent variable can be used to represent a ‘true’ variable which is measured
with error, OR a single conceptual variable, OR a construct which is a
summarization of a complex concept.
Examples of ‘true’ variables that are measured with error: calcium intake measured
by a Food Frequency, physical activity measured by self-report, self-reported weight,
sleep latency recorded with sleep diaries, lung capacity measured by FEV1 (Forced
Expiratory Volume in 1 second)
Examples of conceptual variables and constructs that are desirable to measure: lib-
eralism, quality of life, stress, self-esteem, social economic status, coping, unhealthy
dieting, math ability, parenting skill, satisfaction, social support, speech difficulties,
asthma severity, self-restraint problems, etc.

Slide 3
Latent variable measurement models
• Our goal is to use statistical models to measure latent variables by relat-
ing them with things that can be observed (e.g. questionnaire items, test
results, any observable tool)
• Philosophical debates about the fundamental existence or non-existence of
conceptual latent variables will be avoided and a more pragmatic point of
view will be taken focused on obtaining useful information and explanations
for relationships from data using statistical modeling.
• This course will focus more on latent variables representing concepts or
constructus.
Slide 4
Latent variables as mathematical convenience
Latent variables are also used in different statistical modeling techniques as a
mathematical convenience where they often are not of primary interest, i.e. the
goal is not to ”measure” them per se:
• Unobserved heterogeneity (e.g. frailties in survival analysis, random effects
in longitudinal data or clustered data)
• Missing data
• Counterfactuals or ’potential outcomes’

Slide 5
Need for measuring latent variables in Health Sciences
Traditionally latent variables and methods for measuring them have been dealt
with in the realm of psychology, sociology and education.
• Need in clinical research
• Need in assessment/decisions in health services
• Need in behavioral public health
Slide 6
Need in clinical research
“In the past 20 years or so, the situation in clinical research has become more com-
plex. The effects of new drugs or surgical procedures on quantity of life is likely to
be marginal. Conversely, there is increased awareness of the impact of health and
health care on the quality of human life. Therapeutic efforts in many disciplines of
medicine- psychiatry, respirology, rheumatology, oncology-other health professions-
nursing, physiotherapy, occupational therapy- are directed equally if not primarily to
the improvement of quality, not quantity of life. If the efforts of these disciplines are
to be placed on a sound scientific basis, methods must be devised to measure what
was previously thought to be unmeasurable, and assess in a reproducible and valid
fashion those subjective states which cannot be converted into the position of a needle
on a dial.”
From: Streiner, D.L. and Norman, G.R. (2001) Health Measurement scales: A practi-
cal guide to their development and use 3rd ed. Oxford Medical Publications.
Examples: quality of life, stress, pain worsening, compliance with treatment,
perimenopause, stages of Alzheimers, diagnostic for myocardial infarction

Slide 7
Need in assessment/decisions in health services
Example: “Your interest is in developing programs of interventions to aid indi-
viduals who are considering undergoing genetic testing for inheritable cancer.
In particular, you are interested in identifying decision-making concerns among
women who are at familial risk for breast cancer. By identifying these concerns,
you will be better able to devise counseling programs that are specific to this
vulnerable group. Need a standardized scale that will provide you and your col-
leagues with a reliable, valid, and easy-to-use assessment of the genetic testing
and cancer outcome concerns of this population.”
From: Pett, M.A., Lackey, N.R., Sullivan, J.J. (2003) Making sense of factor
analysis: The use of factor analysis for instrument development in health care
research Sage Publications.
Examples: proneness to falls, risk for developing perineal dermatitis
Slide 8
Need in behavioral public health
So many health issues are directly related to our behavior. Much theoretical
work done in sociology building theories to describe different aspects of per-
sonal and social/familial networks that influence our behaviors. Many of these
phenomena are not things easily measured.
Examples:
peer relationship strains
family connectedness
intimidation/bully-ing
self efficacy for screening practices
taste preferences
body satisfaction
motivation of alcoholism treatment
post traumatic stress disorder
dieting and other weight control behavior
physical activity
alcohol consumption
violence in the workplace

Slide 9
Latent Variable Modeling Course
Two general areas
• Measurement of latent variables - Statistical models are used to describe
the way that observed variables are related to the latent variables.
• Path Analysis - Statistical models are used to evaluate the presumed
causal relations (direct and indirect) among several variables (possibly la-
tent).
Slide 10
Latent Variable Modeling Course - Syllabus
Measurement Models (7 weeks)
• Fundamental ideas of measurement
• Measuring continuous latent variables
– Factor Analysis (and using Principal component analysis)
– Factor Analysis for binary and ordered categorical variables
• Measuring categorical latent variables
– Latent class analysis.
– Hidden Markov Models
Path Analysis (7 weeks)
• Intro to Causality
• Path analysis
• Structural equation modeling.
• Latent class regression.

Slide 11
Measurement Models
NAMES OF MODELS: exploratory and confirmatory factor analysis, latent
trait models or item response theory models or Rasch models, latent class mod-
els or latent mixture models or hidden Markov models
• Measures the latent variables
• reduces the dimensionality of the data
• find patterns of correlations among several observed variables that are measuring
the same thing
• observed variables are just a reflection of some underlying phenomena (i.e. latent
variable)
• goal is to lose as little information as possible when reducing the dimensionality
• goal is to quantify how well each observed variables actually measure the latent
variable
Slide 12
Measurement Models
Like observed variables, latent variables can be (hypothesized to be) continu-
ous or categorical and if they are categorical they can be ordinal (ordered) or
nominal (unordered). Depending upon what is assumed about the distribution
of the latent variable and upon what kind of observed variables are used to
measure them (i.e. continuous or categorical), the method for estimating the
measurement model will change.
latent latent
continuous categorical
‘factor’ ‘class’
observed continuous factor analysis latent mixture model
observed categorical latent trait model latent class model

Slide 13
Factor analysis for continuous observed variables -“EFA and CFA”Exploratory Factor Analysis (EFA) - Method originated by Spearman in 1904
EFA general purposes:
• To determine how many underlying factors are necessary to explain most of the
correlations and variance in the data.
• To determine the relationship via rotation between each of these underlying
factors with each of the observed variables in a meaningful way so that the factors
can be interpreted and named.
• To weed out observed variables that do not tend to measure well the underlying
factors shared by the other variables.
• To propose blocks of variables that may be subsequently be used to create a simple
sum scale.
• To propose a CFA model
Slide 14
Factor analysis for continuous observed variables -“EFA and CFA”
Confirmatory Factor Analysis (CFA)
CFA general purposes:
• To define a measurement model for the relationship between multivariate
observations and underlying factors
• To test the statistical significance of factor loadings and correlations. May
be interested in testing whether rotated factor loadings from an EFA that
look “close to zero” are, in fact, significantly different from zero or not.
• To test whether the measurement model for one group is the same as the
measurement model for some other group
• As a precursor to a Structural equation model

Slide 15
f1
x1 e11
x2 e21
x3 e31
x4 e41
x5 e51
x6 e61
x7 e71
x8 e81
x9 e91
x10 e101
f1
x1 e11
x2 e21
x3 e31
f2
x4 e41
x5 e51
x6 e61
x7 e71
x8 e81
x9 e91
x10 e101
f1
x1 e11
x2 e21
x3 e31
f2
x4 e41
x5 e51
x6 e61
x7 e71
f3
x8 e81
x9 e91
x10 e101
x = µ + Λf + ǫ.
x : p-dimensional vector of continuous observed variables
f : q-dimensional vector of underlying latent factors. Often called “common factors”.
Assume f is random such that E(f) = 0 and V ar(f) = Φ
ǫ: p-dimensional vector of random error. Often called “unique factors” or “specific
factors”. V ar(ǫ) = Ψ
Slide 16
f1
x1 e111
x2 e21
x3 e31
f2
x4 e41
1
x5 e51
x6 e61
x7 e71
f3
x8 e81
1
x9 e91
x10 e101
In CFA usually several elements in Λ are fixed to zero and it is possible to consider
correlated ǫ which means that Ψ is not necessarily diagonal. Furthermore, it is usually
assumed that the factors are correlated so that no restriction is placed on Φ.

Slide 17
EFA for developing scales from questionnaires
Example:
Concerns about decisions to get genetic testing (from Pett, Lackey, Sullivan
2003)
Slide 18

Slide 19
Slide 20
Factor analysis for ordered categorical observed variables- “Latent Trait Models”
Originally methods comes from Education testing, (latent variable are labeled
as traits), Item Response Theory (IRT), large literature related to IRT
Answer (0,1) to a series of p questions, thus there are 2p possible response
patterns (dichotomous data). Answer (1,2,...c) to a series of p questions, thus
there are cp possible response patterns (polytomous data).
Questions to answer:
1. How much of the differences in these responses can be explained by supposing all
items depend on one or more continuous latent variables?
2. How many underlying variables are there?
3. Which observed variables help discriminate individuals the best?
4. What is the best way to combine the observed variables in order to create a scale
or score for each individual?

Slide 21
Factor analysis with ordered categorical observed vari-ables
This has been called
• Item response theory
• Factor analysis for categorical data
• Latent trait modeling
There are basically two general approaches which can be considered if we want
to take into account the categorical nature of the observed variables
• Underlying response variable approach
• Response function approach (item response theory approach)
The difference in these two approaches boils down to where the categorical na-
ture of the observed data is taken into account.
Can be Exploratory or Confirmatory
Slide 22
Latent Class AnalysisMeasuring categorical latent variablesCredit usually given to Paul Lazarsfeld as being the originator of LCA, Foundation
book is Lazarsfeld, P.F. and Henry, N.W. (1968) Latent Structure Analysis. Houghton
Mifflin.
Latent class analysis is a statistical method for finding subtypes of related cases from
multivariate categorical data.
Questions to answer:
1. How many underlying classes are there?
2. What is the prevalence in each of the latent classes?
3. What is the relationship between the observed responses and the latent classes
4. What is the probability that a particular individual will be in a particular class?

Slide 23
Latent Class AnalysisMeasuring categorical latent variablesEXAMPLE: Measuring unhealthy weight control behavior. Hypothetically acategorical latent variable.
Have you done the following in the last year in order to lose weight or maintainyour weight: (yes, no)
marginal 2-class 3-class 4-class
To control weight 1 1 2 1 2 3 1 2 3 4
fasted 17.9 38.8 2.8 58.5 32.6 2.6 24.9 71.4 29.2 2.6
ate little 44.1 92.5 9.0 94.2 89.9 7.9 74.1 100.0 87.5 6.9
diet pills 6.3 13.6 1.1 40.4 6.5 1.2 49.4 31.0 6.1 0.8
vomit 6.3 15.0 0.1 45.0 7.1 0.1 33.2 43.6 5.6 0.1
laxatives 1.6 3.5 0.2 17.1 0.1 0.2 20.7 11.7 0.0 0.2
diuretics 1.4 3.3 0.1 16.1 0.1 0.1 29.4 7.9 0.0 0.1
food substitutes 9.3 19.2 2.1 41.6 13.1 2.1 54.4 34.5 12.0 1.7
skipped meals 44.4 89.7 11.1 85.7 89.7 9.5 43.5 100.0 87.4 8.5
smoked more cigs 9.3 18.6 2.5 39.1 13.1 2.5 9.8 47.6 11.2 2.4
% in each class 100 42.0 58.0 8.4 35.2 56.4 2.6 8.0 34.7 54.7
Estimated θjk (probability of saying yes to the variable j given that the individual is in latent class k) under latent
class models with different K
Slide 24
Latent Mixture Modelscategorical latent variables distinguishing longitudinalprofiles
Recently there has been a lot of statistical methods work on more complex
models for longitudinal data.

Slide 25
Path Analysis
Generally, path analysis is the combination of assumed causal theory with
empirical evidence.
• allows researcher to translate idea about how causes are related to effects into a
model
• total effect of one variable on another can be broken down into direct and indirect
effects
• mediation and moderation
• Can be used with or without latent variables, that is variables of interest can be
observed directly (i.e. no need for a measurement model).
• When there are no latent variables or when latent variables are treated as if they
can be observed, it is often called path analysis, when there are latent variables
and the measurement error in them is taken into account statistically by incor-
porating a measurement model, it is often called structural equation modeling.
• The general ideas are introduced using models without measurement error models
included, then the measurement models will be added in later.
Slide 26
Path AnalysisWhat path analysis CANNOT do for you...
• Take non-experimental data and prove whether one variable actually causes an-
other.
• Take non-experimental data and prove the direction of causal order between vari-
ables
• Take non-experimental data and distinguish between models that results in iden-
tical correlation patterns.
What path analysis CAN do for you...
• Provide a graphical way to represent your assumed theory
• Provide a way to empirically estimate the relationships in your assumed theory,
in particular to estimate whether the relationships are positive, negative, and
importantly to test whether the relationship is zero and hence not supported by
the data.
• Provide a way to estimate the assumed causal effect that one variable has on
another through its assumed causal effect on other variables.
• Take experimental data (e.g. interventions) and prove whether the experimentally
changed variable actually causes an outcome.

Slide 27
Mediation - Total and PartialGenerally when we talk about mediation we are asking whether the causal relationship
between two variables
X Ztau
e
1
can be broken down into a series of intermediate causal paths.
X
Y
Z
alpha beta
tau'
e1
1
e2
1
Slide 28
From MacKinnon DP, Taborga MP, Morgan-Lopez AA (2002) “Mediation de-
signs for tobacco prevention research” Drug and Alcohol Dependence, 68, S69-
S83.
Fig. 2. One independent variable, six-mediator model illustrating the
incorporation of action theory and conceptual theory for tobacco use
prevention.

Slide 29
Path Analysis
Peer Relationship
Strain
Friend
Support
Parent
Support
Fri
end
Level
Per
son
al
Level
Fa
mil
y L
evel
Seeking
Support
Risk Taking
Behaviors
Self-Care
Motivation
Illness
Strains
and
Worries
Parent-Youth
Strain
1.5-Year
FEV1
Mean
Non
Adherence
Self-Care
Discouragement
Self
Esteem
1.5-Year
AI
Mean
Figure 1. Conceptual model showing relationship between strains, resources, non-
adherence feelings/behaviors and health outcomes for youth with CF
Slide 30
Path Analysis
Peer Relationship
Strain
Friend
Support
Parent
Support
Fri
end L
eve
lP
ers
on
al
Lev
elF
am
ily L
evel
Seeking
Support
Risk
Taking
Behaviors
Self-Care
Motivation
Illness
Strains
and
Worries
Parent-Youth
Strain
Non
Adherence
Self-Care
Discouragement
Self
Esteem
.31***
.36***
.22**
.26***
.23*
* p < .10
** p < .05
*** p < .01
.27*
.34***
.39***
.30***
.25*
-.28*
Girls

Slide 31
Path Analysis
Peer Relationship
Strain
Fri
end
Lev
el P
ers
on
al
Lev
el
Fa
mil
y L
eve
l
Risk
Taking
Behaviors
Self-Care
Motivation
Illness
Strains
and
Worries
Parent-Youth
Strain
Non
Adherence
Self-Care
Discouragement
Self
Esteem
Boys
.32***
.25***
* p < .10
** p < .05
*** p < .01
.44***
-.31**
.26**
.32**
Slide 32
Structural Equation Modeling
• Combines measurement models with path analysis
• Takes the measurement error into account
• Rather than taking scales with less than perfect reliability and using them
as if they are perfect measurements of the latent variable, SEM models
incorporates the measurement error and thus “adjusts” the correlations
and path coefficients appropriately. Assuming the model specification is
correct (as usual).
Slide 33
Use full SEM - Incorporate CFA into the Path Analysis
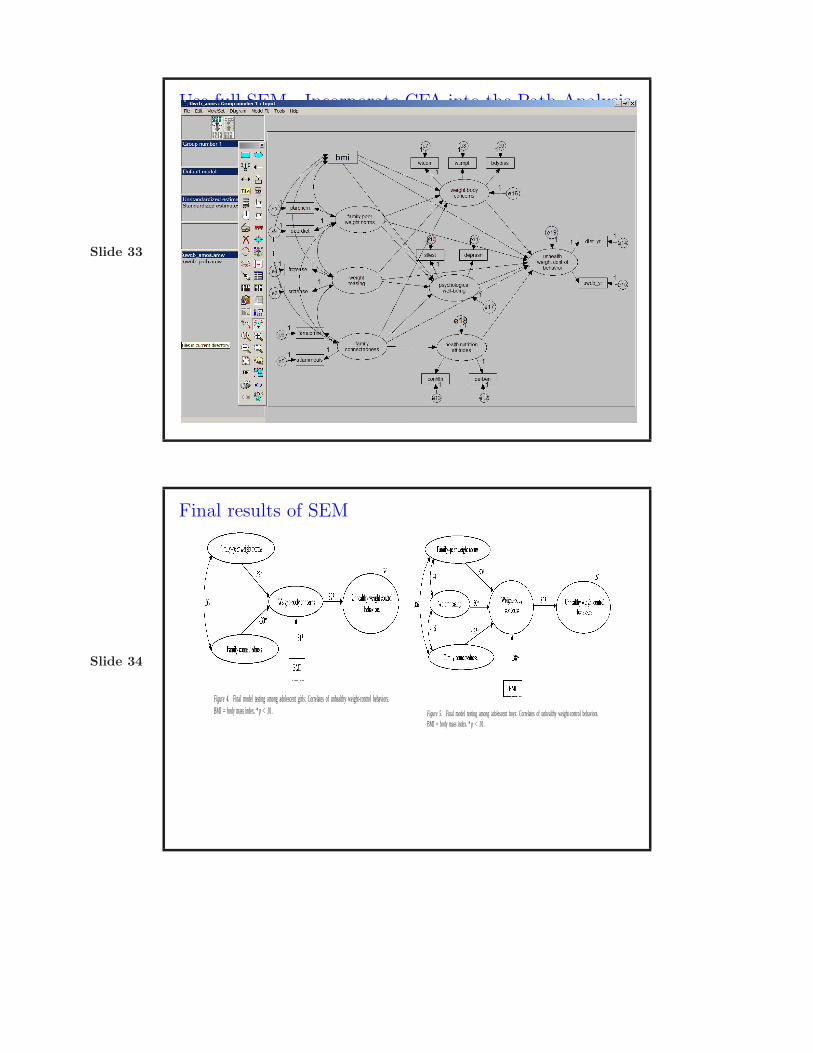
Slide 34
Final results of SEM
Figure 4. Final model testing among adolescent girls: Correlates of unhealthy weight-control behaviors.BMI � body mass index. * p � .01. Figure 5. Final model testing among adolescent boys: Correlates of unhealthy weight-control behaviors.
BMI � body mass index. * p � .01.