lateral drift of reinforced concrete structures …2)0107.pdf · reinforced concrete structures...
TRANSCRIPT

107
LATERAL D R I F T OF REINFORCED CONCRETE STRUCTURES
SUBJECTED TO STRONG G R O U N D MOTION
Mete A. Sozen*
SYNOPSIS:
A simplified method is described for estimating lateral drift of reinforced concrete structures subjected to strong earthquake motion.
The method is modeled after spectral-response analysis with simplifications based on observed characteristics of nonlinear dynamic response of reinforced concrete structures. Its application is limited to the types of structures and ground motions considered in its development. However, the method can be readily calibrated for other types of structures or modified for different foundation conditions.
INTRODUCTION:
This paper is written with the optimistic assumption that the art of earthquake-resistant design of building structures is in its renaissance.* The dark age appears to be behind us. Current technology and new publications do not seem to invoke the fire and brimstone of inevitable catastrophes inexplicably but incontrovertibly related to certain construction types, structural forms, and foundation conditions. For reinforced concrete construction, it appears to have been generally accepted that if the structural scheme is appropriate, the details are adequate, and the building is built according to the plans, the structure is very likely to survive a credible earthquake* The qualifiers "appropriate" for the structural scheme and "adequate" for the details are not intended to make the previous statement circular. What is appropriate or adequate may be judged for most reinforced concrete structures reasonably well in the context of current knowledge based on interpretation of available experience, experiments, and methods of analysis.
The object of this paper is to describe a method, suitable for design-office practice, which may help the engineer organize experience for making decisions about relative advantages of different structural schemes and types of details. In both cases, a useful quantifiable criterion is the maximum lateral displacement response of the structure. Drift, as considered in this paper, refers to lateral displacement in relation to a line perpendicular to the base of the structure. The base is assumed to remain essentially horizontal.
The paper outlines a simple procedure for estimating drift of medium-rise reinforced concrete construction. The procedure is based on observed characteristics of dynamic response of reinforced concrete structures in the nonlinear range.
The sections which follow immediately illustrate these observations using data
*Professor of Civil Engineering, University of Illinois, Urbana
BULLETIN OF THE NEW ZEALAND NATIONAL SOCIETY FOR
obtained in a building during an actual earthquake and data from laboratory structures subjected to simulated earthquake motions.
IMPERIAL COUNTY SERVICES BUILDING:
The Imperial County Services Building in El Centro, California, had been equipped with a 13-channel accelerograph system through a cooperative project of the United States Geological Survey and the California Department of Mines and Geology(1) This building was one of those which sustained severe structural damage during the Imperial County Earthquake of 15 October 1979. The instruments functioned well during the strong motion providing a rare instance of instrumental data obtained as a building was being damaged by an earthquake.
Plan and elevations of the building are shown in Fig. 1 and 2. Lateral-force resisting systems for the building were primarily walls in the short (north-south) direction and frames in the long (east-west) direction. The wall system had a peculiar but not rare feature. The walls were "staggered": first-storey structural walls were not in the same planes as those in the upper storeys.
Descriptions of the damage to the structure and its causes have been described elsewhere (2,3,4) . The object of this discussion is not to investigate the reasons for the damage but to review some of the acceleration records to illustrate certain general characteristics of the behaviour of a reinforced concrete building in a strong earthquake. Acceleration measurements were made in the east-west direction at four elevations: at the elevation of the ground slab marked G and at floors marked, 2, 4, and R in Fig. 2. These data are shown in Fig. 3 and 4. Figure 3 contains acceleration data obtained at levels above ground. Level designations in the figure refer to the sequential position of the floor slab above ground, with the level of the ground slab considered as level zero. These data are especially interesting because they represent direct instrumental readings of acceleration in a reinforced concrete frame building excited into the nonlinear range of response.
EARTHQUAKE ENGINEERING, VOL. 16, NO. 2, JUNE 1983

108
S = STAIR E=ELEVATORS
TYPICAL FL . PLAN
Fig. 1. Plan, Imperial County Services Building (Reference 2)

109
TT
TT
TT
TTT
o
SHEAR WALLS AT (A) S(R) —
PRECAST
SHEAR WALLS A T ® ® © a©
® PH.-, ( E © ® TT
TT
TT
TT
TT
TT
TT
TT
TT
TT
TTTTT
TT
TTT
TTT
TTT
TT TTTTT
R -H
TTTT TTT
SECTION A - A
HP
5 3 9
in
6 £ CVJ
i
O
"CM
6 £
C0 I
G "i
"oo j 55
fr? TT
SECTION B-B
Fig. Z Section, Imperial County Services Building (Reference 2)

MEAS. ACC. ROOF
-0. 5L ' 0.0 5.0 10.0 15.0
TIME . SEC.
MEAS. ACC. LEVEL 3
-0. sL 0-0 5.0 10.0 15.g
TIME . SEC.
MEAS. ACC. LEVEL 1 0.5,-
-0. sL 0.0 5.0 10.0 15.0
TIME . SEC.
Fig. 3 Measured Accelerations, E-W, ICSB. level 0)
(Ground level designated

111
3 BASE SHEAR COEFFICIENT / EAST-WEST DIRECTION
0 . 0
MEAS. ACC. GND. LEVEL
0. 5 r .
tj 0. I 1
-0. 5L 0. 0 5. 0
TIME . SEC. 10. 0 1 5 . 0
Fig. 4 Calculated Base Shear Coefficient and"Acceleration at Ground Level, E-W, ICSB '
Fig. 5. Test Structures HI and Dl (After references 6 and 7)

112
The ordinates of the curves in Fig. 3 are coefficients of the acceleration of gravity. Therefore, the plotted values may also be interpreted as the force at that level expressed as a ratio of the storey weight (storey-force coefficient). It is interesting to note that the maximum lateral force at roof level was, at one instant, approximately one half (measured roof acceleration coefficient = 0.44) the weight of the roof.
Even though higher-mode response hampers direct comparison of the signals obtained at the three levels, it does appear that at times of high roof response there is a tendency for the acceleration response measurements to decrease with height.
An estimate of the east-west shear force at the ground level may be obtained by summing the lateral forces at the six levels above ground with the storey-force coefficients at levels 2,4, and 5 estimated by linear interpolation. History of the base shear coefficient (force at ground level/weight of building) calculated from measured and inferred accelerations is shown in Fig. 4.
The base shear coefficient history reveals the dominant east-west response of the structure better than the individual acceleration records because of the filtering effect of summing the individual storey-force coefficients. The rate at which the base-shear coefficient curve crosses the zero axis implies that the dominant motion of the building had a periodicity of approximately 1.7 seconds.
The indicated effective period of approximately 1.7 sec. suggests considerable softening of the frame during the earthquake. The building would be expected to have an initial low-amplitude period of 0.6 sec. Measurements (5) made before the earthquake of 15 October 19 79 set this value at a credible 0.65 sec.
The observed change in the effective period of the lowest translational mode is a very important characteristic of medium-rise reinforced concrete structures in relation to their dynamic response and will be discussed further in the following sections.
TESTS OF SMALL-SCALE FRAMES AND WALLS:
Despite their shortcomings in size, synthetic loading, and unusual support conditions, earthquake-simulation tests of small-scale reinforced concrete structures do provide a convenient vehicle for understanding dynamic structural response because the bare structure or the complete building can be tested for types of response which permit modeling in small-scale , because experiments can be repeated and because response displacements can be measured directly.
Measured displacement responses from earthquake simulation tests of two small-scale structures will be examined here because they illustrate certain representative response characteristics. Details of the test structures and the
tests have been reported by Cecen (6) and Aristizabal (7).
Overall dimensions of the structures are shown in Fig. 5. Both structures had ten levels, each storey having a mass of approximately 454 kg (1000 lb). Structure HI comprised a pair of frames. Structure Dl was made up of a pair of coupled walls.
Each test structure was mounted on the platform of the earthquake simulator as shown schematically in Fig. 6 and subjected to a representative strong motion in one horizontal direction. In each case, the input record was scaled to excite the small-scale structure, with its frequencies increased in relation to full scale, well into the nonlinear range of response. One second on the simulator corresponded to 2.5 sec. during the actual earthquake.
Figures 7 and 8 show the measured response displacements for the two structures at even numbered levels. The maximum top displacements corresponded to more than one percent of the heights of both structures indicating, for their proportions, that considerable nonlinear response had occurred during the tests.
Consider the records for the frame structure shown in Fig. 7. The "cleanness" of the displacement signals implies that they are dominated by response in a single mode. The fact that the response at all levels is in the same direction (has the same sign) at all instants when the displacement is not negligible indicates that most of it may be attributed to the lowest mode. This observation is further reinforced by the relative amplitudes of displacement responses at different levels: the lower the level, the smaller is the amplitude.
The measured displacement responses for the coupled-wall structure in Fig. 8 demonstrate domination of the lowest mode even more clearly.
It is also evident from the records in both Fig. 7 and 8 that the effective period of the test structures increased as the displacement amplitude increased. Cecen (6) reports that the period of fundamental mode of the planar structure HI measured by a small-amplitude free-vibration test before the earthquake-simulation test was 0.33 sec. The effective period during the test, after maximum displacement was reached, was 0.6 sec. Similarly, the initial period was 0.22 sec. for the wall structure Dl. During the earthquake simulation test, it increased to 0.5 sec.
There is another attribute of the displacement records in Fig. 6 and 7 that is not directly evident from the experimental data. That attribute is the magnitude of the maximum displacement amplitude in relation to the magnitude that would be expected or calculated for a lightly damped linear model of the structure.
It was observed by Gulkan (8) and

Fig. 6. Test Structure on Earthquake Simulator 40

DISPLACEMENT , MM DISPLACEMENT DISPLACEMENT , MM
fi> H* CO T3 *1 I—' rj o P n n Q
O
w
o H fD
C
o C ft)
Pea
DISPLACEMENT , MM DISPLACEMENT . MM r'j ^ i t OJ p o p p p P P P p a p a si a a Gl S S CO ta

DISPLACEMENT AT LEVEL 10 . Dl . RUN 1
TIME . SECONDS
DISPLACEMENT AT LEX'EL 8 . Dl . RUN 1
TIME . SECONDS
DISPLACEMENT AT '.EVEL 6 . Dl . RJN 1
-ID. 0 ,
-32. EL *0. 0
30. 0^
20. 0
10. 0
-0. 0
TIME . SECONDS
DISPLACEMENT AT LEVEL 4 . RUN 1
-10. 0_
-20. 0 _
-30. GL 0. 0
30. 0
20. 0_
10. 0_
-0. 0 _
10. 0 .
-20. G_
-33. CL 0. 0
TIME . SECONDS
DISPLACEMENT AT LEVEL 2 . RUN 1
TIME , SFCCNOS
Fig. 8. Displacement Response of Test Structure Dl (After reference 7)
116
Shibata (9) that measured nonlinear response of reinforced concrete structural systems could be approximated by the response of a substitute linear model with a relatively longer period and increased damping, the changes in both the period and equivalent damping being related quantitatively to the extent of nonlinear response.
The method proposed by Shibata (9) was a design method which was direct: assumption of a tolerable damage ratio led directly to value of equivalent damping and period which were used to determine design forces. To use the method in reverse, to estimate the response for a given structure and an earthquake intensity, would require a series of iterations primarily because of the assumed variation of damping with response.
Experimental data (8) indicate that the ability of the structure to dissipate energy in flexure increases rapidly at the onset of nonlinear action and then increases at a slow rate with increasing . response amplitude. For systems that develop considerable nonlinear response, it is plausible and convenient to assume a constant value for the capacity of the structure to dissipate energy.
The observations made in this and the preceding section provide the background for the method described in the next section.
A PROCEDURE FOR ESTIMATING DRIFT:
This section presents a simple method modeled after but not legitimately derived from spectral response analysis for displacement . Although the method leads to calculated displacements, it would be misleading to imply that it can be used to determine drift in the same sense that theory of elasticity may be used to calculate, say, the deflection of an elastic beam for a known applied load. The drift estimate determined by any method is not likely to improve on the estimate of the ground motion except by chance, response insensitivity, or local calibration.
The procedure presented here has been developed to be suitable for use in the design office and to have explicit components which can be modified for particular conditions and for desired level of detail. The procedure is intended primarily to help the user organize experience and evaluate different solutions for structural framing and member properties. In effect, it is not a method for calculating displacement. It is a prescription for judging relative stiffness.
The method presented follows in general from the observations about response of reinforced concrete structures discussed in the preceding sections. Specifically, it is assumed that the lateral displacement is dominated by response in the fundamental mode of the•structure, that structural response may be approximated by treating the structure in one vertical plane at a time, and that nonlinear response may be estimated by treating the structure as a "softened" linear system with appropriate damping.
The method is intended to be used for moderate-rise buildings with initial low-amplitude fundamental periods ranging from 1/4 to 5/4 sec. The particular version developed here is for structures on firm ground or structures subjected to ground motions with response amplification characteristics similar to those for El Centro 1940.
To avoid the implication that the method has been derived consistently from first principles, presentation of the equations for estimating drift will precede their rationalization.
The lateral displacement at any level i in the structure is defined by the product of two quantities: a characteristic drift, X c, and a factor which ralates the characteristic drift to the drift at a given level. The two quantities stand for spectral response displacement and modal shape but are calculated without explicit use of dynamic analysis.
The characteristic drift X , which c
depends on the properties of the structure and intensity of ground motion, is defined by Eq. la in SI and b y Eq. lb in the Imperial system of units. X c = 250 (a^/c h) (la)
X c = 10 (a^/c b) (lb)
X = characteristic drift in mm C (Eq. la) or in. (Eq. lb)
a e = coefficient of effective peak acceleration for site or region (ratio of effective peak acceleration to acceleration of gravity).
c^ = coefficient of base shear capacity (ratio of base shear capacity to weight of building above base).
Base shear capacity for the structure is calculated for a linear distribution of storey-force coefficients over the height of the building and is ideally the base shear for the yield mechanism resulting in minimum resistance.
The drift, D^, at any level i is assumed to be that indicated by Eq. 2.
(D ±/X c) = x± Z(W ± x i)/Z(W i x?) (2)
x. = lateral displacement at level i calculated for a lateral-force distribution defined by (h^/H) at each level
= weight assigned to level i = height above base of level i
H = height above base of top level
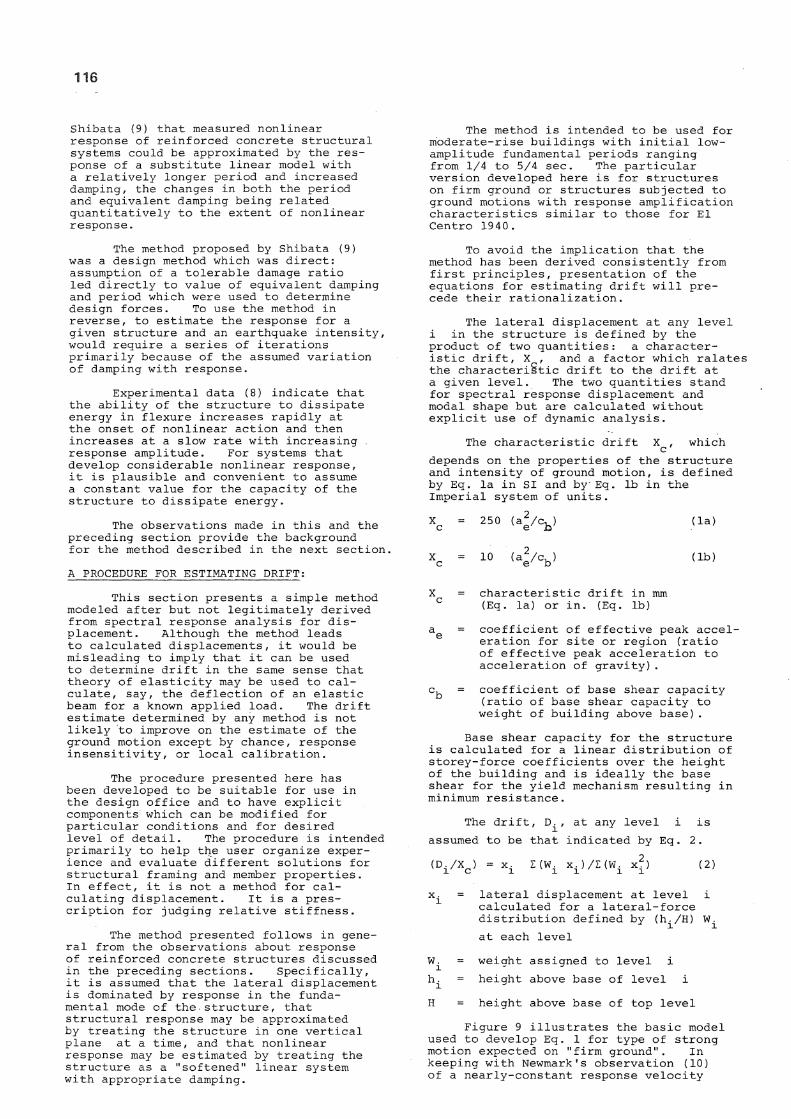
Figure 9 illustrates the basic model used to develop Eq. 1 for type of strong motion expected on "firm ground". In keeping with Newmark 1s observation (10) of a nearly-constant response velocity

117
range the response acceleration over a range of periods from approximately 0.5 to 2.5 sec. is assumed to vary inversely with the period. This trend is quantified for response of reinforced concrete systems, with details sufficient to permit the displacements involved, to vary as (a^/T) as shown in Fig. 9a. It should be pointed out that the expression (a /T) is dimensionless or that it is modified by a constant of one having the dimension of time in seconds. Both the shape and magnitude of the curve (a /T) are based on a particular interpretation of the variation of the acceleration response with period and judgment as to the maximum amplification to be considered at each period for the given class of base motion and assumed "substitute" damping (9). In this demonstration the form (a^/T) has been selected not because it is universal or correct but because it appears to provide a reasonable upper bound for reinforced concrete structures for motions of the t^pe of El Centro 1940 and because it is simple to evaluate, manipulate, and remember.
The corresponding relationship between effective period and displacement (based on D = A(T/2)^ where D = displacement and T = period) is shown in Fig. 9b.
Assuming that the effective period for a given medium-rise reinforced concrete structure may be estimated by equating the base shear strength coefficient, c, , to the value indicated by (a^/T), the erfective-period estimate is obtained from the intersection of the solid curve and the horizontal broken line in Fig. 9a. The displacement corresponding to the acceleration c,g and the effective period which is simply a^/c^ for the assumed variation of response acceleration is then the magnitude X c in Fig. 9b. Equation 1 expresses this process algebraically with the ratio of the acceleration of gravity to (2)2 rounded to 250 in SI and 10 in the Imperial system of units.
Because Eq. 1 is based on assumption of response reduced by energy dissipation in a structural system excited beyond its yield capacity, a natural lower bound to
is provided by the displacement corresponding to yield. Eq. 1 is not applicable.
Below that limit,
An upper bound is provided by the observation (10) that beyond a certain period the response displacement remains nearly constant. For example, for the type of ground considered this limit may be assumed to be reached at a period of 3 sec. Therefore, the upper limit may be expressed as:
X = 750 a cm e X 30 a cm e
(3a)
(3b)
Where X is the maximum value for X cm c in mm (Eq. 3a) and in inches (Eq. 3b).
It must be repeated that the
particular form of Eq. la depends on the choice of the shape for the acceleration response curve and the assumption that c^ does not change as the effective period changes. Recognising strain hardening effects, it is plausible to assume that c^ increases with effective period (which tends to increase at a decreasing rate with displacement). In that case, the effect of a on X
e c
would not have appeared as strong.
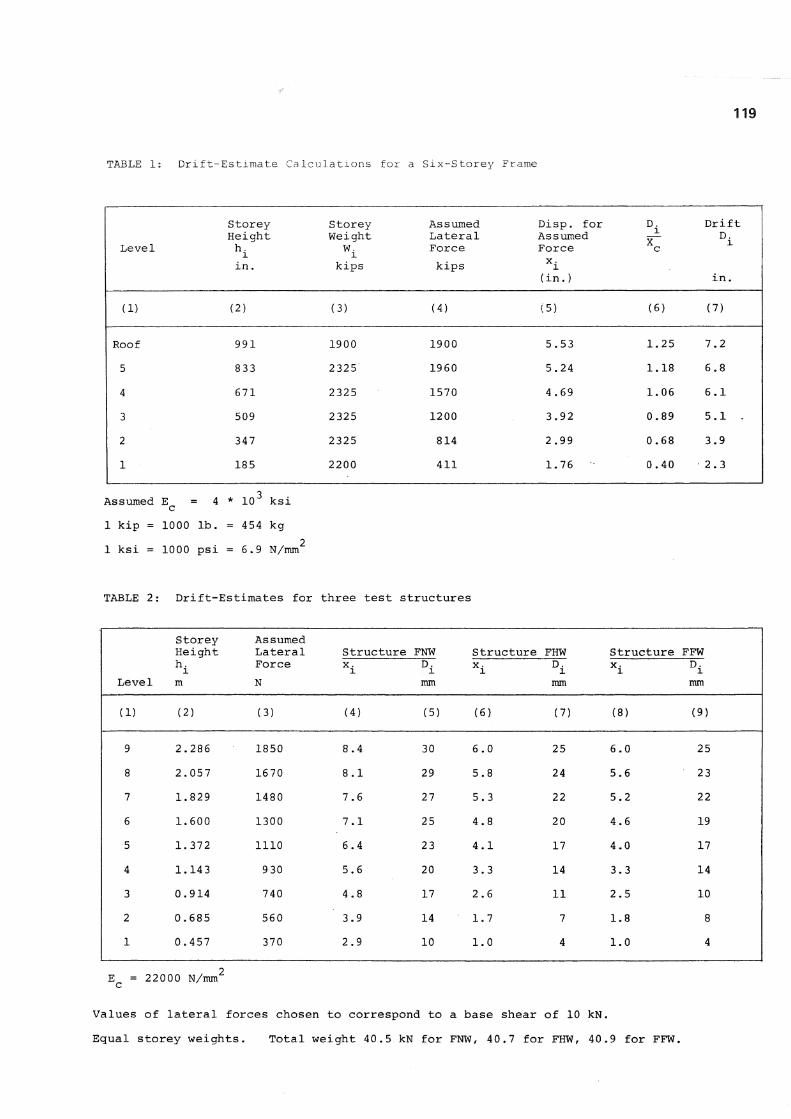
EXAMPLE: Use of the method is best illustrated
by a specific example. Consider the structure of the Imperial County Services Building described in Fig. 1 and 2. Storey heights and design weights are listed in columns 2 and 3 of Table 1.
Displacements x^ calculated for the assumed lateral force distribution (storey-force coefficient"-varying linearly with height above base) are shown in column 5. These displacements were calculated for an assumed Young's modulus of 4000 ksi and for uncracked plain cross-sectional properties of the elements. It should be noted that the magnitudes in column 5 have only relative and not absolute significance. They could have been calculated for a different modulus or for a different set of forces provided the storey-force coefficients varied linearly with height.
The base shear capacity coefficient of the Imperial County Services Building in the east-west direction was calculated to be approximately 0.19 by Kreger (4). This value was based on a simple mechanism involving only the first storey on the rationalization that mechanisms involving upper levels were impeded by nonstructural elements. (Base shear coefficient history derived from acceleration measurements is shown in Fig. 4 ) . The column moments used were determined for general yielding of each section involved with the axial load based on self-weight of the structure. Given c, = 0 .19
D and the measured base acceleration peak coefficient of 0.33,
X = 10 * 0.33 2/0.19 c
= 5.7 in.
Storey-drift estimates, D., are tabulated in column 7 of Table 1.
Values of maximum displacement obtained by integration of the acceleration records above ground relative to that obtained at ground level, were 9.4 in. at roof level, 6.5 in. at level 3, and 2.7 in. at level 1. These values are from twenty to thirty percent higher than the calculated values. It is of interest to note that both the drift of 2.3 in. from Eq. L-2, and the drift of 2.7 from integration of acceleration response at level 1 would imply serious damage to nonstructural components attached to the structure. Such a level of damage in the east-west direction has
118
not been reported. On the basis of crude physical evidence, both quantities may be considered to be overestimates.
EFFECT OF STIFFNESS VARIATION OVER BUILDING HEIGHT:
Results of three small-scale nine-storey structures from a series of four reported by Moehle (11) are used to test the proposed method for estimating relative drift response of structures with frames and walls. The set of three structures contained, as shown in Fig. 10, one frame structure (FNW), one structure with a frame-wall system (FFW), and one also with a frame-wall system but with the wall abruptly discontinued at level four or at mid-height (FHW).
The structures and the tests are described in detail in reference 11. The displacement response measurements to be considered here are those obtained in the "design earthquake" simulation tests for which the target effective peak acceleration coefficient was 0.4g. Records of lateral drift at the top level are also shown in Fig. 10.
The base shear capacity coefficients for the structures were calculated by Moehle (11) to be
Test Structure c, _b FNW 0.27
FHW 0.32
The calculated results confirmed this observation.
SUMMARY:
This paper describes a procedure for estimating lateral drift of reinforced concrete structures subjected to strong earthquake motions.
The procedure is modeled after the spectral-response method with simplifying modifications based on observed dynamic nonlinear response of reinforced concrete structural systems. No explicit dynamic analysis is required. The method has been designed to fit design-office procedures and to have components that can be easily modified on the basis of experience with particular classes of buildings or types of earthquake motions.
The drift, , at a given level i of a structure with initial estimated period ranging from 1/4 to 5/4 sec. is determined from Eq. 4
D. = X • x. • (ZW.x.)/(ZW.x 2) (4) 1 c i i i ' 1 1
X = 250 a /C in mm c e' b = 10 a e / C b in in.
a^ = coefficient of effective peak acceleration for site or region
= coefficient of base shear capacity for a lateral-force distribution as defined for x.
FFW 0.34 The base motions of the test
structures were modeled after the NS component of El Centro 1940 at a time scale "compressed" by a factor of 0.4. A duration of 1 sec. in real time was 0.4 sec. on the simulator platform. Accordingly, amplification for acceleration is also modified by 0.4. Calculated characteristic drifts are:
FNW X c = 250 * (0.4*0.4) 2/0.27 = 24mm
FHW X c = 250 * (0.4*0.4) 2/0.32 = 20mm
FFW X c = 250 * (0.4*0.4) 2/0.34 = 19mm
Storey drift calculations based on Eq. 2 are summarized in Table 2 and the results plotted in Fig. 11 along with the maximum single-amplitude displacements measured at each level of the three structures during the design earthquake simulation test.
The important feature of the comparison in Fig. 11 is not the close correlation between the calculated and measured magnitudes but that the proposed method would have led the user to a reasonable choice among the three types of structures considered, if it is assumed that the choice will be based on drift distribution.
It is also of interest to note that the measured displacement results for structure FHW did not indicate an adverse effect of discontinuing the wall at level 4.
x^ = lateral displacement at level i calculated for a lateral-force distribution defined by (h i/H)W i at each level
W^ = weight assigned to level i
h^ = height above base of level i
H = height above base of top level
Use of Eq. 4, which is a combined form of Eq. 1 and 2 given in the text, is limited to the types of structures and earthquake motions leading to its development. It is intended for application in the case of structures with reasonably uniform mass distributions responding in the nonlinear range for a class of earthquake motion exemplified by El Centro 19 40. Accordingly, the characteristic drift X c is assumed to be bounded by 750 a in mm. and 30 a e e in in. It is assumed that the capacity to dissipate energy of the structure is not impaired in the range of drift amplitudes calculated and that planar analysis will permit plausible estimates of response. The method as described has no parameters to accommodate the influence of stiff brittle elements such as nonstructural walls attached directly to the structure.
Although it is expressed in the form of a method to calculate displacement, the use of the method is intended to be for interpreting experience and evaluating relative merits of different structural schemes and member sizes on the basis of a
119
TABLE 1: Drift-Estimate Calculations for a Six-Storey Frame
Storey Storey Assumed Disp. for D. Drift Height Weight Lateral Assumed X
X D. i Level h. W. Force Force c I l in. kips kips x i
(in.) in.
(1) (2) (3) (4) (5) (6) (7)
Roof 991 1900 1900 5.53 1.25 7.2
5 833 2325 1960 5.24 1.18 6.8
4 671 2325 1570 4.69 1.06 6.1
3 509 2325 1200 3.92 0.89 5.1 .
2 347 2325 814 2.99 0.68 3.9
1 185 2200 411 1.76 0.40 2.3
Assumed E = 4 * 10 ksi c 1 kip = 1000 lb. = 454 kg
1 ksi = 1000 psi = 6 . 9 N/mm'
TABLE 2: Drift-Estimates for three test structures
Level
Storey Height h. l m
Assumed Lateral Force N
Structure x. l
FNW D. . l mm
Structure x i
FHW D. l mm
Structure x i
FFW D. l mm
(1) (2) (3) (4) (5) (6) (7) (8) (9)
9 2.286 1850 8.4 30 6.0 25 6.0 25
8 2.057 1670 8.1 29 5.8 24 5.6 23
7 1.829 1480 7.6 27 5.3 22 5.2 22
6 1.600 1300 7.1 25 4.8 20 4.6 19
5 1.372 1110 6.4 23 4.1 17 4.0 17
4 1.143 930 5.6 20 3.3 14 3.3 14
3 0.914 740 4.8 17 2.6 11 2.5 10
2 0.685 560 3.9 14 1.7 7 1.8 8
1 0.457 370 2.9 10 1.0 4 1.0 4
E = 22000 N/mm'
Values of lateral forces chosen to correspond to a base shear of 10 kN.
Equal storey weights. Total weight 40.5 kN for FNW, 40.7 for FHW, 40.9 for FFW.
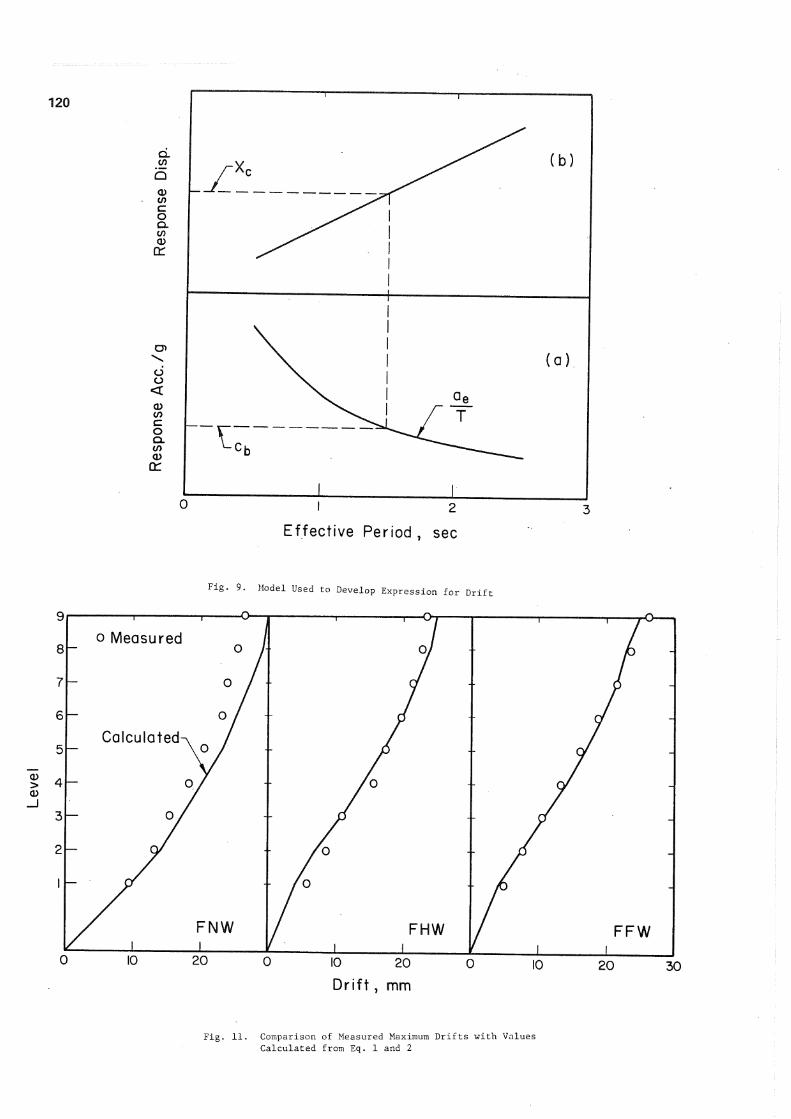
Fig. 9. Model Used to Develop Expression for Drift
Dr i f t , mm
Fig. 11. Comparison of Measured Maximum Drifts with Values Calculated from Eq. 1 and 2

Fig. 10. Test Structures FNW, FHW, and FFW and Measured Displacement Responses at Top Level (After reference 11)

122
tolerable damage criterion. The method 9. is conveniently used in preliminary evaluation by simple estimates of the base shear capacity coefficient, c^, calculated as the required design value increased by a factor depending on the type of structure and local practice.
ACKNOWLEDGMENT: 1 0
Experimental and analytical work leading to the method described in this paper was supported by the U.S. National Science Foundation. ^
REFERENCES:
1. C.J. Rojahn and J.T. Ragsdale, "Strong Motion Records from the Imperial County Services Building, El Centro," Reconnaissance Report, Imperial County California Earthquake, 15 October 19 79, Earthquake Engineering Research Institute, Berkeley, CA, February 1980, pp. 173-184.
2. T.D. Wosser, D. Canipi, M. Fovinci, and W.H. Smith, "On the Earthquake Induced Failure of the Imperial County Services Building," Reconnaissance Report, Imperial County California Earthquake, 15 October 19 79, Earthquake Engineering Research Institute, Berkeley, CA, February 1980, pp. 159-170.
3. C. Arnold, "Architectural Implications," Reconnaissance Report, Imperial County California Earthquake, 15 October 19 79, Earthquake Engineering Research Institute, Berkeley, CA, February 1980, pp. 111-138.
4. M.E. Kreger, "Experimental Analysis of the Imperial County Services Building," Structural Research Series No. 610, Department of Civil Engineering, University of Illinois, Urbana, 1983.
5. G.C. Pardoen, "Imperial County Services Building - Ambient Vibration Test Results", Civil Engineering Report, 79-14, University of Canterbury, Christchurch, New Zealand, December 19 79 .
6. H. Cecen, "Response of Ten-Storey Model Frames to Simulated Earthquakes," Ph.D. Dissertation submitted to the Graduate College of the University of Illinois, Urbana, October, 19 79.
7. J.D. Aristizabal-Ochoa, "Dynamic Response of Coupled Wall Systems," Journal of the Structural Division, Vol. 108, No. ST8, August 1982, pp. 1846-1857.
8. P. Gulkan and M.A. Sozen, "Inelastic Response of Reinforced Concrete Structures to Earthquake Motions," Journal of the American Concrete Institute, No. 12, December 19 74, pp. 604-610.
A. Shibata and M.A. Sozen, "Substitute-Structure Method for Seismic Design in Reinforced Concrete; Journal of the Structural Division, American Society of Civil Engineers, Vol. 10 2, No. ST1, January 19 76, pp. 1-78.
J.A. Blume, N.M. Newmark, and L.H. Corning, "Design of Multistorey Reinforced Concrete Buildings for Earthquake Motions", Portland Cement Association, Skokie, 1961, p. 9.
J.P. Moehle and M.A. Sozen, "Experiments to Study Earthquake Response of R/C Structures with Stiffness Interruptions," Structural Research Series No. 482, Department of Civil Engineering, University of Illinois, Urbana, 19 80.