lateral load behavior of drilled shafts - research library...
TRANSCRIPT

LATERAL LOAD BEHAVIOR OF DRILLED SHAFTS
by
Robert C. Welch Lymon C. Reese
Research Report Number 89-10
Soil Properties as Related to Load Transfer Characteristics in Drilled Shafts
Research Project 3-5-65-89
conducted for
The Texas Highway Department
in cooperation with the U. S. Department of Transportation
Federal Highway Administration
by the
CENTER FOR HIGHWAY RESEARCH
THE UNIVERSITY OF TEXAS AT AUSTIN
May 1972
The contents of this report reflect the views of the authors, who are responsible for the facts and the accuracy of the data presented herein. The contents do not necessarily reflect the official views or policies of the Federal Highway Administration. This report does not constitute a standard, specification, or regulation.
ii

PREFACE
This report is the tenth in a series of reports presenting results of
Research Project 3-5-65-89, Soil Properties as Related to Load Transfer
Characteristics in Drilled Shafts. It presents results of a study under
taken to find a method for predicting soil response for laterally loaded
drilled shafts, especially in stiff clay. The response to short-term
static loading and to repeated applications of load was studied. The
results of an experimental program in stiff clays and a survey of the
state-of-the-art for predicting response to lateral loads for other soils
are given.
Acknowledgement of their efforts in completing this project is due to
the staff of the Center for Highway Research, notably Hap Dalrymple, Olen
Hudson, Fred Koch, and Jim Anagnos for their assistance in the field tests;
Mark Toth for his careful and painstaking laboratory work; and Miss Cheryl
Johnson and Mrs. Sue Penn for their work in keypunching and guiding the
data reduction process. The project contact representatives from the Texas
Highway Department, H. D. Butler and Horace Hoy, were helpful in coordinating
and expediting the work. The financial assistance rendered by the Texas
Highway Department and the U.S. Bureau of Public Roads is gratefully
acknowledged.
Data obtained during the field tests is on file at the Center for
Highway Research and available to interested parties.
May, 1972
iii
Robert C. Welch
Lymon C. Reese

!!!!!!!!!!!!!!!!!!!"#$%!&'()!*)&+',)%!'-!$-.)-.$/-'++0!1+'-2!&'()!$-!.#)!/*$($-'+3!
44!5"6!7$1*'*0!8$($.$9'.$/-!")':!
LIST OF REPORTS
Report No. 89-1, "Field Testing of Drilled Shafts to Develop Design Methods," by Lyman C. Reese and W. Ronald Hudson, describes the overall approach to the design of drilled shafts based on a series of field and laboratory investigations.
Report No. 89-2, "Measurements of Lateral Earth Pressure in Drilled Shafts," by Lyman C. Reese, J. Crozier Brown, and H. H. Dalrymple, describes the development and evaluation of pressure gages to measure lateral-earth pressures on the drilled shaft.
Report 89-3, "Studies of Shearing Resistance Between Cement Mortar and Soil," by John W. Chuang and Lymon C. Reese, describes the overall approach to the design of drilled shafts based on field and laboratory investigations.
Report No. 89-4, "The Nuclear Method of Soil-Moisture Determination at Depth," by Clarence J. Ehlers, Lymon C. Reese, and James N. Anagnos, describes the use of nuclear equipment for measuring the variations of moisture content at the drilled shaft test sites.
Report No. 89-5, "Load Distribution for a Drilled Shaft in Clay Shale," by Vasant N. Vijayvergiya, W. Ronald Hudson, and Lymon C. Reese, describes the development of instrumentation capable of measuring axial load distribution along a drilled shaft, the development, with the aid of full-scale load testing, of a technique of analysis of observed data, and the correlation of observed data with the Texas Highway Department cone penetration test.
Report No. 89-6, "Instrumentation for Measurement of Axial Load in Drilled Shafts," by Walter R. Barker and Lymon C. Reese, describes the development and performance of various instrumentation systems used to measure the axial load distribution in field tests of full-scal~ drilled shafts.
Report No. 89-7, "The Determination of Soil Properties In Situ," by David B. Campbell and W. Ronald Hudson, describes the use of the Menard Pressuremeter, the Texas Highway Department cone penetrometer, and The University of Texas in situ device in estimating soil properties in situ and estimating load transfer values obtained from drilled shaft tests.
Report No. 89-8, "Behavior of Axially Loaded Drilled Shafts in Beaumont Clay," by Michael W. O'Neill and Lymon C. Reese, describes the results of axial load tests of instrumented drilled shafts having varying geometry and differing methods of installation and presents a tentative design procedure for drilled shafts in Beaumont Clay.
v
vi
Report No. 89-9, "Load Carrying Characteristics of Drilled Shafts Constructed with the Aid of Drilling Fluids," by Walter R. Barker and Lymon C. Reese, describes the construction, instrumentation, and testing of a drilled shaft constructed with the use of drilling mud.
Report No. 89-10, "Lateral Load Behavior of Drilled Shafts," by Robert C. Welch and Lymon C. Reese, describes the test procedures and results for lateral loading of an instrumented drilled shaft and presents criteria for developing design curves for drilled shafts in stiff clay.
ABSTRACT
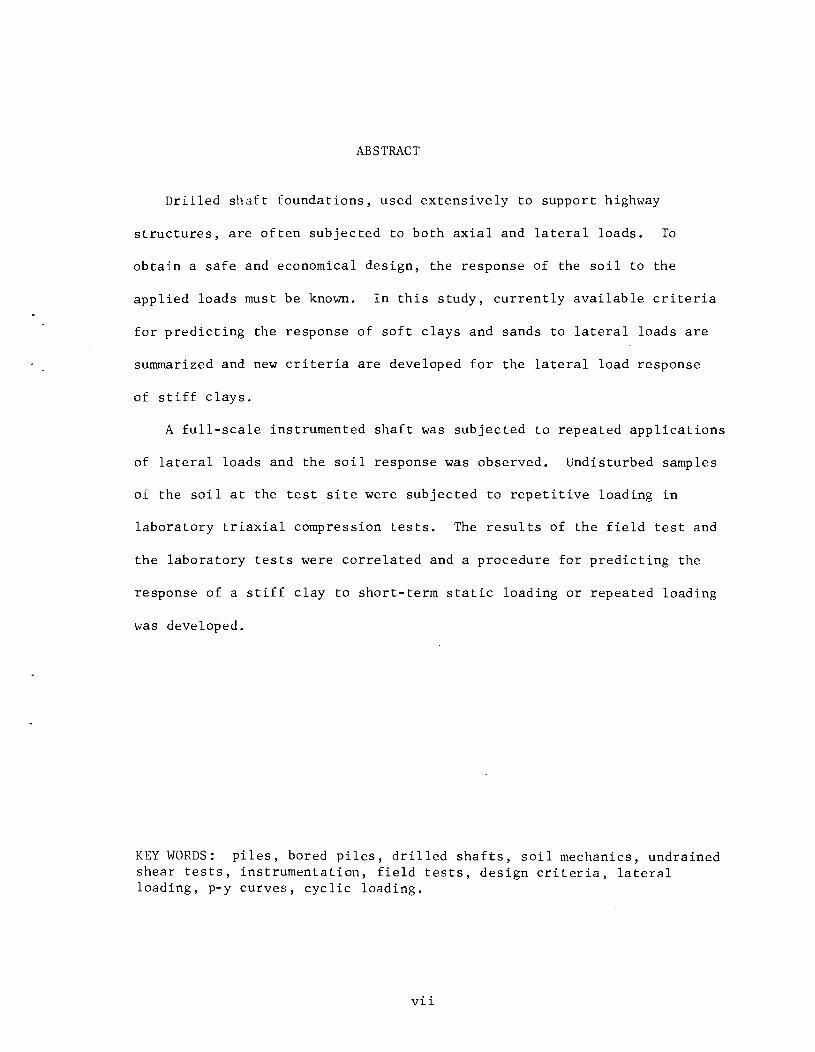
Drilled shaft foundations, used extensively to support highway
structures, are often subjected to both axial and lateral loads. To
obtain a safe and economical design, the response of the soil to the
applied loads must be known. In this study, currently available criteria
for predicting the response of soft clays and sands to lateral loads are
summarized and new criteria are developed for the lateral load response
of stiff clays.
A full-scale instrumented shaft was subjected to repeated applications
of lateral loads and the soil response was observed. Undisturbed samples
of the soil at the test site were subjected to repetitive loading in
laboratory triaxial compression tests. The results of the field test and
the laboratory tests were correlated and a procedure for predicting the
response of a stiff clay to short-term static loading or repeated loading
was developed.
KEY WORDS: piles, bored piles, drilled shafts, soil mechanics, undrained shear tests, instrumentation, field tests, design criteria, lateral loading, p-y curves, cyclic loading.
vii

!!!!!!!!!!!!!!!!!!!"#$%!&'()!*)&+',)%!'-!$-.)-.$/-'++0!1+'-2!&'()!$-!.#)!/*$($-'+3!
44!5"6!7$1*'*0!8$($.$9'.$/-!")':!
SUMMARY
Research Report No. 89-10, the tenth in a series of reports issued
for Research Project 3-5-65-89, describes methods for predicting the
lateral deflection versus soil reaction relationship for laterally loaded
drilled shafts in the most commonly encountered soil types. For clay soils,
the methods cover short-term static loading and repeated loading, while
only short-term static loading is considered for sands.
Emphasis is placed upon the behavior of laterally loaded drilled shafts
in stiff clay. The methods presented for predicting the response of stiff
clay are based upon a correlation of the results of a full-scale field
test with the results of a laboratory testing program. For other soils
the best methods currently available are summarized.
ix

!!!!!!!!!!!!!!!!!!!"#$%!&'()!*)&+',)%!'-!$-.)-.$/-'++0!1+'-2!&'()!$-!.#)!/*$($-'+3!
44!5"6!7$1*'*0!8$($.$9'.$/-!")':!
IMPLEMENTATION STATEMENT
The methods of predicting soil response to lateral loads presented in
this report are believed to be the best currently available. These methods
may be used to determine soil support data required as input for the
various computer programs developed by Project 3-5-63-56 and Project 3-5-68-117.
The soil parameters required for the methods presented may be readily
determined by standard testing procedures or, in the case of repeated
loading, by modifications of standard procedures requiring no special
apparatus. It is recommended that the methods presented for determining
soil response to lateral loads be used whenever assessment of the lateral
load capacity of a drilled shaft or pile foundation is required.
xi

!!!!!!!!!!!!!!!!!!!"#$%!&'()!*)&+',)%!'-!$-.)-.$/-'++0!1+'-2!&'()!$-!.#)!/*$($-'+3!
44!5"6!7$1*'*0!8$($.$9'.$/-!")':!
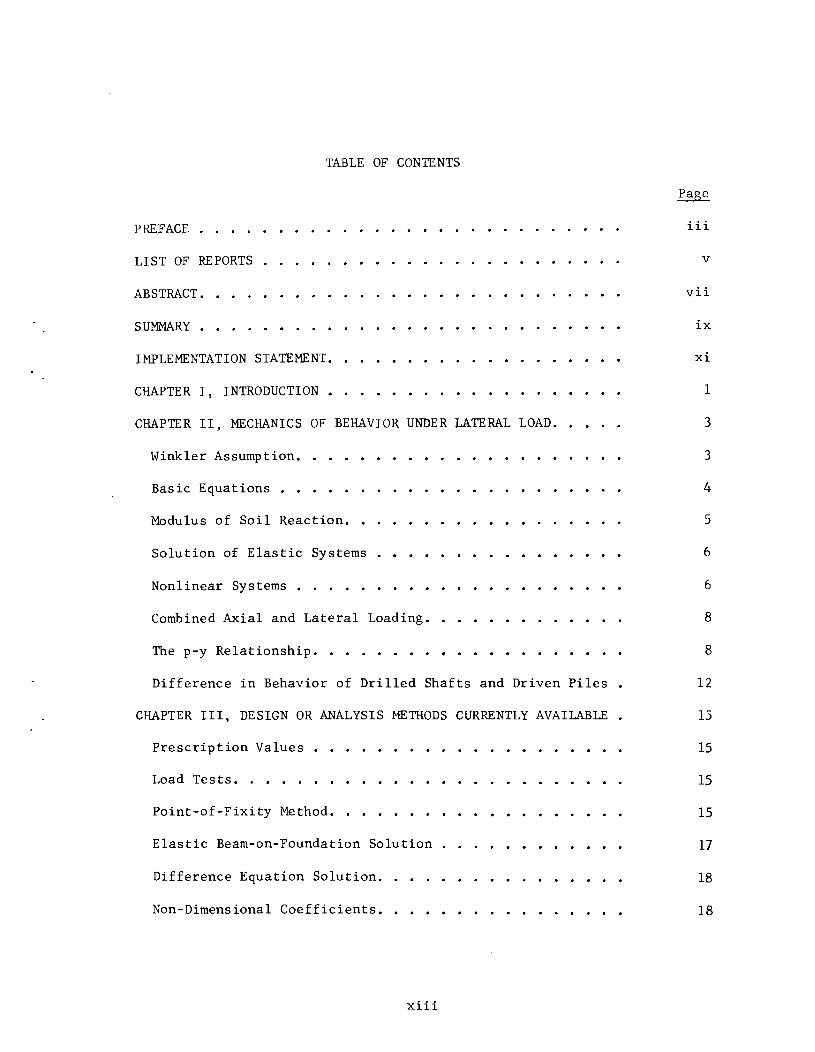
TABLE OF CONTENTS
PREFACE
LIST OF REPORTS •
ABSTRACT.
SUMMARY •
IMPLEMENTATION STATEMENT.
CHAPTER I, INTRODUCTION.
CHAPTER II, MECHANICS OF BEHAVIOR UNDER LATERAL LOAD. •
Winkler Assumption.
Basic Equations
Modulus of Soil Reaction.
Solution of Elastic Systems
Nonlinear Systems •
Combined Axial and Lateral Loading .•
The p-y Relationship •••
Difference in Behavior of Drilled Shafts and Driven Piles
CHAPTER III, DESIGN OR ANALYSIS METHODS CURRENTLY AVAILABLE
Prescription Values
Load Tests. . .
Point-of-Fixity Method.
Elastic Beam-on-Foundation Solution
Difference Equation Solution.
Non-Dimensional Coefficients ••
xiii
iii
v
vii
ix
xi
1
3
3
4
5
6
6
8
8
12
15
15
15
15
17
18
18
xiv
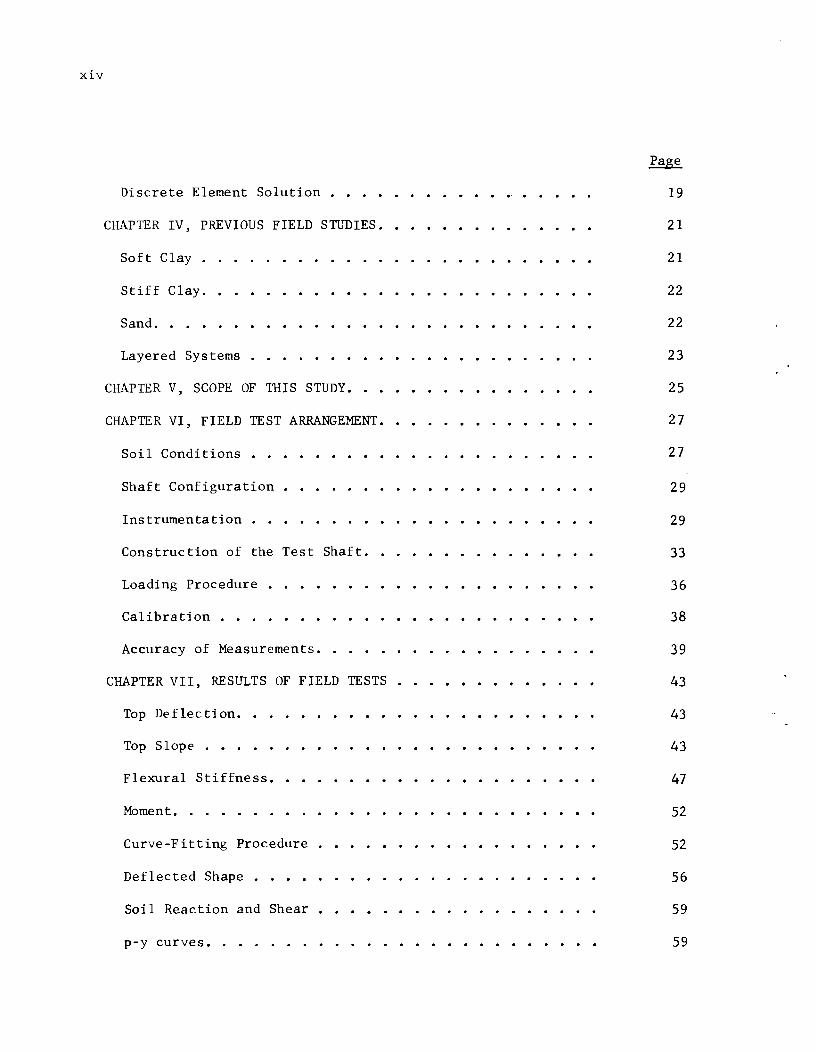
Discrete Element Solution . • • •
CHAPTER IV, PREVIOUS FIELD STUDIES.
Soft Clay
Stiff Clay. •
Sand .•
Layered Systems
CHAPTER V, SCOPE OF THIS STUDY •••
CHAPTER VI, FIELD TEST ARRANGEMENT. • •
Soil Conditions • • . •
Shaft Configuration •
Instrumentation
Construction of the Test Shaft.
Loading Procedure •
Calibration
Accuracy of Measurements .•
CHAPTER VII, RESULTS OF FIELD TESTS
Top Deflec tion.
Top Slope . • .
Flexural Stiffness.
Moment ...•
Curve-Fitting Procedure •
Deflected Shape •
Soil Reaction and Shear .
p-y curves. .
Page
19
21
21
22
22
23
25
27
27
29
29
33
36
38
39
43
43
43
47
52
52
56
59
59

CHAPTER VIII, RESULTS OF LABORATORY TESTS •
Triaxial Compression Tests.
Anisotropy. . .
Undrained Shear Strength.
Stiffness
Stress-Strain Relationship.
Repeated Loading. • •
CHAPTER IX, CORRELATION OF FIELD AND LABORATORY TESTS
Load-Deformation Relationships.
Effect of Repeated Loading •..
Verification of Proposed Criteria ••
Comparison With Other Criteria ..
CHAPTER X, PROCEDURES FOR PREDICTING SOIL RESPONSE
Soft Clay--Short-Term Static Loads .•
Soft Clay--Cyclic Loads . • •
Stiff Clay--Short-Term Static Loads
StH f Clay- -Cyc1 ic Loads. . . •
Sand--Short-Term Static Loads •
Sand--Cyclic Loads ..
CHAPTER XI, CONCLUSIONS AND RECOMMENDATIONS
Conclusions •.
Recommendations for Future Study.
REFERENCES. •
APPENDIX. .
Page
75
75
75
76
76
76
79
83
83
84
91
94
99
99
100
101
103
104
106
107
107
109
111
117
xv

!!!!!!!!!!!!!!!!!!!"#$%!&'()!*)&+',)%!'-!$-.)-.$/-'++0!1+'-2!&'()!$-!.#)!/*$($-'+3!
44!5"6!7$1*'*0!8$($.$9'.$/-!")':!
CHAPTER I
INTRODUCTION
Recent years have seen the development and wide-spread acceptance
of a foundation element commonly called a drilled shaft, bored pile,
drilled-in pile, or other equally descriptive term. In this study,
the term drilled shaft will be used. The feature which distinguishes
drilled shafts from piles is the construction procedure. A drilled
shaft is a reinforced concrete foundation element cast in a previously
drilled hole in the ground while piles are driven and displace the soil
as they penetrate. Drilled shafts may be constructed with enlarged
bases with the view that most of the axial load will be carried in end
bearing, or they may be constructed with straight sides with the view that
most of the axial load will be carried by "skin-friction." The construction
sequence usually consists of drilling the hole, placing the reinforcement
in the hole, and depositing the concrete. With construction equipment
and methods currently in use, drilled shafts as small as 12 to 18 inches
in diameter and as large as 10 to 15 feet in diameter may be successfully
installed. The most commonly encountered sizes of drilled shafts have
diameters in the range of 24 to 48 inches.
In highway construction, drilled shafts are used extensively for
foundations of bridges, highway interchanges, and retaining structures.
Large highway sign structures are often supported on drilled shafts.
In addition to the vertical loads resulting from the weight of the
structure and the live load imposed by vehicles, most highway structures
must resist some horizontal loading. These horizontal loads are derived
1

2
from the action of wind, and in the case of bridges, from water current
acting upon the structure and upon any debris which may have accumulated
against the structure. Vehicle braking forces and centrifugal forces
generated by vehicles traveling at speed on a curved section of an elevated
structure are other sources of horizontal loading. Lateral earth pressures
create horizontal loads on drilled shafts used to support retaining structures.
In order to design a structure that is both adequate and economical,
the designer must have knowledge of the load-deformation properties of the
supports. The stresses which the structure will generate in the foundation
elements must also be determined. The behavior of drilled shaft foundations
under axial load has been investigated by O'Neill and Reese (1971). The
purpose of the study reported herein is to define the behavior of drilled
shaft foundation elements under lateral load. The stresses occurring in
the shaft as well as the load-deformation characteristics of the shaft
are to be determined.
The method selected to accomplish the desired objective was to construct
and test a full-scale foundation and to correlate the observed behavior
with the available theory and with soil properties obtained from laboratory
tests on undisturbed soil samples. A summary of the theory involved in the
analysis of laterally loaded foundation elements is presented in the
following chapter. The results of the laboratory tests and the field test
are given in later chapters.
CHAPTER II
MECHANICS OF BEHAVIOR UNDER LATERAL LOAD
The analysis of a foundation element such as a drilled shaft or a
pile under lateral load falls into the general category of beams-on
foundation. The problem of elastic beams on elastic foundations has
been studied for many years with the result that solutions are available
for many cases. A complete solution of a beam-on-foundation problem
would yield values of deflection, slope, moment, shear, and soil reaction
at all points along the beam.
~~~~ Assumption
Usually the problem is approached by considering the foundation soil
as a continuous, isotropic, elastic continuum or by making the assumption
attributed to Winkler (1867) that:
1. The soil acts as a series of closely spaced discrete springs.
Use of the Winkler assumption implies:
2. There is no coupling of adjacent soil elements,
3. The soil deforms only under the loaded area.
Hetenyi (1946) states that Winkler's assumption often represents actual
conditions better than more complicated analyses based upon the treatment
of the foundation as a continuous isotropic continuum. Vesic (1961)
compared solutions using the Winkler assumption with those obtained
for an isotropic elastic solid. His study shows thal the difference is
quite small (on the order of five per cent or less) except for short rela
tively rigid foundation elements. For an infinitely rigid element, the
3
4
difference is slightly less than 15 per cent. In the discussion which
follows, the solution using Winkler springs will be assumed valid.
Basic Equations
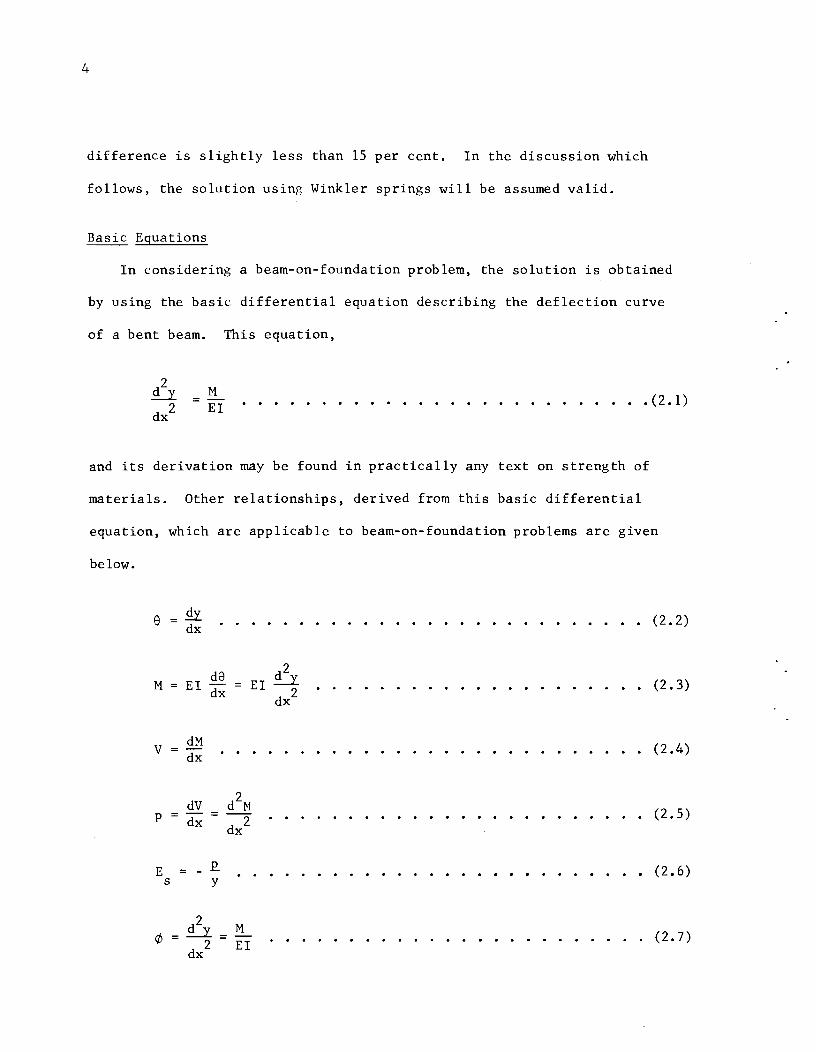
In considering a beam-on-foundation problem, the solution is obtained
by using the basic differential equation describing the deflection curve
of a bent beam. This equation,
M EI ........................ .. (2.1)
and its derivation may be found in practically any text on strength of
materials. Other relationships, derived from this basic differential
equation, which are applicable to beam-on-foundation problems are given
below.
e
M
v
p
E s
~ dx
.......................... . (2.2)
EI de dx
£y EI 2 •.••••••••••••••••••• (2.3)
dx
dM dx
.......................... . (2.4)
= dx dx2
....................... . (2.5)
£. y ......................... . (2.6)
.•..•.•.••.•••.•••••.••• (2.7)
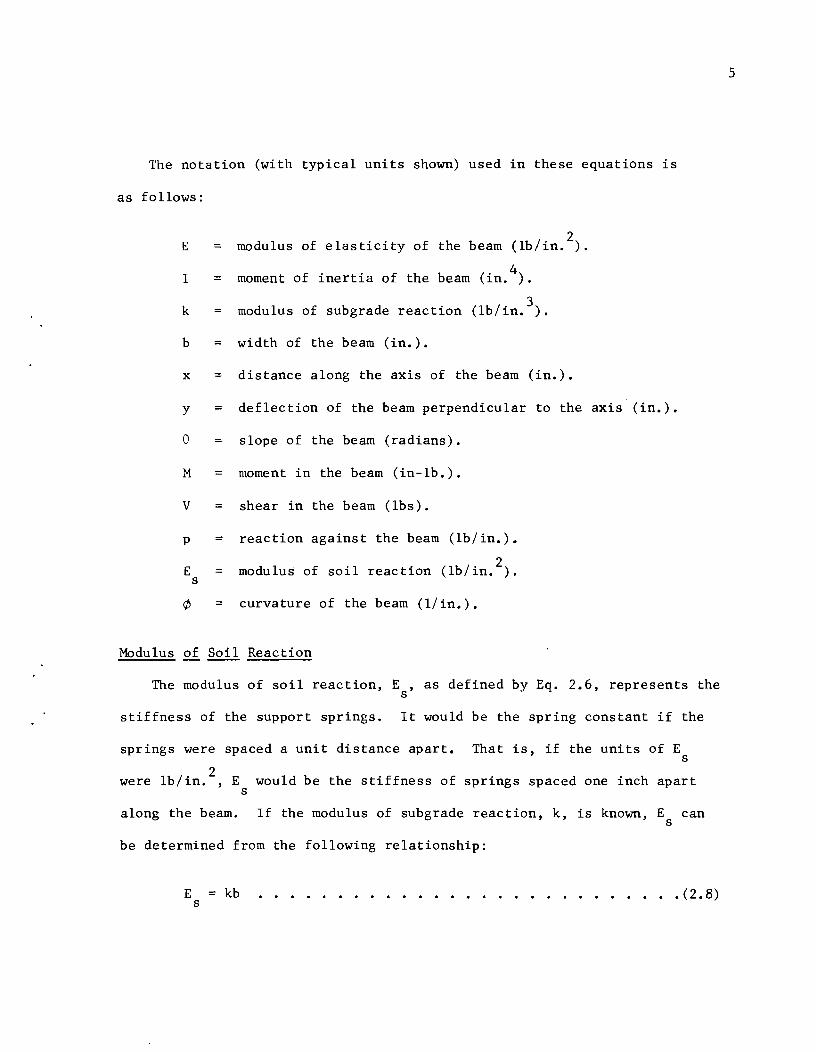
The notation (with typical units shown) used in these equations is
as follows:
E modulus of elasticity of the beam (lb/in.2).
I = moment of inertia of the beam (in.4).
k modulus of subgrade reaction (lb/in.3).
b width of the beam (in.).
x = distance along the axis of the beam (in.).
y = deflection of the beam perpendicular to the axis (in.).
e slope of the beam (radians).
M moment in the beam (in-lb.).
V shear in the beam (lbs).
p = reaction against the beam (lb/in.).
E modulus of soil reaction (lb/in.2).
s
¢ curvature of the beam (l/in.).
Modulus of Soil Reaction
The modulus of soil reaction, E , as defined by Eq. 2.6, represents the s
stiffness of the support springs. It would be the spring constant if the
springs were spaced a unit distance apart. That is, if the units of E s
were Ib/in.2
, E would be the stiffness of springs spaced one inch apart s
along the beam. If the modulus of subgrade reaction, k, is known, E can s
be determined from the following relationship:
E = kb • • • • . • • • • • • • • • . . . • . . . • • • • • • (2. 8) s
5
6
Solution of Elastic Systems
For elastic beams on elastic supports, several solutions are presented
by Hetenyi (1946). The solutions consider various loading conditions,
variation of beam stiffness along the axis, variation of support stiffness
along the beam axis, and a varied series of support conditions. Most of
the solutions, other than those with a constant beam stiffness and a con-
stant or linear variation of E along the beam, are rather complicated s
and tedious. Approximate solutions, using finite difference techniques
such as those given by Palmer and Thompson (1948) and Gleser (1953) , are
easily handled by electronic computers and can be refined to any degree
accuracy that may be required. Such methods are in general use for the
solution of beam-on-foundation problems.
Nonlinear Systems
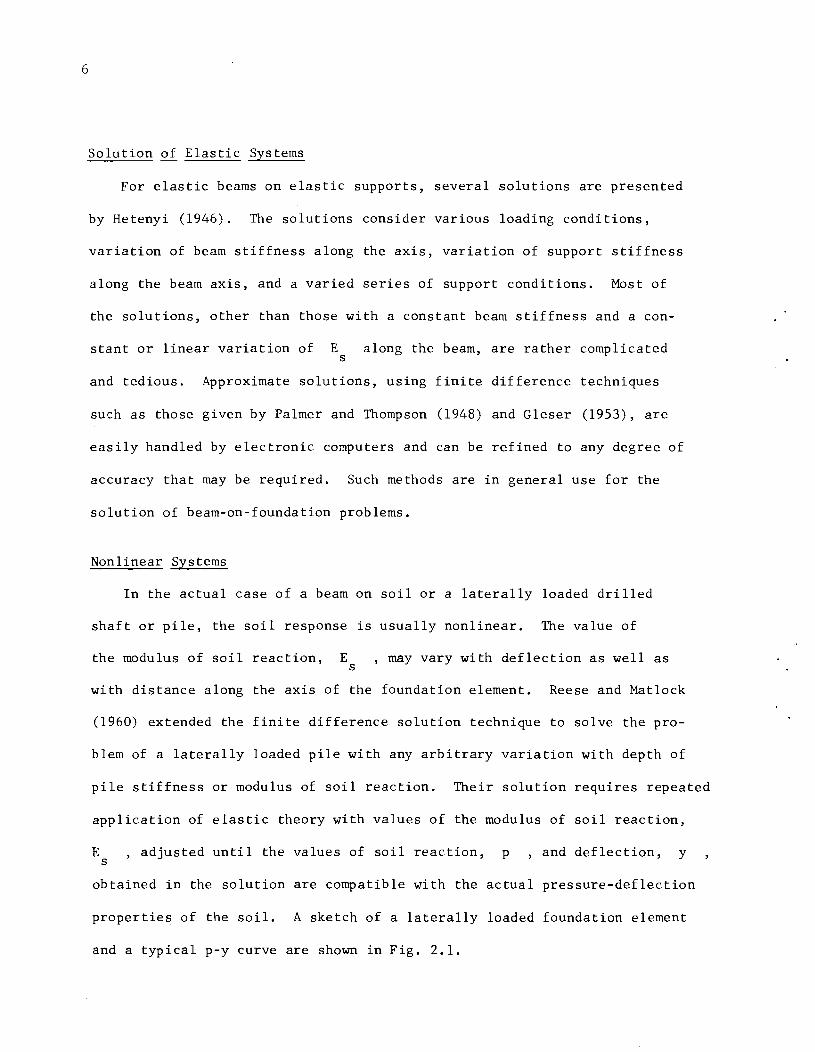
In the actual case of a beam on soil or a laterally loaded drilled
shaft or pile, the soil response is usually nonlinear. The value of
the modulus of soil reaction, E s
, may vary with deflection as well as
of
with distance along the axis of the foundation element. Reese and Matlock
(1960) extended the finite difference solution technique to solve the pro-
blem of a laterally loaded pile with any arbitrary variation with depth of
pile stiffness or modulus of soil reaction. Their solution requires repeated
application of elastic theory with values of the modulus of soil reaction,
E ,adjusted until the values of soil reaction, p s
and deflection, y
obtained in the solution are compatible with the actual pressure-deflection
properties of the soil. A sketch of a laterally loaded foundation element
and a typical p-y curve are shown in Fig. 2.1.
(E1)3
(El)n
a. Laterally Loaded Pile
a. ~
c o
:.;:: u o Q)
a::
o Cf)
a. ~
c .Q -u 0 Q)
a::
'0 Cf)
Deflection, y
h. Linear Soil Support
Def lection, y c. Nonlinear Soil Support
Fig. 2.1 Representation of a Laterally Loaded Foundation Element
8
Combined ==-=- Loading
In most cases the primary loading on drilled shafts or piles is an
axial load. There is, of course, an interaction between the effects of
horizontal and vertical loading on the drilled shaft. The application
of a horizontal load or a moment reduces the axial stiffness of the ele-
ment. The flexural stiffness is reduced by axial compression and increased
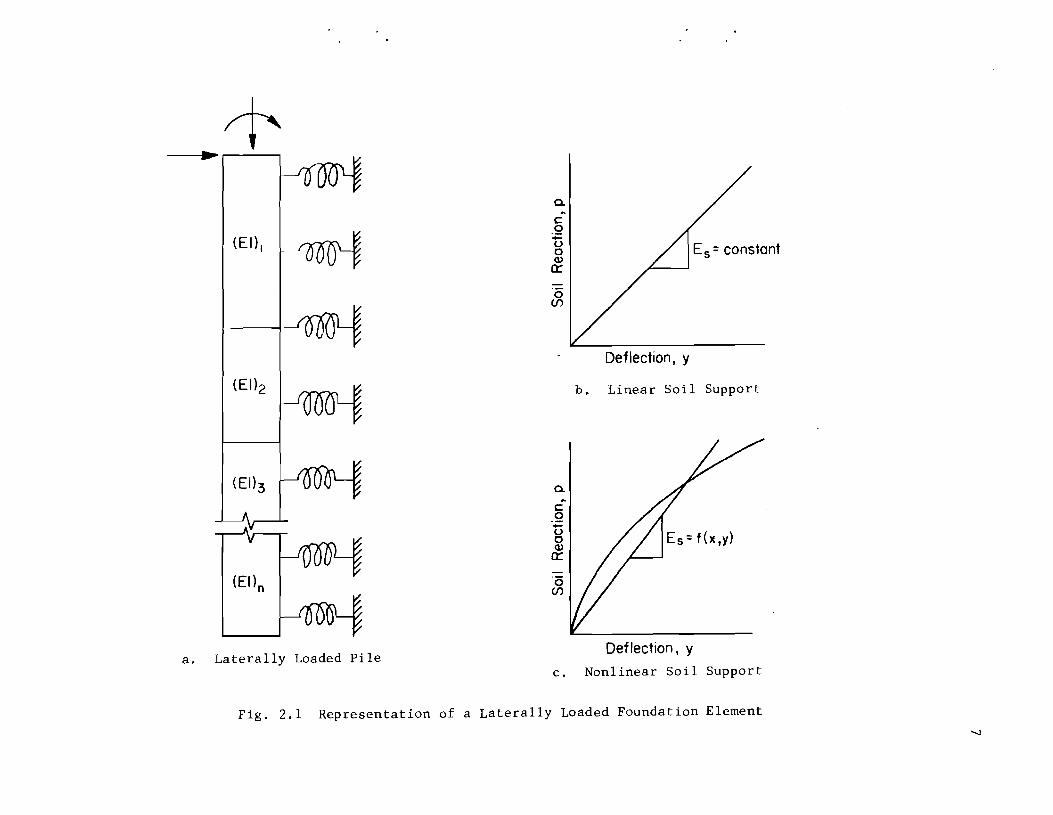
by axial tension. The basic fourth-order differential equation, extended
to include the effects of a constant axial force, P , is:
o ................... (2.9)
The derivation and solution of this equation are given by Hetenyi (1946).
Except for the case of a shaft or pile penetrating a very soft stratum
and deriving all of its capacity from an underlying dense sand or rock
stratum, the axial force will not be constant along the length of the
shaft. If the distribution of axial load along the shaft is known, a
solution can be obtained by considering the shaft as a series of segments,
each with a constant axial load.
It should be emphasized at this point that the soil response to lateral
load, defined by the p-y relationship, is dependent upon many variables
such as soil type, shear strength parameters, moisture conditions, effective
stress, stress history, and loading conditions. The p-y curves will
be different for short term static loading, sustained loading, cyclic

loading, and dynamic loading. One of the purposes of this study is to
present a method of determining p-y curves for repeated application of
short-term static loads in stiff clay. Other investigators have dealt
with soft clay and sand. Their results will be discussed in later chapters.
The difference between the analyses of a horizontal beam-on-foundation
and a laterally loaded drilled shaft or pile lies primarily in the deter
mination of the maximum resistance of the soil. The maximum resistance
of horizontal beams-on-foundation may be determined by applying conven
tional bearing capacity theory. To determine the maximum soil resistance
for the laterally loaded pile or drilled shaft, the mode of failure must
first be considered. Near the surface, the mode of failure will be that
of a passive wedge of soil moving upward and outward, while at greater
depths the soil will fail by flowing around the shaft. Reese (1958, 1962)
has described the modes of failure shown in Fig. 2.2 for both cohesive
9
and cohesionless soils. Since the actual modes of failure may not correspond
to those assumed, the resulting expressions should be considered asapproxi
mations to be modified by the results of experiments.
The depth of transition from the wedge to the flow-around failure is
determined by the effective unit weight and shear strength of the soil and
by the shaft width. Reese (1958) developed the expression given below for
the maximum resistance of a passive wedge in cohesive soil. (For cohesive
soil it is assumed that a
Pu = [3 + :x + 2.83 ~ J cb •.••.••••••••••••• (2.10)

10
m-n 0-
q-r
n
a. Wedge Failure (After Reese, 1962).
0/1 //1_
/ I ~l [31' A 1- I' I I'
J " E
o
\ \
\ \
\
n
\ \
y ..
c
h. Flow-Around Failure (after Reese, 1958).
Fig. 2.2 Modes of Soil Failure
\ \ \
\ \ \\
\ -~ r q<y
A
B

Matlock (1970) reports some field tests which indicate that the factor
2.83 in the above expression should be on the order of 0.25 to 0.5 for
soft clays. He recommends a value of 0.5 for use with offshore clays in
the Gulf of Mexico. No values have been reported for stiff clays.
At great depths, the bearing capacity factor for deep footings in clay
developed by Skempton (1951) is applicable. The expression for maximum
resistance in the flow-around mode is as follows:
Pu 9 cb •••••••.•..•••••••••.••••• (2.11)
By equating the values of Pu in equations 2.10 and 2.11 and solving for
x , the depth of transition from the passive wedge to the flow-around mode
may be found.
In cohesionless soils, the maximum resistance of the passive wedge has
been given by Reese (1962) as:
11
Pu = Y x lb (Kp - KA) + x ~ (tan Q' tan S) + x K tan e (tan C/J - tan Q')} .(2.12)
where
Kp = passive earth pressure coefficient,
KA active earth pressure coefficient, and
K earth pressure coefficient for sides of wedge.
From Mohr-Coulomb theory the angle S = 45° + C/J/2 is known. Values of K
and Q' are suggested by Bowman (1958) and Parker and Reese (1971).
The ultimate resistance at depths where flow-around failure occurs is
given by Parker and Reese (1971).
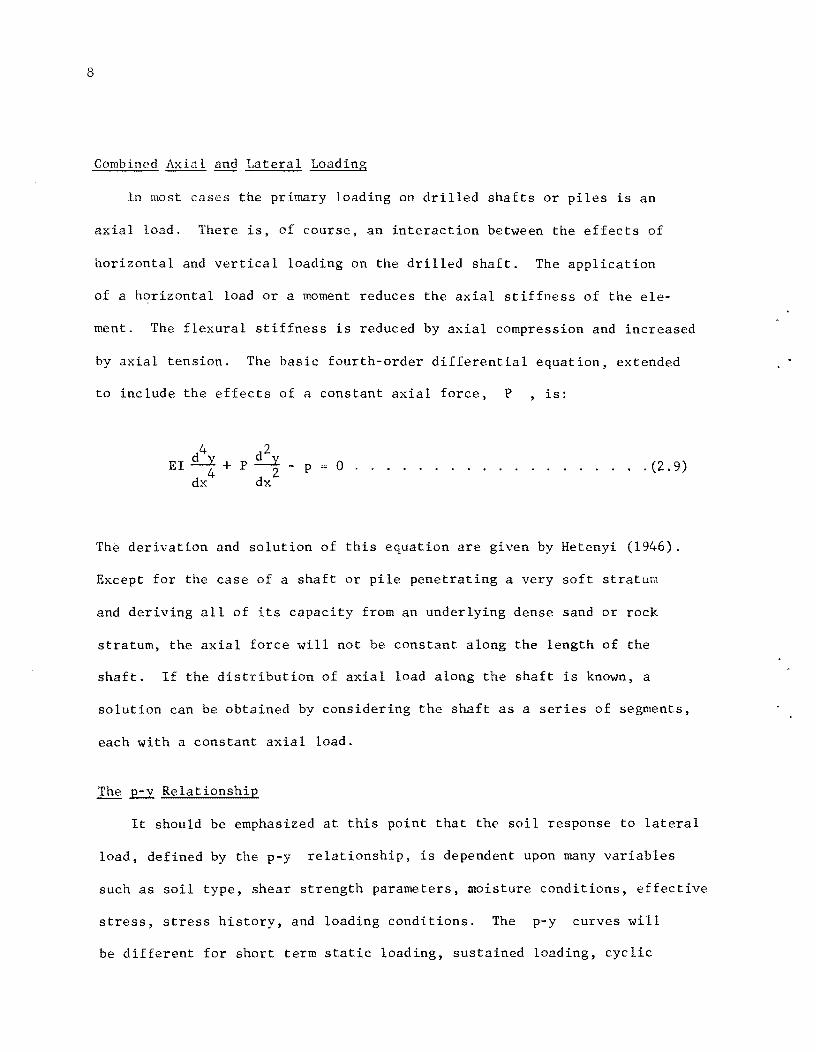
12
3 2 Pu yb x (Kp + 2 ~ K tan ~ + 2 K tan ~ - KA) •••••• (2.13)
The transition from wedge failure to flow-around will occur when the
resistance to flow-around is less than the force required to move the wedge.
The problem which now remains is to define the pressure-deflection or
p-y relationship. This can be done by (1) measuring or calculating values
of soil pressure and deflection from the results of instrumented field
tests, (2) assuming a correlation with stress-strain properties measured
in the laboratory, or (3) assuming a characteristic shape for the pressure-
deflection curve. McClelland and Focht (1958) developed a method for
predicting p-y curves from the results of laboratory compression tests.
Matlock (1970) and Parker and Reese (1971) assume a characteristic shape
and present criteria for determining p-y curves. Detailed procedures for
determining p-y curves, representing the current state-of-the-art, will be
presented in a later chapter.
Difference in Behavior of Drilled Shafts and Driven Piles
Any difference in behavior between drilled shafts and driven piles will
be due primarily to the influence of the method of construction. The
driving of displacement piles in cohesive soils is accompanied by a dis-
turbance of the surrounding soil and a subsequent consolidation under the
pressures created by the displacement of the adjacent soil. The amount of
disturbance and displacement are sometimes reduced by drilling a pilot
hole slightly smaller than the pile and a few feet shorter than the proposed
tip depth. The net effect of pile-driving operations upon the soil properties
of the clay. In highly sensitive clays, the net effect may be a loss of
strength whereas in relatively insensitive clays a slight strength gain
may be experienced.
During the construction of drilled shafts the soil adjacent to the
13
shaft experiences a release of stress during the excavation and reapplication
of stress as the wet concrete is placed. The drilling of the hole produces
some disturbance of the soil adjacent to the shaft. The effect of the
release of stress upon soil strength will depend upon the length of time
the hole is allowed to stand open before the concrete is deposited. After
the concrete is placed, there may be some migration of cement or cement
paste into the soil immediately adjacent to the shaft which would tend to
increase the strength in this area. This migration is believed to be
quite limited and would probably have no effect upon the lateral response
of a drilled shaft.
Intuitively, it seems that the behavior of drilled shafts and driven
piling in most clay soils would be essentially the same. In sand, however,
the densification of the sand caused by vibration and displacement during
pile driving would probably result in a stiffer response for driven piles
than for drilled shafts.

!!!!!!!!!!!!!!!!!!!"#$%!&'()!*)&+',)%!'-!$-.)-.$/-'++0!1+'-2!&'()!$-!.#)!/*$($-'+3!
44!5"6!7$1*'*0!8$($.$9'.$/-!")':!
CHAPTER III
DESIGN OR ANALYSIS METHODS CURRENTLY AVAILABLE
Traditionally, horizontal loads on pile-supported structures have
been resisted by the horizontal component of the axial resistance of
batter piles. In some cases, however, it is not possible or practical
to use batter piles, thus requiring that the lateral resistance of
vertical piles be estimated. Some of the methods used to determine
lateral resistance will be briefly presented in this chapter.
Prescription Values
Feagin (1937), McNulty (1956), Teng (1962), and various building codes
give allowable lateral loads on vertical piles. Some of these values
are shown in Table 3.1.
Load Tests
Most building codes provide for greater allowable lateral loads than
the prescription values if load tests are performed. The New York City
Building Code specifies a maximum lateral displacement of 3/8 in. under
the design lateral load. The Los Angeles code will allow one-half of the
lateral load which causes 1/2 in. displacement with 75 percent recovery.
Other authorities have essentially similar requirements.
Point-of-Fixity Method
A long flexible pile subjected to lateral load will at some point
below the ground surface remain essentially straight. The pile could
15
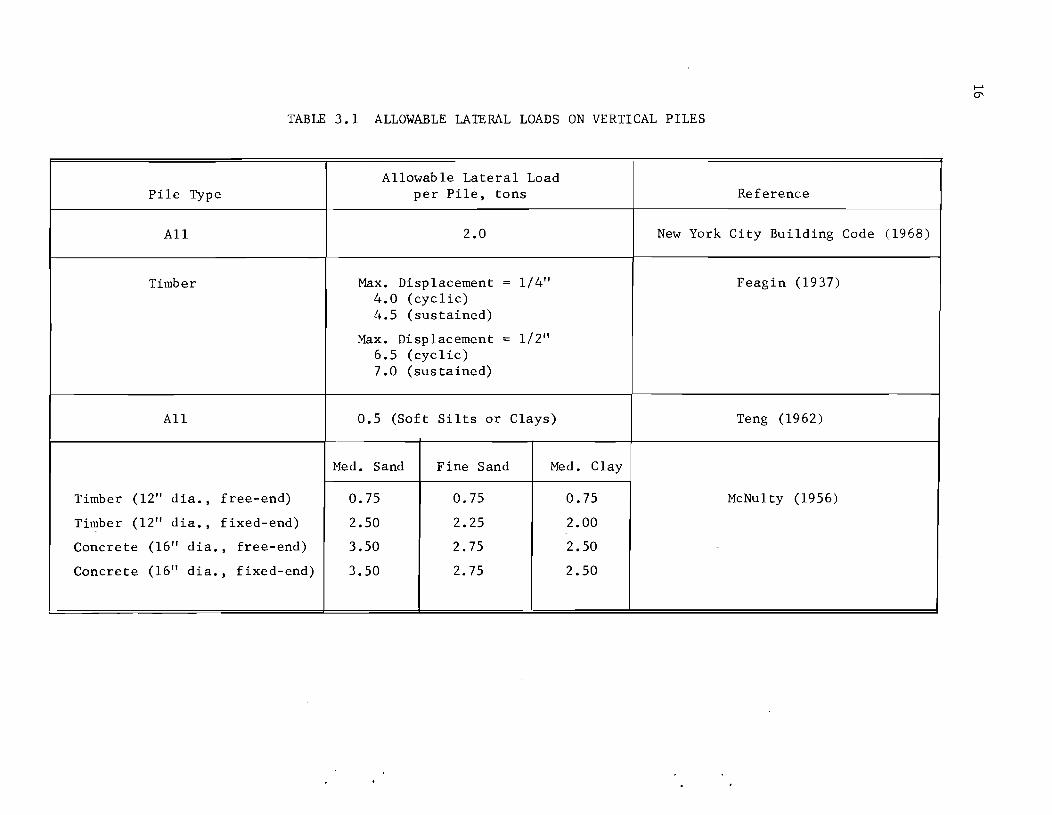
TABLE 3.1 ALLOWABLE LATERAL LOADS ON VERTICAL PILES
Allowable Lateral Load Pile Type per Pile, tons Reference
All 2.0 New York City Building Code (1968)
Timber Max. Displacement = 1/4" Feagin (1937) 4.0 (cyclic) 4.5 (sustained)
Max. Displacement = 1/2" 6.5 (cyc lic) 7.0 (sus tained)
All 0.5 (Soft Silts or Clays) Teng (1962)
Med. Sand Fine Sand Med. Clay
Timber (12" dia. , free-end) 0.75 0.75 0.75 McNulty (1956)
Timber (12" dia. , fixed-end) 2.50 2.25 2.00
Concrete (16" dia. , free-end) 3.50 2.75 2.50 -
Concrete (16" dia. , fixed-end) 3.50 2.75 2.50

17
be considered fixed at this point. If the pile and soil support are
assumed to be elastic, the depth to this point, called the point-of-
fixity, is dependent upon soil stiffness, pile stiffness, rotational
restraint at the top of the pile, and type of loading, whether shear or
moment. Cummings (1937) gives an equation for determining the point-of-
fixity for a pile with zero slope at the top, i.e., a fixed head pile.
Kocsis (1968) has summarized the relationships for determining the depths
to fixity for three boundary conditions and two modes of soil modulus
variation. The soil modulus is assumed to vary linearly with depth (sand)
or to be constant with depth (stiff clay). For these cases, Kocsis has
considered the boundary conditions of fixed-head, applied shear; free-
head, applied shear; and free-head, applied moment. The principle of
superposition is applied to determine the final values of deflection, rota-
tion, moment, shear, and soil pressure.
Elastic Beam-on-Foundation Solution
Hetenyi (1946) has published a very comprehensive treatment of closed-
form solutions for elastic beams on elastic foundations. He considers the
cases of constant soil modulus and linear variation of soil modulus.
Solutions are presented for constant beam stiffness, and also for step-wise
variation, and continuous variation of beam stiffness. Many different end
support and loading conditions are considered. The Winkler assumption is
used for the great majority of solutions given.

18
Difference Equation Solution
To obtain a solution by the use of difference equations, the member is
divided into a finite number of equally spaced intervals. The basic
differential equation, expressed in difference form, may be written for
each point. Known boundary conditions, also expressed in difference form,
allow the resulting system of simultaneous equations to be solved. Palmer
and Thompson (1948) and Palmer and Brown (1954) have presented this method
in detail. The recursive solution method proposed by GIeser (1953) is an
efficient means of obtaining a solution of the difference equations.
Focht and McClelland (1955) have proposed a modification of the GIeser
method and have presented examples of its application to laterally loaded
pile problems.
Non-Dimensional Coefficients
Matlock and Reese (1960) have developed a procedure which will give
a quick and easy solution if the variation of soil modulus with depth
is known or can be estimated. Several sets of influence coefficients
are given for a soil modulus variation described by a power function
n (E = kx ) and for a polynomial variation (E = k
x x 0
The influence coefficients may be used to obtain a complete solution of
a laterally loaded pile. These coefficients could be used to solve a
problem with nonlinear soil response by adjusting the constant(s) describing
the soil modulus variation or by changing the form of the variation until
the solution obtained is compatible with the actual soil response.

Discrete Element Solution
The discrete element formulation of a solution of the beam-column
problem, as developed by Matlock and others, is somewhat different from
the conventional approach to the problem. The conventional approach is
usually to state the problem as exactly as possible, and obtain approxi
mate answers when an exact solution is not possible or practical. The
discrete element approach is to construct a model, using mechanisms that
can be exactly described, which will approximate, as closely as possible,
the actual problem. Thus an exact solution of an approximate model is
obtained rather than the conventional approximate solution of an exact
model. A large number of simultaneous equations are usually generated
in a discrete element solution and a digital computer is required for
solution of most practical problems.
A discrete element solution of the beam-column problem has been
developed by Matlock, Abdel-Raouf, and Panak (in progress) which will
handle nonlinear soil response to both axial and lateral loads and non
linear bending of the beam-column. The soil properties and the beam-column
properties may vary in any arbitrary manner along the axis of the member.
19

!!!!!!!!!!!!!!!!!!!"#$%!&'()!*)&+',)%!'-!$-.)-.$/-'++0!1+'-2!&'()!$-!.#)!/*$($-'+3!
44!5"6!7$1*'*0!8$($.$9'.$/-!")':!
CHAPTER IV
PREVIOUS FIELD STUDIES
The most reliable means of developing information on soil-structure
interaction is a full-scale instrumented test. The expense and time
consumed in performing such tests make them relatively rare. Some of the
tests previsouly performed are categorized by general soil type and listed
be low.
Soft Clay
McCammon and Ascherman (1953) tested concrete encased hollow steel
cylinders with a 54-inch outside diameter and a 5-inch wall thickness in
a very soft clay. A two pile bent and a single pile were tested under
lateral load only. Index properties of the soil and penetration of the
piles under static vertical loads were also given.
McClelland and Focht (1958) report the results of static and dynamic
lateral load tests of an instrumented 24-inch diameter steel pipe pile
in the very soft offshore clays of the Gulf of Mexico. Using these field
test results and the results of laboratory compression tests of undis
turbed soil samples, they developed a procedure for predicting p-y curves
using laboratory test results.
The results of two field tests in soft clay are reported by Matlock (1970).
He presents methods for predicting p-y curves for static loading, cyclic
loading, and reloading with a force less than the previous maximum force.
The variation of shear strength with depth and the strain at one-half of
21

22
the ultimate principal stress difference (in a laboratory compression
test) must be known or assumed.
Stiff Clay
Two pile groups each consisting of three vertical timber piles were
tested by McNulty (1956). These piles were not instrumented and the
reported soil data consisted of standard penetration resistance values
and driving records of the piles.
Osterberg (1958) reported tests on instrumented poles placed in pre
drilled holes in a stiff to very stiff clay. The poles were very rigid
and the space between the pole and the side of the predrilled hole was
filled with compacted sand.
Sand
The lateral load tests of timber and precast concrete piles reported
by Feagin (1937) are among the earliest tests found in the literature.
Tests of free-head single piles and of groups of 4, 12, and 20 piles
(fixed-head) driven in Mississippi River sand were performed. Soil
data consisted of sieve analyses and driving records of the piles. Based
upon an analysis of these test results, Feagin gives prescription values
of allowable lateral load.
Lateral load tests of cast-in-place concrete piles in a medium dense
silty sand are reported by McNulty (1956). The piles were not instrumented
and the reported soil data consisted of standard penetration resistance
data and driving records of the piles.
Davisson and Salley (1968) report a series of static and cyclic
loading tests on four-foot diameter drilled shafts extending through a

medium dense sand to rock. Strains in the reinforcing steel were measured
and soil data in the form of standard penetration resistance are given.
A comprehensive series of tests of several types of piles under
lateral load are reported by Alizadeh and Davisson (1970). Six of the
piles were instrumented to measure bending strains. The effects of
batter, repetitive loading, and method of installation are considered.
A relatively complete description of soil conditions at the test site is
given by Mansur and Hunter (1970).
Parker and Reese (1971) report test results for two-inch diameter
instrumented steel pipe piles in a dense sand. The test program included
both vertical and batter piles. A complete description of soil properties
is given. A procedure is presented for predicting p-y curves based upon
a knowledge of soil properties.
Layered Systems
Alizadeh (1968) has presented results of tests on instrumented tim
ber piles in a rather heterogeneous soil deposit consisting of layers of
sand and gravel, clay, and silt. Most of the soils had relatively low
values of shear strength.
23

!!!!!!!!!!!!!!!!!!!"#$%!&'()!*)&+',)%!'-!$-.)-.$/-'++0!1+'-2!&'()!$-!.#)!/*$($-'+3!
44!5"6!7$1*'*0!8$($.$9'.$/-!")':!

CHAPTER V
SCOPE OF THIS STUDY
In view of the lack of published information on the response of stiff
clays to lateral loading, the present study was initiated. The purposes
of this study are listed below.
1. Develop an instrumentation system capable of producing reason
ably accurate values of soil reaction and shaft deflection.
2. Determine the response of stiff clay to lateral load by
constructing and testing a full-scale instrumented shaft.
3. Correlate the results of the field test with the results of
laboratory tests on undisturbed soil samples.
4. Present workable methods of predicting soil response for use
with currently available methods of analyzing drilled shafts or piles.
The objectives of this study were accomplished and each will be dis
cussed in later chapters.
25

!!!!!!!!!!!!!!!!!!!"#$%!&'()!*)&+',)%!'-!$-.)-.$/-'++0!1+'-2!&'()!$-!.#)!/*$($-'+3!
44!5"6!7$1*'*0!8$($.$9'.$/-!")':!
CHAPTER VI
FIELD TEST ARRANGEMENT
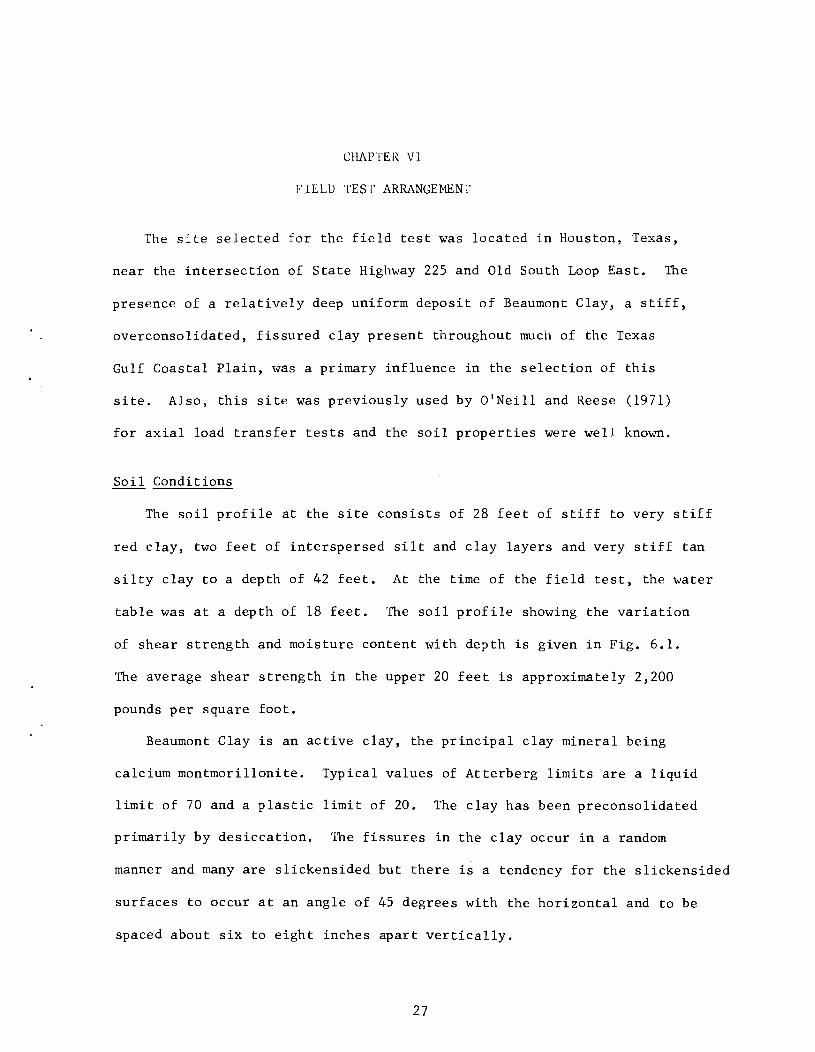
The site selected for the field test was located in Houston, Texas,
near the intersection of State Highway 225 and Old South Loop East. The
presence of a relatively deep uniform deposit of Beaumont Clay, a stiff,
overconsolidated, fissured clay present throughout much of the Texas
Gulf Coastal Plain, ,.,as a primary influence in the selection of this
site. Also, this site was previously used by O'Neill and Reese (1971)
for axial load transfer tests and the soil properties were well known.
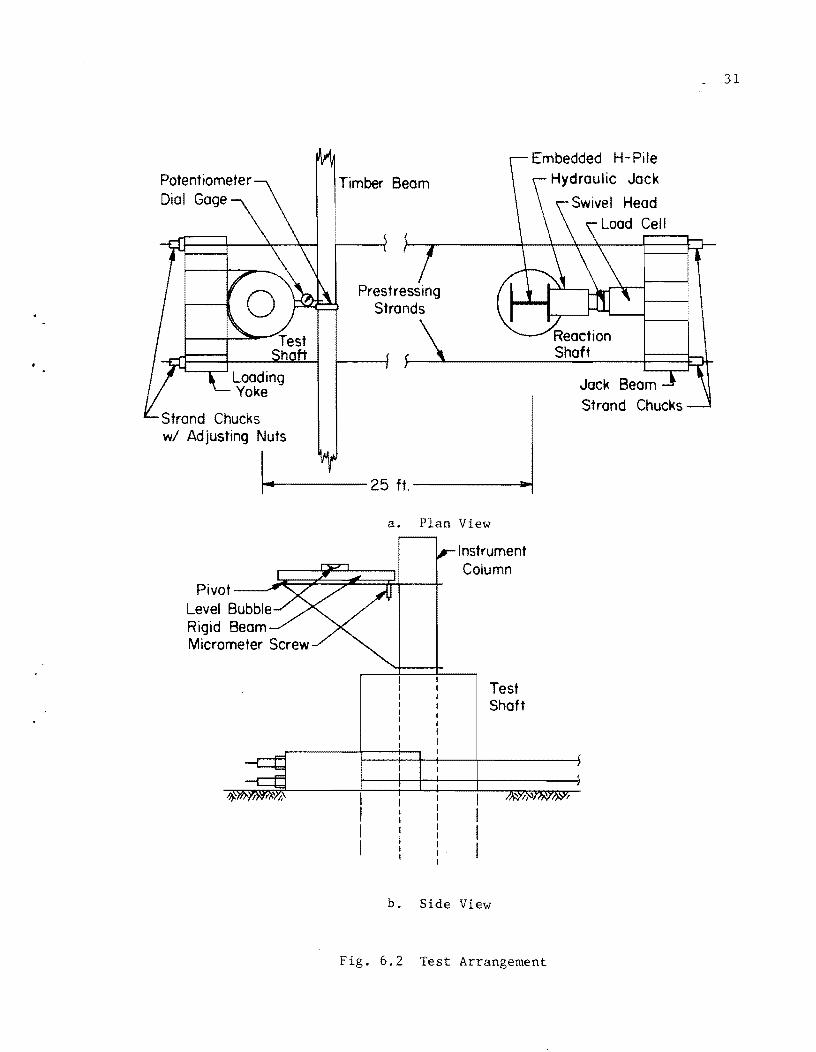
Soil Conditions
The soil profile at the site consists of 28 feet of stiff to very stiff
red clay, two feet of interspersed silt and clay layers and very stiff tan
silty clay to a depth of 42 feet. At the time of the field test, the water
table was at a depth of 18 feet. The soil profile showing the variation
of shear strength and moisture content with depth is given in Fig. 6.1.
The average shear strength in the upper 20 feet is approximately 2,200
pounds per square foot.
Beaumont Clay is an active clay, the principal clay mineral being
calcium montmorillonite. Typical values of Atterberg limits are a liquid
limit of 70 and a plastic limit of 20. The clay has been preconsolidated
primarily by desiccation. The fissures in the clay occur in a random
manner and many are slickensided but there is a tendency for the slickensided
surfaces to occur at an angle of 45 degrees with the horizontal and to be
spaced about six to eight inches apart vertically.
27

28
-----------------------------------------,
-1::
li (J.)
a
,.5
Ir-~;
~ 1-, r--1
~ ~ f-------'
Log of Bor ing for
Lateral Load Test Shaft
Description
Stiff to Very Stiff Red Clay
Alternate Layers of Silt and Clay
Very Stiff Tan Silty Clay
Bottom of Boring at 42 ft.
~Cohesio~ Tonslft~_ Ie o 0.5 1.0 1.5 2.0 2.5 I Q '-"'---"~-~-~~~~-.!:::~____J "0 W, ; :> \1)! I Moisture Content,% \1)-
iO • 20 30 40· 50 ,w i
o
o 00 0
o
00
o o
o o
J-----t-+--r--' 0 ~O o:..-.j-0 ~ ~
34_
Fig. 6.1 Log of Boring

~e soil properties will be presented in greater detail in the chapter
on laboratory test results.
Shaft Configuration
It was considered desirable to test a full-sized shaft so that there
would be no question regarding the effect of scale on the results. Most
drilled shafts have a diameter in the range of 24 to 48 inches; a diameter
of 30 inches was selected for the test shaft. Because the 50il was a stiff
clay, a large lateral load would be required to approach the failure stress
in the near surface soil. To resist the bending stresses created by such
a large lateral load, heavy reinforcing would be required. To determine
the amount of reinforcing required and to estimate the range of deflection
and slope, the soil response was estimated and a solution was obtained
29
using the discrete element program developed by Matlock, Abdel-Raouf, and
Panak (in progress). ~e estimated maximum moment would require approximately
six percent steel if the AASHO criteria were used. Twenty l4-S deformed
bars on a 24-inch diameter circle (through the center of the bars) restrained
by one-half inch smooth spiral reinforcing spaced at six inches comprised
the reinforcing selected for the test shaft.
A design depth of 42 feet was selected so that the shaft would behave
as a flexible member rather than as a rigid body. To facilitate the appli
cation of load, the shaft was extended two feet above the ground surface
making the total length 44 feet.
Instrumentation
The quantities to be measured during the test were applied load, top
deflection, top slope, and bending strains throughout the length of the
30
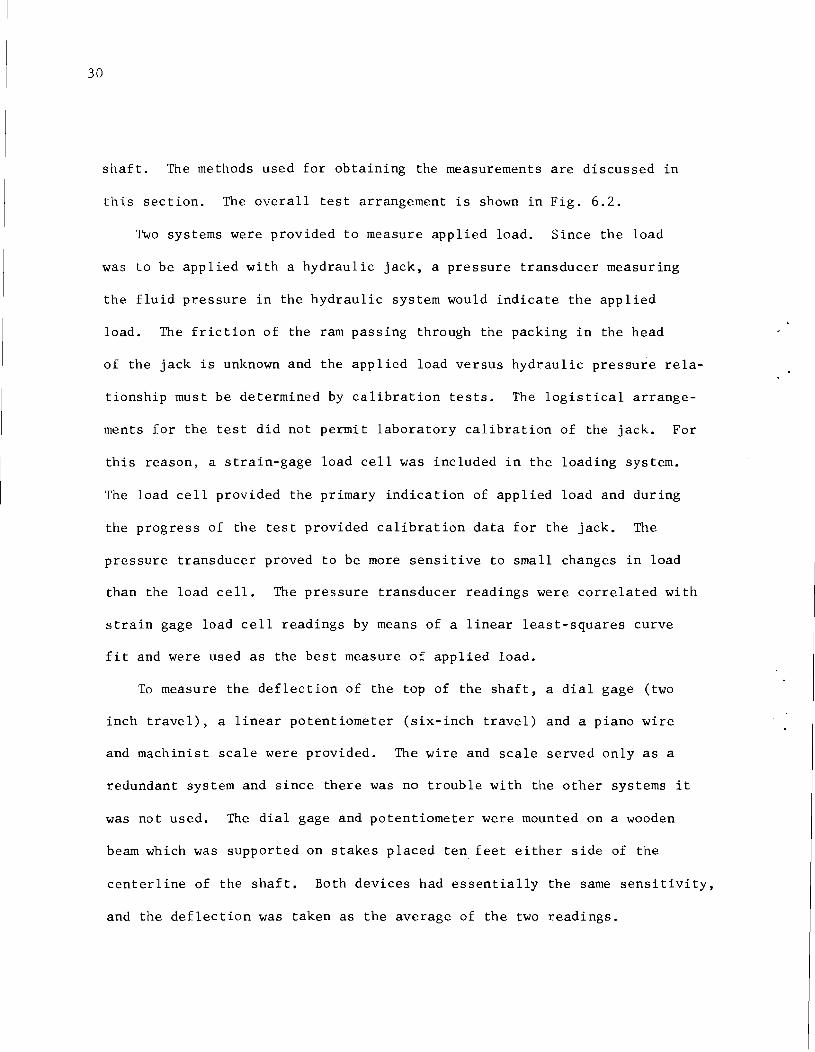
shaft. The methods used for obtaining the measurements are discussed in
this section. The overall test arrangement is shown in Fig. 6.2.
lwo systems were provided to measure applied load. Since the load
was to be applied with a hydraulic jack, a pressure transducer measuring
the fluid pressure in the hydraulic system would indicate the applied
load. The friction of the ram passing through the packing in the head
of the jack is unknown and the applied load versus hydraulic pressure rela
tionship must be determined by calibration tests. The logistical arrange
ments for the test did not permit laboratory calibration of the jack. For
this reason, a strain-gage load cell was included in the loading system.
The load cell provided the primary indication of applied load and during
the progress of the test provided calibration data for the jack. The
pressure transducer proved to be more sensitive to small changes in load
than the load cell. The pressure transducer readings were correlated with
strain gage load cell readings by means of a linear least-squares curve
fit and were used as the best measure of applied load.
To measure the deflection of the top of the shaft, a dial gage (two
inch travel), a linear potentiometer (six-inch travel) and a piano wire
and machinist scale were provided. The wire and scale served only as a
redundant system and since there was no trouble with the other systems it
was not used. The dial gage and potentiometer were mounted on a wooden
beam which was supported on stakes placed ten. feet either side of the
centerline of the shaft. Both devices had essentially the same sensitivity,
and the deflection was taken as the average of the two readings.
Embedded H-Pile
Strand Chucks wi Adjusting Nuts
Timber Beam
Prestressing Strands
1l000i .. 1------25 ft. -------JIIooj
a. Plan View
Instrument Column
Pivot _~~7~~==i-t--+ Level Bubble Rigid Beam Micrometer Screw
Test Shaft
b. Side View
Fig. 6.2 Test Arrangement
Jack Beam Strand Chucks
31
32
The slope of the top of the shaft was measured by a specially constructed
slope-measuring device. The essential features of this device are a sensi
tive level bubble, a rigid beam 30 inches long, a micrometer screw, and a
frame to support the beam and micrometer screw. The beam is supported by
a pivot point on one end and by the micrometer screw on the other. The
beam carries the level bubble and is adjusted to be level prior to load
application. As the shaft deflects, the beam is maintained in a level
position by adjusting the micrometer screw. The slope can be easily cal
culated by knowing the travel of the micrometer screw and the length of
the beam.
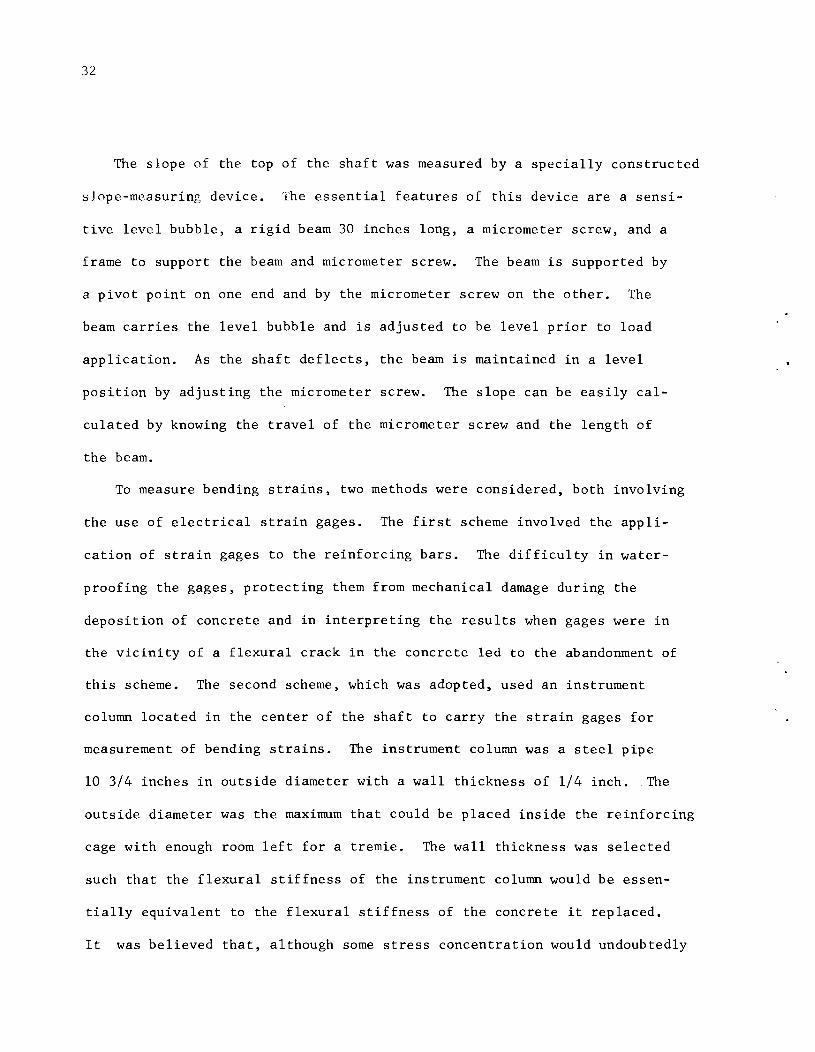
To measure bending strains, two methods were considered, both involving
the use of electrical strain gages. The first scheme involved the appli
cation of strain gages to the reinforcing bars. The difficulty in water
proofing the gages, protecting them from mechanical damage during the
deposition of concrete and in interpreting the results when gages were in
the vicinity of a flexural crack in the concrete led to the abandonment of
this scheme. The second scheme, which was adopted, used an instrument
column located in the center of the shaft to carry the strain gages for
measurement of bending strains. The instrument column was a steel pipe
10 3/4 inches in outside diameter with a wall thickness of 1/4 inch. The
outside diameter was the maximum that could be placed inside the reinforcing
cage with enough room left for a tremie. The wall thickness was selected
such that the flexural stiffness of the instrument column would be essen
tially equivalent to the flexural stiffness of the concrete it replaced.
It was believed that, although some stress concentration would undoubtedly

33
occur in the vicinity of flexural cracks, the increase in strain \vould not
be nearly as great as the increase in strain shown by gages mounted on
the reinforcing bars.
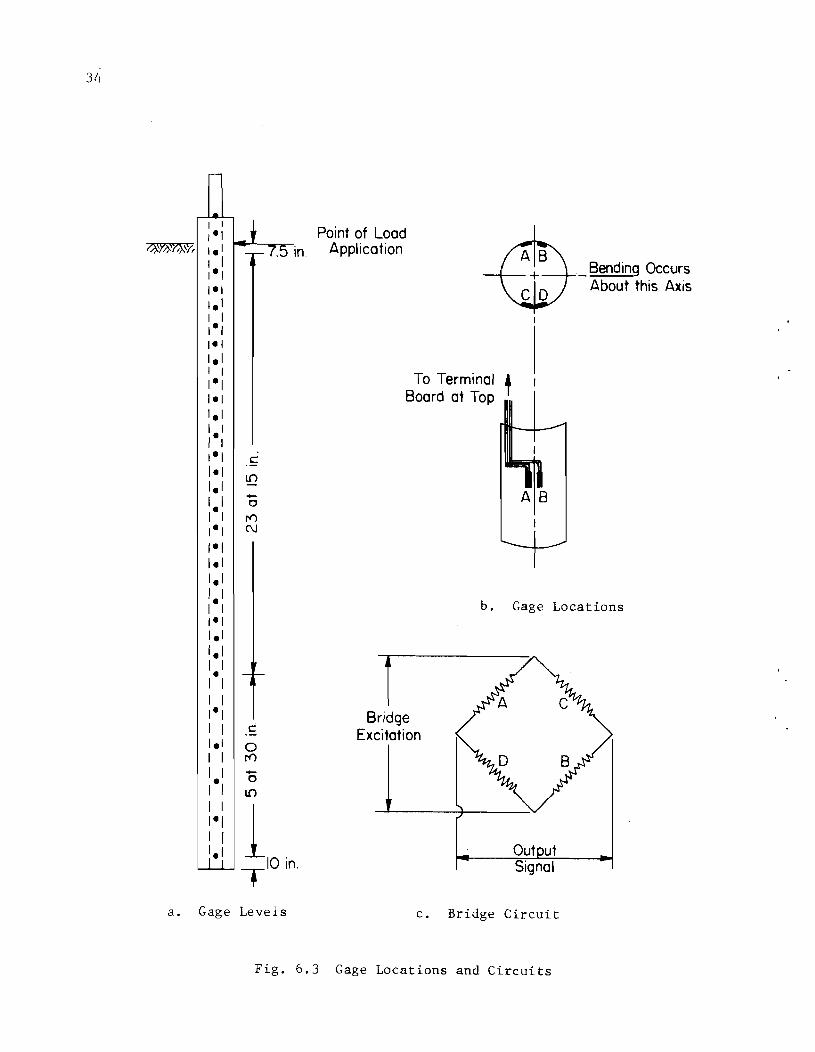
The spacing of the strain gages was arbitrarily set at 15 inches (one-
half the shaft diameter) for the top two-thirds of the shaft and at 30
inches in the bottom one-third. (The gages were Micro-Measurements Type
EA-06-250BG-120, Option B76, 120 vhm, gage length = .250 in., gage factor
2.095.) To install the gages, the instrument column was split longitudinally
by a trolley-mounted, self-propelled oxy-acetylene cutting torch. A very
smooth cut was obtained and no more than one-sixteenth of an inch of metal
was lost for each cut. The gage locations were marked and the inside
surface of the pipe was thoroughly cleaned at each location. Two strain
gages, with their axes parallel to the axis of the pipe, were mounted on
each half of the pipe at each gage level. Lead wires were attached and
the gages were waterproofed and covered with a neoprene pad for mechanical
protection. The lead wires from each gage were carried to a terminal board
at the top end of the pipe. The two halves of the pipe were welded back
together and the bottom closed by welding on a steel plate. Provision
was made for bolting on a steel plate and gasket at the top thus providing
an airtight chamber containing the strain gages and terminal board. At
the terminal board, the four gages at each level were connected in a full-
bridge circuit arranged to give the maximum sensitivity to bending. The
gage locations and arrangement are shown in Fig. 6.3.
Construction of the Test Shaft -- --- ---- ~~~
Except for the inclusion of the instrument column, the construction
procedure was the same procedure generally used for drilled shafts in
34
I I ,·1 0r~%>:V, ,. , ,.
I·
'. , ,. ,. I. , I· I. I. i. , ,. I.
'. '. i ,. i· I. i. I. i ,. i. i. , • ,
i I· i i. i I. I I i· i r i.i
c L() -o r0 C\J
o r0 -o L()
1 T
Point of Load .5 in. Application
10,n.
To Terminal + Board at Top
r Bridge
Excitation
b.
_ Bending Occurs About this Axis
Gage Locations
Out ut Signal
a. Gage Levels c. Bridge Circuit
Fig. 6.3 Gage Locations and Circuits
stiff clay. The steps in the construction of the shaft were (1) excavating
the hole, (2) placing the instrument column, (3) placing the reinforcing
cage, and (4) depositing the concrete.
The excavation procedure started with the augering of a 30-inch
diameter hole down to the ground water level. Water was added to the
hole and drilling continued, accompanied by a mixing of the soil and
water in the hole to form a slurry. When the depth of the hole was about
38 feet, a 30-inch diameter casing was lowered into the hole and seated
4 feet into the clay at the bottom of the hole. The water and mud slurry
were removed from the hole by bailing and the drilling to the design depth
was completed with an auger slightly smaller than the inside diameter of
the casing.
There was some concern over the tendency of the closed instrument
column to float in the wet concrete. To counteract this tendency, a 28-
inch diameter steel plate was welded to the bottom of the column so that
the reinforcing cage would rest on the plate and add enough weight to
prevent floating. The instrument column was placed in the cleaned hole
and aligned with the reaction shaft.
The reinforcing cage was assembled in the contractor's yard. After
the bars were tied to the spiral and braced to prevent racking, each
intersection of bar and spiral was welded in a ten-foot interval at each
end of the cage. Spacers were added inside the cage to insure that the
instrument column would be centered in the cage and to the outside of the
cage to insure that the cage would be centered in the casing. After the
instrument column was placed, the reinforcing cage was carefully lowered
into position.
35

36
Concrete was deposited through an eight-inch diameter rubber tremie.
As the level of the concrete rose, sections of the tremie were cut off.
When the level of the concrete was near the ground surface, the casing
was lifted approximately 15 feet and filled with concrete to a height of
about eight feet above ground level. The casing was then slowly removed
from the hole assuming that the head of wet concrete in the casing would
be sufficient to force any water or mud present between the outside of
the casing and the side of the hole upward and out of the hole. After
the casing was removed, the form for the two feet of shaft above the
surface was placed and filled with concrete.
After construction was complete, the instrument column was cleaned and
opened so that the gages could be checked. All gages responded properly.
After the instrument column was closed, it was pressurized to 20 psi with
dry nitrogen to insure that no moisture could enter. The concrete was
cured for 40 days prior to loading.
Loading Procedure
The load was applied to the shaft as near to the ground surface as
possible. A yoke, constructed to fit the shaft, was connected by 8 one
half inch diameter prestressing strands to a short beam section (see Fig.
6.2). The jack was placed between this short beam and the reaction shaft
to apply the load. Adjusting nuts were added to the strand chucks at one
end of each strand so that equal tension could be obtained in all strands.
The tension was adjusted until all strands had had an equal midspan sag
under a light load.
37
'llie slla[l was subjected to repeated loadings of 10, 20, 30, 40, and 50
tons. The sequence of load application is described below.
1. The 10-ton load was applied and readings of deflection, slope, and
bending strains were taken. The load was removed and readings of deflection,
slope, and bending strains were taken again.
2. Data were taken as soon as possible after the load was applied
or removed. The recording of the strain gage readings (by a Honeywell
Model 620 Data-Logger) was completed within two minutes after the load
was reached. The deflection and slope readings were taken simultaneously
with the strain readings.
3. The 10-ton load was reapplied, data were taken, the load was
removed, and data were taken. This procedure was repeated until the top
deflection did not increase with additional repetitions of load or until
the load had been applied 20 times.
4. The load was increased by 10 tons and the loading procedure was
repeated. After the top deflection had stabilized or 20 cycles of load
had been applied, the load was increased by an additional 10 tons. This
process was followed until the shaft had been loaded with the maximum test
load of 50 tons.
5. The top deflection stabilized during 10 cycles of the 10-ton load
and during 15 cycles of the 20-ton load. Loading at all other values of
load was carried through 20 cycles.
6. During certain selected cycles, (i.e., cycles 1, 2, 3, 5, 10, 15,
20) data were taken at loads intermediate between zero load and maximum
load. For example, during some of the 10-ton load cycles (cycles 1, 2,

38
3, 5, 10) data were taken at loads of 0, 2.5, 5, 7.5, and 10 tons. The
interval for intermediate readings during the 20-ton and 30-ton load cycle
was 5 tons (data taken at 0, 5, 10, 15, 20, 25, 30 tons) and the interval
for intermediate readings during the 40-ton and 50-ton load cycles was
10 tons (data taken at 0, 10, 20, 30, 40, and 50 tons).
7. After the 50-ton load cycles were completed, the instrument column
was closed and pressurized to 10 psi. The shaft was allowed to rest for
about one month and then subjected to an additional ten cycles of 50-ton
maximum load.
Calibration
The diameter and properties of a drilled shaft are not precisely known
because of the construction procedure. The stiffness of the shaft must be
accurately known before the bending moment can be determined from the
measured bending strains. Direct measurement of the relationship between
bending moment and bending strains was considered the most feasible method
of determining the stiffness, especially since nonlinear response was anti
cipated from the reinforced concrete shaft.
To facilitate the calibration, the soil around the perimeter of the
shaft was excavated to a depth of 20 feet. After excavation, the shaft
was cleaned and examined for defects. The most important defects noted
were void spaces on the surface of the shaft (outside the spiral reinforcing)
at a depth of approximately eight feet on the compression side of the shaft
and at a depth of approximately eleven feet on the tension side of the shaft.
At the eight foot depth, the spiral reinforcing was exposed in an area
about two feet in length and one foot in width. The exposed area at the

39
l'll'Vl'H rlJot depth WLiS Llboul one fool squun'. In both locations, the concrctl'
within the spiral appeared to be sound. Other defects observed were minor
irregularities which would have no significant effect on the behavior of
the shaft.
To measure the stiffness of the shaft, it was loaded as a cantilever,
and bending strain readings were taken at various load levels. Four sets
of readings were taken and the average values were assumed to define the
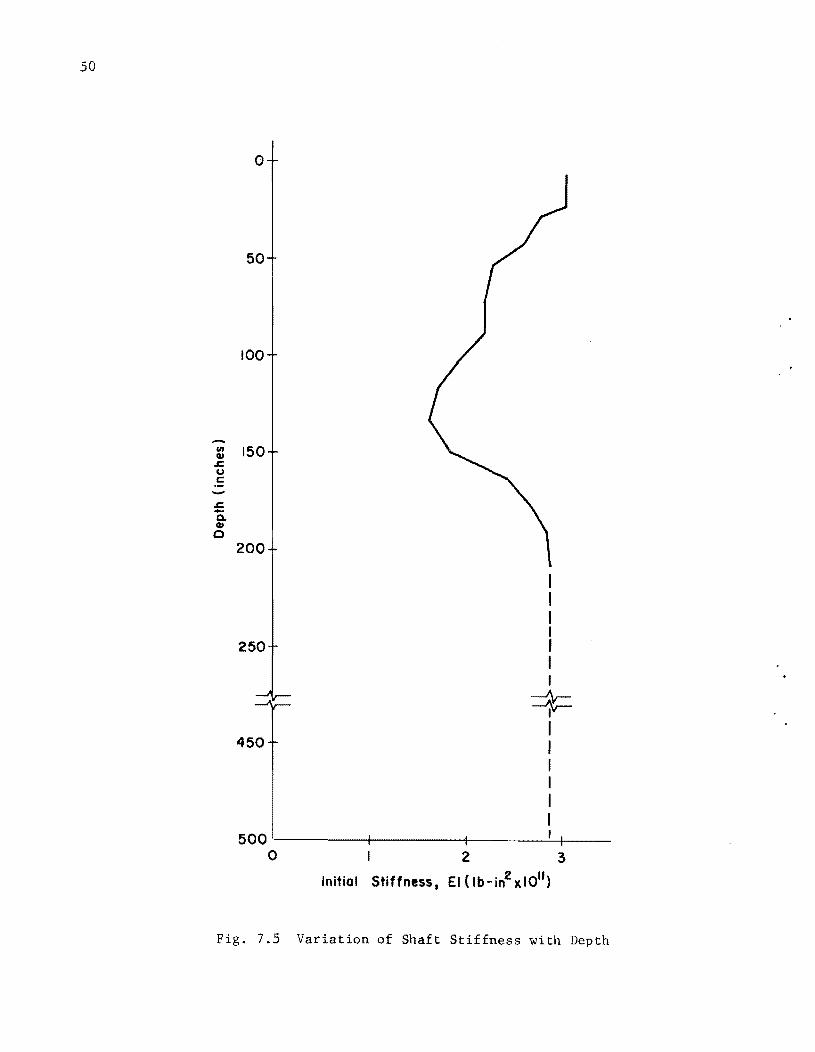
stiffness. The measured stiffness varied with both depth and applied
moment. The variation of initial stiffness with depth is shown in Fig. 7.5
in the next chapter.
Accuracy of Measurements
To determine the deflected shape of the shaft, the M/EI diagram was
integrated twice. To determine soil reaction the moment diagram was
differentiated twice. The measured values of deflection and slope provided
boundary conditions necessary in the integration process and the measured
load provided a check of the accuracy of the data smoothing technique.
The bending strains are a direct measure of the curvature, 0 ,of
the shaft at the level of the strain gages. The accuracy of the values
of curvature is influenced only by errors in strain measurement. The
slope, obtained by the first integration, is affected by errors in top
slope measurement (used to define the constant of integration), strain
readings, and gage spacing. The accuracy of the deflection, obtained by
the second integration, is influenced by all of the errors in the slope
determination plus the error in top deflection measurement.

40
The differentiation process, if done by numerical methods, is very
sensitive to small errors in measurement, especially if the differences
between measured values are small. The presence of significant errors
is inevitable considering that the shaft is reinforced concrete and stress
concentrations will occur in the vicinity of cracks. Smoothing of the data
obtained in this study was done by fitting a high-order polynomial by
least squares to all the moment values along the shaft. The accuracy of
the moment values of the smooth curve is dependent upon the accuracy of
measured strains, the M-¢ relationship, and the curve-fitting technique.
For the derivatives, the accuracy depends primarily on the accuracy of the
curve-fitting technique. The measured value of applied load provides a
check upon the accuracy of the first derivative at the ground surface.
The sensitivity of reading and the estimated accuracy of measurement
are shown in Table 6.1.
TABLE 6.1. ACCURACY OF MEASUREMENTS
Measurement
Deflection Dial Gage Linear Potentiometer
Slope
Strain
Applied Load Pressure Transducer Load Cell
Sensitivity
• 001 in. • 001 in.
3 X 10⁻⁶ rad.
1 X 10- 7 inlin
.01 ton 0.1 ton
Accuracy
.001 in •
.001 in •
1 X 10⁻⁴ rad.
2 10-6. I· X ln ln
0.5 ton 1.0 ton

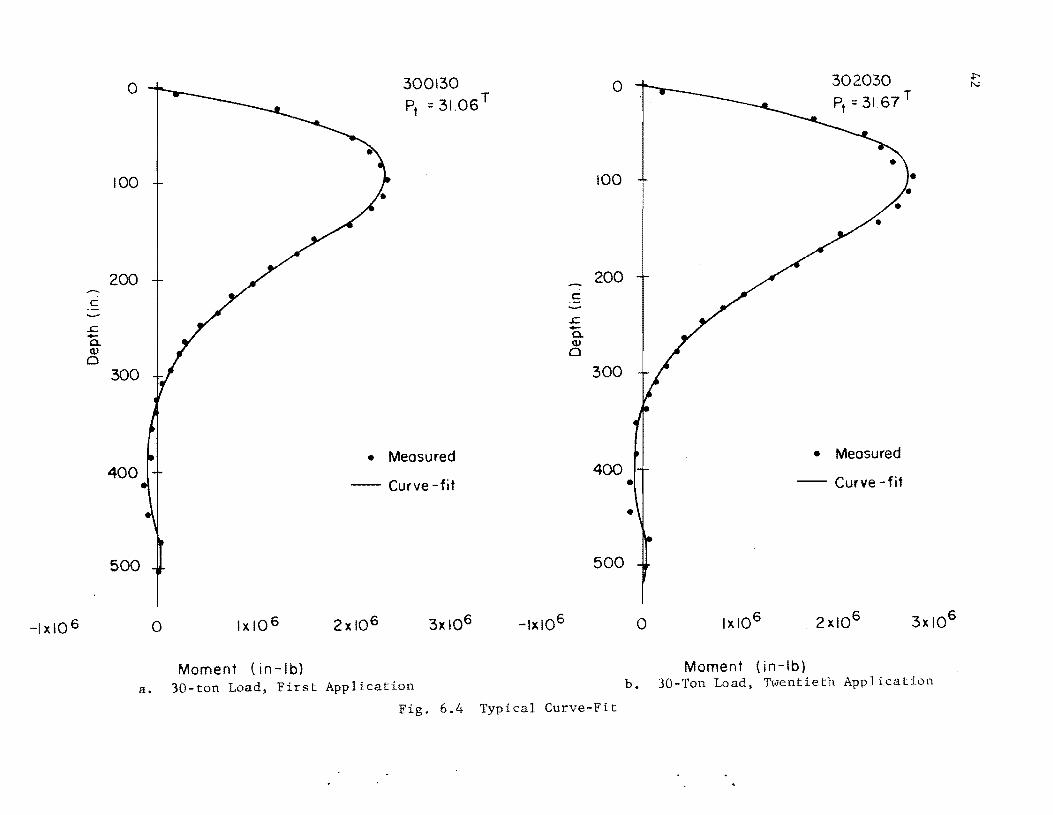
The most important factor, by far, influencing the accuracy of the
interpretation of data is the behavior of the reinforced concrete. During
the first portion of the test, flexural cracks had not yet formed and the
stiffness of the shaft was probably greater than indicated by the cali
bration test. Stress concentrations near cracks are undoubtedly the
source of some of the scatter in the test data.
The data, considered in their entirety, appear to be very consistent,
requiring no special compensation or adjustment for unusual errors. The
curve-fit shown in Fig. 6.4 is typical.
41
o 300130 Pt = 31.06 T
o 302030 Pt = 31.67 T
100 100 •
200 200 - c: c r.
r. -- C\. C\. cu cu 0 0
300 300
• Measured • Measured 400
-- Curve -fit 400
• -- Curve -fit
•
500 500
o o
Moment (in-Ib) Moment (in-Ib) a. 3D-ton Load, First Application h. 3D-Ton Load, Twentieth Application
Fig. 6.4 Typical Curve-Fit

CHAPTER VII
RESULTS OF FIELD TEST
The results of the calibration test, the repeated loading tests, and
the analysis of the data will be presented in this chapter. The results
of the laboratory tests and the correlation between field and laboratory
results will be presented in following chapters.
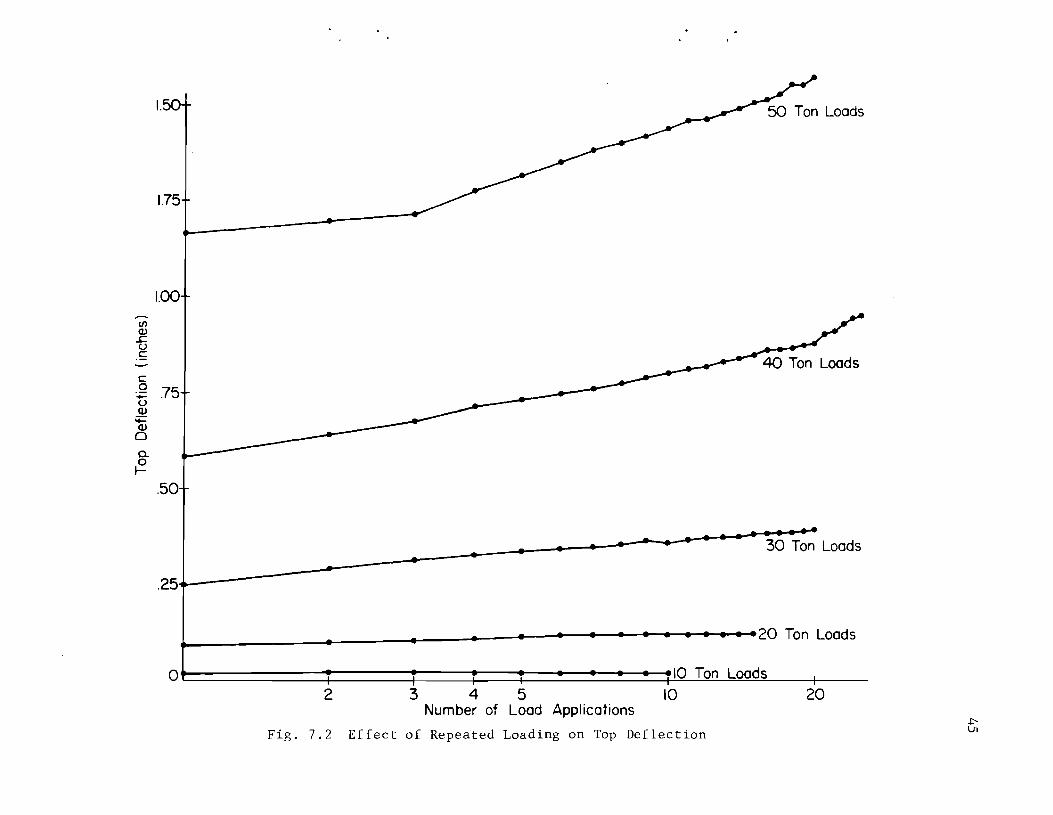
Top Deflection
The deflection of the top of the shaft was found to be a nonlinear
function of load. An applied load of 10 tons produced a deflection of
.020 inches while 1.165 inches deflection was observed with the first
application of 50 tons. The increase in deflection for each successive
application of the same load was observed to be dependent on the load
level. For the lighter loads, the increase was very small, and for the
maximum load the increase was significant. The response of the shaft, as
measured by top deflection is shown in Fig. 7.1. The deflection under
repeated loading is plotted on semi-log paper in Fig. 7.2. This plot
illustrates the decrease in additional deflection as the number of cycles
increase. That is, there was generally a greater increase in deflection
with the second application of load than there was for the third, or tenth,
or twentieth application of load. The change in slope of the lines (in
Fig. 7.2) as the load increases clearly shows the effect of stress level
upon deflection under repeated loading.
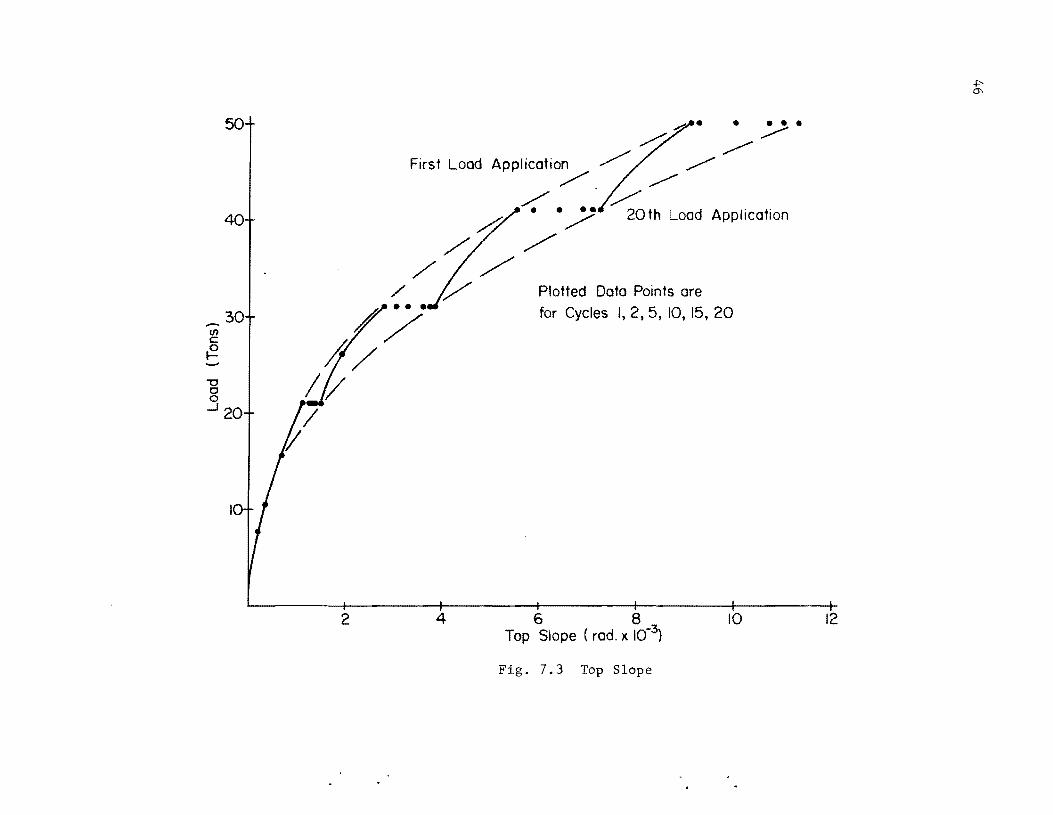
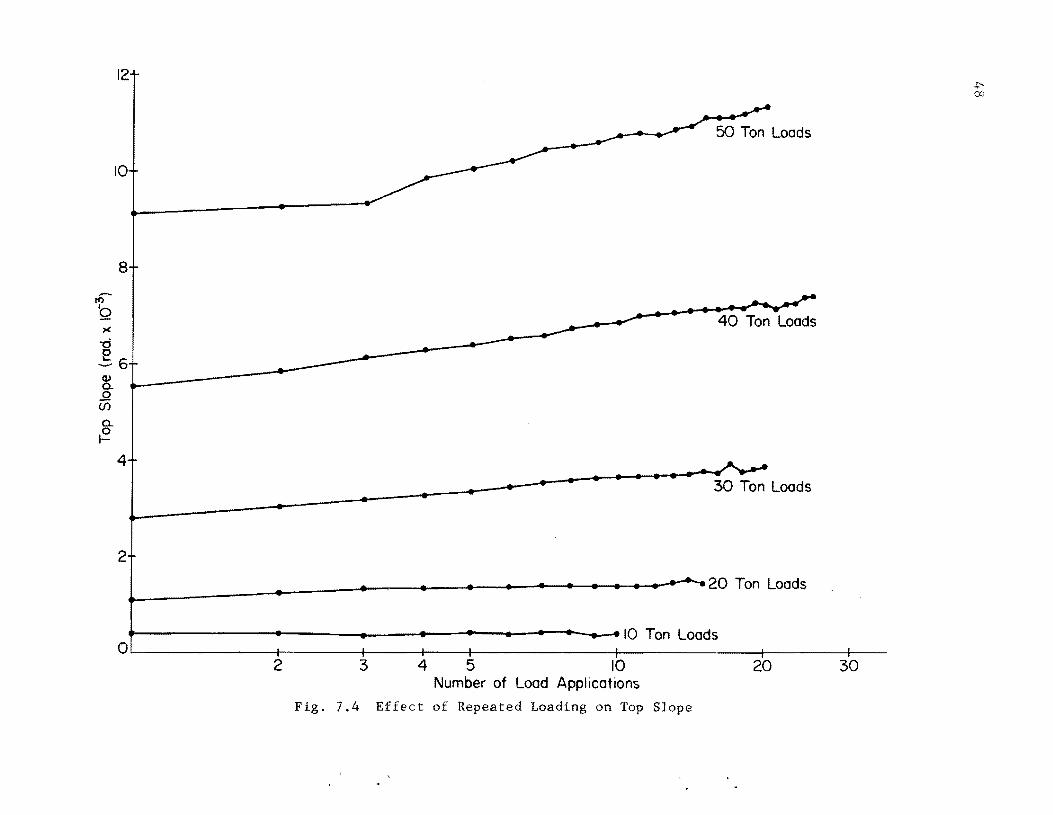
Top Slope
The slope measurements at the top of the shaft reflect the same non
linear behavior shown by the deflection measurements. Figure 7.3 shows
43

"0 o o
50
40
30
..J 20
10
/ /
First
/'l /'
---Load Appl ication .......---~
.....-:; . •
----~ /" ~ 20 th Load Application . . .,.
Plotted Data Points are for Cycles 1,2,5, la, 15, .20
0L--------+--------4---------~------_4--------_r--------+__ .25 .50 .75 1.00 1.25 1.50
Top Deflection (inches)
.Fig. 7.1 Top Deflection
1.50
1.75
1.00 ,-.. If) Q) r. u c
c .Q .75 +-u Q) ~ Q)
0
a.. 0 I-
.50
.25
~ ____ ----------.-------~----~----~--~--+-~----+-~~+-~~3KOlTTO~n Loads
l-__________ --+-------~----~--~--~--~~-+-+-+-.~~20 Ton Loads
Ot=============+=======4=====+===~==~==~~~~~IOLI~monL1L~oa~d~s~ __ ~ __ __ 2 345 10 20
Number of Load Applications
Fig. 7.2 Effect of Repeated Loading on Top Deflection
-II) c {:!.
"0 o o
50
40
30
..J 20
10
2
• • ••• /" ~
First Load Application /""
~ ~
/ 20 th Load Application ~ ...
/' /. ,/
,/ / V Plotted Data Points are
for Cycles I, 2, 5, 10, 15, 20
4 6 8 Top Slope (rod.)( 10-3)
10
F . 7.3 Top Slope
12

47
the slope measurements for the various load levels. The effect of repeated
loading upon the top slope is shown in Fig. 7.4.
Flexural Stiffness
The calibration test was performed to determine the flexural stiff-
ness of the shaft as a function of depth and as a function of stress level.
The most convenient way to define flexural stiffness as a function of stress
level is by the moment-curvature or M-0 relationships. As previously defined,
M EI
. • • • • • • . • • . • • • • • • • • • • • • • • • • (2.7)
and the flexural stiffness, represented by a secant of the M-¢ curve, is
equal to moment divided by curvature.
M EI = if> • • • • • • • • • • • • • • • • • • • • • • • • • • • (7.1)
In the calibration test, the moment was determined at each exposed gage
level in the cantilever portion of the shaft by multiplying the applied
load by the distance from the point of load application to each gage level.
The curvature was determined by measuring bending strains. The assumption
of linear strain distribution on a cross-section perpendicular to the axis,
which has been proven to be reasonable, was used. The relation between
curvature and bending strains is as follows:
. . . . . . . . . . . . . . . . . . . . . . . . . (7.2)
where
12
-0 o
10
8
"::'6
50 Ton Loads
40 Ton Loads
~ L---------------o (/)
a.. ~
4
2
L-____ --------~------~--~~----+---+-~--+-~-.-.~~~20 Ton Loads
~-------------.--------._----.---~---.--~~--~IO Ton Loads O~------------r_------r_--~----r_----------~r_----------~------~---
2 3 4 5 10 20 30 Number of Load Applications
Fig. 7.4 Effect of Repeated Loading on Top Slope
€t the tensile strain at the outside fiber,
€ the compressive strain at the outside fiber, c
t the depth of the section (distance between the points
where and € c
are measured).
The strains were measured at each gage level on the instrument column and
49
assumed to represent the curvature of the shaft at the level of the gages.
The moment-curvature relationship was found to be slightly nonlinear at
each gage level. There was a significant variation os stiffness with depth,
due in part to the defects described in the section on calibration of the
shaft of the previous chapter. The measured M-0 curves are shown in the
appendix, and the variation of stiffness with depth (determined from the
initial slope of the M-0 curves) is shown in Fig. 7.5.
A theoretical M-¢ curve was generated, using Hognestad's stress-strain
relationships for the concrete and considering the tensile strength of the
concrete. The average 28-day concrete cylinder strength was 3600 psi,
and the yield point of the reinforcing steel was taken from mill reports
as 40,000 psi. The value of Young's modulus for the concrete was measured
during the cylinder tests and a representative value of 4.8 X 10⁶ psi was
selected. The peak compressive stress for the Hognestad stress-strain
diagram was taken as 85 per cent of the cylinder strength or 3060 psi. The
maximum tensile stress was assumed to be 450 psi. A maximum compressive
strain of .003 in/in was used. The theoretical M-¢ curve is shown in
Fig. 7.6 along with the measured M-¢ values. The agreement is remarkable,
considering the variation of the shaft diameter throughout the upper part
of the shaft.
50
en c»
.s::. u c -.s::. -Q. c» 0
o
50
100
150
200
250
450
I
=*= I I I I I I I
500,--------~--------_41------~1~1----023
Initiol Stiffness, EI{lb-in2 xI01l )
Fig. 7.5 Variation of Shaft Stiffness with Depth

10
8
-c cv
• • •• E4 o
~ • •
2
• •
• • • •
• •
• •
Plotted Points are Measured Values
0L--------+--------+--------4--------4---------r--------+--------+ o 2 345
Curvature, ¢ (lfin)( 10-5)
Fig. 7.6 Theoretical Moment-Curvature Relationship
6 7
52
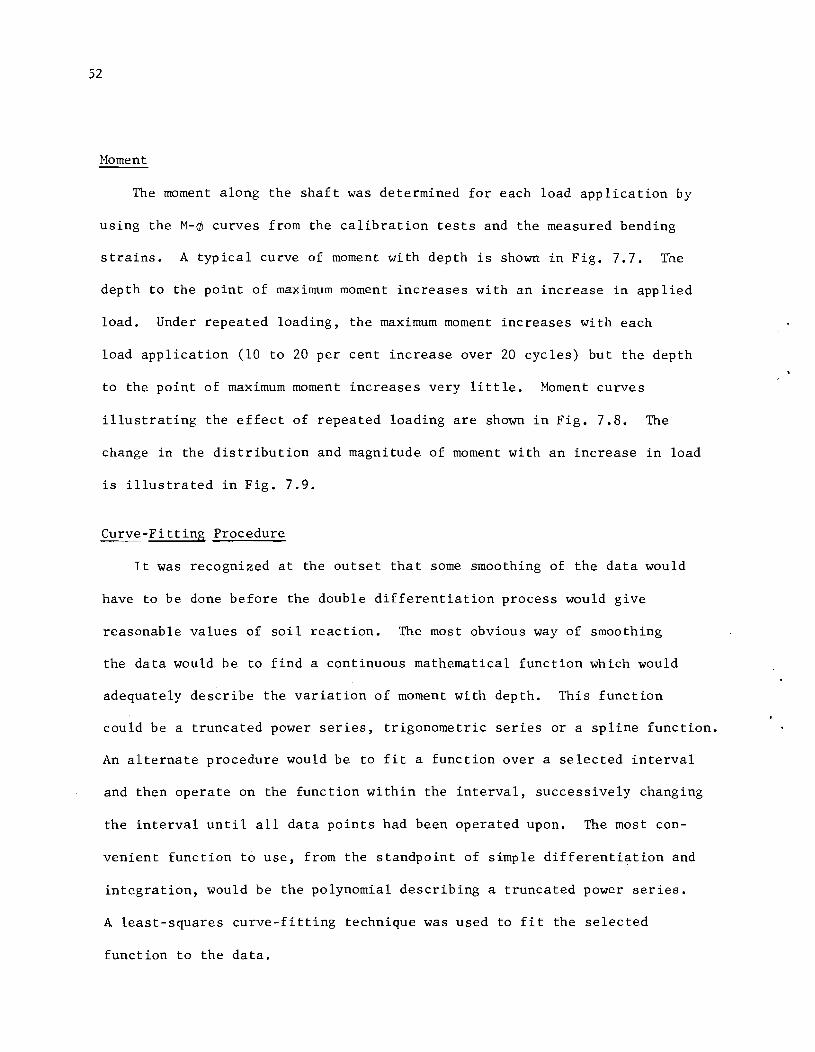
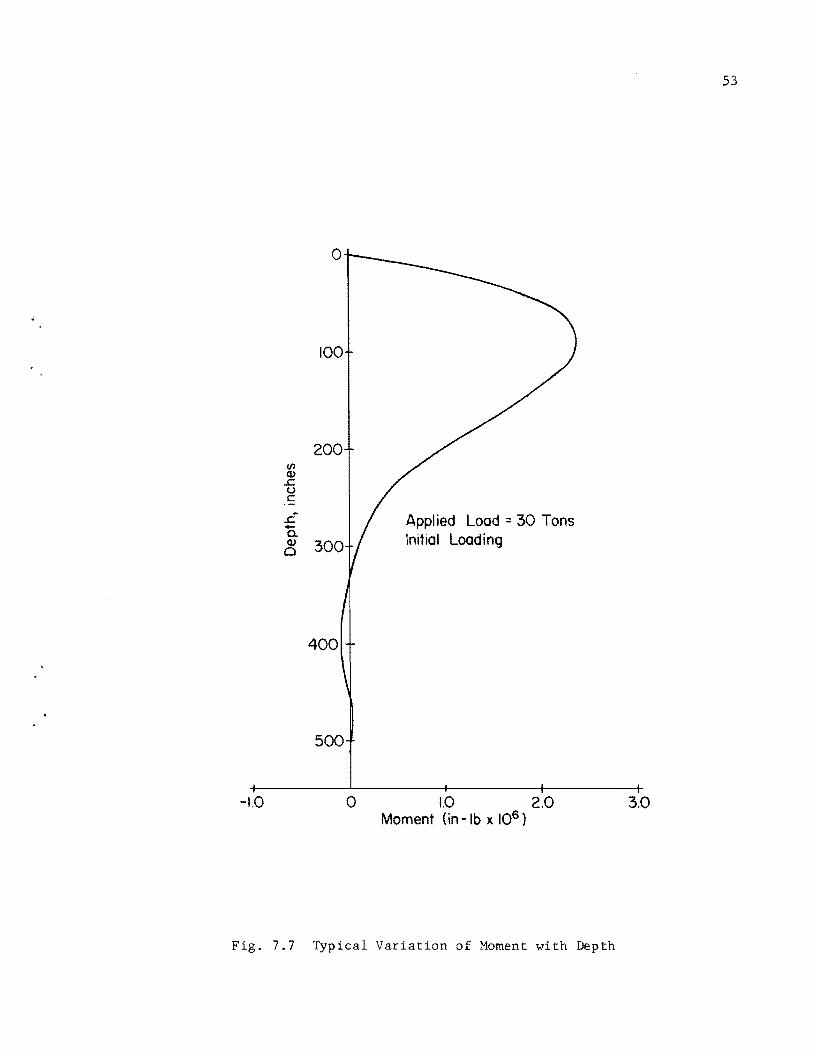
Moment
The moment along the shaft was determined for each load application by
using the M-0 curves from the calibration tests and the measured bending
strains. A typical curve of moment with depth is shown in Fig. 7.7. The
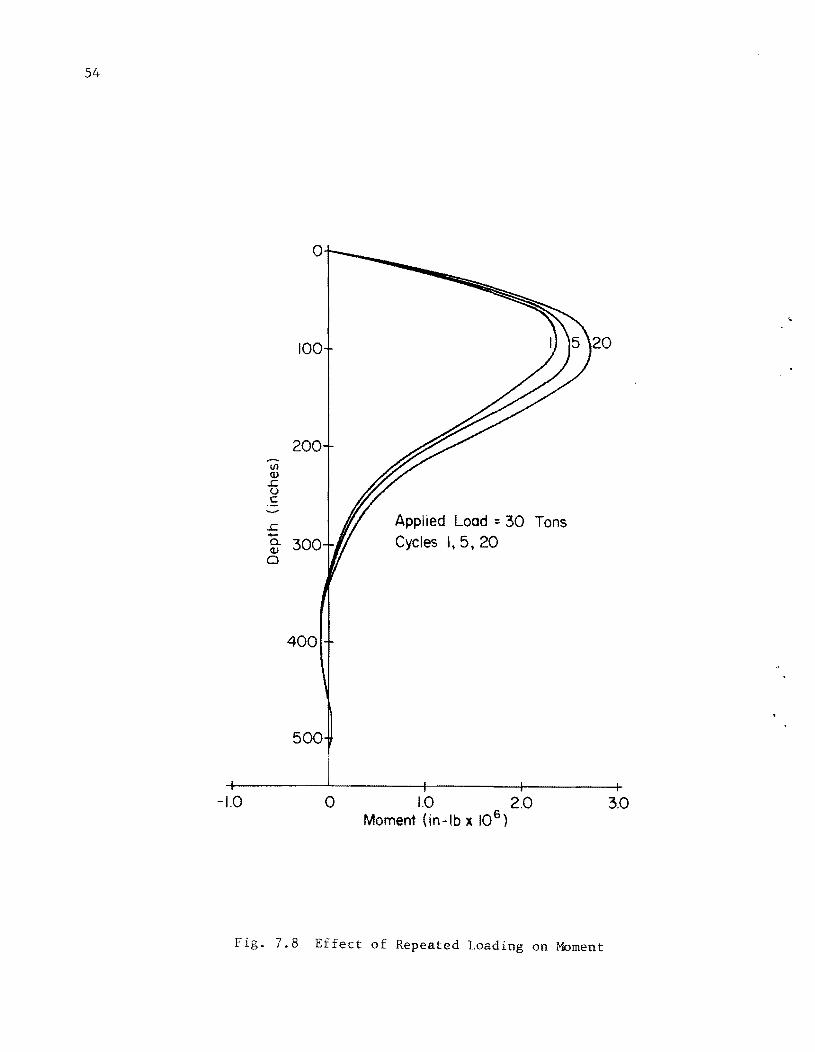
depth to the point of maximum moment increases with an increase in applied
load. Under repeated loading, the maximum moment increases with each
load application (10 to 20 per cent increase over 20 cycles) but the depth
to the point of maximum moment increases very little. Moment curves
illustrating the effect of repeated loading are shown in Fig. 7.B. The
change in the distribution and magnitude of moment with an increase in load
is illustrated in Fig. 7.9.
Curve-Fitting Procedure
It was recognized at the outset that some smoothing of the data would
have to be done before the double differentiation process would give
reasonable values of soil reaction. The most obvious way of smoothing
the data would be to find a continuous mathematical function which would
adequately describe the variation of moment with depth. This function
could be a truncated power series, trigonometric series or a spline function.
An alternate procedure would be to fit a function over a selected interval
and then operate on the function within the interval, successively changing
the interval until all data points had been operated upon. The most con
venient function to use, from the standpoint of simple differentiation and
integration, would be the polynomial describing a truncated power series.
A least-squares curve-fitting technique was used to fit the selected
function to the data.
-1.0
If) Q)
.s::. (,) c
sf -a. Q)
o
100
200
400
500
Appl ied Load: 30 Tons Initial Loading
o ID 2D Moment (in -Ib x 106 )
Fig. 7.7 Typical Variation of Moment with Depth
53
3.0
54
o
100
200 -(/) Q) ..r: u c
..r: Applied Load:: 30 Tons 0+-
Cycles 1,5, 20 a. 300 Q)
0
400
500
-1.0 o 1.0 2.0 3.0 Moment (in-Ib )( 106 )
F . 7.8 Effect of Repeated Loading on Moment
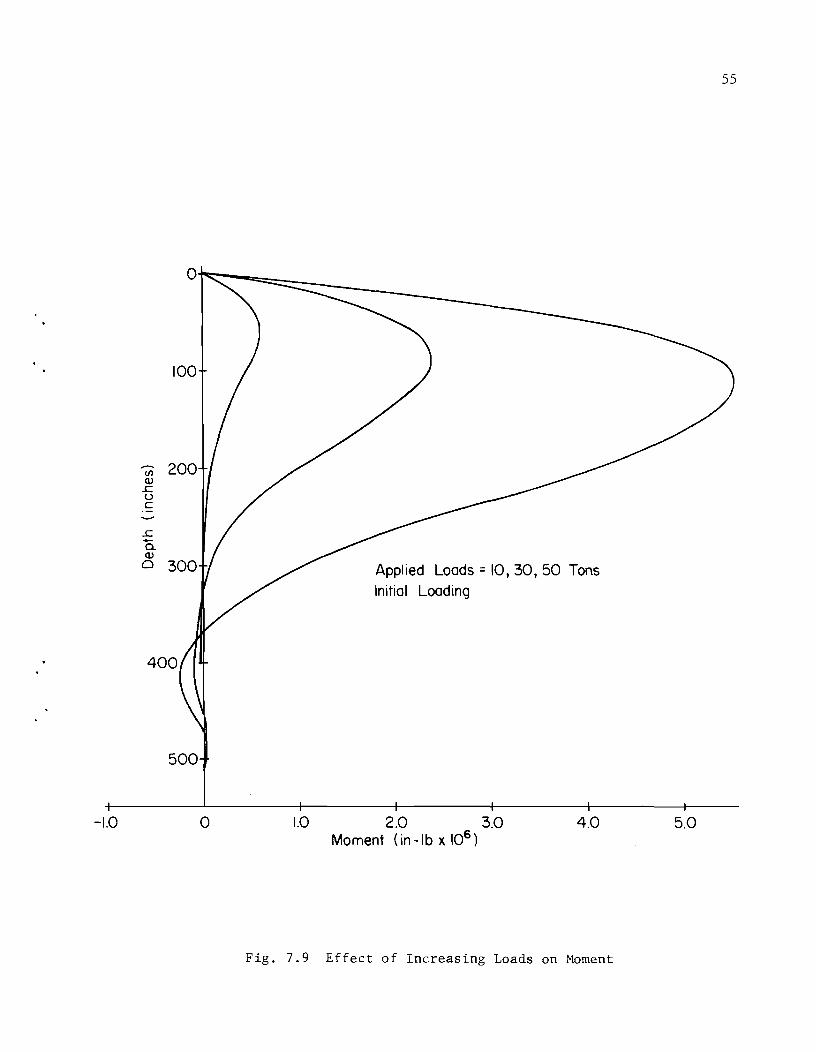
-1.0
-(/) Q)
.£: U C
.£: -a. Q)
o
100
400
500
o
Applied Loads = 10,30,50 Tons Initial Loading
1.0 2.0 3.0 4.0 Moment (in -Ib x 106 )
Fig. 7.9 Effect of Increasing Loads on Moment
55
5.0
56
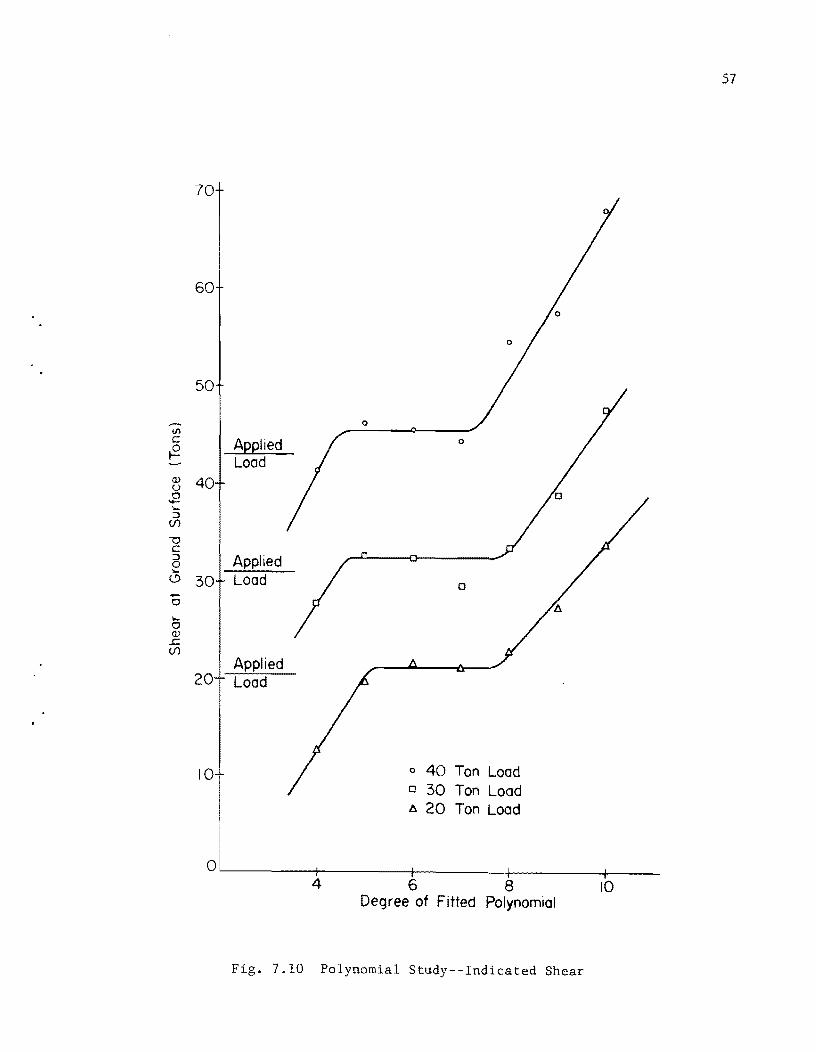
In fitting a polynomial to the data, the question of the degree of
polynomial to use required some analysis. Obviously, the polynomial
would have to be of degree three or greater, since soil reaction is
determined by differentiating twice. Also, the greater the degree of
the polynomial, the better it would fit the data points but with a greater
possibility of erratic behavior between points. To investigate the effect
of the degree of the polynomial upon the reduction of the field test data,
polynomials of degrees 4 through 20 were fitted to the moment curves
obtained from the initial application of 20, 30, and 40 tons. The resulting
polynomials were differentiated twice, the first derivative compared to the
applied shear and the second derivative examined for variation with change
in degree of the polynomial. As a result of this polynomial study, whose
results are summarized in Figures 7.10 and 7.11, it was concluded that the
moment curve could be satisfactorily described by a polynomial and that a
polynomial of degree 7 would provide the best curve fit without erratic
behavior. A polynomial of this order would describe the soil reaction as
a fifth order function of depth.
Deflected Shape
The deflection of the shaft as a function of depth was determined by
twice integrating the observed curvature data and by twice integrating
curvatures obtained from the fitted moment curve using Simpson's rule.
The boundary conditions used were the measured deflection at the top of
the shaft and an assumed zero deflection at the bottom of the shaft. There
was no appreciable difference in the deflections computed by the two methods.
...-!J)
c t2 (J) u .E .... :J
U)
-0 C :J 0 .... 0 ...... 0
... 0 (J)
.t::. U)
70
60
50
Applied Load
40
Applied 30 Load
Applied 20 Load
10
0
0
0
o 40 Ton Load o 30 Ton Load !.t. 20 Ton Load
OL-------~I--------_+I--------_rl --------~/~----4 6 8 10
Degree of Fitted Polynomial
Fig. 7.10 Polynomial Study--Indicated Shear
57

58
c: o '';='
-900
-800
-700
-600
g -500 (])
0::
-400
-300
-200
o 4
Depth 67.5 in.
o
o
6 8
o 40 Ton Load Cl 30 Ton Load lJ.. 20 Ton Lood
10 Degree of Fitted Polynomial
. 7.11 Polynomial Study--Indicated Soil Reaction
12
59
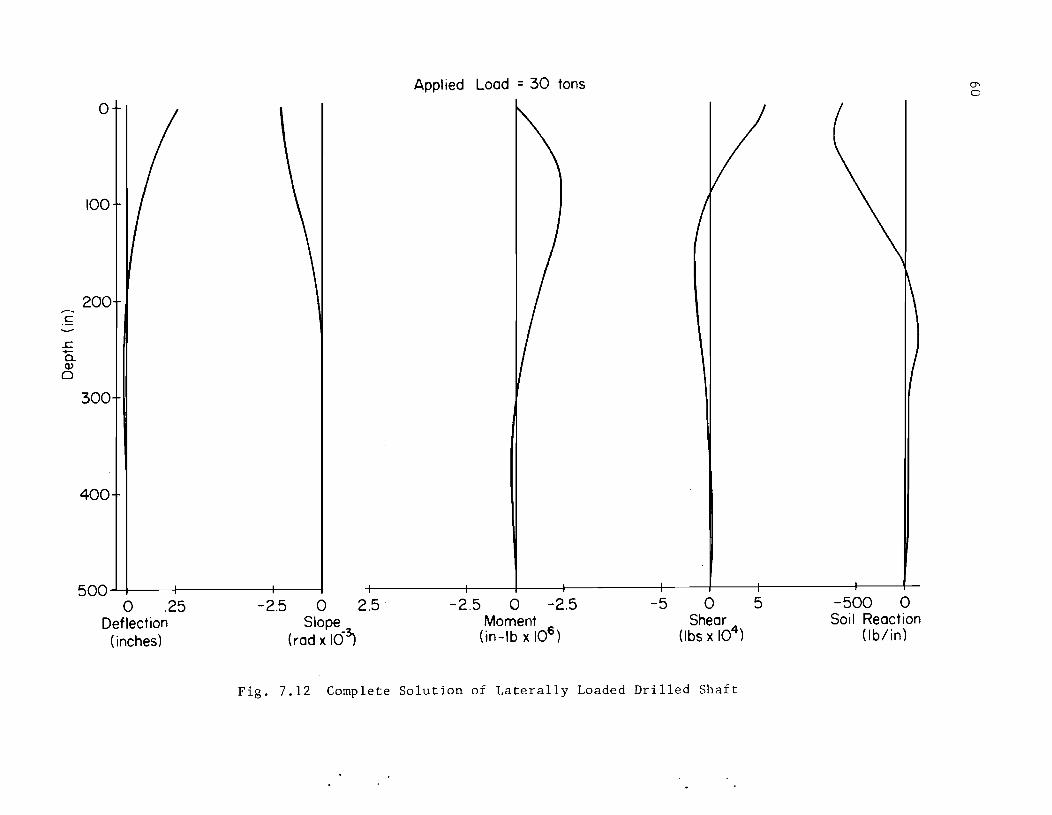
Soil Reaction and Shear
The shear resisted by the shaft was determined by differentiating the
polynomial describing the moment curve. The second differentiation yielded
values of soil reaction. A typical complete solution showing deflection,
slope, moment, shear, and soil reaction as a function of depth is presented
in Fig. 7.12 .
.E..:.Y Curves
The p-y relationship for the soil at the test site can be described
by plotting the soil reaction and deflection at a selected depth for
several values of applied load. In this test, the data taken was sufficient
to allow the determination of p-y curves for the initial loading and for
each of the cycles of repeated loading. Typical p-y curves showing the
effect of repeated loading are given in Fig. 7.13.
The p-y relationship was determined for depths of 0, 7.5, 22.5, 37.5,
52.5, 67.5, 82.5, and 97.5 inches. These depths represent all the gage
levels within the zone of significant deflection plus the ground surface.
The shape of the p-y curves was similar for all gage levels and a nondi-
mensional curve was constructed by dividing all y values by the deflection
at one-half the ultimate soil reaction (Y50) and dividing all p values by
the ultimate soil reaction (p). Skempton (1951) suggests a relationship, u
based on elastic theory, between load and settlement for various footing
shapes. The data he presents appear to justify the use of his method for
computing immediate settlements for all foundation depths and thus should
be applicable to the case of a laterally loaded shaft of pile. Using the
value he suggests for a long strip footing (LIB = 10), the deflection at
one-half the ultimate load is:
Y50 2.5 b€50 .•••.••••.•.......•• (7.3)
c
r. +-0. Q)
0
Appl ied Load = 30 tons
a
100
200
300
400
500~----~-------+----~--+-------~----+---~--------+---~---+--------4----+-
a .25 Deflection
(inches)
-2.5 a 2.5 Slope
-3 (rad x 10 )
-2.5 o -2.5 Moment
(in-Ib x 106 )
-5 a 5 Shear
(lbs x 104)
Fig. 7.12 Complete Solution of Laterally Loaded Drilled Shaft
-500 a Soil Reaction
(Ib/in)

-\000
-800
a. c-600 o
...... u o Q)
0:::
o (j) -400
-200
Depth = 37.5 in
• 1st Load Application o 2nd Load Applicotion • 3rd Load Application • 10th Load Application
0L-------+-------4-~----~------~------_+----.2 .4 .6 .8 1.0
Deflection, y (inches)
Fig. 7.13 Effect of Repeated Loading on p-y Curves
61
62
where
€so strain at one-half the maximum principal stress
difference in a laboratory triaxial test.
In the laboratory tests of samples taken at the test site, the average
value of €so was 0.005 in/in. Using Eq. 7.3, the average value of YsO
for the 30-inch diameter test shaft was computed to be 0.375 inches. The
ultimate soil reaction was not reached during the test because the shaft
was not strong enough to resist the bending stresses which would have been
generated. Since YsO is the deflection at one-half the ultimate resistance,
an estimate of the ultimate resistance can be obtained by doubling the value
of soil reaction corresponding to ysO. The values of ultimate soil reaction
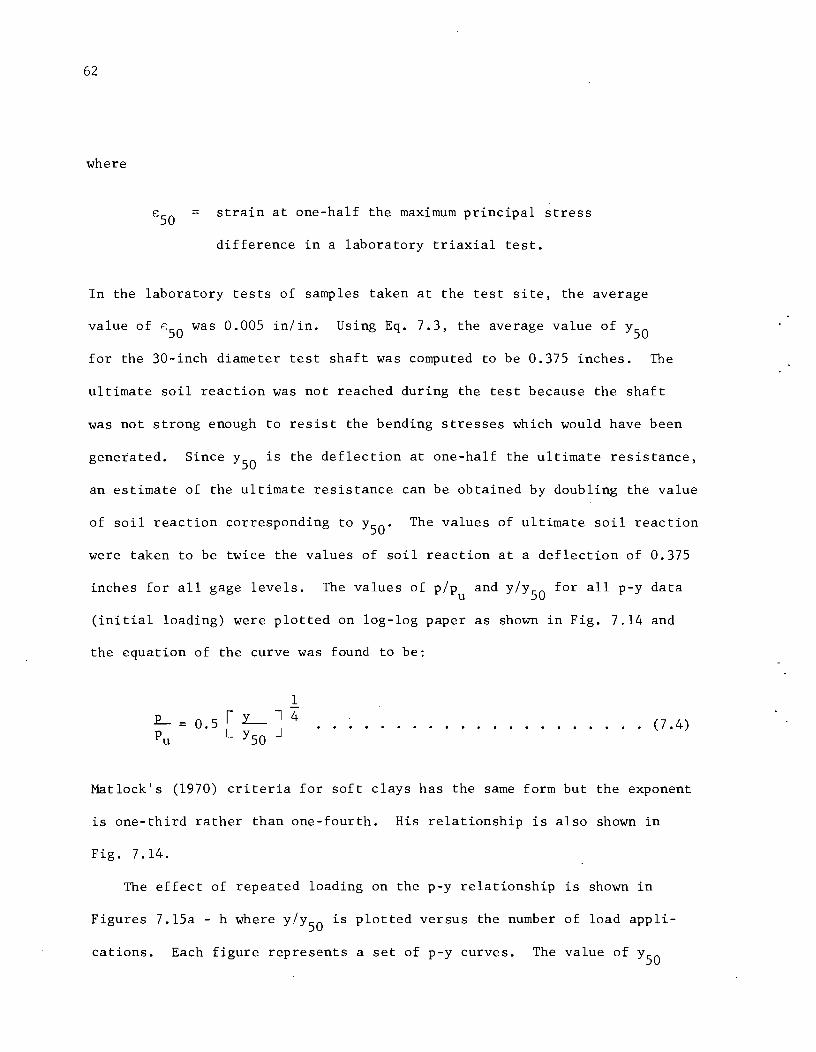
were taken to be twice the values of soil reaction at a deflection of 0.375
inches for all gage levels. The values of p/pu and y/yso for all p-y data
(initial loading) were plotted on log-log paper as shown in Fig. 7.14 and
the equation of the curve was found to be:
1 r y-- l 4 0.5 ...•.......•.•....... (7.4) L YsO J
Matlock's (1970) criteria for soft clays has the same form but the exponent
is one-third rather than one-fourth. His relationship is also shown in
Fig. 7.14.
The effect of repeated loading on the p-y relationship is shown in
Figures 7.1Sa - h where y/yso is plotted versus the number of load appli-
cations. Each figure represents a set of p-y curves. The value of YsO

Y/Y50
1.0·,-1 ______ ---1.2f--__ --'3f--_--+.4 __ . 5I------+.6_-t.7_.+8-----l.9-----11f-. ______ -t2 ___ -----13r--_---t
4_---+5
.9
.8
.7
PI. .6 Pu
.5
.4
. 3
.2
•
Fig. 7.14 Graphical Determination of Nondimensional p-y Curve
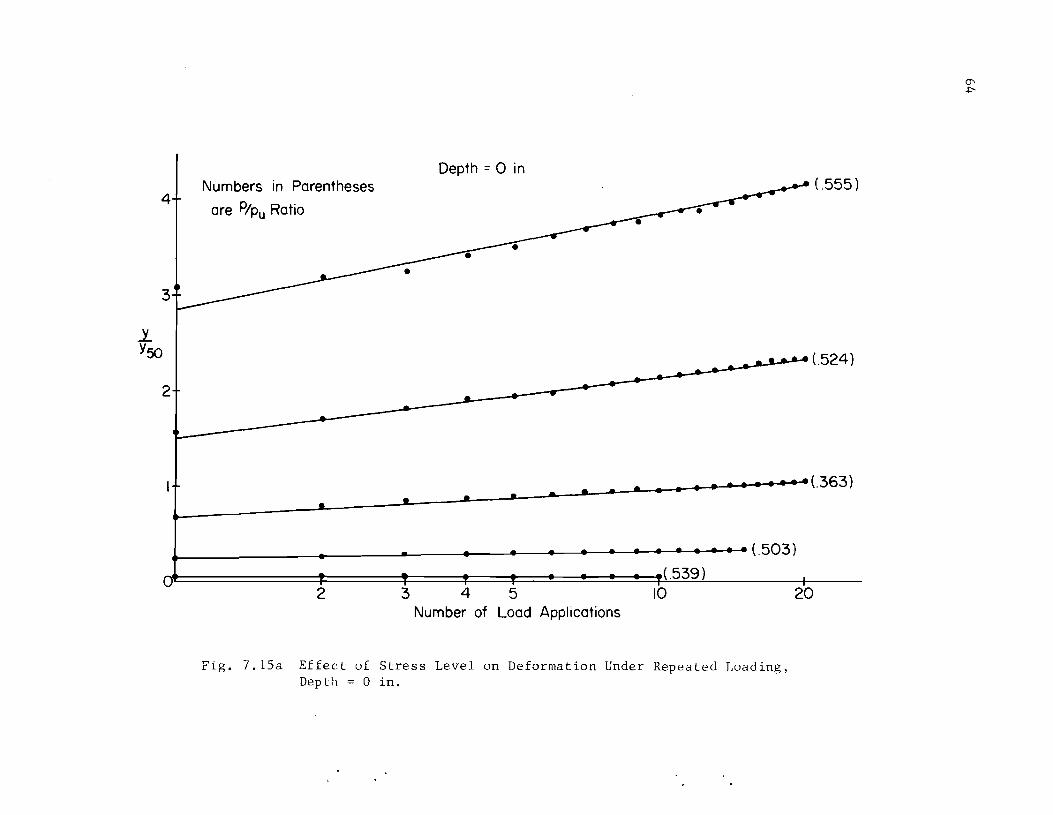
4
3
2
Numbers in Parentheses
are p/Pu Ratio
Depth = 0 in. (.555)
L_----J-------'!...-------------------~--.--.4~...--+-4- (.363)
L ____ ~_------------------------e------.......... --- (.503) (.539)
2 3 4 5 10 Number of Load Applications
Fig. 7.lSa Effect of Stress Level on Deformation Under Repeated Loading, Depth = 0 in.
20
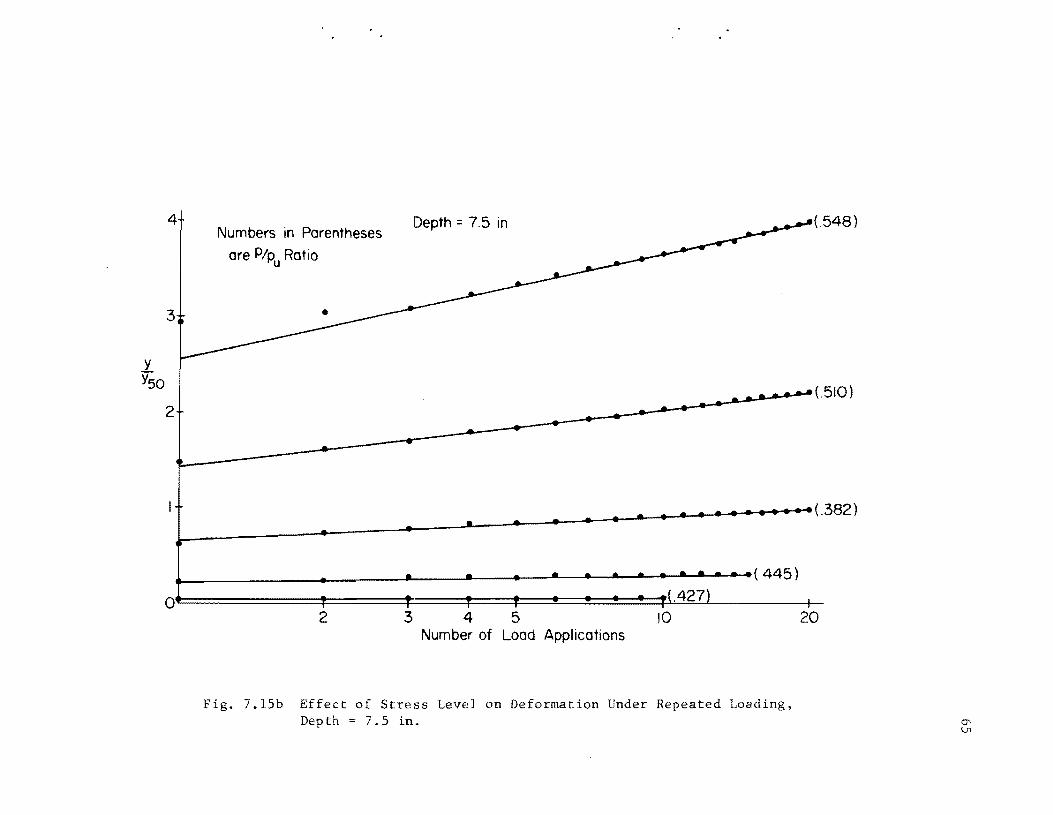
4
3
Numbers in Parentheses
are P/pu Ratio
Depth = 7.5 in. (548)
L_---------......... -~L.--------......... -------.................. ~....--............... (.382)
~---------------L-----'II--------------.&.....--.................. ....-..A-( 445 ) 0~==========~====~====~==~==~~~~~~·4~2~7)L-------4_
2 3 4 5 10 Number of Load Applications
Fig. 7.1Sb Effect of Stress Level on Deformation Under Repeated Loading, Dep th = 7. S in.
20
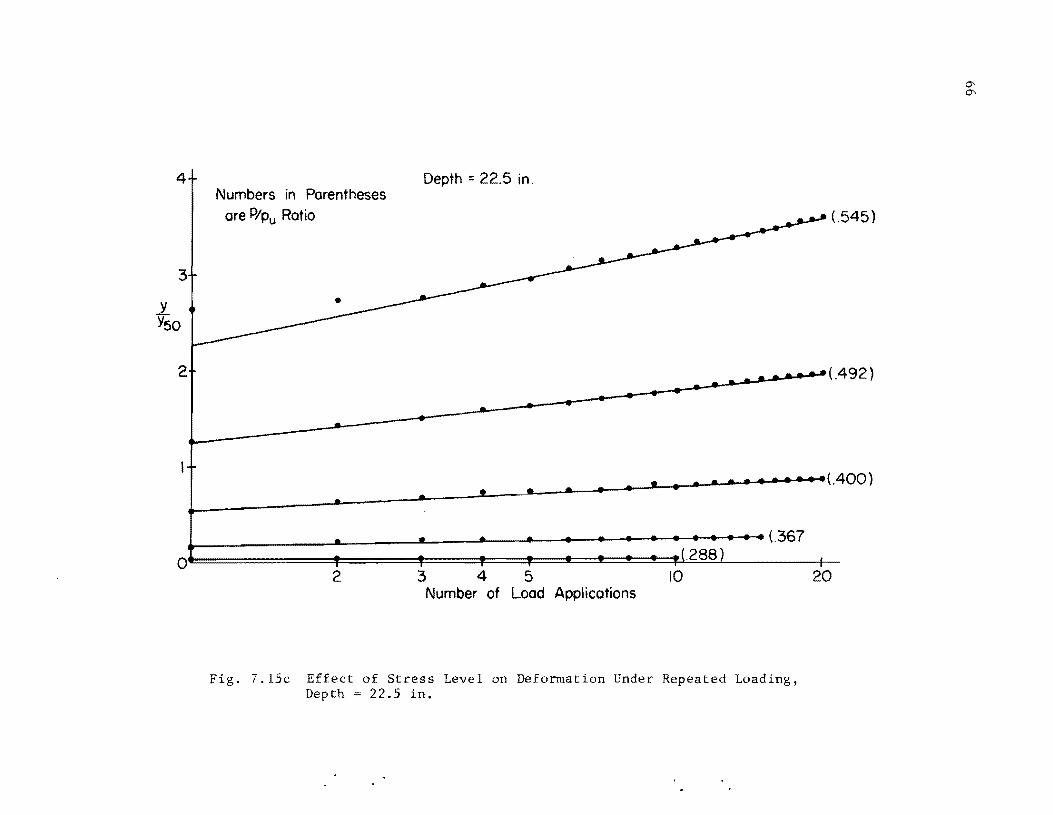
4
3
Numbers in Parentheses
are P/Pu Ratio
Depth = 22.5 in .
(,545 )
L_--------------~-------'L--....-.-~----.-................... -...... ......... ...--{.400)
o~========~======*====*==~==~~~~~~~------+-2 345 10
Number of Load Applications
Fig. 7.l5c Effect of Stress Level on Deformation Under Repeated Loading, Depth 22.5 in.
20
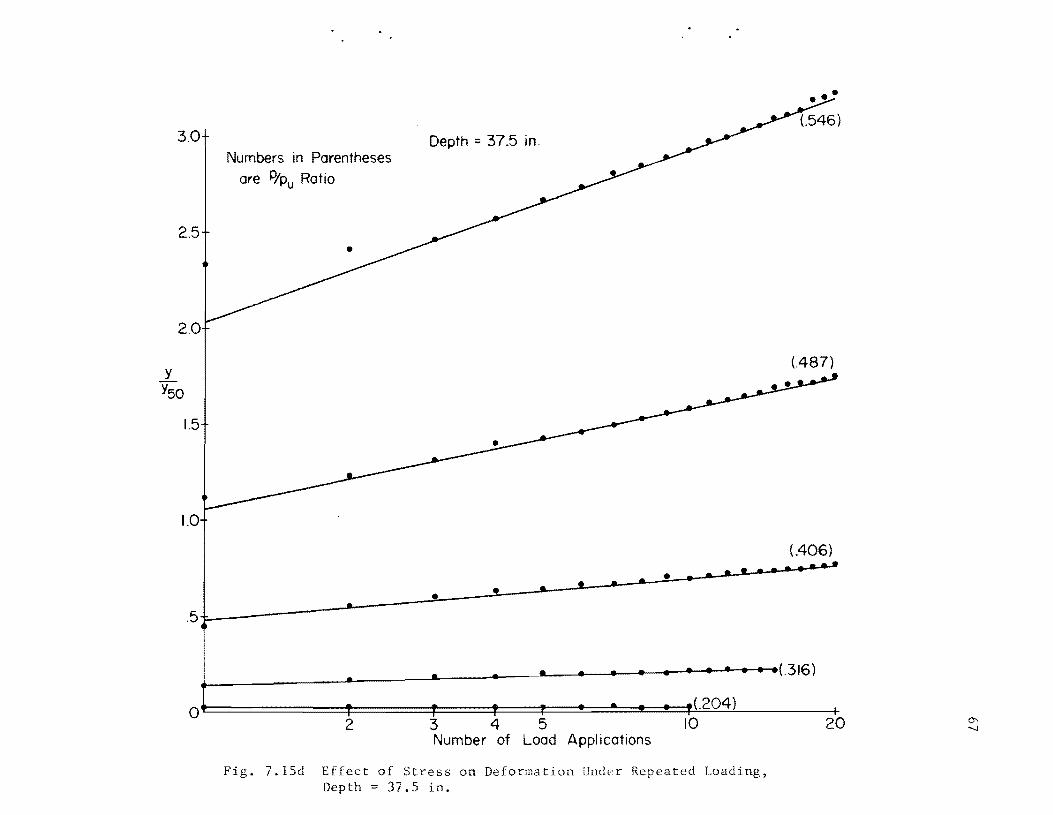
3.0
2.5
2.0
y
Y50
1.5
1.0
Numbers in Parentheses are P/pu Ratio
•
Depth = 37.5 in.
(.487)
{.406}
L ___ ------~--L---I-------------------~....-.... ........... -{.316)
0~==========~====~====~==~==~~~=±~(~·2~0~4L)------_+ 2 3 4 5 10 20
Number of Load Applications
Fig. 7.15d Effect of Stress on Deformation Under Repeated Loading, Depth::: 37.5 in.

2.5
2.0
Numbers in Parentheses
are p/pu Ratio
Depth:: 52.5 in.
L ________ -~-----a....-----IIi-----.......----4-----4-----~ ......... ..- (.262)
•
0~==========~====~==~F=~C=~~~~~~(.~13~8L)------_+ 2 345 10
Number of Load Applications
Fig. 7.l5e Effect of Stress Level on Deformation Under Repeated Loading,
Depth = 52.5 in.
20
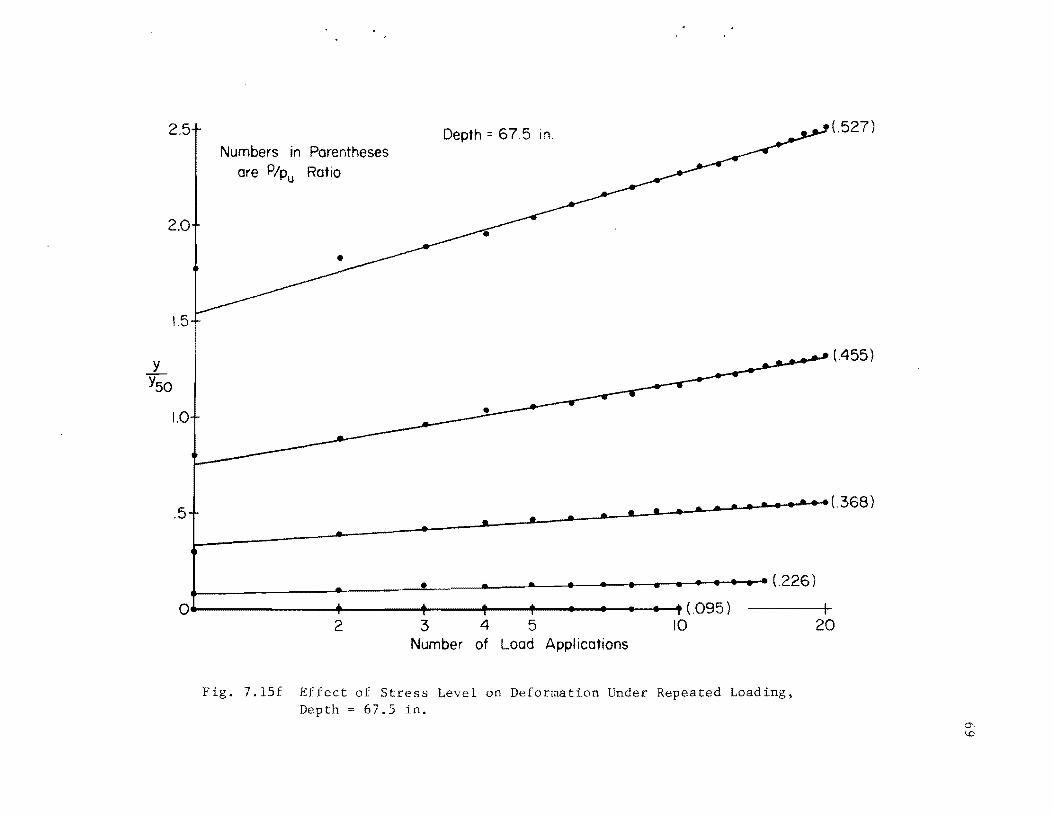
2.5
2.0
y
Y50
1.5
1.0
Numbers in Parentheses are P/pu Ratio
Depth = 67.5 in.
(.455)
l_----~--~~--"---"---'~----"--"---"--'-............... ---~(,368 ) .5
L __ ---------.-..Jt------L....---------r-~t-+-........... (,226) O ...... ------+-----f----+---+-----........ (.095)
2 3 4 5 10 20 Number of Load Applications
Fig. 7.1Sf Effect of Stress Level on Deformation Under Repeated Loading. Depth == 67.S in.
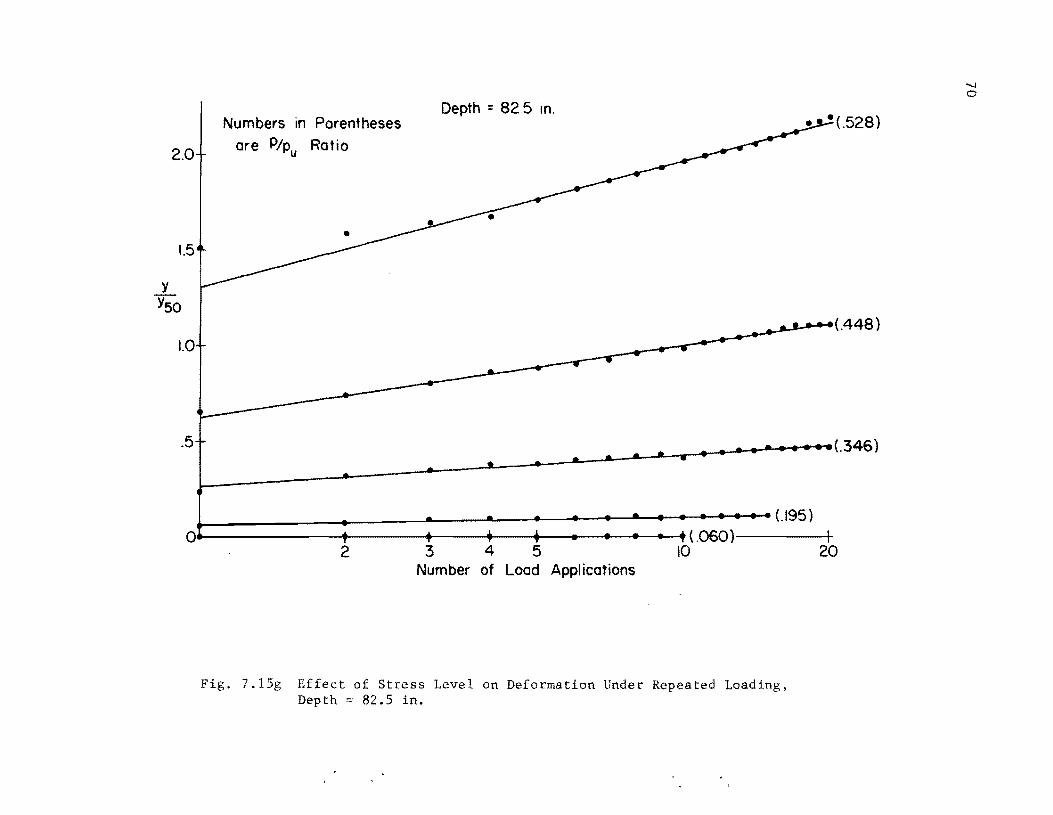
2.0
1.5
1.0
Numbers in Parentheses
are P/pu Ratio
Depth = 82.5 in.
.. t-J-(.448)
L ____ ---....------'---------~~----+-----+--4-~-....... <.195) 01~------+----+---...--+--....------------.(.060)----+1
Fig. 7.1
2 3 4 5 10 20 Number of Load Applications
Effect of Stress Level on Deformation Under Repeated Loading, Depth = 82.5 in.
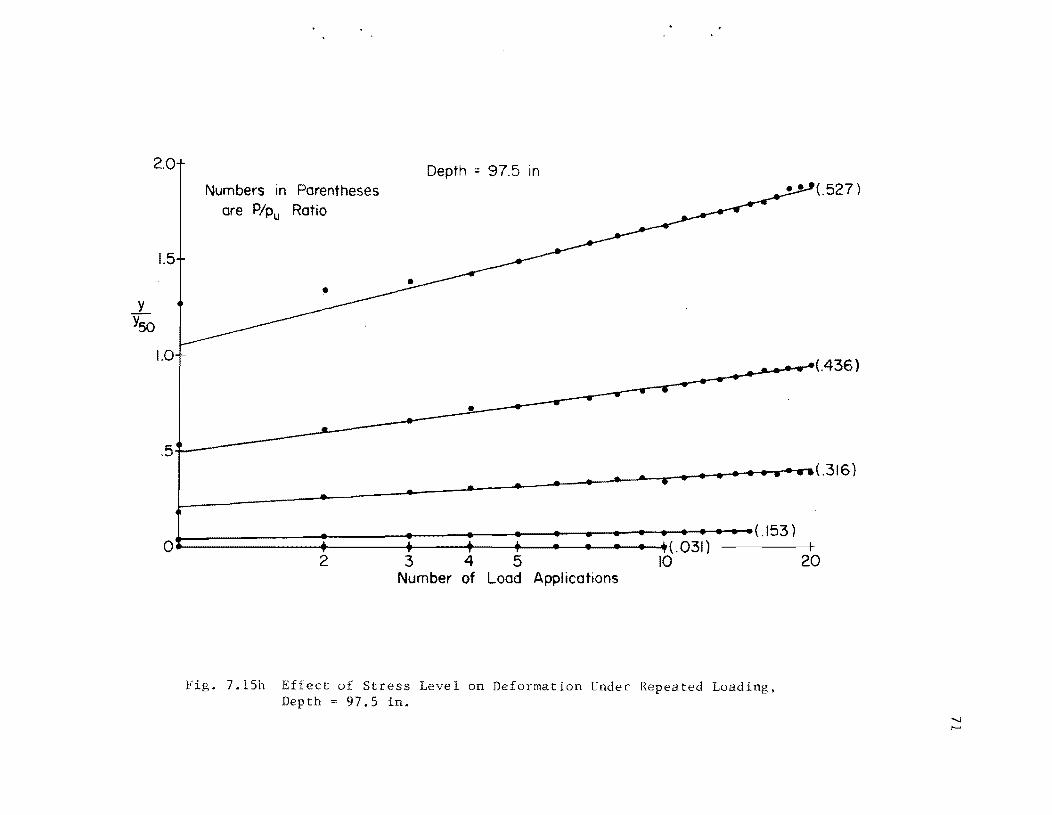
2.0 Depth = 97.5 in
y Y50
1.5
Numbers in Parentheses are P/Pu Ratio
•
1.0 _____ ---.................. ..-C436 )
.5
L_-------4-----+----~---------~~~--(.153 ) 0~-------t----*"----+---.-----4---...-...{.031 )
2 3 4 5 10 Number of Load Applications
Fig. 7.l5h Effect of Stress Level on Deformation Under Repeated Loading, Depth 97.5 in.
20

72
used for computing the plotted points is the value for the initial
application of load or 0.375 inches. It can be seen from these plots
that the additional deflection for each application of load increases with
an increase in stress level. It was noticed, however, that if the increase
in deflection after a specific number of cycles is expressed as a per
centage of the first cycle deflection, a fairly constant value is obtained.
For example, the increase in deflection after 10 cycles of loading is
approximately 60 percent of the first cycle deflection. This relationship
appears to be independent of stress level.
The deflection of the shaft during the test was not large enough to
develop the ultimate soil reaction, and it is felt that the estimated
values of are not sufficiently accurate to determine the variation of
Pu with depth to an acceptable degree of certainty. It is of interest,
however, to compare the estimated values with values predicted by Reese's
wedge equation and Matlock's modification of that equation. This comparison
is shown in Fig. 7.16. A shear strength of 2200 pounds per square foot
(constant with depth) was used for the predicted values.

2000 Pu (lb/in)
3000 4000 o.-----~~--------~--------+-------~---------+--------~--
20
- 40 II) Q)
.s::. u .S
.s::. a. ~ 60
80
100
+ Estimated Values of Pu
..... ____ Pu= [3 + ~x + 2.83 ~] cb (Reese Equation)
+
+ p = [3 + "(x + 0 5..!.] cb u c . b
+ (Matlock Equation)
Fig. 7.16 Variation of Ultimate Soil Resistance with Depth

!!!!!!!!!!!!!!!!!!!"#$%!&'()!*)&+',)%!'-!$-.)-.$/-'++0!1+'-2!&'()!$-!.#)!/*$($-'+3!
44!5"6!7$1*'*0!8$($.$9'.$/-!")':!
CHAPTER VIII
RESULTS OF LABORATORY TESTS
Unconsolidated-undrained triaxial compression tests were performed
on undisturbed samples taken at the test site. The information obtained
from these tests consisted of the undrained shear strength and the stress
strain properties of the soil. Several samples were subjected to repeated
loading, and the effect on the stress-strain relationship was observed.
Triaxial Compression Tests
In all of the triaxial compression tests performed in this study,
the samples were subjected to a confining pressure equal to the effective
overburden pressure and tested in the unconsolidated-undrained condition.
A controlled-strain loading procedure was used with the strain rate
adjusted to 0.005 in/in. per minute.
Anisotropy
The effect of orientation upon soil properties was investigated by
testing samples 1.4 inches in diameter by 2.8 inches in length whose axes
were both horizontal and vertical. These samples were trimmed from four
inch diameter thin-walled tube samples. Moisture and density were determined
from the larger sample before trimming since the measurement of volume would
be more accurate for the larger sample. Contrary to expectations, no signi
ficant difference was found in sample properties because of orientation.
Average values of strength and stiffness differed by only five and two per
cent, respectively. The stress-strain curves exhibited the same character
istic shape for both orientations. For this study, it was assumed that
75

76
there was no anisotropy and that tests of vertically oriented samples
would measure the properties of the soil under horizontal loading.
Undrained Shear Strength
The values of undrained shear strength were plotted versus depth on
the boring log of Fig. 6.1. The strengths in the upper 20 feet, repre-
senting the zone most important in lateral behavior, are replotted in
Fig. 8.1 with the sample orientation indicated. As can be seen from this
plot, there is a wide variation in shear strength, due in part to the
slickensided structure, but no discernable pattern of strength variation
with depth. The average undrained shear strength in the upper 20 feet is
approximately 15.3 pounds per square inch or 2200 pounds per square foot.
Stiffness
A secant modulus intersecting the stress-strain curve at one-half the
maximum principal stress difference was used to describe the stiffness of
the soil, E c
These values of E are plotted versus depth in Fig. 8.2. c
The scatter in the data obscures any trend in the top 20 feet but the overall
pattern shows a decreasing soil stiffness with depth.
Stress-Strain Relationship
To define the stress-strain relationship in nondimensional terms, the
applied principal stress difference (deviator stress) was divided by the
maximum principal stress difference and the strain was divided by the
strain at one-half the maximum stress difference (850
). The values of
8/850
were determined at 25 percent, 50 percent, 75 percent, and 100 per-
cent of the maximum principal stress difference for all tests. The values

I I I
51
.....: '+-
• HOrizontal Orientation (1.4 in. Samples) • Vertical Orientation (I.4 In. Samples) .. Vertical Orientation (3.0 in. Samples)
• • •
•
• •
• • • • • ..
• •
•
•
:E 10 • • a. Q)
0
• • •• ..
• • • • •
15
•
• •
••
20~-------+--------~--------r-------~---------+ o 5 10 15 20 25
Shear Strength (psi)
Fig. 8.1 Distribution of Undrained Shear Strength with Depth
77
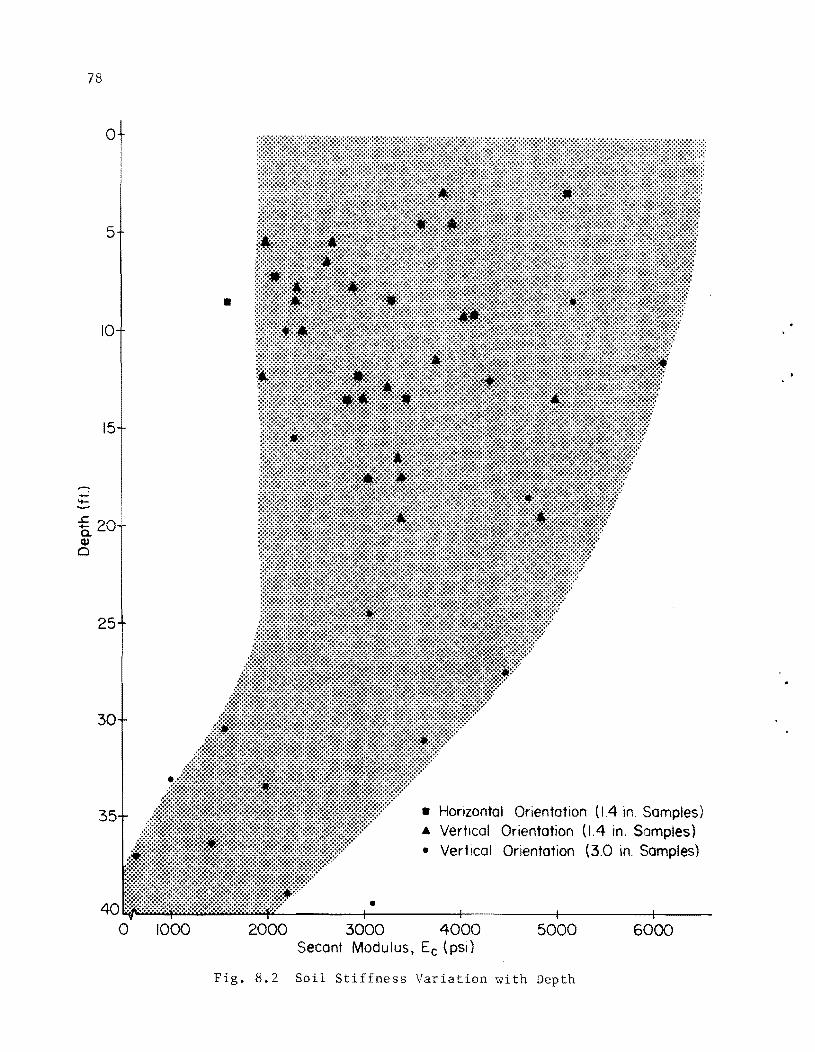
78
5
10
15
---.....: '+-
£ 20 a. <U CI
25
40 o 1000
•
•
• Horizontal Orientation (14 in. Samples) .& Vertical Orientation (1.4 in. Samples) • Vertical Orientation (3.0 in. Samples)
2000 3000 4000 5000 6000 Secant Modulus, Ec (psi)
Fig. 8.2 Soil Stiffness Variation with Depth

from tests on 1.4-inch diameter horizontal samples were averaged, as were
test values from 1.4-inch diameter vertical samples and 3-inch diameter
vertical samples. These average values were plotted on log-log paper as
shown in Fig. 8.3 and the equation of the curve was found to be:
(°1 °3)
(°1 - 0 3)max
1
l 2 ...•...•.•....•. (8.1)
The average value of €50 was 0.005 in/in.
Repeated Loading
Several of the samples were subjected to repeated loading. Various
stress levels were used and the results are presented in Figures 8.4a - b.
It can be seen that the additional deformation under repeated loading is
dependent upon the stress level.
At high stress levels, repeated loading will probably reduce the shear
strength of the sample, thus giving an erroneous value of the stress ratio.
Errors in making deformation measurements at low stress levels will produce
scatter in the data, thus leading to the conclusion that the most reliable
estimates of behavior under repeated loading can be obtained for stress
ratios between, say, 30 percent and 70 percent or perhaps 25 percent and
75 percent.
79

1.0 .9
.8
.7
.6
.5
O"/O"u
.4
.3
.2
E/. E50
.2 .3 .4 .5 .6 .7 .8 .9 I.
....
2 3 4
• Horizontal Samples (1.4 in)
• Vertical Samples (1.4 in)
.. Vertical Samples (3.0 in)
Fig. 8.3 Graphical Determination of Nondimensional Stress-Strain Curve
5 6
Ct:; o
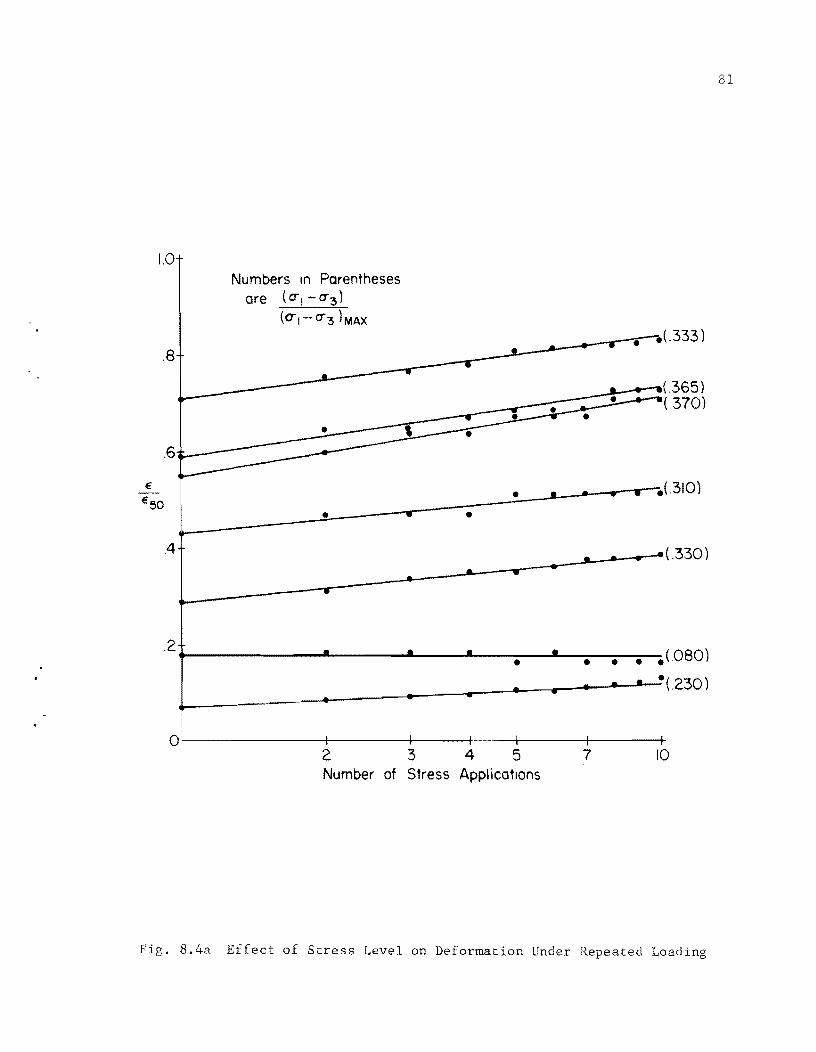
1.0
.8
.6-r--
.2
01
Numbers in Parentheses are (cr1- cr3)
(Ut- cr3 )MAX
I 2 Number of
I 3 Stress
_J--.....-........ ---.,. .( .333 )
• •
I I I 4 5 7
Applications
• •
(.365) (,370)
.(.080)
·(,230)
I 10
F . 8.4a Effect of Stress Level on Deformation Under Repeated Loading
81
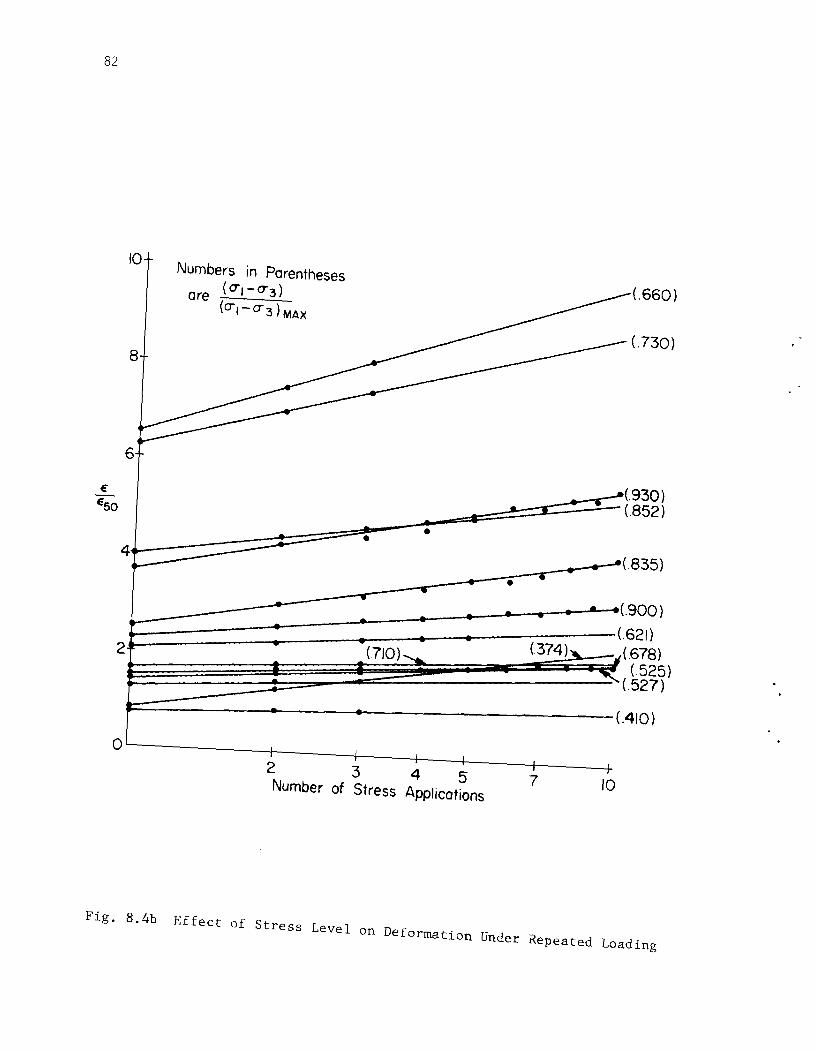
82
10
(.660)
(.730)
6
(,930) e
(.852) eso
• • 4 (,835)
(.900)
(,621) 2 (710) (.374) (,678)
(.525) (,527)
(.410)
OL---__________ ~--____ _+----_+----~--__ _+----__ ~ 2 345 Number of Stress Applications
7 10
Fig. B.4b Effect of Stress Level 00 Deformation Under Repeated Loadiog

CHAPTER IX
CORRELATION OF FIELD AND LABORATORY TESTS
The soil response observed in the field tests and in the laboratory
test was similar in many respects. These similarities will be examined
in this section and the field and laboratory results will be correlated.
Load-Deformation Relationships
The analysis of the p-y curves as described in Chapter VII yielded
the following nondimensional p-y curves:
1
I, L-l 4 0.5 L ySO '
..................... (7.4)
The value of ySO was found by Skempton's relationship:
Yso 2.5 b€SO .•.•...•••...•...•...•. (7.3)
The nondimensional stress-strain curve obtained from the triaxial compression
tests in the laboratory is:
(° 1 - °3)
(°1 - ° 3)max r €
0.5 L €SO
1 l 2
..••..•.•....... (8.1)
At a particular stress ratio, or percentage of ultimate resistance, the
relationship between field and laboratory deformations is:
83
84
or
and,
then
r X- l 1/4
ySO
X- I s
yso sSO
since
l2
yso 2.S bsSO
r- 2.S b l y , ---t_ sSO
S
•
I 2
sSO
! 1/2 . . . . . . . . . . . . . . . . . (9.1)
.......•.•.•.•......... (9.2)
. . . . . . . . . . . . . . . . . . . . • . . (7.3)
2 ...•....•...••...••... (9.3)
The values of band sSO will be constant for a specific set of conditions,
thus showing (empirically) that the field deflection is proportional to
the square of the strain in a laboratory compression test when the stress
ratios are equal. The nondimensional stress-strain and p-y curves are
shown in Fig. 9.1.
Effect of Repeated Loading
The effect of repeated loading on p-y curves was illustrated in Figures
7.lSa - h by plotting y/yso versus the log of the number of load cycles for
various stress levels. The same type of relationship between s/sSO and
the number of cycles for the laboratory tests was shown in Figures 8.4a - b.
The plotted data can be represented by straight lines on these semi-log
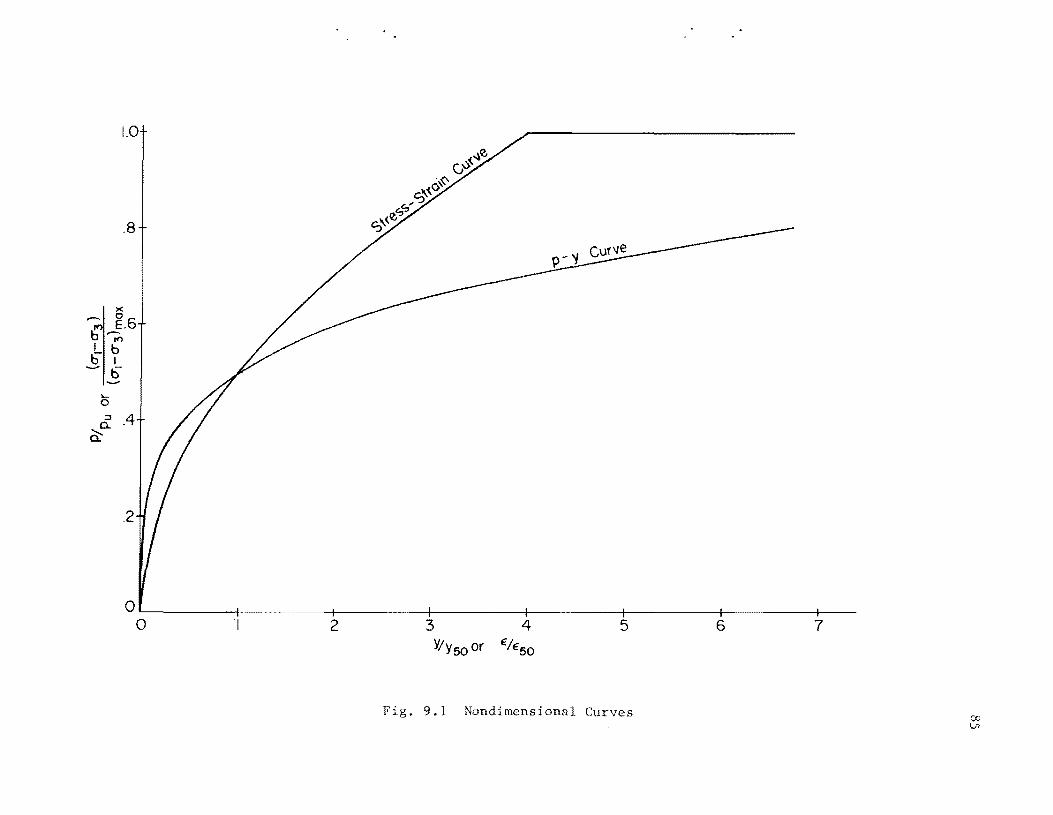
1.0
.8
-~ ~.6 b~ !... b b I -t) -
.2
OL-------t~ o I
I 2 3 4 5 6 7
Fig. 9.1 Nondimensiona1 Curves

86
plots and the relationships can be described by equations of the form:
Yc Ys + Yso • Cl • log N •••.••••••.••••.• (9.4)
where
Yc = deflec tion after N cycles of repeated loading,
Ys == deflection upon initial loading,
Cl
a parameter describing the effect of repeated loading
upon deflection, and
N :::: number of cycles of repeated loading.
or, for the laboratory tests
Sc ~ si + 850
• C2 • log N .•..•.••••••••••• (9.5)
where
€ strain after N cycles of repeated loading, c
<':. strain upon initial loading, and ~
:::: a parameter describing the effect of repeated loading
on strain.
The parameters Cl and C2
are functions of the stress ratio and can be
determined from the slope of the lines on the semi-log plots. To determine
whether or not the values of Cl
and C2
could be expressed as a relatively
simple function of the stress ratio, log-log plots were made (see F . 9.2a
Although there is some scatter in the data, it appears that Cl
and C2 are
the same function of the stress ratio and can be described by the following
expression:
- b).
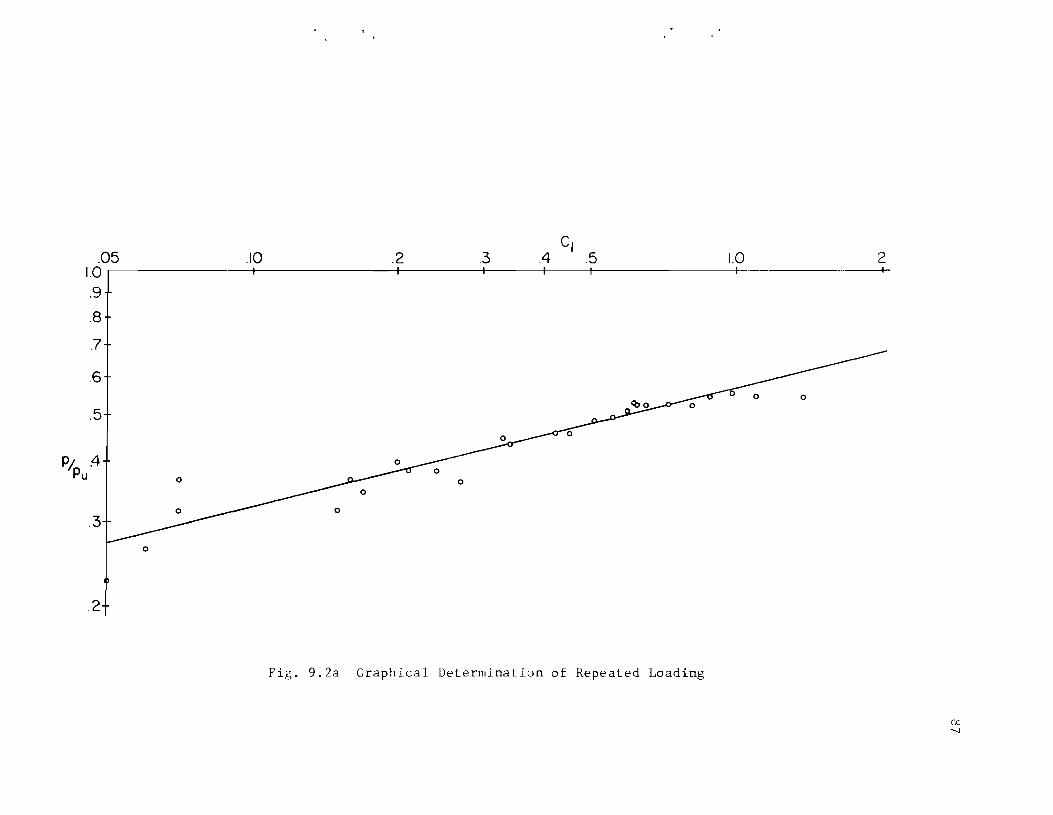
C1 .05 .10 .2.3.4 .5 1.0 2
1.0 ,--------------+---------+I-----t------+I----+-----------tl--- ---- --t-
.9
.8
.7
6
PI. .4 Pu
.3
.2
o
Fig. 9.2a Graphical Determination of Repeated Loading

C2 .05 I.°I----+------+-------.:+--+-----~~----~----~~--L
.9
.1 2 .3 .4 .5 2 3 I I
0 0
.8 0 0
.7 0 0
0
0
0
4 o
o
.3
o
.2
Fig. 9.2h GraphicHl Determination of Repeated Loading
co r::r>
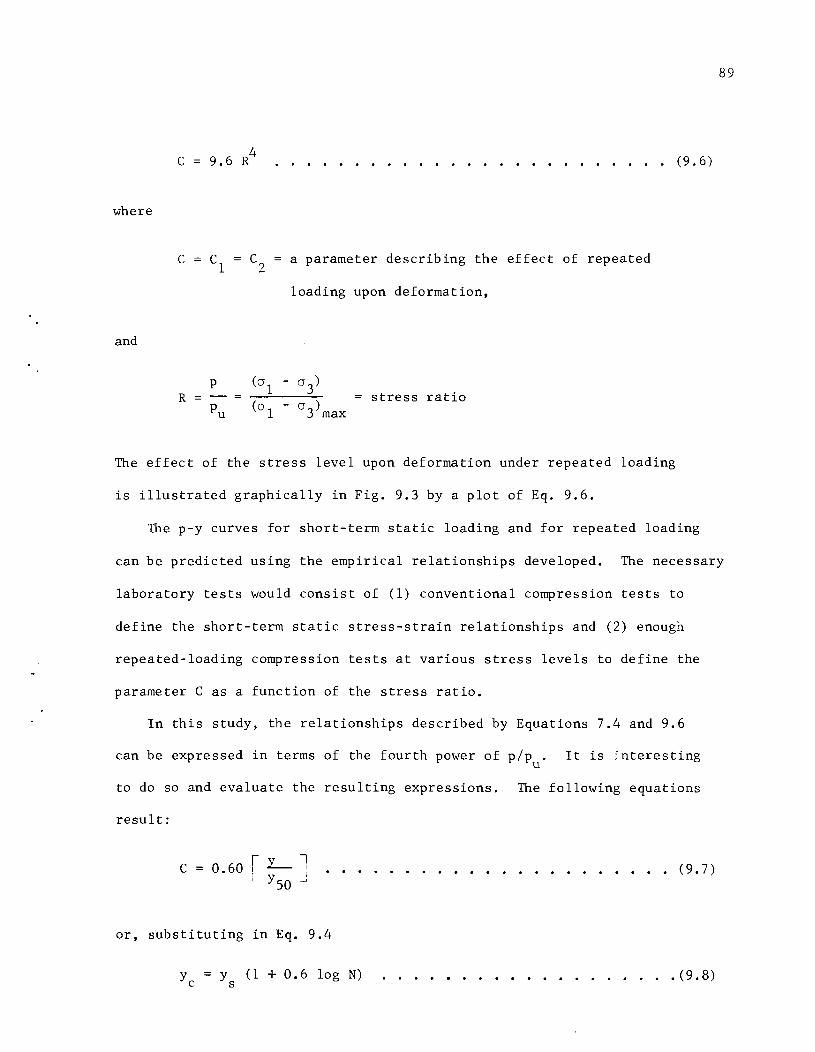
89
C 9.6 R4 ..•••••••••••••••••••.••. (9.6)
where
C Cl
C2
a parameter describing the effect of repeated
loading upon deformation,
and
p (° 1 - ° ) R
3 stress ratio Pu (° 1 - ° ) 3 max
The effect of the stress level upon deformation under repeated loading
is illustrated graphically in Fig. 9.3 by a plot of Eq. 9.6.
The p-y curves for short-term static loading and for repeated loading
can be predicted using the empirical relationships developed. The necessary
laboratory tests would consist of (1) conventional compression tests to
define the short-term static stress-strain relationships and (2) enough
repeated-loading compression tests at various stress levels to define the
parameter C as a function of the stress ratio.
In this study, the relationships described by Equations 7.4 and 9.6
can be expressed in terms of the fourth power of pip. It is interesting u
to do so and evaluate the resulting expressions. The following equations
result:
C :L-l 0.60 ,. • . . . . . . • • • • • . • • . • • • • • (9. 7) , YSO--':
or, substituting in Eq. 9.4
y = y (1 + 0.6 log N) ..••••.•••••.•.••.• (9.8) c s
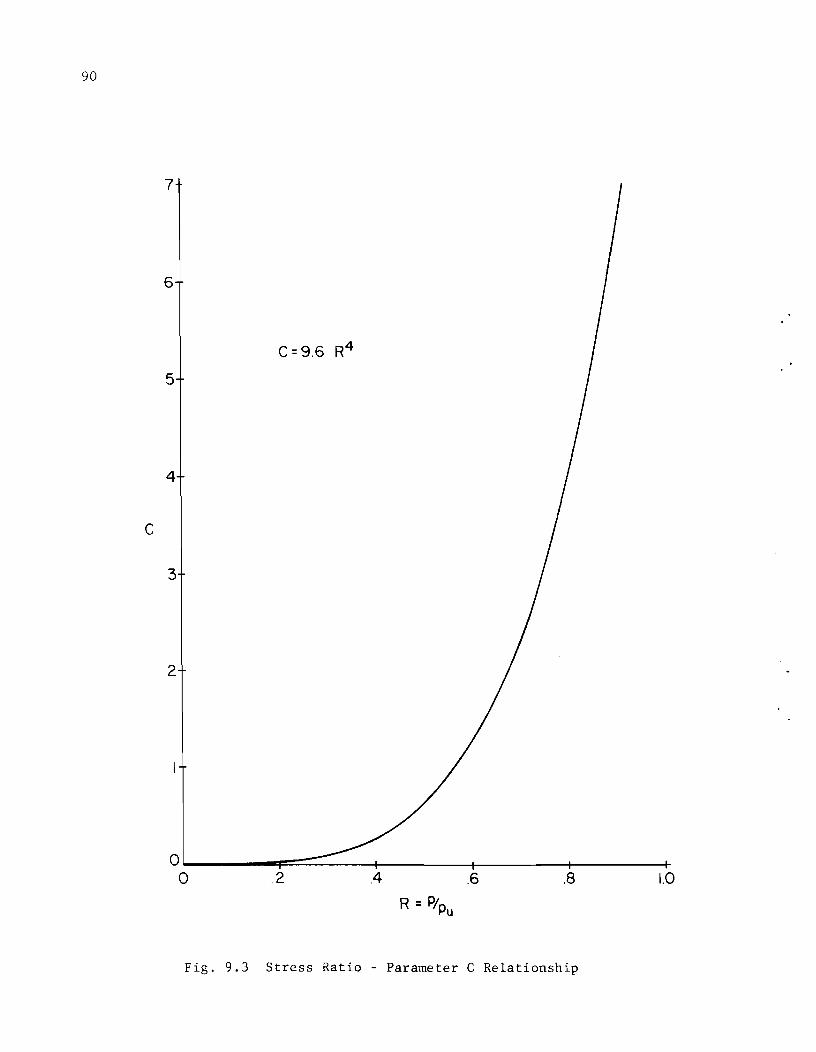
90
7
6
C=9.6 R4
5
4
C
3
2
O~------~~--~~----~r-----~-------+ o .2 .4 .6 .8 1.0
Fig. 9.3 Stress Ratio - Parameter C Relationship

which shows an increase of 60 percent over the initial cyc Ie deflectioll for
10 repetitions of load.
The correlations made in this chapter are based upon 20 cycles of
loading in the field test with a maximum stress ratio of slightly less
than 60 percent, and 10 cycles of loading in the laboratory tests with a
fairly wide range of values of stress ratio. Although these correlations
are believed to be valid for the test conditions, caution should be used
in extrapolating the results, especially to higher stress ratios.
Verification of Proposed Criteria
To verify the criteria proposed for determining the response of the
foundation system to repetitive loading, the criteria were applied to the
test shaft and the computed values of moment and deflection were compared
to the measured values. Table 9.1 shows a comparison of maximum moments
and deflection of the shaft at the groundline for several different loads
and cycles of load application. Moment versus depth curves are compared
in Fig. 9.4 for the initial application of 10 tons, 30 tons, and 50 tons,
and for the twentieth application of 50 tons.
The greatest difference in computed and measured moments occurs for
the 30-ton loadings and illustrates the difficulty in determining the
flexural stiffness during the transition from an uncracked section to a
cracked section. The overall agreement between measured and computed
values is reasonably good.
A detailed procedure for the application of the proposed criteria is
given in Chapter X. Computer program LLP, developed by Awoshika and Reese
(1971) was used to compute the values used for comparison with the measured
values.
91
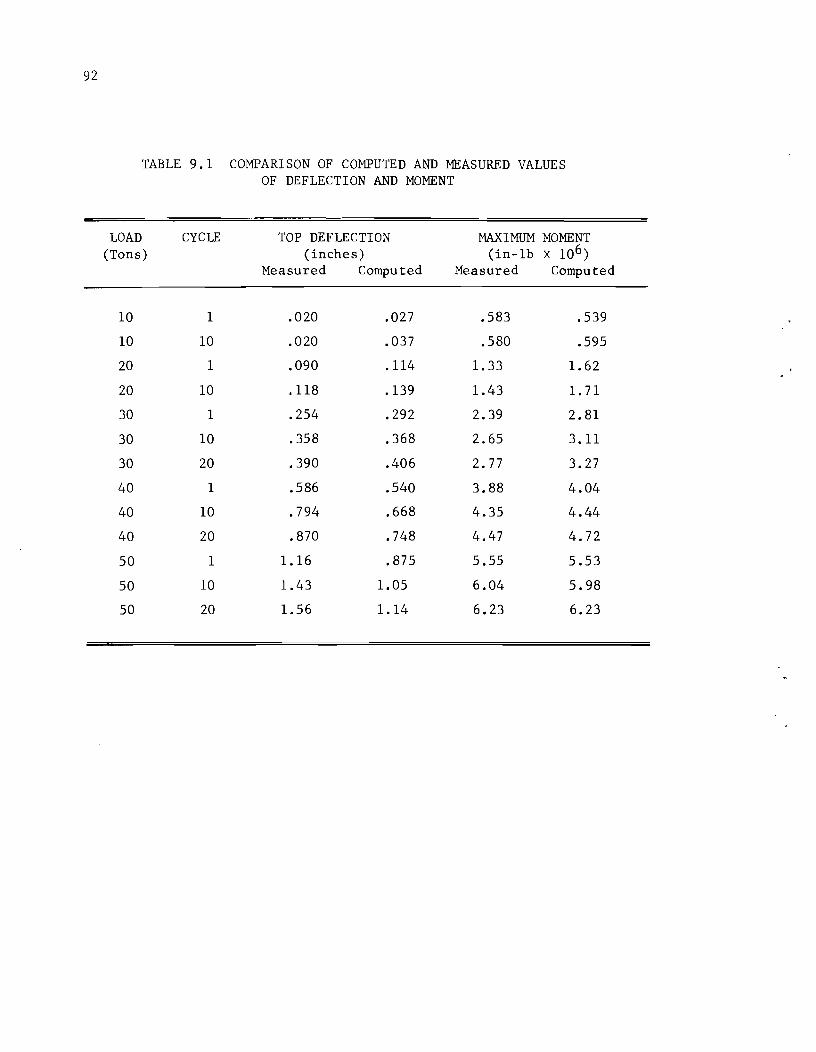
92
LOAD
TABLE 9.1 COMPARISON OF COMPUTED AND MEASURED VALUES OF DEFLECTION AND MOMENT
CYCLE TOP DEFLECTION MAXIMUM MOMENT (Tons) (inches) (in-lb X 106)
Measured Computed Measured Computed
10 1 .020 .027 .583 .539
10 10 .020 .037 .580 .595
20 1 .090 .114 1. 33 1.62
20 10 .118 .139 1.43 1.71
30 1 .254 .292 2.39 2.81
30 10 .358 .368 2.65 3.11
30 20 .390 .406 2.77 3.27
40 1 .586 .540 3.88 4.04
40 10 .794 .668 4.35 4.44
40 20 .870 .748 4.47 4.72
50 1 1.16 .875 5.55 5.53
50 10 1.43 1.05 6.04 5.98
50 20 1.56 1.14 6.23 6.23
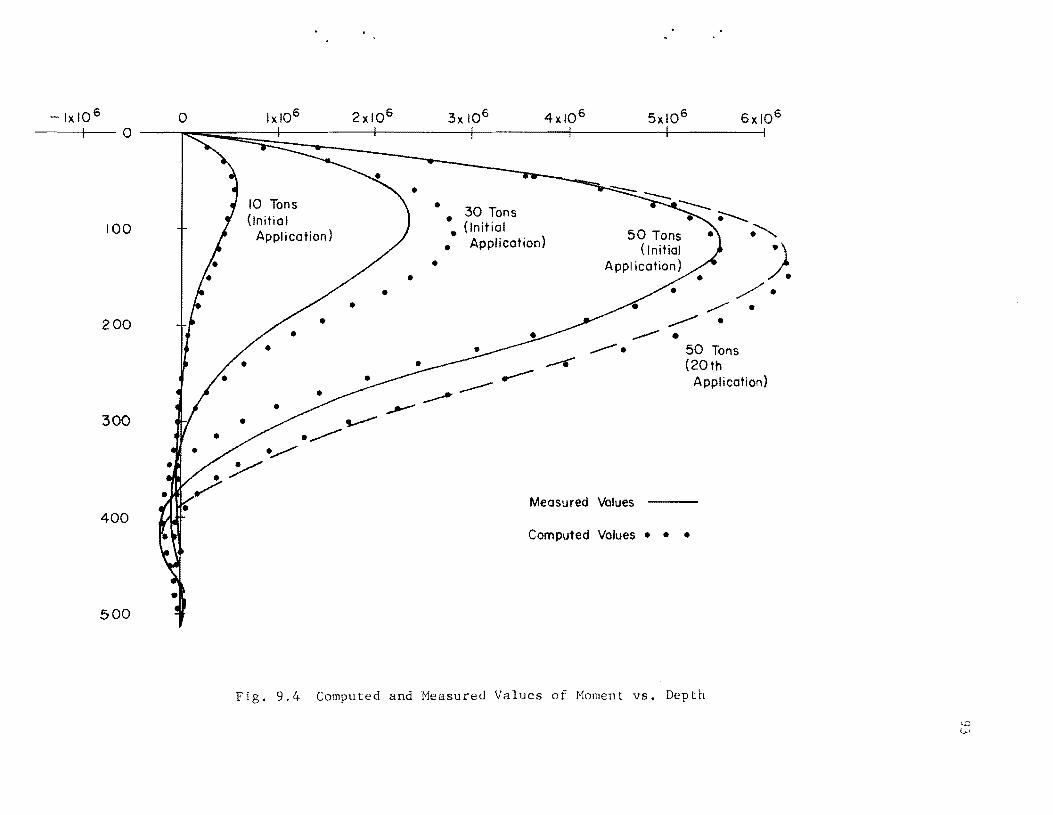
- lxl0 6 o I 0
100
200
300
400
500
10 Tons (Initial
Application)
•
•
4xl06
• 30 Tons • (Initial
• Application)
---- . ---- • 50 Tons (20th
Application)
Measured Values
Computed Values • • •
Fig. 9.4 computed and Measured Values of Moment vs. Depth
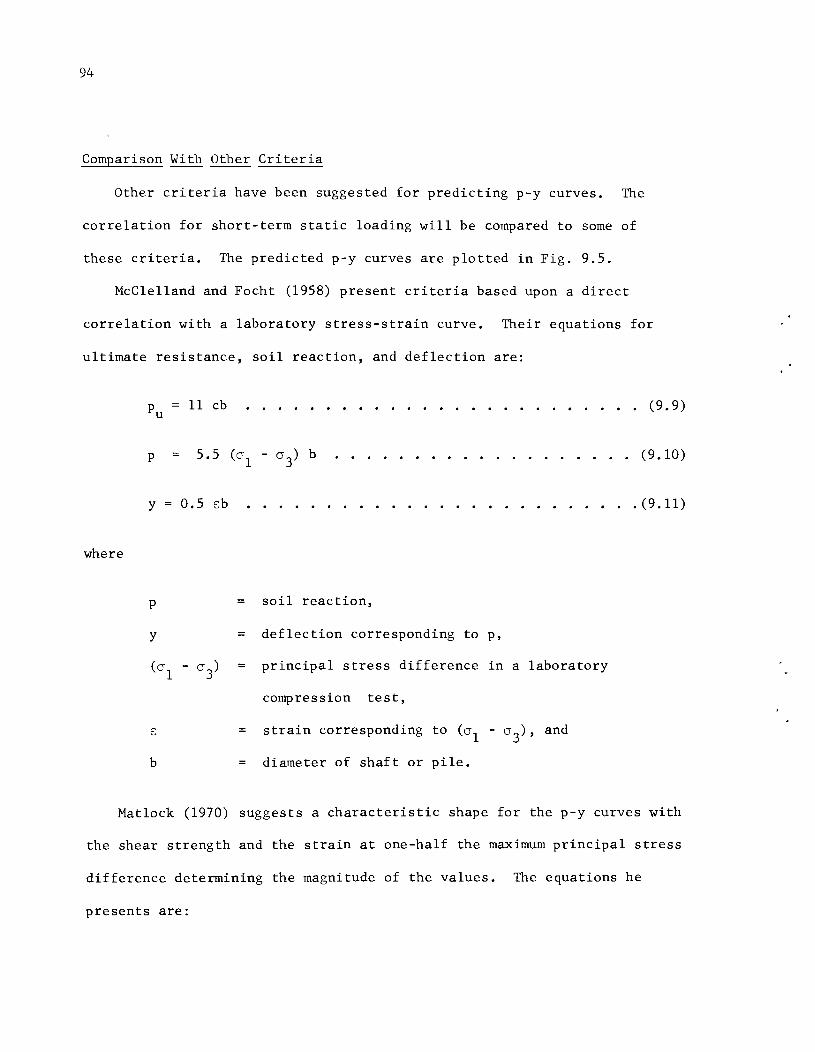
94
Comparison With Other Criteria
Other criteria have been suggested for predicting p-y curves. The
correlation for short-term static loading will be compared to some of
these criteria. The predicted p-y curves are plotted in Fig. 9.5.
McClelland and Focht (1958) present criteria based upon a direct
correlation with a laboratory stress-strain curve. Their equations for
ultimate resistance, soil reaction, and deflection are:
where
Pu 11 cb .....•......•.......•..•. (9.9)
p 5.5 (01 - 03) b .....•..•...•...... (9.10)
y 0.5 E:b •...•.........•.....•••.. (9.11)
p soil reaction,
y = deflection corresponding to p,
(01 - 03) = principal stress difference in a laboratory
compression test,
b
strain corresponding to (01 - 03)' and
diameter of shaft or pile.
Matlock (1970) suggests a characteristic shape for the p-y curves with
the shear strength and the strain at one-half the maximum principal stress
difference determining the magnitude of the values. The equations he
presents are:
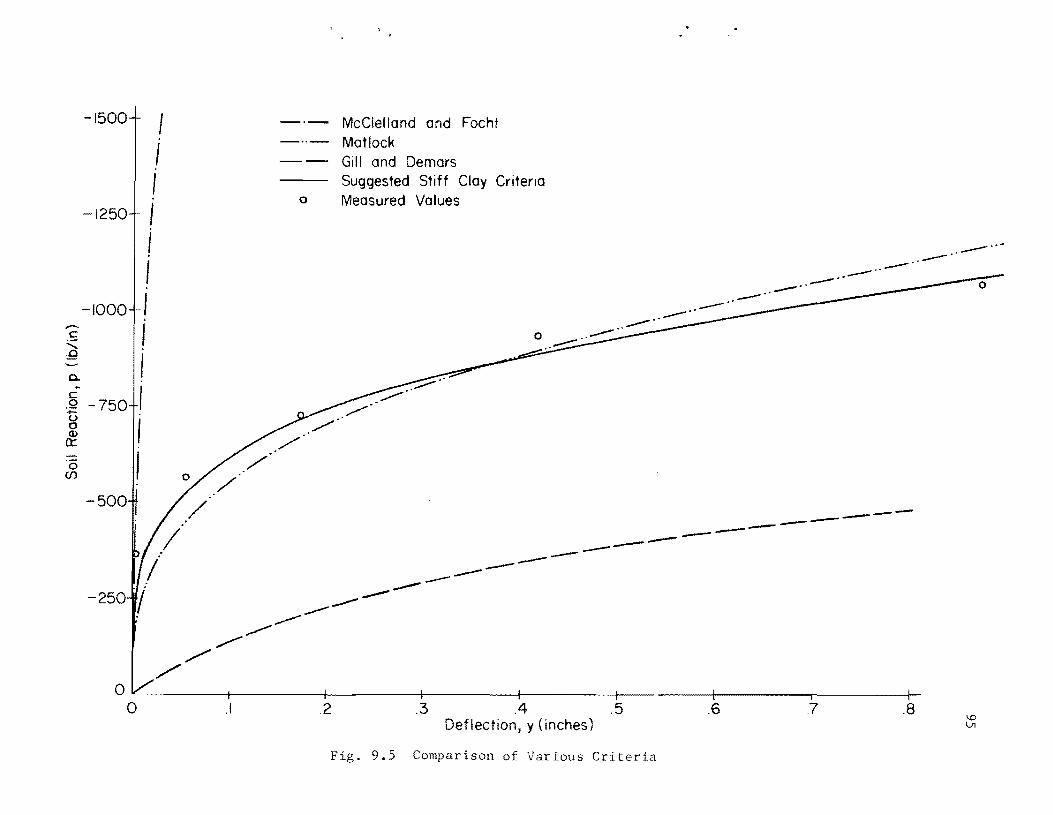
,..... c
:..::::: ..0
0.. ~
c .Q -u 0 Q)
a:
'0 (f)
-1500
1250
-1000
750
-500
-250
I I I I ! I I I I I I I
I
/ .1
I
/"" ./
~
o
McClelland and Focht Matlock Gill and Demars Suggested Stiff Clay Criteria Measured Values
o .. --- .. .. --- ---.. --
--... -- .. -- .. -- .. -- .. __ ., 0
.. --.. --..
---------------........... --~~
---------- --------
O~------_+--------~--------+_------~~------_+--------~--------+_--------r o .1 .2 .3 .4 .5 .6 .7 .8
Deflection, y (inches)
Fig. 9.5 Comparison of Various Criteria
96
13 + ~ x + o.s xl cb b ................ (9.12)
L c ,
Yso 2.S E:SOb ..............•........ (9.13)
1 L r 1- l 3 ==O.S! ...................•• (9.14) Pu YSO
Gill and Demars (1970) present equations describing a hyberbolic
relationship between p and y. The equations for cohesive soil are:
where
Pu 0.2S C'b) b .......•.•.••......•• (9.1S)
E .
y p
S1 lOOc
1 +1-E. Pu S1
......................... (9.16)
..........•..........•.. (9.17)
E. the slope of the p-y curve at the origin. S1
The soil properties used in calculating the curves shown in Fig. 9.S are
given below.
Unit weight , Y 11 0 1 b s / cu . ft.
Shear strength, c == 2200 Ibs/sq. ft.
Strain at one-half the maximum principal stress difference, E:SO
o.OOS in/in.

It was assumed that the laboratory stress strain curve could be represented
by the equation:
(° 1 - °3 )
( 0 - ° ) 1 3 max
1 r E: l 2 0.5 ................ (8.1)
The width of the shaft used in the calculations was 30 inches. A depth of
37.5 inches was used and, for comparison, the measured values of p and y
are shown on the plot.
97

!!!!!!!!!!!!!!!!!!!"#$%!&'()!*)&+',)%!'-!$-.)-.$/-'++0!1+'-2!&'()!$-!.#)!/*$($-'+3!
44!5"6!7$1*'*0!8$($.$9'.$/-!")':!

..
CHAPTER X
PROCEDURES FOR PREDICTING SOIL RESPONSE
In this chapter, detailed procedures will be presented for predicting
p-y curves for soft clay, stiff clay, and sand. These methods are believed
to be the best now available, representing the current state-of-the-art.
Soft Clay-Short-Term Static Loads
Matlock's (1970) criteria are believed to be the best available for soft
clays. For short-term static loading, the step-by-step procedure for
calculating p-y curves is given below.
1. Obtain the best possible estimate of the variation of shear
strength and effective unit weight with depth, and the value
of E:SO
' the strain corresponding to one-half the maximum
principal stress difference (the principal stress difference
is sometimes called the deviator stress). If no values of
sso are available, typical values suggested by Skempton (1951)
are given below.
Consistency of Clay 1':50 E/c
Soft 0.020 50
Medium 0.010 100
Stiff 0.005 200
2. Calculate the ultimate soil resistance per unit length of
shaft, p ,using the smaller of the values given by the u
equations below.
99
100
r3 + ~ x + 0.5 xl cb L c b.
.................. (10.1)
Pu 9cb .......................... (10.2)
where
Y average effective unit weight from ground surface to
p-y curve,
x depth from ground surface to p-y curve,
c average shear strength from ground surface to depth x,
b width of shaft.
3. Calculate the deflection, ySO' at one-half the ultimate soil
resistance from the following equation:
Yso 2.5 sso b ....................... (10.3)
4. Points describing the p-y curve are now calculated from the
relationship below.
1
0.5 ( L.--) 3 ..•.................•. (10.4) YSO
The effect of cyclic loading as presented by Matlock (1970) will be
described in this section since the criteria developed in this study for
stiff clays have not been verified for soft clays.
•
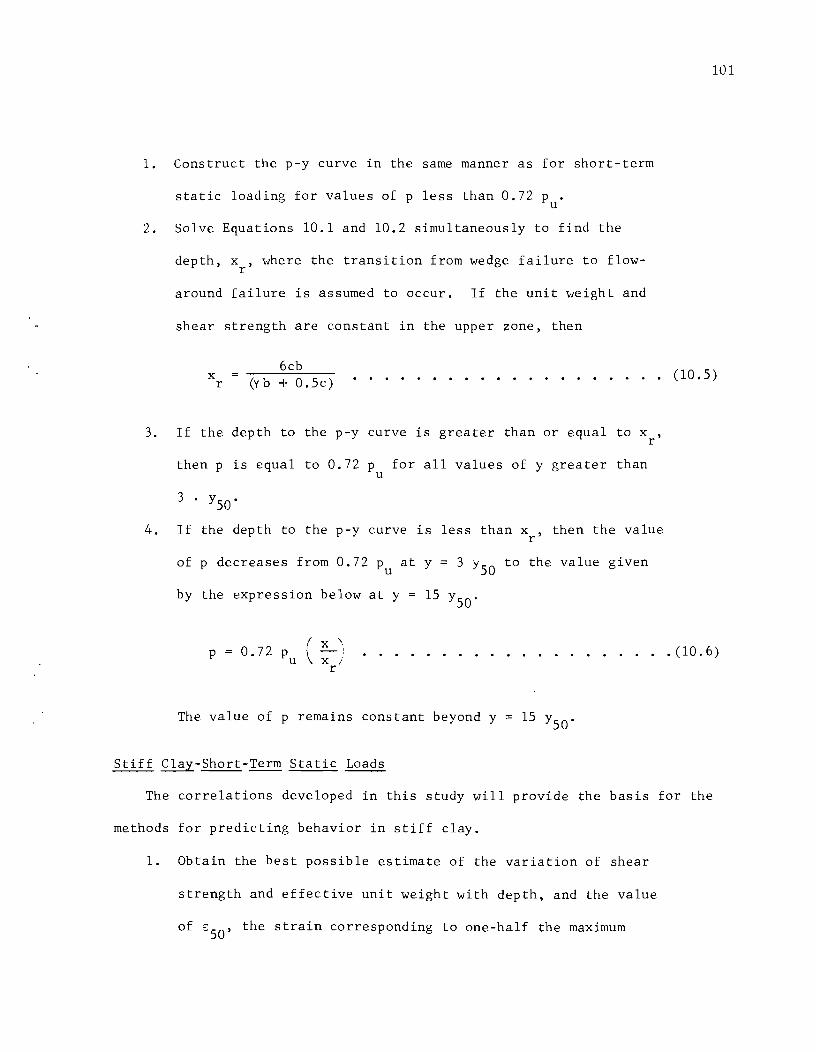
1. Construct the p-y curve in the same manner as for short-term
static loading for values of p less than 0.72 p . u
2. Solve Equations 10.1 and 10.2 simultaneously to find the
depth, x , where the transition from wedge failure to flowr
around failure is assumed to occur. If the unit weight and
shear strength are constant in the upper zone, then
101
x r
6cb (y b + O. sc)
.....•...•.........• (10.5)
3. If the depth to the p-y curve is greater than or equal to x , r
then p is equal to 0.72 Pu for all values of y greater than
4. If the depth to the p-y curve is less than x , then the value r
of p decreases from 0.72 Pu at Y = 3 yso to the value given
by the expression below at y
p 0.72 Pu ( x \, -i
x / r
.••......•.........• (10.6)
The value of p remains constant beyond y = 15 YsO'
Stiff Clay-Short-Term Static Loads
The correlations developed in this study will provide the basis for the
methods for predicting behavior in stiff clay.
1. Obtain the best possible estimate of the variation of shear
strength and effective unit weight with depth, and the value
of (50' the strain corresponding to one-half the maximum

102
principal stress difference. If no value of (50 is available,
use a value of 0.005 or 0.010, the larger value being more
conservative.
2. Calculate the ultimate soil resistance per unit length of
shaft, p , using the smaller of the values given by the u
equations below.
r 3 + ~ x + °b· 5 xl c b • • • • • • • • • • • • • • • (10. 1) c
P 9 c b •••. • • • • • • • • • . . • . • • • . • • (10.2) u
where
Y average effective unit weight from ground surface to
p-y curve,
c average shear strength from ground surface to depth x,
b = width of shaft.
3. Calculate the deflection, Y50' at one-half the ultimate soil
resistance from the following equation .
. . . . . • • . . . . (10.3)
4. Points describing the p-y curve are now calculated from the
relationship below.
1
0.5 ( L- ) 4 . . . . . . . . • • . . . . . . • . . (10.7) Y50

10:3
S. Beyond y 16 ySO' p is equal to Pu for all values of y.
~~~ Clay-Cyclic Loads
The effect of repeated loading is predicted by the following procedure.
1. Determine the p-y curve for short-term static load by the
procedure previsouly given.
2. Determine the number of times the design lateral load will
be applied to the shaft.
3. For several values of pip obtain the value of C, the paramu
eter describing the effect of repeated loading on deformation,
from a relationship developed by laboratory test, or in the
absence of tests, from Fig. 9.3.
4. At the values of p corresponding to the values of pip u
selected in Step 3, calculate new values of y for cyclic
loading from the following equation.
Yc Ys + yso . C • log N •.•.•..••••••••. (10.8)
where
Yc deflection under N cycles of load,
Ys = deflection under short-term static load,
Y50 = deflection under short-term static load at one-half
the ultimate resistance,
N = number of cycles of load application.
5. The p-y curve defines the soil response after N cycles of load. c

104
Sand-Short-Term Static Loads
The criteria for sand presented by Parker and Reese (1970) are the
most current. Their procedure is given below.
1. Obtain the best possible estimate of the variation of effective
unit weight and angle of internal friction with depth. If
compression tests are performed, determine Young's modulus.
2. Calculate the values of the earth pressure coefficients from
the following equations.
2 tan (45 0
- 6/2) .................. (10.9)
2 tan (45 0 + 0/2) ...••....•...•... (10.10)
KO 0.5 (for dense or medium sand)
0.4 (for loose sand)
where
KA active earth pressure coefficient,
Kp passive earth pressure coefficient,
KO earth pressure coefficient at rest,
o angle of internal friction.
3. Determine the ultimate soil resistance by the two equations below.
Use the smaller value.
r Pu = y X ! b (Kp - KA) + xKp (tarotan[3)
1 + xKotan [3 (tandJ - taro) i ••••••••••••••• (10.11)
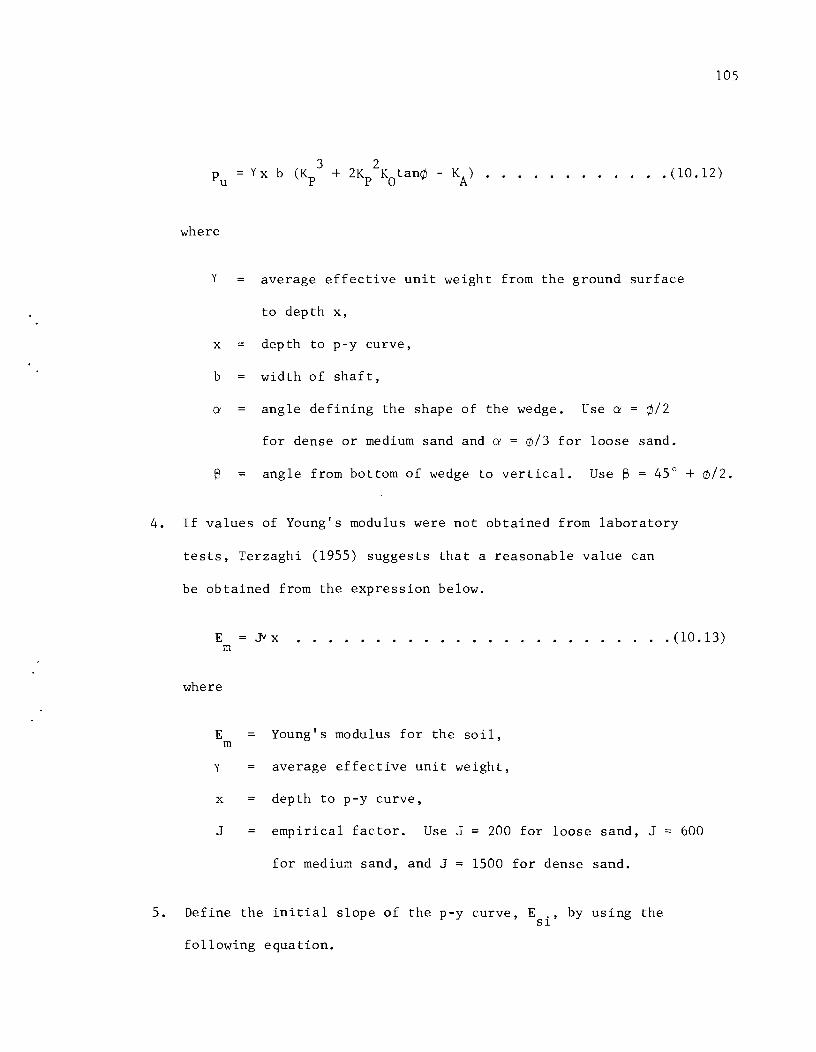
105
3 2 Pu Yx b (~ + 2Kp Kotan¢ - KA) •.........•. (10.12)
where
Y average effective unit weight from the ground surface
to depth x,
x depth to p-y curve,
b width of shaft,
a angle defining the shape of the wedge. Use a = ¢/2
for dense or medium sand and a = 6/3 for loose sand.
S angle from bottom of wedge to vertical. Use S = 45° + 6/2.
4. If values of Young's modulus were not obtained from laboratory
5.
tests, Terzaghi (1955) suggests that a reasonable value can
be obtained from the expression below.
E Jyx ........................ (10.13) m
where
E = Young's modulus for the soil, m
Y average effective unit weight,
x depth to p-y curve,
J empirical factor. Use J = 200 for loose sand, J
for medium sand, and J 1500 for dense sand.
Define the initial slope of the p-y curve, E ., by using the Sl
following equation.
600

106
E si
E m
1.35 ..................•...• (10.14)
6. Determine p and y values defining the curve from the hyperbolic
relationship below.
p
(E SiY) P tanh .....•.•.......•.•. 00.15)
u Pu
Sand-Cyclic Loads
No criteria are available for predicting the response of sand to
repeated loading. According to Davisson and Salley (1968), cyclic loading
causes deflections to double and bending moments to increase 20 to 50
percent, approximately, compared to the values for the first cycle of load.
CHAPTER XI
CONCLUSIONS AND RECOMMENDATIONS
The conclusions reached during this study are presented in this chapter.
Recommendations are given for adding to the information developed by the
field and laboratory tests described in previous chapters.
Conclusions
1. The soil response to short-term static loading and repeated
loading was successfully measured. Bending strains in the
shaft were measured by the strain gages mounted on the
embedded instrument column and load, deflection, and top
slope were measured by transducers and other measuring
devices at the ground surface. Calibration tests furnished
data to convert bending strains into bending moments. A
seventh-order polynomial fitted to the observed moment
versus depth data by least squares satisfactorily describes
the measured values. Integration and differentiation of the
fitted polynomial, using known boundary conditions, yield
values of soil reaction and deflection. The soil reaction
deflection relationships or p-y curves describe the soil
response.
2. A correlation was observed between field and laboratory
test results for both short-term static loading and for
repeated loading. For short-term static loading, the
deflection of the shaft was found to be proportional to
107
108
the square of the strain in a laboratory compression test
when the ratio of applied stress to ultimate stress was the
same for both field and laboratory test. It was found that
the effect of repeated loading on deflection can be described
by a soil parameter determined by repetitive loading in a
laboratory compression test. The increase in deflection under
repeated applications of a constant load was proportional to
the logarithm of the number of load applications in both
field and laboratory tests.
3. A procedure was developed to predict the response of stiff
clay to short-term static loading and repeated loading.
For short-term loading, stress-strain properties of the soil
are determined by a laboratory compression test and are
applied to field conditions by means of the correlations
developed in this study. To determine the effect of
repeated loading, the repeated loading soil parameter is
determined by a series of repeated loading compression
tests at various stress levels. This parameter, along with
the predicted response under short-term static loading may
be used to predict the soil response for any desired number
of applications of load. Details of these procedures for
predicting p-y curves along with a state-of-the-art presen
tation of procedures for other soil types are given in
Chapter X.
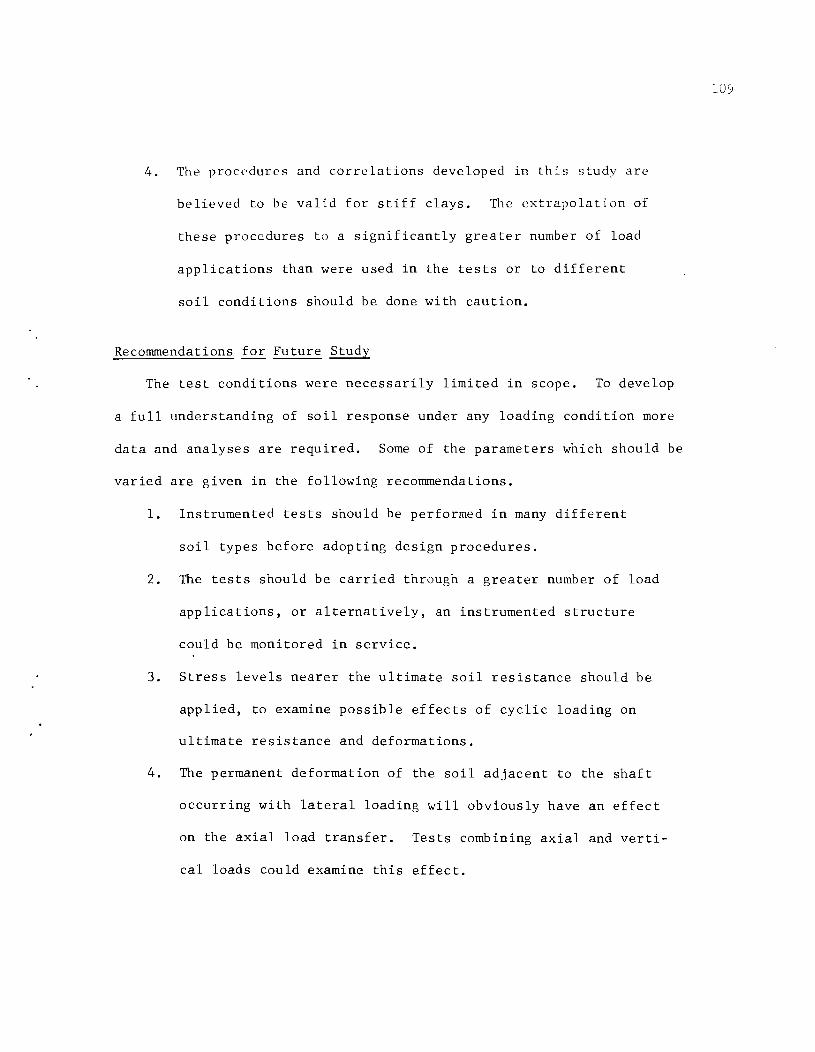
4. The procpdures and correlations developed in this study arc
believed to be valid for stiff clays. TI1C extrapolation of
these procedures to a significantly greater number of load
applications than were used in the tests or to different
soil conditions should be done with caution.
Recommendations for Future Study
The test conditions were necessarily limited in scope. To develop
a full understanding of soil response under any loading condition more
data and analyses are required. Some of the parameters which should be
varied are given in the following recommendations.
1. Instrumented tests should be performed in many different
soil types before adopting design procedures.
2. The tests should be carried through a greater number of load
applications, or alternatively, an instrumented structure
could be monitored in service.
3. Stress levels nearer the ultimate soil resistance should be
applied, to examine possible effects of cyclic loading on
ultimate resistance and deformations.
4. The permanent deformation of the soil adjacent to the shaft
occurring with lateral loading will obviously have an effect
on the axial load transfer. Tests combining axial and verti
cal loads could examine this effect.

!!!!!!!!!!!!!!!!!!!"#$%!&'()!*)&+',)%!'-!$-.)-.$/-'++0!1+'-2!&'()!$-!.#)!/*$($-'+3!
44!5"6!7$1*'*0!8$($.$9'.$/-!")':!

REFERENCES
Alizadeh, M. (1968), "Lateral Load Tests on Instrumented Timber Piles," Special Technical Publication 444, &~erican Society for Testing and Materials, 1968, pp. 379-384.
Alizadeh, M. and M. T. Davisson (1970), "Lateral Load Tests on Piles -Arkansas River Project," Journal of the Soil Mechanics and Foundations Division, American Society of Civil Engineers, September, 1970, pp. 1583-1627 •
Biot, M. A. (1937), "Bending of an Infinite Beam on an Elastic Foundation," Journal of Applied Mechanics, American Society of Mechanical Engineers, Vol. 59, 1937, pp. Al-A7.
Bowman, Elliott R. (1958), "Investigation of the Lateral Resistance to Movement of a Plate in Cohesionless Soil," Thesis submitted to The University of Texas at Austin, 1985.
Coyle, H. M. and Lymon C. Reese (1966), "Load Transfer for Axially Loaded Piles in Clay," Journal of the Soil Mechanics and Foundations Division, American Society of Civil Engineers, November, 1967, pp. 261.
Cunnnings, A. E. (1937), "Discussion of Lateral Pile Loading Tests," Transactions, American Society of Civil Engineers, Vol. 63, No.8, Part 2, 1937, pp. 255-264.
Davisson, M. T. (1960), "Behavior of Flexible Vertical Piles Subjected to Moment, Shear and Axial Load," Ph.D. Thesis, University of Illinois, Urbana, Illinois, 1960.
Davisson, M. T. and J. R. Salley (1968), "Lateral Load Tests on Drilled Piers," Special Technical Publication 444, American Society for Testing and Materials, 1968, pp. 68-84.
Feagin, L. B. (1937), "Lateral Pile Loading Tests," Transactions, American Society of Civil Engineers, Vol. 63, No.8, Part 2, 1937, pp. 236-254.
Focht, John A. and Bramlette McClelland (1955), "Analysis of Laterally Loaded Piles by Difference Equation Solution," The Texas Engineer, Texas Section, American Society of Civil Engineers, September, October, November, 1955.
Gill, H. L. and K. R. Demars (1970), "Displacement of Laterally Loaded Structures in Nonlinearly Responsive Soil," Technical Report R670, Naval Civil Engineering Laboratory, Port Hueneme, California, 1970.
GIeser, Sol M. (1953), "Lateral Load Tests on Vertical Fixed-Head and Free-Head Piles," Special Technical Publication 154, American Society for Testing and Materials, 1953, pp. 75. ---
III
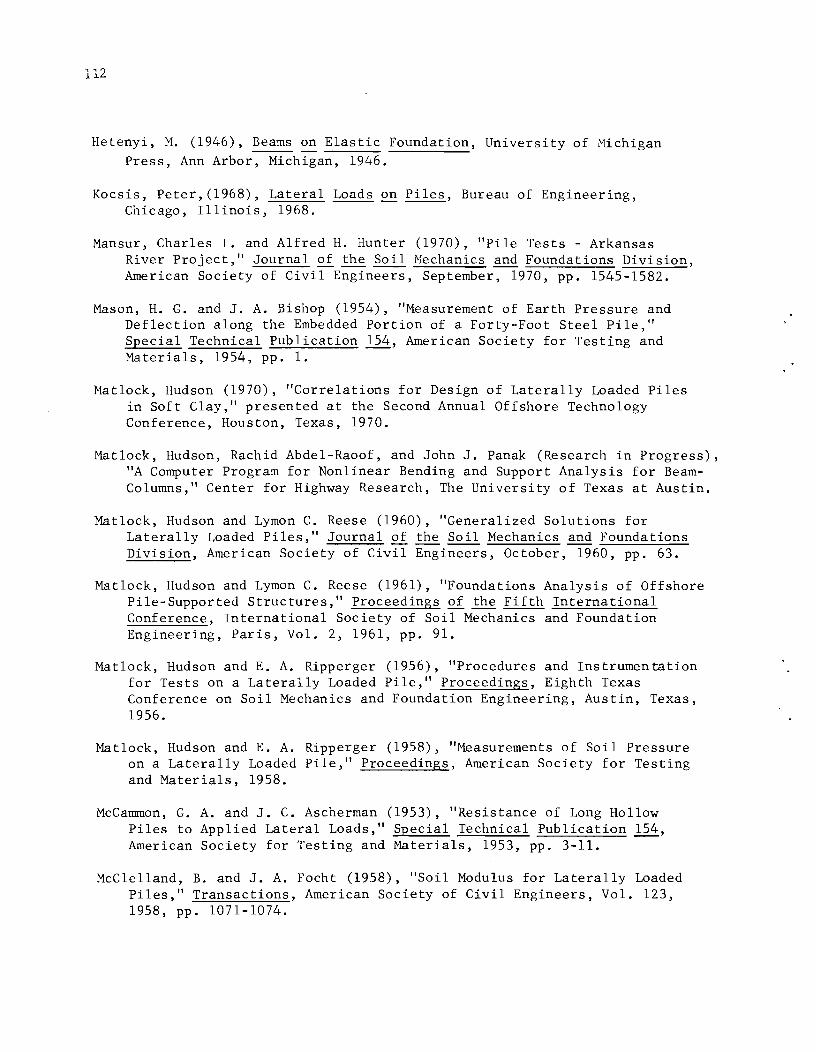
112
Hetenyi, M. (1946), Beams on Elastic Foundation, University of Michigan Press, Ann Arbor, Michigan, 1946.
Kocsis, Peter,(1968), Lateral Loads on Piles, Bureau of Engineering, Chicago, Illinois, 1968.
Mansur, Charles 1. and Alfred H. Hunter (1970), "Pile Tests - Arkansas River Project," Journal of the Soil Mechanics and Foundations Division, American Society of Civil Engineers, September, 1970, pp. 1545-1582.
Mason, H. G. and J. A. Bishop (1954), "Measurement of Earth Pressure and Deflection along the Embedded Portion of a Forty-Foot Steel Pile," Special Technical Publication 154, American Society for Testing and Materials, 1954, pp. 1.
Matlock, Hudson (1970), "Correlations for Design of Laterally Loaded Piles in Soft Clay," presented at the Second Annual Offshore Technology Conference, Houston, Texas, 1970.
Matlock, Hudson, Rachid Abdel-Raoof, and John J. Panak (Research in Progress), "A Computer Program for Nonlinear Bending and Support Analysis for BeamColumns," Center for Highway Research, The University of Texas at Austin.
Matlock, Hudson and Lymon C. Reese (1960), "Generalized Solutions for Laterally Loaded Piles," Journal of the Soil Mechanics and Foundations Division, American Society of Civil Engineers, October, 1960, pp. 63.
Matlock, Hudson and Lymon C. Reese (1961), "Foundations Analysis of Offshore Pile-Supported Structures," Proceedings of the Fifth International Conference, International Society of Soil Mechanics and Foundation Engineering, Paris, Vol. 2, 1961, pp. 91.
Matlock, Hudson and E. A. Ripperger (1956), "Procedures and Instrumen tation for Tests on a Laterally Loaded Pile," Proceedings, Eighth Texas Conference on Soil Mechanics and Foundation Engineering, Austin, Texas, 1956.
Matlock, Hudson and E. A. Ripperger (1958), "Measurements of Soil Pressure on a Laterally Loaded Pile," Proceedings, American Society for Testing and Materials, 1958.
McCammon, G. A. and J. C. Ascherman (1953), "Resistance of Long Hollow Piles to Applied Lateral Loads," Special Technical Publication 154, American Society for Testing and Materials, 1953, pp. 3-11.
McClelland, B. and J. A. Focht (1958), "Soil Modulus for Laterally Loaded Piles," Transactions, American Society of Civil Engineers, Vol. 123, 1958, pp. 1071-1074.

113
(1956), "Thrust Loading on Piles," Journal Foundations Division, American Society of .;;e.C-=-:...= =~:.:.;;.;;....;;;..;;..;::..
O!Neill, Michael W. and Lymon C. Reese (1971), "Behavior of Axially Loaded Drilled Shafts in Beaumont Clay," Research Report 89-8, Center for Highway Research, The University of Texas at Austin.
Osterberg, J. O. (1958), "Lateral Stability of Poles Embedded in a Clay Soil," Northwestern University Project 208, Bell Telephone Laboratories, Evanston, Illinois, December, 1958.
Palmer, L. A. and P. P. Brown (1954), "Piles Subjected to Lateral 'i'hrllst," Special Technical Publication 154 American Society for Testing and r-laterials, 1954, pp. 22-31.
Parker, Frazier Jr. and Studies of Behavior
C. Reese (1971), "Experimental and Analytical Piles in Sand Under Lateral and Axial
Loading, II -£, Center for High",ay Research, The University of Texas at Austin, 1971.
Reese, Lymon C. (1958), Discussion of "Soil Modulus for Laterally Loaded Piles,'! by McClelland and Focht, Transactions, American Society of Civil , Vol. 123, 1958, pp. 1071.
Reese, Lymon C. (1962), "Ultimate Resistance Against a Rigid Cylinder Moving Laterally in a Cohesionless Soil," Journal, Society of Petroleum Engineers, December, 1962, pp. 355.
Reese, Lymon C. and William R. of Tests of Uninstrumented Technical Publication 444 1969, pp. 160.
Cox (1969), "Soil Behavior from Analysis Piles Under Lateral Loading," Special American Society for Testing and Materials,
Reese, Lymon C. and Hudson Matlock (1956), "Non-Dimensional Solutions for Laterally Loaded Piles with Soil Modulus Assumed Proportional to Depth," Proceedings, Eighth Texas Conference on Soil Mechanics and Foundation Engineering, Austin, Texas, 1956.
Reese, Lymon C. and Hudson Matlock (1960), "Numerical Analysis of Laterally Loaded Piles," Second Structural Division Conference on Electronic Computation, American Society of Civil Engineers, Pittsburg, Pennsylvania, 1960, pp. 657.
Skempton, A. w. (1951), liThe Bearing Capacity of Clays," Building Research Congress, Division I, London, 1951.
Teng, Wayne C. (1962), Foundation Design, Prentice Hall, Englewood Cliffs, New Jersey, 1962.

114
Terzaghi, Karl (1955), "Evaluation of Coef ficient of Subgrade Reaction," Ceotechnigue, Vol. 5 No.4, December, 1955, pp. 297.
Vesic, Aleksander S. (1961), "Bending of Beams Resting on Isotropic Elastic Solid," Journal of the Engineering Mechanics Division, American Society of Civil Engineers, 1961.
Winkler, E. (1867), Die Lehre ~ Elastizitat und Festigkeit (On Elasticity and Fixity), Prague, 1967.

APPENDIX

!!!!!!!!!!!!!!!!!!!"#$%!&'()!*)&+',)%!'-!$-.)-.$/-'++0!1+'-2!&'()!$-!.#)!/*$($-'+3!
44!5"6!7$1*'*0!8$($.$9'.$/-!")':!

FIELD TEST DATA
In this appendix the significant data from the field tests are given.
Figures A.l through A.8 show the measured moment-curvature relationship.
The load deflection and strain data follow these figures.
The identification numbers for each set of data may be read as
follows. The first two digits indicate the value of the maximum load
for a series of load cycles. The second two digits represent the cycle
number. The third two digits show the value of the load when the set of
data was taken. For example, 100110 would indicate 10 ton load cycles,
first cycle, and an applied load of 10 tons.
117
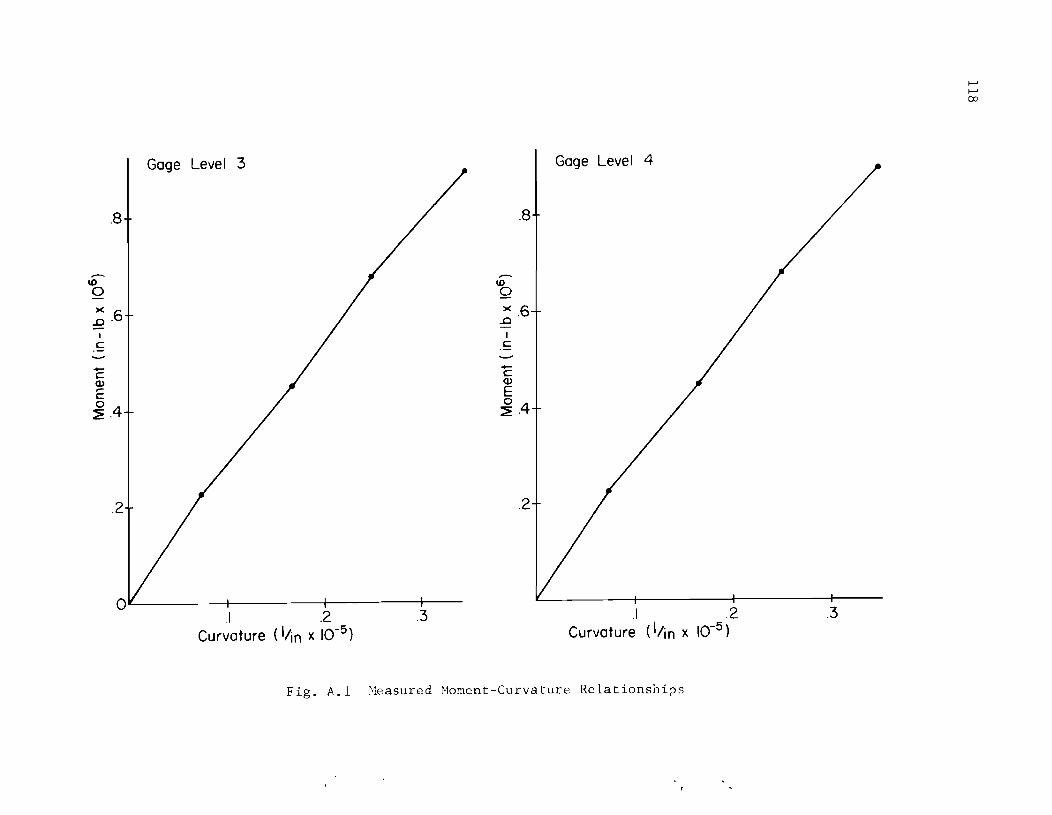
Gage Level 3 Gage Level 4
.8
,-- ,--10 10 0 0
~ .6 )( .6 ..Q
I I C C
- -c c Q) Q) ,.... E c 0 0 ~.4 ~.4
.2 .2
.3 .1 .2 Curvature (!;in x ]0-5 )
.1 .2 Curvature (I/in x 10-5 )
.3
Fig. A.l Heasured Moment-Curvature Relationships
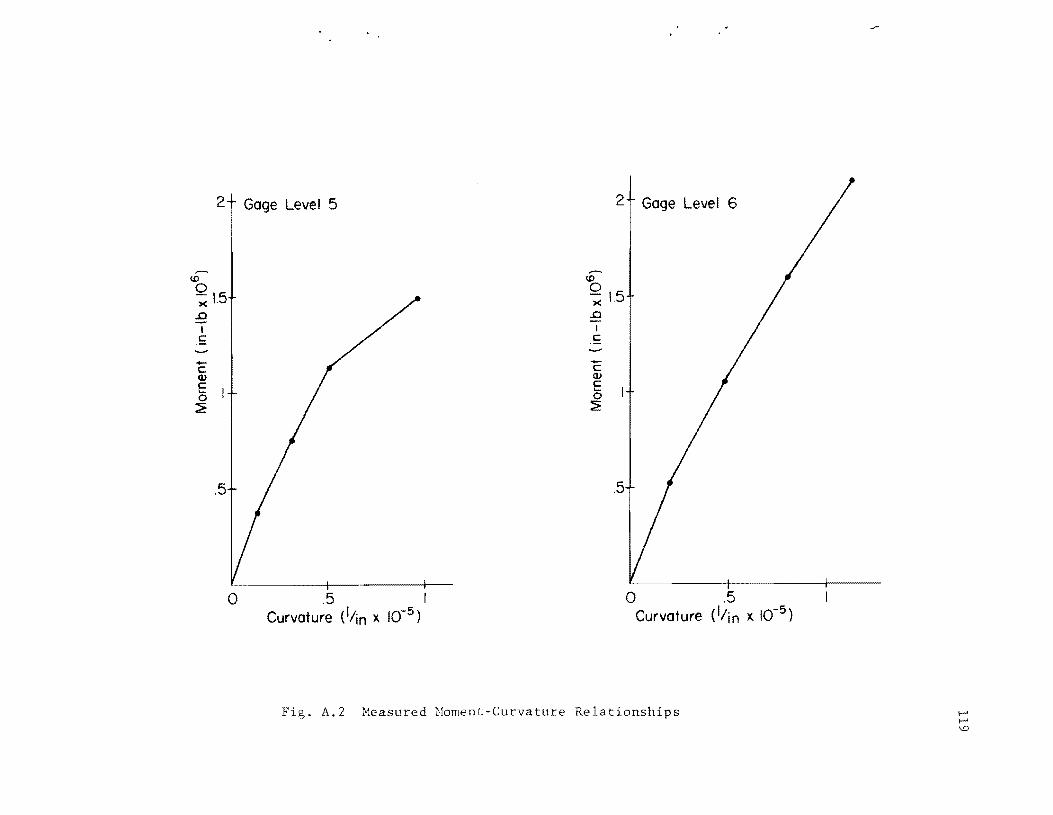
2 Gage Level 5 2 Gage Level 6
..- -<D <D 0 0 -; 1.5 -; 1.5 .0 .0
I I C C
-- --c c cv cv E E 0 0 ~ ~
.5 .5
o .5 1 o .5 Curvature (I/in x 10-5 ) Curvature (I/in x 10-5 )
Fig. A.2 Measured Noment-Curvature Relationships
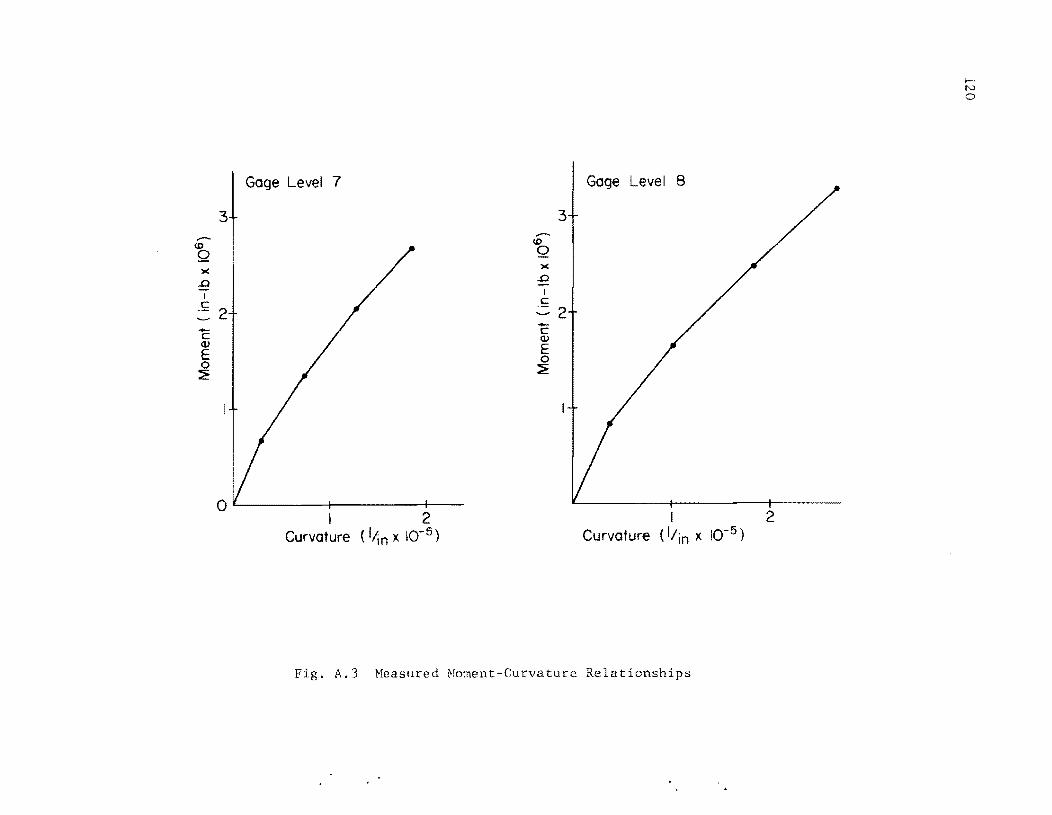
.--lD 0 )(
..0 I
.£ .. c Q)
E 0 ~
Gage Level 7
3
2
o L..-___ -j-___ --+ __
2 Curvature (Itinx 10-5 )
,..... lD 0 )(
..0 I
,£
..... c Q)
E 0 ~
Gage Level 8
3
2
I 2 Curvature (I/in x 10-5 )
Fig. A.3 Heasured Homent-Curvature Relationships
1-' N o
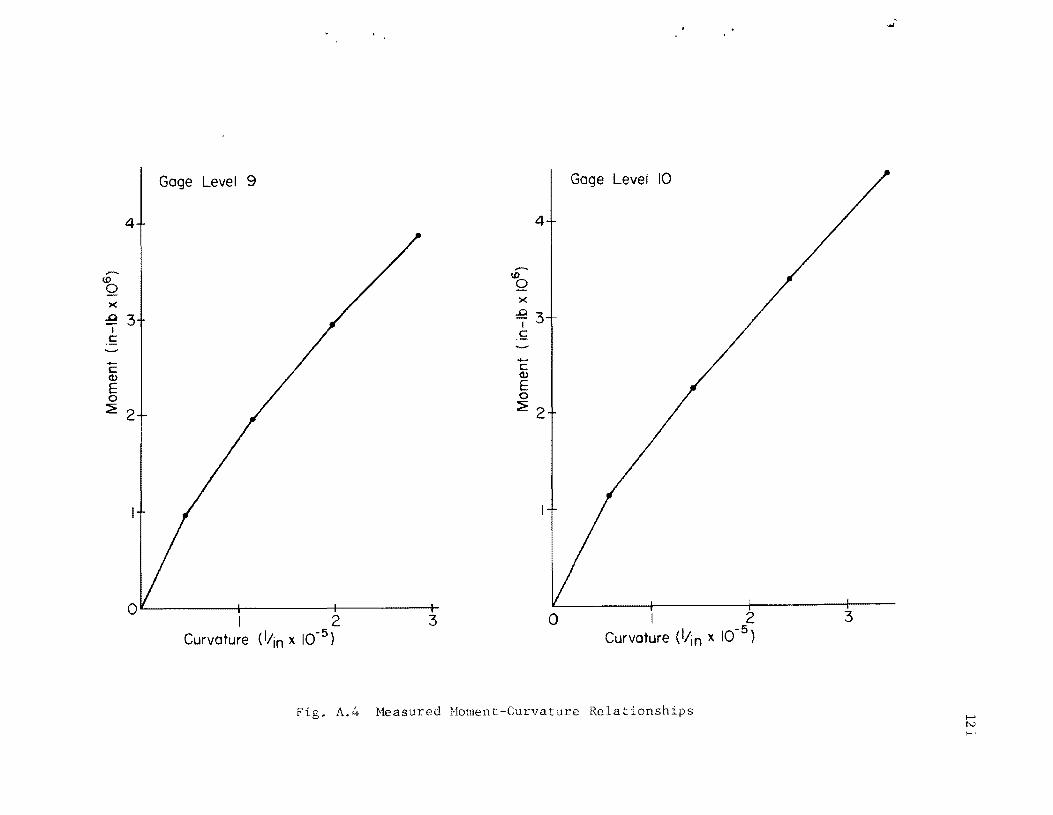
4
---1.0 0 )(
.0 I
c
-+-c <U E 0 ~ 2
Gage Level 9
2 Curvature (!;in x 10-5
)
3
4
..-1.00 )(
.03 I
.£
...... C <U E 0
~2
Gage Level 10
o I 2 I -5
Curvature (lin x 10 )
Fig. A.4 Measured Moment-Curvature Relati onships
3
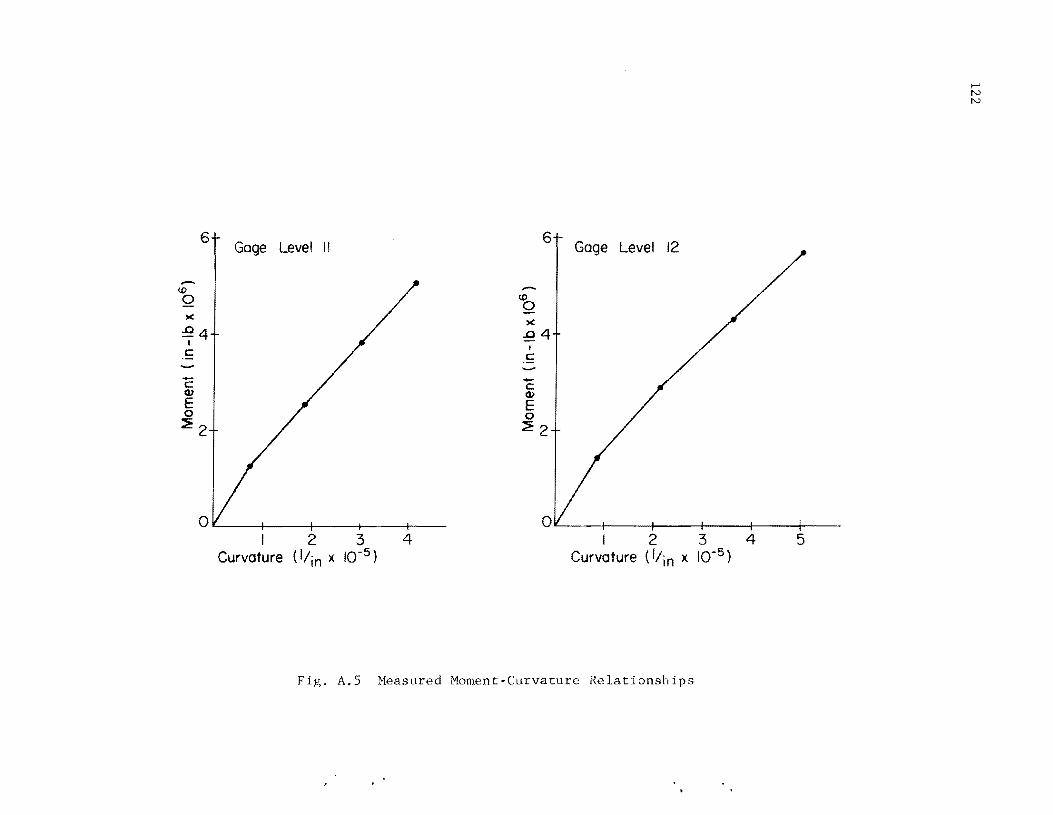
6
-<D o
..c4 t
C
...... c Q)
E o ~2
Gage Level II
o~ __ ~ ____ ~ ____ +-__ ~ __ __
2 3 Curvature (!;in x 10-5 )
4
6
-~
)(
..c4 t c
...... c Q)
E o ::?!2
Gage Level 12
OL----r----~---+----+_--_+----2 3 4 5
Curvature (!;in x 10-5 )
Fig. A.S Measured Moment-Curvature Relationships
l-' N N
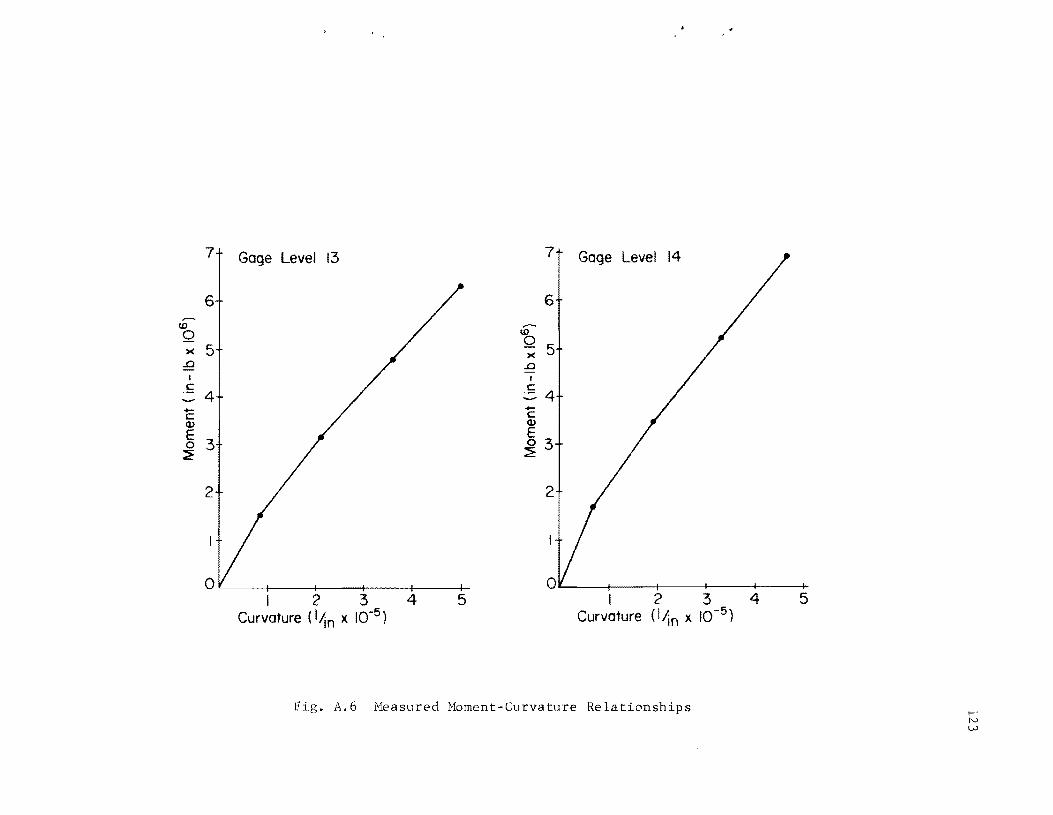
-U)
0 )(
..0 I
.5
-c Q)
E 0 ~
7 Gage Level 13
6
5
4
3
2
O'-------_�_-~I__-_I_--I__-___I_ 1 2 3 4 5
Curvature (Iljn x 10-5 )
7
6
-U)
0 )( 5
..0 r c
:..:::.4 -c Q)
E 0 3 ~
2
Gage Level 14
234 Curvature (Iljn x 10-5)
F • A.6 Measured Moment-Curvature Relationships
5

8 Gage Level 15 8 Gage Level 16
-- ~6 100 6 )(
)(
..0 I
I
c .&
-..... c c ~4 (1)4
E 0 0 ~ ~
2 2
OL---4----+----r---~--~ 2 3 4 5 I 2 3 4 5
Curvature (Yin x 10-5) Curvature (!;in x 10-5)
Fig. A.7 J'vleasured Moment-Curvature Relationships

8
-6 ~
)(
..0
"C4 (\)
E o ~
2
Gage Leve 1 17
OL---4----+----~--~--~-2 3 4 5
Curvature (llin x 10-5 )
Fig. A.S Measured Moment-Curvature Relationships

126
1 Uf:~ T I F I CAT I UN LUOlLO TI ME 1057.
I\.PtJlIED LJAO LO.44 TONS
flW DEFLECTILlN POTENJIOMJ--TER 0.019 INCHES DIAL GAGE 0.02L II\JCHES
TOP SLOPE 4 .. LOOOOE-04 KADIANS
GAGE X-DISfANCE STRAI\! RDG. M/EI LEVEL (INCHES) (MICR:JVOLTSJ ( L II ~ C HE S •
3 7.5 15 .. 2.32B42E-01 4 .22.5 93. 1.44362E-06 5 37.5 121. L.97L40E-06 {;> 52.5 155. 2.41380E-Ob 7 61.5 L69. 2.61560E-06 8 82.5 165. 2.55351E-06 9 91.5 144. 2.22753E-06
10 LL2.5 135. 2.10334E-06 11 121.5 126. L.95588E-06 L2 L42.5 106. l.b4542E-Ob L3 L51.5 60. 9.3~131E-01 L4 172.5 42. 6.59120E-01 15 L81.5 32. 4.96131E-01 L6 202.5 23. 3.64-186E-01 11 217.5 16. 2.49365E-01 18 232.5 13. 2.01191E-01 19 247.5 b. 1.00396E-:n 20 262.5 1. l.55228E-Od 21 211.5 3. 4.b5685E-08 22 292.5 -1. -1.55228E-08 23 301.5 -2. -3.1)~51E-08 24 322.5 - L. -2.32842E-08 25 331.5 -1. -2.32842E-08 26 352.5 -3. -3.8BJ11E-08 21 382.5 -2. -3.10!t51E-08 28 412.5 -3. -3.88011E-08 29 442.5 -3. -3.88J11E-08 30 472.5 1. 1.55228E-08 H 502.5 1 • 2.328 42E- 08

127
10f\HIFICl\rJON LGOlLO TI ME II )9.
APpLIED LDALl 10.49 fClNS
rop DEFLECTION purE~rIJMt:rt:R 0.019 INCHE S OIAL GAG!:: 0.020 P.JCHES
rop SLOPE 3.93333E-04 RADIANS
GAG!:: X-DISTANCE STRAI ... i(OG. 141 E I LEVEL (INCHES) (MICRQVOLTS) (l/l'4CHES)
j 7.5 12. L.94035E-07 4 22.5 92. 1.42310E-Ob S 37.5 124. 1.93259E-Oo 6 52.5 153. 2.37!t99E-06 7 67.5 Ibb. 2.5b~03E-Ob
8 82.5 Ib3. 2.5224bE-Ob 9 97.5 142. 2.21200E-Ob
to 112.5 134. 2.0S782E-Ob 11 127 •. 5 127. 1.97~lbE-Ob 12 142.5 105. 1.b2790E-Ob 13 1~7.S 63. 9.7793SE-07 14 172.5 43. b.75243E-07 15 LEn .s 31. 4.8120SE-07 Lb 202.5 24. 3.80309E-01 17 21 7. ') 11. 2. 71 ~49E-01 18 232.5 12. 1.78:'13E-07 19 241.5 5. 7.7b141E-08 20 202.5 4. b.20913E-08 21 211.5 1. 2.32B42E-08 l.2 292.5 -1. -1.55228E-08 23 307.5 -1. -1.55228E-08 24 322.5 1. 1.55228E-08 25 3.37.5 1. 2.32342E-08 2b ,152.5 O. 7.7b141E-09 27 382.5 -2. -3.10457E-08 28 411.5 -3. -4.b5~85E-OS 29 442.5 -2. -3.1)451E-08 30 412.5 -1. -2.32B42E-08 31 502.5 -1. -1.55228E-08

128
IDENTIFICATION 100310 TIME 1118.
APPLIED LUAD 10.45 TONS
lOP DEFLECflDN PO T E Nfl OME H:R 0.021 INCHES DIAL GAGE 0.021 I~CHES
TOP SLOPE: 3.33333E-04 RAOIA~S
GAGE X-DISTANCE STRAP" RDG. ",EI LEVEL (INCHES) (MICROVOLTS) 1l/I\4CHES)
3 7.5 11. 2.5b121E-Ol 4 22.~ 93. 1.44362E-06 ~ 31.5 124. 1.93259E-06 b 52. , 151. 2.34395E-06 7 61.5 165. 2.55351E-06 8 82.<5 163. 2.53198E-06 9 97.5 143. 2.21~16E-06
10 112.5 134. 2.08:l06E-06 11 127.5 128. 1.99468E-06 12 142.5 106. 1.64542E-06 13 151.5 60. 9.3~131E-Ol 14 112.5 44. 6.83004E-01 1~ 181.5 34. 5.2001SE-07 16 202.5 26. 4.03594E-Ol 17 217.5 18. 2.871l2E-Ol 18 232.5 14. 2.25J81E-07 19 241.S 8. 1.24183E-Ol 20 262.5 4. 6. 2:n 13E-08 21 211.5 1. 1.55228E-08 22 292.5 1. 1.55228E-08 23 307.5 -1. -2.32842E-08 24 322.5 -3. -5.43299E-OB 25 331.5 -4. -6.20913E-08 26 352.5 -1. -1.55228E-Oe 21 382.5 -4. -6.20~13E-08 28 412.5 -4. -6.9B527E-08 29 442.5 -3. -J.8BJ11E-08 30 472.5 -1. -2.32B42E-08 31 502.5 -2. -3.10457E-08

129
I DE"H I F [C A T ION 1U0410 TI ME 1125.
APPLIED LOAf) 10.69 TONS
rop DEFLECTlOq POTENTIOMETER 0.019 L\lCHES D(AL G~GE 0.020 INCHES
rop SLOPE 3.76667E-04 RADIANS
GAGE X-DISTANCE STRAIN RDG. I4/El LEVEL (INCHES) (MICROVOLTS) l1/I'ICHES)
3 7.5 15. 2.32S42E-07 4 22.5 91. 1.41258E-06 5 37.5 123. 1.9)155E-06 6 ':>2.5 150. 2.32842E-06 7 67.5 162. 2.51ft70E-06 8 82.5 160. 2.49141E-06 9 'H.5 138. 2.14::191E-06
10 112.5 130. 2.01021E-06 11 127.S 123. 1.90~31E-06 12 142.5 102. 1.59109E-06 13 157.5 59. 9.23~08E-Ol 14 172.5 42. 6.51'159E-07 IS 187.5 31. 4.8B~69E-07 16 202.5 24. 3.B0309E-07 17 217.5 17. 2.63888E-07 18 232.5 13. 2.0'1558E-07 19 247.5 8. 1.24183E-07 20 262.5 3. 5.43299E-08 21 277.5 3. 3.88J71E-08 l.2 292.5 1. 2.32B42E-08 23 301.5 -1. -1.55228E-08 24 322.5 -0. -1.16141E-09 25 337.5 -1. -1.55228E-08 26 352.5 -2. -3.10tt51E-08 27 382.5 -3. -3. B801lE-08 28 412.5 -2. -3.i0457E-OB 29 442.5 -1. -1.55228E-08 30 412.5 O. 1.16141E-09 31 502.5 2. 3.10457E-08

130
lDE'\\flFICAflON 100510 TIME 1130.
APPLIED LOAD 10.74 TONS
fOP DEFLECTION PUT ENT [OMEH::R 0.020 INCHES DIAL G~GE 0.020 INCHES
fOP SLOPE 3.90000E-04 RADIANS
t:.AGE X-uISTANCt: STRAP~ ROG. ""lEI LEVEL (INCHES) (MICROVOLTS) (1/1~CHES)
3 7.':> 15. 2.32B42E-07 4 22.5 95. 1.4b591E-06 5 'H.S 129. 2.00244E-06 6 52.5 157. 2.43708E-06 7 67.5 173. 2.67769E-06 8 82.5 170. 2.64664E-06 9 <17.5 146. 2.21ft09E-06
10 112.5 139. 2.15161E-06 11 127.5 132. 2.05677E-06 12 142.5 109. 1.69175E-06 13 151.5 64. 9.93ft60E-Ol 14 112.5 45. 6.98521E-07 15 187.5 34. 5.27776E-01 16 202.5 24. 3.80309E-07 1 7 217.5 19. 3.02b95E-Ol 18 232.5 13. 2.09558E-07 19 247.5 7. 1.08b60E-07 20 262.5 4. 6.98521E-Oa 21 211.5 2. 3.10457E-08 22 292.5 O. 1.76141E-09 23 307.5 -2. -3.1:lft51E-08 24 322.5 -3. -3.88071E-Oa 25 337.5 -3. -4.65685E-08 26 352.5 -2. -3.D457E-08 27 382.5 -3. -3.88::lllE-Oa L8 412.5 -4. -6.20913E-08 29 442.5 -2. -3.10457E-08 30 472.5 -0. -7.76141E-09 31 502.5 -1. -1.55228E-08

131
IDE'HIFI:ATION 100610 TI ME 1135.
APPL I ED LOAD 10.39 TONS
r I JI-' DEFLECTION PLlTENllOMEfER 0.018 INCHES DlAL GAGE 0.020 INCHES
101-> SLOPE 3.66661E-04 RADIANS
GAGt: X-DISTANCE STRAP" RDG. "'EI LEVEL (INCHES) (MICROVOLTS' (111"4CHES)
3 1.5 14. 2.17320E-01 4 22.5 91. 1.41258E-06 ~ 37.5 123. 1.91101E-06 6 52.5 151. 2.34395E-06 7 67.~ 163. 2.53798t:-06 8 82.5 162. 2.51470E-06 9 91.5 138. 2.14991E-06
10 112.5 128. 1.99468E-06 11 127.5 121. 1.88b02E-06 12 142.5 105. 1.62214E-06 13 lS1.5 59. 9.23b08E-07 14 112.5 43. 6.15243E-01 15 187.5 29. 4.5J162E-07 16 202.5 22. 3.33741E-01 1 7 217.5 11. 2.56127E-07 18 232.5 11. 1.70751E-07 19 24' .5 6. 1.00!J98E-07 20 262.5 4. 6.20913E-08 21 271.5 3. 5.43299E-08 2£ 292.5 1. 2.32B42E-08 23 301.5 O. 7.76141E-09 24 322.5 -0. -7.76141E-09 25 331.5 -1. -1.55228E-08 26 352.5 -3. -3.8B071E-08 27 382.5 -1. -2.32842E-08 28 412.5 -1. -2.32842E-08 29 442.5 -2. -3.10457E-08 30 472.5 1. 1.55228E-08 31 502.5 1. 2.32842E-08

132
IDI:::NTlFICAJ IUN 100110 TI ME 1138.
APPLIED LOAD 10.43 TONS
lOP DEFLECTION POTENTIOMETER 0.021 IfIICHES DIAL GAGE 0.022 INCHES
TOP SLOPt:: 3.90000E-04 t{ADIANS
GAGE X-DISTANCI::: STRAIN RDG. 141 E 1 LEVEL ([NCHES) (MICROVOLTS) (111 ~CHES)
3 1.5 14. 2.250B1E-Ol 4 22.5 94. 1.45~15E-06 , 37.5 124. 1.93259E-06 6 52.5 151. 2.3lt395E-06 1 61.5 165. 2.56121E-06 8 d2.5 165. 2.56127E-06 9 91.5 144. 2.23529E-06
10 112.5 135. 2.09558E-06 1 1 121.5 130. 2.01191E-06 12 142.5 109. 1.6~}15E-06 13 151.5 63. 9.77:;}38E-Ol 14 112.5 46. 7.14050E-Ol 15 181.5 34. 5.21116E-01 16 202.5 25. 3.95832E-01 17 211.5 IS. 2.S7112E-07 IS 232.5 13. 2.01197E-07 19 241.5 S. 1.24183E-01 20 262.5 3. 3.S8l71E-08 21 217.5 3. 3.88071E-08 22 292.5 1 • 2.32842E-08 23 301.5 O. 7.16141E-09 24 322.5 -2. -3.10457E-08 25 337.5 -3. -5.43299E-08 26 352.5 -0. -1.16141E-09 27 382.5 -3. -3.88J71E-D8 28 412.5 -3. -4.65685E-08 29 442.5 -0. -7.76141E-09 30 472.5 1. 2.32B42E-08 31 502.5 1 • 1.55228E-08

133
IUtNTIFICATIDt\j 100810 TIME 1142.
APPLIED LOAD 10.45 TONS
TOP UEFLECTION PQTENTIm-~ETER 0.019 INCHES D[AL GAGE 0.021 INCHES
lOP SLOPE 4.10000E-04 RADIANS
GAGE X-DISTANCE ~TRAI'!I ROG. M/EI LEVEL (INCHE!) (MICROVOLTSI (l/I~CHES)
3 7.5 15. 2.32342E-07 4 22.5 92. 1.43586E-06 ? 37.5 130. 2.01~21E-06 6 52.5 158. 2.44lt85E-06 7 67.5 172. 2.6b~93E-06
B 82.5 168. 2.60784E-06 9 97.5 146. 2.27ft09E-06
10 112.~ 137. 2.12 663E- 06 11 127.5 131. 2.03349E-06 12 142.5 109. 1.69175E-06 13 157.5 63. 9.77938E-07 14 172.5 43. 6.75243E-07 15 un .5 32. 4.96731E-07 16 202.5 24. 3.80309E-07 1 7 217.5 18. 2.79411E-01 18 232.5 12. 1.86274E-07 19 2.47.5 7. 1.08b60E-07 20 262.5 3. 4.65b85E-08 21 277.5 2. 3.10457E-08 22 292.5 1 • 2.32842E-08 23 307.5 -0. -7.76141E-09 24 322.5 -2. -3.10457E-08 25 337.5 -3. -4.65685E-08 26 352.5 -3. -3.8BJ71E-08 27 382.5 -4. -6.20913E-08 28 412.5 -3. -5.43299E-08 29 442.5 -3. -3.88J71E-08 30 472.5 O. 7.76141E-09 31 502.5 -1. -1.55228E-08

134
IDENTIFICATION 100910 TI ME 114-4.
APPLIE[) LOAO 10.11 TONS
rop DEFLEC r ION POTENTIUMETER 0.020 INCHES D1 AL GAGE 0.021 INCHES
fOP SLOPE 3.76667E-U4 KALJ[ANS
GAGe: X-DISTANCE STKAIN RDG. ~I El LEVEL ( II\lC HE S ) (MICKOVOLTS) ( 1/ I '4CHES)
3 7.5 15. 2. 32~42E-07 4 22.5 98. 1.51348E-06 ) 37.') 132. 2.04901E-06 b ~2.5 160. 2.4B365E-06 7 6/.5 116. 2.72426E-06 8 82.5 113. 2.6B545E-06 9 '-il.":J 149. 2.31290E-06
10 112.5 139 .. 2 .. 16543E-06 11 127.5 132. 2.04901E-06 12 142.5 113. 1.15408E-06 13 157.5 63. 9.8'!)99E-07 14 1 72.5 46. 7.06289E-07 15 L87.5 31. 4.88969E-01 16 202.5 24. 3.72548E-Ol 17 217. '.) 16. 2.4B365E-01 18 232.5 12. 1.94)35E-01 L9 247.5 6. 1.00698E-01 20 262.5 3. 4.65585E-08 21 271.5 3. 4.65685E-08 22 292.5 O. 7.16L41E-09 23 307.5 -0. -7.1&141E-09 24 322.5 -1. -1.55228E-08 25 331.'.> -3. -3.88011E-08 26 352.5 -4. -6.20;'13E-08 21 382 .. 5 -3. -3.88) 11E-08 28 4L2.5 -3. -3.88011E-08 29 442.5 -3 .. -3.88011E-08 30 412.5 3. 4.65685E-08 31 502.5 o. 1.16141E-09
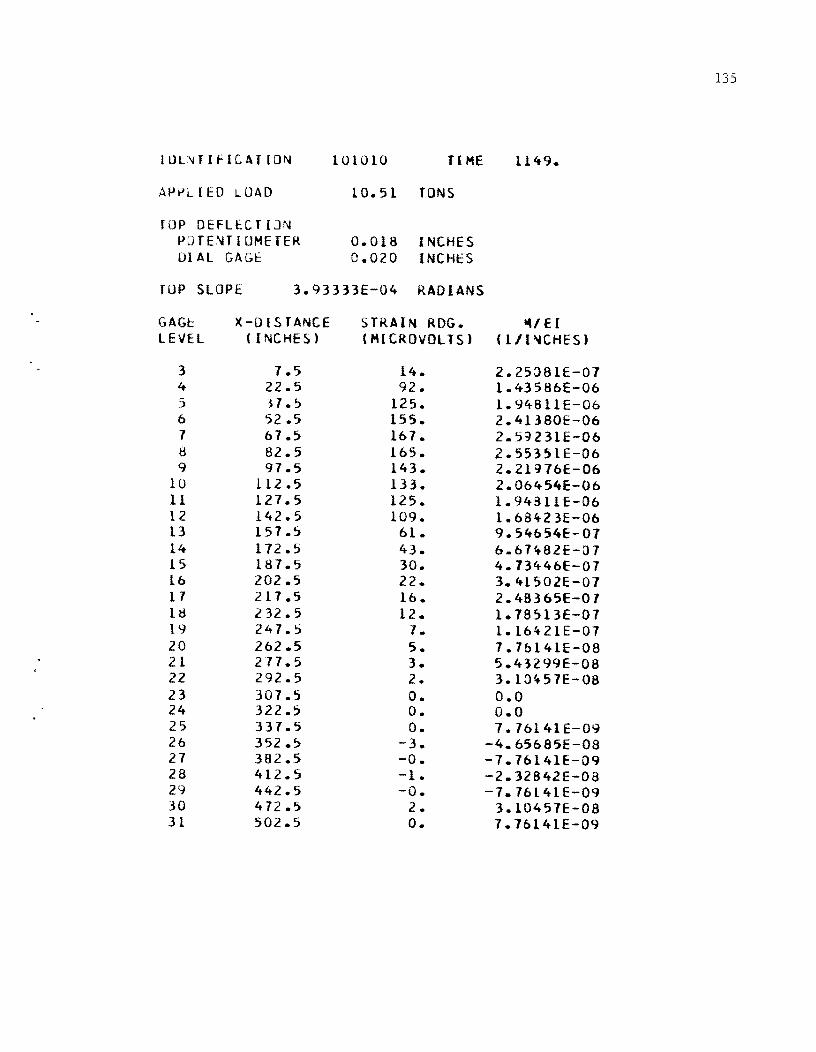
135
lUl'4TIFICATlDN 101010 TI ME 1149.
APiJLIED LOAD 10.51 TONS
rop DEFU:C r iJN IJDTENTlllMETER 0.018 INCHES OIAL GAGt: 0.020 INCHES
rop SLOPE 3.93333E-04 RADIANS
GAGe X-DISTANCE STRAIN RDG. 14' E I LEVEL (INCHES) (MICROVOLTS) (l/l"'CHES)
3 7.5 14. 2.25:>81E-01 4 22.5 92. 1.43586E-06 5 H.5 125. 1.94B11E-06 6 52.5 155. 2.41360E-06 1 67.5 167. 2.5~231E-06 8 82.5 165. 2.55351E-06 9 97.5 143. 2.21916E-06
10 112.5 133. 2.06454E-06 11 127.5 125. 1.94S11E-06 12 142.5 109. 1.68423E-06 13 157.5 61. 9.54654E-01 14 112.5 43. 6.61ft82E-07 15 187.5 30. 4.73446E-01 L6 202.5 22. 3.41502E-01 11 211.5 16. 2.48365E-07 Id 232.5 12. 1.78513E-01 19 241.':) 7. 1.16421E-01 20 262.5 5. 1.1b141E-08 21 217.5 3. 5.43299E-08 22 292.5 2. 3.10ft51E-08 23 307.5 o. 0.0 24 322.5 O. 0.0 25 331.5 O. 7.16141E-09 26 352.5 -3. -4.65685E-08 21 382.5 -0. -1.16141E-09 28 412.5 -1. -2.32B42E-08 29 442.5 -0. -7.76L41E-09 30 472.5 2. 3.10457E-06 31 502.5 O. 7.10141E-09
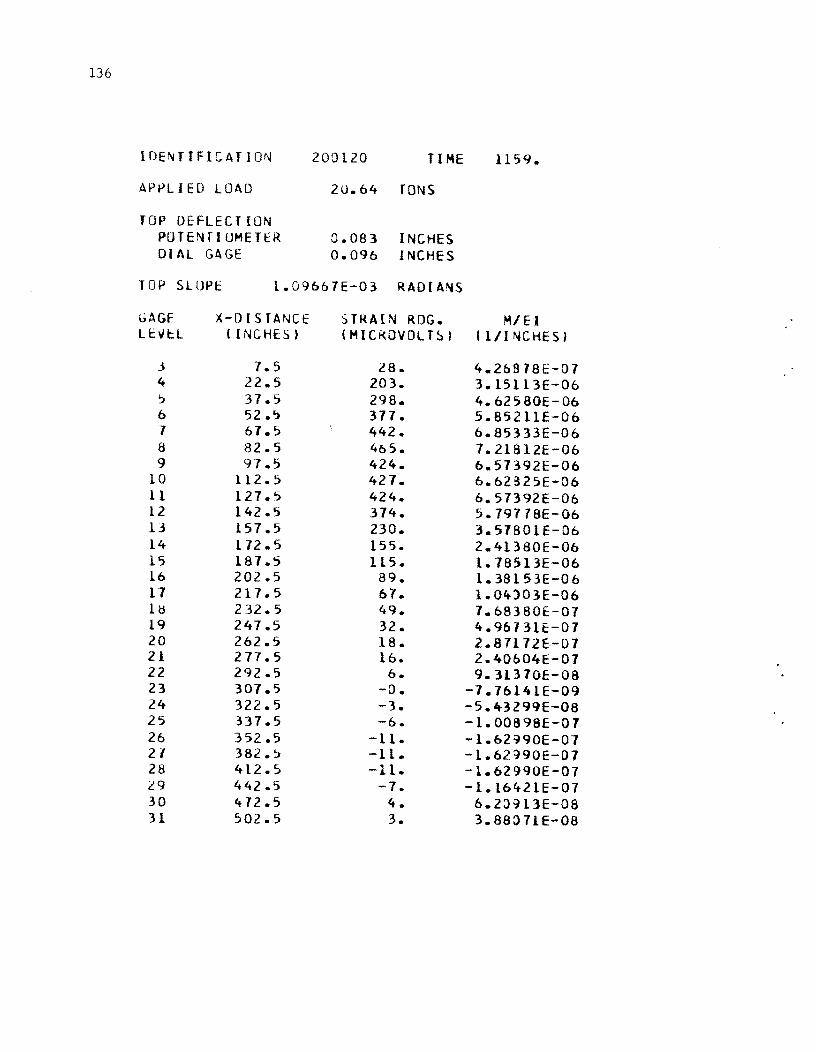
136
[OENTtFlCAT ION 200120 TIME 1159.
APIlLIED LOAD 20.64 fONS
TOP DEFLECTION PUTEN fI m~E T ER 0.083 INCHES DIAL Gil GE 0.096 INCHES
TOP SLOPE 1.09667E-03 RADtA,..S
GAGE X-DISTANCE STRAIN RDG. M/E I L!::\lt:L (INCHES) (MICROVOLTS) ( III NCHES)
j 7.5 l8. 4.2bB18E-07 4 22.5 203. 3.15113E-06 '> 37.5 298. 4.62 S 80E- 06 6 52.~ 377. 5.85211E-06 7 67.5 442. 6.85333E-06 8 82.5 465. 7.2lB12E-06 9 97.5 424. 6.57392E-06
10 112.5 427. 6.62325E-06 11 127.5 424. 6.57392E-06 12 142.5 374. 5.79778E-06 13 157.5 230. 3.57BOIE-06 L4 L 72.5 155. 2.41380E-06 15 187.5 115. 1.78513E-06 16 202.5 89. 1.38 153E-0 6 17 217.5 67. 1.0lt)03E-06 ltl 232.5 49. 7.68380E-01 L9 247.5 32. 4.96131E-07 20 262.5 18. 2 • 8 71 72 E- 0 1 21 277.5 16. 2.40604E-Ol 22 292.5 6. 9.31370E-08 23 301.5 -D. -7.76141E-09 24 322.5 -3. -5.43299E-08 25 337.5 -6. -l.OO898E-07 26 352.5 -11. -1.62~90E-07 21 382.~ -11. -1.62::}90E-07 28 412.5 -11. -1.62990E-07 L9 442.5 -7. -1.16421E-07 30 412.5 4. 6.2J:J13E-08 31 502.5 3. 3.88071E-08

137
IDb"tTIFI::ATION 200220 TIME 12;)9.
APPL I ED L DAD 20.99 TONS
rop DEFLECTION POTPH[QMETER 0.098 INCHES DIAL GAGE 0.104 INCHES
TOP SLOPE 1.23667E-03 RADIANS
GAGt: X-[)lSTANCE STRAP" RDG. M/EI LEvEL (INCHE~) (MICROVOLTS) (1/1~CHESl
3 7.5 26. 4.11355E-07 4 22.~ 207. 3.21323E-06 5 37.5 304. 4.72670E-06 6 52.5 389. 6.04~14E-06 7 67.5 464. 7.21035E-06 8 82.5 489. 7.59;)66E-06 9 97.5 442. 6.85333E-06
10 112.5 443. 6.87661E-06 11 L27.5 439. 6.81452E-06 12 142.5 385. 5.96353E-06 13 151.5 236. 3.65S63E-06 14 172.5 IbO. 2.48365E-06 15 187.5 120. 1.81::>50E-06 16 202.5 93. 1.45138E-06 L7 211.5 70. 1.07884E-06 L8 232.5 52. 8.14~48E-07 19 247.5 35. 5.51::>60E-07 20 262.5 17. 2.71649E-07 2L 277.5 16. 2.48365E-07 22 292.5 1. 1.16421E-07 23 307.5 1 • 2.32B42E-08 24 322.5 -4. -6.20~13E-08 25 337.5 -6. -9.31370E-08 26 352.~ -10. -1.41~67E-07 27 382.5 -9. -1.39705E-07 28 412.5 -10. -1.55228E-07 29 442.5 -7. -1.164-21E-07 30 472.5 3. 4.65685E-08 31 502.5 -0. -7.76141E-09

138
lUE~TIFl:ATlUN 200320 TIME 1217.
APPLlED LUAD 2l.04 TONS
TUP DEFLECTION POTENTIOMEfE.1. 0.104 I NCHE S DIAL GAGE o .lll INCHES
rop SLO~E 1. H6b7E-03 RADIANS
GAGE X-UISTANCE ~TRAP-4 RDG. M/EI LEVl:L (INCHES) (MICROVOLTS' (l/l"CHES)
3 7.5 25. 3.88011E-07 4 22.5 207. 3.21323E-06 ') 37.5 304. 4.12f)70E-Ob 6 52.5 392. 6.01719E-06 7 67.5 469. 7.27245E-06 8 82.5 4q5. 7.68380E-06 q q7.5 446. 6.92318E-06
Lv 112.5 448. 6.94647E-06 11 127.5 444. 6.892l4E-06 12 l42.5 394. 6.1159qE-06 13 l57.5 235. 3.64786E-06 14 172.5 162. 2.5l410E-06 1') 187.5 120. 1.86274E-06 16 202.5 ql. 1.41258E-06 17 211.5 10. 1.08660E-06 18 232.5 52. 8.07l87E-Ol 19 241.5 34. 5.20l15E-07 20 262.5 23. 3.49264E-Ol 21 277.5 18. 2.79411E-Ol 22 292.5 9. l.3~105E-Ol 23 307.5 3. 3.88071E-08 24 322.5 -4. -6.20913E-08 25 337.5 -5. -7.16141E-08 26 352.5 -6. -1.00SQSE-07 27 382.5 -9. -1.39705E-Ol 28 412.5 -8. -1.3l=}44E-07 2Q 442.5 -6. -9.3l310E-08 30 472.5 3. 5.43299E-08 3l 502.5 O. 7.16141E-09
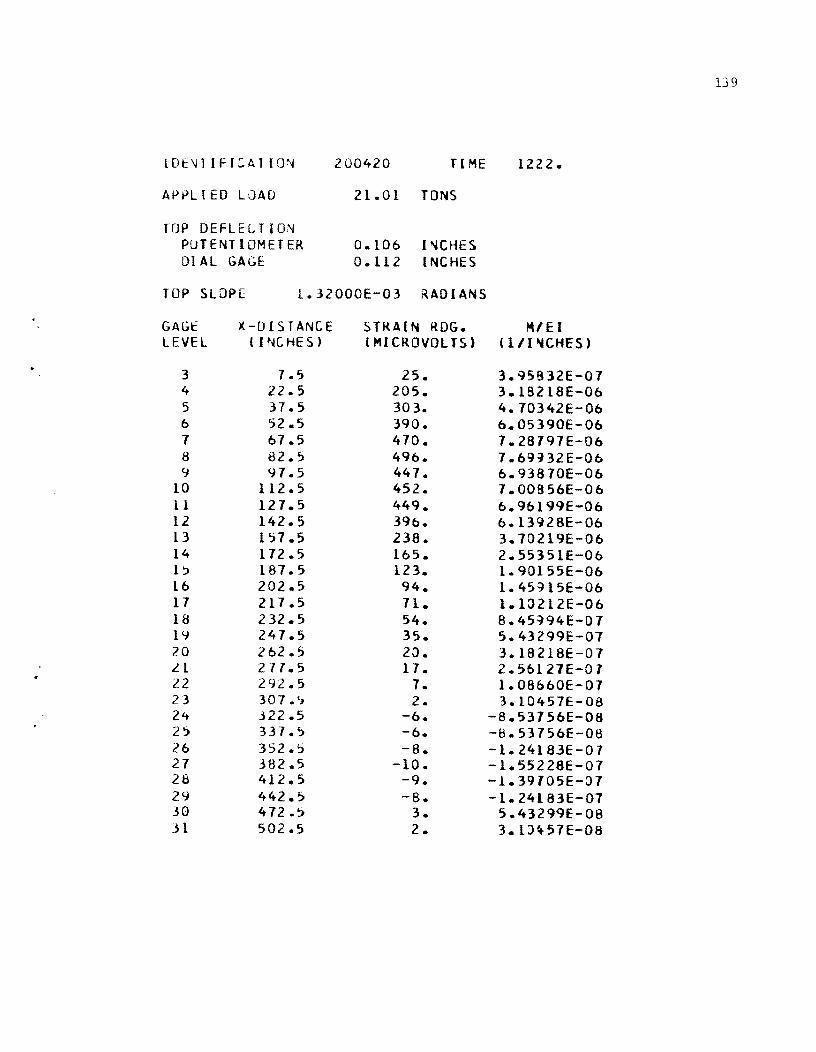
139
lDE\lTIFI::ATlOt\j 200420 TI ME 1222.
APPLl ED LQAD 21.01 TONS
fOP OEFLECTIO:'>l POTENTIOMETER 0.106 ("-'CHES DIAL GAGE 0.112 [NCHES
TOP SLOPE 1.32000E-03 RADIANS
GAGE X-DISTANCE STRAIN ROG. M/EI LEVEL ( I NCHE S) (MICROVOLTS) (ll1"'CHES)
3 7.5 25. 3.95B32E-Ol 4 22.5 205. 3.1B218E-06 5 37.5 303. 4.10342E-06 6 52.5 390. 6.05390E-06 1 61.5 470. 1.26197E-D6 B B2.5 496. 1.69:}32E-06 9 91.5 447. 6.93610E-06
10 112.5 452. 1.00856E-06 11 121.5 449. 6.96199E-06 12 142.5 396. 6.13928E-06 13 157.5 238. 3.70219E-06 14 172.5 165. 2.55351E-06 1~ 187.5 123. 1.90155E-06 16 202.5 94. 1.45:}15E-06 17 217.5 71. 1.10212E-06 1B 232.5 54. 8.45:}94E-Ol 19 247.5 35. 5.43299E-07 20 262.5 20. 3.1B218E-Ol L1 277.5 17. 2.56127E-Ol 22 292.5 1. 1.08b60E-Ol 23 301.',) 2. 3.10457E-08 24 322.5 -6. -8.53156E-08 25 337.5 -6. -B.53756E-OB 26 352.5 -B. -1.24183E-07 21 382.5 -10. -1.55228E-Ol 28 412.5 -9. -1.39105E-Ol 29 442.5 -8. -1.24183E-07 30 472.5 3. 5.43299E-08 31 502.5 2. 3.1J4-51E-08

140
1 DEN T I FIe A T ION 200520 TIME 1228.
APPLIED LOAD 21.14 TONS
TlJP DEFLECTION PLlTENIIOMETER 0.110 INCHES DIAL GAGE 0.114 INCHES
TOP SLOPf: 1.35000E-03 RADIANS
GAGE X-DISTANCE STRAIN RDG. M/EI LEVEL (INCHES) (MICROVOLTS) (1/1~CHES)
j 7.5 26. 4.11355E-07 4 22.5 206. 3.19770E-06 5 37.5 308. 4.78103E-Ob 6 52.5 395. 6.12376E-06 1 61.5 476. 1.36881E-06 8 82.5 504. 7.82351E-06 9 91.5 455. 7.05513E-06
10 112.5 460. 1.14926E-06 11 127.5 451. 7.09393E-06 12 142.5 403. 6.26346E-06 13 157.5 245. 3.81)85E-06 14 172.5 166. 2.S6903E-06 15 181.5 125. 1.94BllE-06 16 202.5 96. 1.49195E-06 17 217.5 74. 1.14B69E-06 18 232.5 54. 8.45994E-07 19 247.5 36. 5.66583E-07 20 262.5 21. 3.25~79E-07 21 277.5 11. 2.b3888E-07 22 292.5 10 .. 1.47461E-01 23 307.5 2 .. 3 .. 10~57E-08 24 322.5 -4 .. -6.20913E-OB 25 337.5 -6. -9.31310E-08 2b 352.5 -9 .. -1.19105E-07 27 382.5 -11. -1.62990E-07 28 412.5 -11. -l.62990E-01 29 442.5 -8 .. -1.31~44E-07 30 472.5 3. 4 .. 6568SE-08 31 502.5 O. 0 .. 0

141
lDOHIFI:ATION 200620 TIME 1234.
APPL I ED lOAU 20.18 TONS
rop DEFLECTION POTENTIOMETER 0.109 iNCHES DIAL GAGE 0.114 iNCHES
TLlP SLOPE 1.36000E-03 KADIANS
liAGE X-DISTANCE STRAIN RDG. M/EI lEIlt::l ( I NCHE~ , (MICROIiOlTS) ( 111-.CHES)
3 1.5 25. 3.88011E-01 4 22.5 202. 3.13561E-06 '.) 37.5 302. 4.68189E-06 b S2.5 381. 6.0:)133E-06 1 61.5 468. 1.26~68E-06 a 82.5 496. 7.69932E-06 9 97.5 448. 6.95\23E-06
10 112.5 453. 1.03L84E-06 LL 127.5 450. 6.98521E-06 12 142.5 402. 6.24)18E-06 13 157.5 240. 3.13324E-06 14 112.5 166. 2.56903E-06 15 187.5 123. 1.90155E-06 16 202.5 95. 1.41~67E-06 11 217.5 11. 1.10212E-06 18 232.5 53. 8.30471E-01 19 247.5 35. 5.35538E-01 20 262 .. 5 22. 3.33741E-01 21 217 .5 18. 2.1941LE-01 22 292.5 10. 1.41\61E-01 23 307.5 3. 3.88311E-08 24 322.5 -3. -3.88011E-08 25 337.5 -4. -6.98521E-08 26 352.5 -6. -8.53156E-08 21 382.5 -9. -1.39105E-07 28 412.5 -9. -1. 39105E-0 7 29 442.5 -5. -1.76141E-08 30 412.5 4. 6.98521E-08 31 502.5 1. 2. 32842E-08

142
IDE\JTIFICATION 200720 TIME 1236.
APPLIED LJAlJ 21.12 TONS
lUP DEFLECTION PO H: Nfl OME r ER 0.112 I~CHES DIAL GAGE 0.11 7 INCHES
TOP SLOPE 1.39333E-03 I{AOIANS
GAGf:: X-DISTANCE STRAIN RDG. MIEf ll:VE:L (INCHE~' (MICROVOLTS' (l/l~CHES'
3 7.5 25. 3.95832E-07 4 22.5 206. 3.19770E-06 5 31.5 310. 4.8("'32E-Ob b 52.5 397. 6.16256E-06 7 67.5 481. 7.45672E-06 8 82.5 509. 7.90112E-06 9 97.5 461. 1.1)~02E-06
10 112.5 466. 7.23364E-06 11 127.5 466. 7.22588E-06 12 142.5 411. 6.38764E-Ob 13 157.5 251. 3.88847E-06 14 172.5 170. 2.64664E-06 15 187.5 127. 1.97140E-06 16 202.5 99. 1.52900E-06 17 217.5 74. 1.14093E-06 18 232.5 54. 8.45994E-07 19 247.5 34. 5.27776E-07 20 262.5 20. 3.10'+57E-07 21 271.5 18. 2.79411E-07 22 292.5 7. 1.08t:.60E-07 23 301.5 O. 7.76141E-09 2.4 322.5 -4. -6.20913E-08 25 331.5 -7. -1.08660E-07 26 352.5 -7. -1.16'+21E-07 27 382.5 -10. -1.55228E-07 28 412.5 -12. -1.86274E-07 29 442.5 -1. -1.1&~21E-01 30 472.5 4. 6.20913E-08 31 502.5 1. 2.32642E-08

143
IDE'lTIFIC~r ION 200820 TIME 1239.
APPL I ED LOAD 20.99 TONS
lOP DEFLECTION PO T EN r [OM E T ER 0.114 I NCHE S DIAL GAGE 0.119 INCHES
rop SLOPE 1.39333E-03 RADIANS
GAGE X-DISTANCE STRAI'II ROG. 141 E I U:VEL ( INCHES) (MICROVOLTS) tl II ..,CHES )
3 7.5 27. 4.19116E-07 4 22.5 205. 3.18994E-06 5 31.5 307. 4.7b551E-06 6 52.5 397. 6.17032E-06 1 67.5 481. 7.46b48E-06 8 82.5 512. 7.94769E-06 9 97.5 464. 1.20259E-06
10 112.5 470. 7.29513E-06 11 127.5 410. 7.29573E-06 12 142.5 416. 6.45150E-06 13 157.5 253. 3.92728E-06 14 172.5 173. 2.67169E-06 1~ 181.~ 130. 2.01191E-06 16 202.5 101. 1.56181E-06 11 217.5 15. 1.11197E-06 18 232.5 58. 8.92563E-Ol 19 241.5 37. 5.82106E-01 20 262.5 20. 3.10451E-01 21 217.5 16. 2.48365E-01 22 292.5 7. 1.lb421E-01 23 301.':» 1. 1.55228E-08 24 322.5 -6. -9.31310E-06 25 331.5 -9. -1.39105E-01 26 352.5 -1. -1.08660E-01 21 382.5 -11. -1.62990E-01 28 412.5 -13. -2.01791E-01 29 442.5 -6. -1.31944E-01 30 412.5 2. 3.10451E-08 31 502.5 O. 0.0

144
IDE~TIFICATIDN 200920 TIME 1242.
APPLIED LOAD 20.86 TONS
TUP DEFL!::CT ION POTENTIOMETER 0.114 INCHES DIAL ~AGE 0.120 INCHES
TOP SLOPE 1.35667E-03 RADIANS
GAGE X-DISTANCE STRAIN ROG. "" EI LEVEL ( INCHES) (MICROVOLTS) (1/1 \lCHES)
3 7.5 26. 4.11355E-07 4 22.5 205. 3.17442E-06 5 37.5 305. 4.74222E-06 6 52.5 396. 6.14704E-06 7 67.5 481. 7.45872E-06 a 82.5 510. 7.92440E-06 9 97.5 462. 7.11155E-06
10 112.5 467. 7.25692E-06 11 121.5 467. 7.25!>92E-06 12 142.5 416. 6.44974E-06 13 157.5 251. 3.89623E-06 14 112.5 173. 2.61169E-06 15 187.5 129. 2.00244E-06 16 202.5 100. 1.55228E-06 17 217.5 11. 1.18150E-06 18 232.5 57. 8.84801E-07 19 247.5 37. 5.74345E-07 20 262.5 21. 3.25979E-07 21 277.5 11. 2.71b49E-07 22 292.5 8. 1.241B3E-07 23 307.5 1. 2.32942E-08 24 322.5 -5. -7.7bI41E-08 25 337.5 -6. -9.31370E-08 26 352.5 -9. -1.39705E-07 27 382.5 -11. -1.62990E-01 28 412.5 -11. -1.70751E-07 2'1 442.5 -9. -1.39105E-07 30 472.5 3. 3.88071E-08 31 502.5 O. 0.0

145
IDENTIFICATIJN 201020 TIME 124-7.
APPLIED LUAD 21.08 TONS
TOP DEFLECTDN PUrENJIOMETER 0.115 INCHES DIAL GAGE 0.121 INCHES
TOP SLOPE 1.36000E-03 RADIANS
GAG!: X-DISTANCE STRAIN RDG. MI E I LEVEL ( PiCHE S) (MICROVOLTS) ( 111 ~CHES)
3 1.5 26. 4.11355E-07 4 22.5 208. 3.22:>99E-06 5 37.5 308. 4.78879E-06 6 52.5 399. 6.20137E-06 7 67.5 484. 7.5130SE-06 8 82.5 515. 7.98650E-06 9 91.5 466. 7.24140E-06
10 112.5 472. 7.32617E-06 11 121.5 472. 7.32617E-06 12 142.5 419. 6.50407E-06 13 157.5 2,4. 3.94280E-06 14 112.5 174. 2.13373E-06 IS 187.5 129. 2.00244E-06 16 202.5 100. 1.56004E-06 11 217.5 75. 1.16421E-06 18 232.5 58. 8.92563E-07 19 247.5 38. 5.89867E-01 20 262.5 24. 3.12548E-01 21 211.5 20. 3.lJ451E-Ol 22 292.5 11. 1.70751E-Ol 23 307.5 3. 3.88311E-08 24 322.5 -3. -3.88JI1E-08 25 337.5 -4. -6.20~13E-08 26 352.5 -6. -9.31370E-08 21 382.5 -8. -1.31~44E-Ol 28 412.5 -10. -1.47467E-07 29 442.5 -8. -1.24183E-Ol 30 412.5 3. 5.43299E-08 31 502.5 1. 1.55228E-08

146
(OENTIFISATION 201120 TIME 1253.
APPL I ED L GAD 21.11 TONS
TUP DEFLECTION iJD T PH 1 OM ErE R 0.117 INCHES DIAL GAGE 0.123 INCHES
TOP SLOPE 1.37667E-03 RADIANS
GAGE X-DISTANCE STRAIN RDG. H/EI LEVEL (INCHES) (MICROVOLTS) (l/l"CHES)
3 7.5 26. 4.11355E-07 4 22.5 208. 3.23651E-06 5 37.5 311. 4.82160E-06 6 52.5 400. 6.20913E-06 7 67.5 488. 1.56138E-06 8 82.5 520. 8.07187E-06 9 91.5 412. 7.32&11E-06
10 112.5 417. 7.40439E-06 11 121.5 479. 7.43543E-06 12 142.5 424. 6.51392E-06 13 157.5 258. 4.00489E-06 14 112.5 116. 2.124-26E-06 15 187.5 132. 2.04901E-06 1b 202.5 103. 1.b0661E-Ob 11 21:1.5 18. 1.20302E-06 18 232.5 59. 9.15841E-01 19 247.5 38. 5.89861E-01 20 262.5 22. 3.41502E-07 21 277.5 18. 2.81112E-01 22 292.5 10. 1.47ft67E-07 23 301.5 1. 1.55228E-08 24 322.5 -3. -4.65685E-08 25 337.5 -6. -9.31370E-08 26 352.5 -6. -1.00398E-01 27 382.5 -11. -1.62990E-07 28 412.5 -12. -1.94335E-01 29 442.5 -8. -1.31~44E-01 30 472.5 2. 3.104-51E-08 31 502.5 O. 0.0

147
I 0 EN T I F I CAT I ;) N 201220 TIME 125b.
APPLIED LOAD 21.00 TONS
rop DEFL EC T ION POTENTIOMETER 0.118 INCHES DIAL GAGE 0.125 INCHES
TOP SLOPE 1.37333E-03 KAOIANS
GAGt: X-DISTANCE STRAIN ROG. MI E I LEVE:L (INCHES) (MICRDVOLTS) ( 111'l1CHESI
3 7.5 26. 4.03594E-07 4 22.5 205. 3.18994E-Ob 5 37.5 308. 4.7B819E-Ob 6 52.5 399. 6.20137E-06 7 67.5 485. 7.53633E-06 8 82.5 519. 8.04BS9E-Ob 9 97.5 473. 7.33~54E-06
10 112.5 477. 7.39b63E-06 11 127.5 477. 7.40439E-06 12 142.5 427. 6.62S25E-Ob 13 157.5 25S. 3.96b08E-06 14 172.5 176. 2.72426E-06 15 187.5 131. 2.02573E-06 16 202.5 102. 1.58333E-06 17 217.5 77. 1.18750E-06 18 232.5 58. 9.00324E-07 19 247.5 37. 5.82106E-07 20 262.5 23. 3.492b4E-07 21 277.5 19. 2.94934E-01 22 292.5 10. 1.41ft61E-01 23 307.5 3. 3.88071E-08 24 322.5 -4. -6.20913E-08 25 337.5 -b. -9.31370E-08 2b 352.5 -7. -i.lb421E-07 27 382.5 -9. -1.3970SE-07 28 412.5 -11. -1.b2990E-07 29 442.5 -8. -1.24183E-01 30 472.5 3. S.43299E-oa 31 502.S O. 7.1bI41E-09

148
I DEN T I F I CAT ION 201320 TIME 125~.
APPLI EO L DAD 20.78 TONS
IUP OEFLECTlJN POTENfIOMEIER 0.117 I~CHES DIAL GAGE 0.123 INCHES
TOP SLOPE 1.44333E-03 RADIANS
GAGE X-DISTANCE STRAIN RDG. r41 E I LEVEL ( INCHES) (MICROVOLTS) (1/1..,CHES)
3 7.5 26. 4.11355E-07 4 22.5 203. 3.15113E-06 5 37.5 304. 4.72070E-06 6 '>2.5 396. 6.13928E-06 1 67.5 481. 7.45872E-06 8 82.5 514. 7.97B73E-06 9 97.5 469. 7.28021E-06
10 112.5 472. 7.32677E-06 11 127.5 474. 7.30558E-06 12 142.5 422. 6.55839E-06 13 157.5 255. 3.95832E-06 14 1 72.5 176. 2.73202E-06 15 187.5 131. 2.02573E-06 16 202.5 102. 1.57557E-06 17 217.5 77. 1.18150E-06 18 232.5 59. 9.15847E-07 19 247.5 39. 6.05390E-07 20 262.5 23. 3.57025E-07 21 277.5 18. 2.87172E-07 22 292.5 9. 1.39705E-07 23 307.5 3. 3.88071E-08 24 322.5 -3. -5.43299E-08 25 337.5 -6. -9.31370E-08 26 352.5 -7. -1.08060E-07 27 382.S -10. -1.55228E-07 28 412.5 -10. -1.55228E-07 29 442.5 -7. -1.08060E-07 30 472.5 4. 6.98521E-08 31 502.5 3. 3.88)71E-08
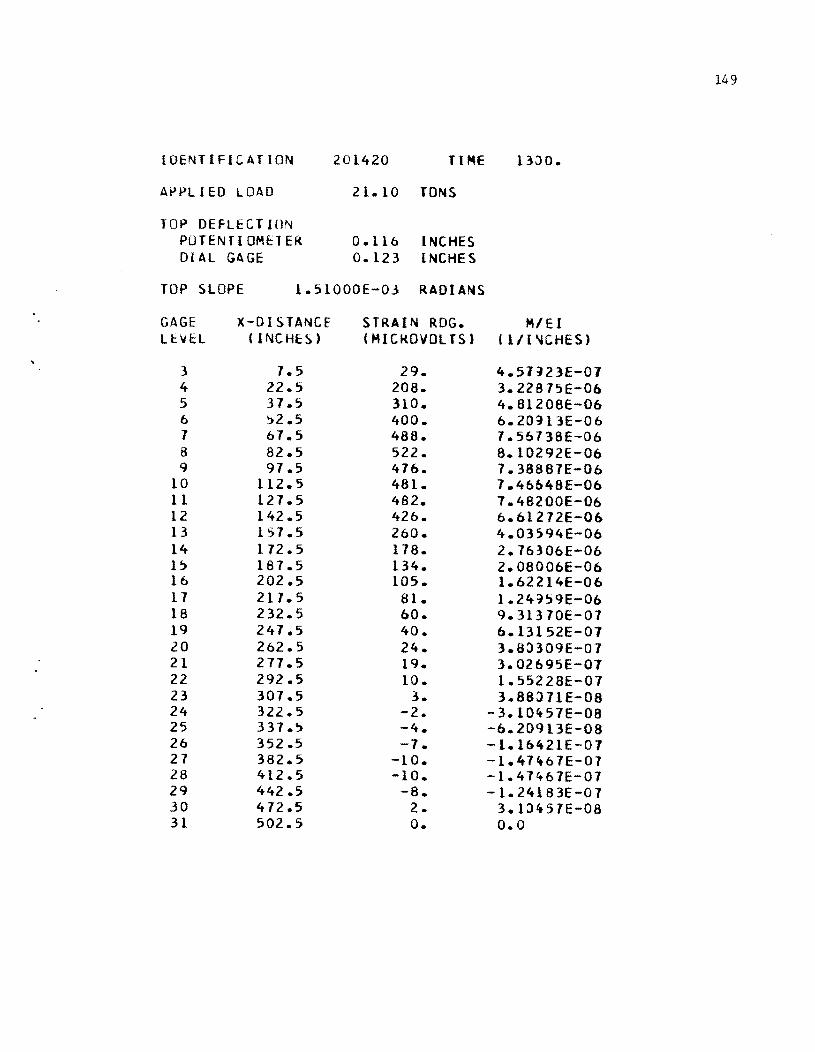
149
IOENTIFICATION 201420 TIHE 1300.
At>PLIED LOAD 21.10 TONS
TOP DEFLECTION POTENrlOMtTER 0.116 INCHES DIAL G~GE 0.123 lNCHES
TOP SLOPE 1.51000E-Oj RADIANS
GAGE X-DISTANCf STRAIN RDG. MIEI LeVEL c INCHE~) (MICI(OYOLTS) ( III '4CHES)
3 1.5 29. 4.51~23E-01 4 22.5 208. 3.22815E-06 5 37.5 310. 4.81208E-06 6 ~2.5 400. 6.20~13E-06 1 67.5 488. 7.56738E-06 8 82.5 522. 8.I0292E-06 9 97.5 476. 7.388S7E-06
10 112.5 481. 7.46648E-06 11 127.5 482. 1.48200E-06 12 142.5 426. 6.61272E-06 13 157.5 260. 4.03;94E-06 14 172.5 178. 2.76306E-06 1, 187.5 134. 2.08006E-06 16 202.5 105. 1.62214E-06 17 211.5 81. 1.24~59E-06 IB 232.5 60. 9.31370E-07 19 247.5 40. 6.13152E-01 20 262.5 24. 3.8:>309E-01 21 277.5 19. 3.02695E-Ol 22 292.5 10. 1.55228E-01 23 307.5 3. 3.88011E-08 24 322.5 -2. -3.10451E-08 25 337.5 -4. -6.20913E-08 26 352.5 -7. -i.16421E-Ol 27 382.5 -10. -1.47467E-07 28 412.5 -10. -1.47461E-07 29 442.5 -8. -1.24183E-07 30 472.5 2. 3.1:>451E-08 31 502.5 o. 0.0

150
IDt:NTIFI:ATION 201520 TIME 1336.
APfJLIED LOAU 20.81 TONS
TOP DEFLECTION POTENflOMEIER 0.117 INCHES DIAL GAGE 0.125 I~CHES
TOP SLOPE 1.43000E-03 RADIANS
GAGE X-DISTANCE. STRAIN RDG. Io4IEI LEVEL (I NCHES) (MICROVOLTS) (l/l~CHES)
3 7.5 29. 4.42401E-07 4 22.5 205. 3.18994E-06 5 37.5 307. 4.11327E-06 6 52.5 397. 6.17032E-06 7 07.5 484. 7.50529E-Oo 8 82.5 518. 8.0ft)83E-Ob 9 97.5 474. 7.36558E-Ob
10 112.5 477. 7.40ft39E-06 11 127.5 47b. 7.38B87E-Ob 12 142.5 422. b.55B39E-Ob 13 157.5 258. 3.99713E-Ob 14 172.5 176. 2.72426E-06 15 187.5 131. 2.02573E-Ob 16 202.5 102. 1.S75S7E-Ob 17 217.5 78. 1.2lO78E-Ob 18 232.5 58. 9.0:>324E-07 19 247.5 40. b.13l52E-07 20 262.5 23. 3.64786E-07 21 277.5 19. 3.02695E-07 22 292.5 12. 1.78513E-07 23 307.5 3. 5.43299E-08 24 322.5 -3. -3.88J71E-08 25 337.5 -3. -5.43299E-08 26 352.5 -8. -1.3l944E-07 27 382.5 -11. -1.10751E-07 28 412.5 -11. -1.0299QE-07 29 442.5 -9. -1.39705E-07 30 472.5 4. 6.20913E-08 31 502.5 O. 0.0

l 0 EN T I F l ,: AT (] N
APPL I ED L 01\;)
TUP IJEfLf:CTIJN PO T ENTI OMiH:R DIAL GAvt.
300130 TI ME
.H .06 TONS
0.243 INCHES 0.264 INCHES
rup SLUPE: 2.7~333f:-03 ~ADIANS
CAG!: LfVEL
3 4
6 7 ~
9 10 11 12 13 14 15 16 17 18 19 20 21 22 23 .2.4 25 26 27 26 2Y 30 31
x - [) 1ST A iK I:: (INCHES)
7.';) 22.5 "j 7 • 5 52.5 61.5 82.5 (-jJ. ':J
112.5 127.5 142.5 L57.5 112.5 187.':> 20c!..5 217.5 2. 32 • 5 24/.5 262..5 277.5 2"';;2.'.> J07.5 .iZ2.':> 331.5 352.') 382.~
412.':> 442.5 472.5 502.S
STKAI~ ROG. (MICROVOLTS)
45. 321. ':>08. 124. YI0.
L054. 984. 'l6B. 982. 892. 570. 374. 282. 223. 177. 138. 100. 6S. 1)4. 31. 16. -1 • -6.
-L4. -19. -26. -22.
10. O.
l317.
...1 E I Illl~CHES)
6.96527E-07 4.98283E-06 7.8B,)60E-06 1.12308E-O' 1.413351:-05 1.63S88E-Oj 1.52S22E-05 1.50261E-05 1.52!t34E-05 1.3B541E-05 8.84801E-06 5.7=J778E-Oo 4.36:J68E-06 3.46159E-06 2.74154E-06 2.14215E-06 1.56004E-06 1.00S96E-06 8.45994E-01 4.81208E-Ol 2.40604E-07
-2.32S42E-08 -1.00B98E-07 -2.11320E-Ol -3.02695E-Ol -4.03594E-07 -3.41502E-Ol
1.55228E-07 1.7b141E-09
151
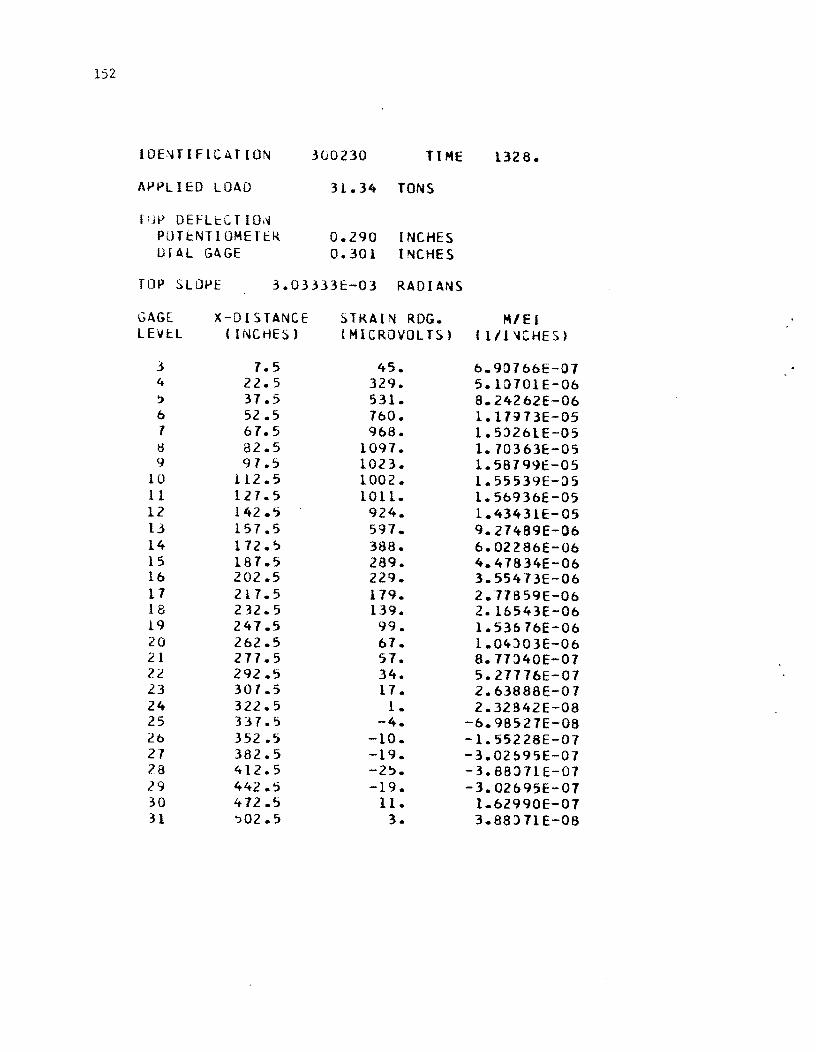
152
I DE,'H I Fie A r ION 3(j0230 TIME 1328.
APPLIED LOAD 31.34 TONS
[;JP DEfLl:CTlm~
PUT t:NTI UHE T ER 0.290 INCHES UIAL Gb.GE 0.301 INCHES
TLJP SLOPE 3.03.3.33E-03 RADIANS
GAGE X-DISTANCE STKAIN RDG. HIE I LEVEL (INCHES) (MICROVOLTS) ( 1/1 '4CHES)
.3 1.5 45. b.901bbE-01 4 22.5 329. 5.1G701E-Ob ) 37.5 531. 8.24262E-06 b 52.5 7bO. 1.11973E-05 7 61.5 9b8. 1.5:>2b1E-05 tj 82.5 1091. 1.70363E-OS <:} 97.5 1023. 1.58199E-05
10 112.5 1002. 1.55539E-G5 11 127.5 1011. 1.5b93bE-05 12 142. '> 924. 1.43431E-05 13 157.5 591. 9.27489E-06 14 172.5 388. 6.0228bE-Ob 15 187.'> 289. 4.47834E-Ob 1b 202.5 229. 3.55413E-Ob 17 217.5 119. 2.11S59E-Ob 18 232.5 139. 2. 16543E-Ob 19 247.5 99. 1.53b7bE-Ob 20 2b2.5 61. 1.04)03E-Ob 21 271.5 57. 8.17J40E-01 22 292.5 34. 5.27776E-01 23 307.S 17. 2.6388BE-01 24 322.5 1. 2.32842E-OB 25 337.5 -4. -b.98521E-08 2b 352.5 -10. -1.55228E-01 21 382.5 -19. -3.02095E-01 28 412.5 -25. -3.BBJ11E-07 29 442.5 -19. -3.02695E-01 30 412.5 11. 1.62990E-01 31 'J02.5 3. 3.88)11E-OB
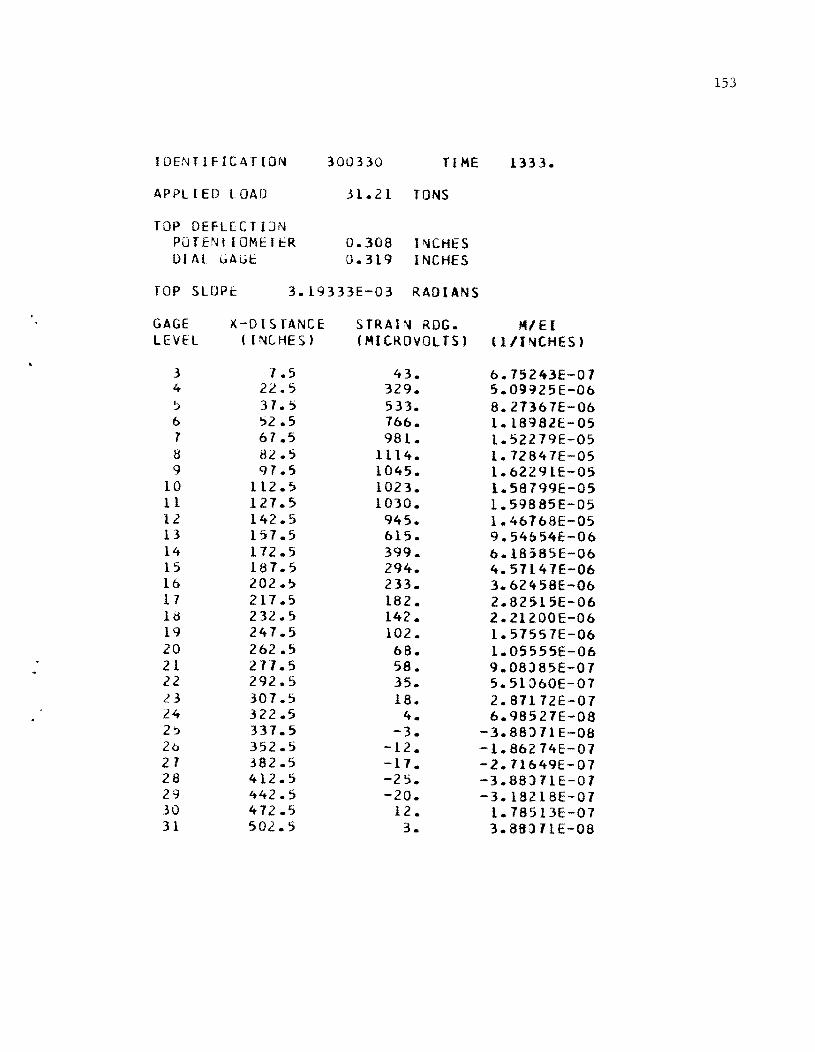
153
IDENTIFICATION 300330 TI ME 1333.
APPLIED LOAD .31.21 TONS
TOP DEFLECTIJN POTENIIOMETt:R 0.308 I~CHES OJAL (jA(jt: 0.319 INCHES
fOP SLOPt::: 3.19333E-03 RADIANS
GAGE X-D I S rANCE STRAIN RDG. 141 E I LEVEL ( I NC HE S ) (MICROVOLTS' (1/INCHES)
3 1.5 43. b.75243E-01 4 22.5 329. S.09925E-Ob ~ 37.5 533. 8.273b7E-Ob b ")2 .5 7bb. 1.1898lE-05 7 67.5 981. 1.52279E-05 8 82.5 1114. 1.72847E-OS 9 97.5 1045. 1. b2291E-05
10 112.5 1023. l.58799E-05 11 127.5 1030. 1.59885E-05 12 142.5 945. 1.4b7b8E-05 13 157.5 b15. 9.54b54E-Ob 14 172.5 399. b.18585E-Ob 15 187.5 294. 4.57L47E-06 16 202.!> 233. 3.62458E-Ob 17 217.5 182. 2.825L5E-06 Id 232. '.) 142. 2.21200E-06 19 247.5 102. 1.S7SS7E-Ob 20 2b2.5 bB. 1.05S55E-06 21 211.5 58. 9.08J85E-07 22 292.5 35. S.5l0bOE-07 l3 307.5 18. 2.87172E-07 2.4 322.5 4. 6.98527E-08 2') 337.5 -3. -3.88) 71 E-08 20 352.5 -12. -1. 8b2 74E-07 27 382.5 -17. -2.71b49E-07 28 412.5 -25. -3.88l71E-01 29 442.5 -20. -3.18218E-Ol 30 472.5 12. l.785I3E-07 31 502.5 3. 1.88JI1E-08

154
IUE"HIFl::AT{ON 300430 TIME 133B.
APPLIED LOAD 31.31 TONS
fOP DEFLt::CTION PUTENTILlMI::TER 0.323 INCHES DIAL GI\ GE 0.335 INCHES
TOP SLOPE 3.25000t:-03 RADIANS
GAGE X-DISTANC!: 5TRA1N RDG. M/EI U:VEL (INCHES) (MICROVOLTS) (1/l\4CHES)
3 7.5 43. b.b7482E-07 4 22.5 330. 5.13029E-06 '> 37.5 539. B.36b80E-Ob b 52.5 179. 1.21000E-05 7 67.5 1000. 1.55306E-05 8 82.5 1140. 1.76883E-05 9 97.5 1075. 1.66870E-O'.)
10 112.5 1052. 1.63300E-05 1 1 127.5 1059. 1.64464E-05 12 142.5 974. 1.51192E-05 13 157.5 642. 9.96566E-06 14 172.5 414. 6.42b45E-06 15 187.5 307. 4.75775E-06 16 202.5 240. 3.13324E-06 17 217.5 187. 2.9:l277E-06 18 232.~ 146. 2.26633E-06 19 247.5 103. 1.60b61E-06 20 262.5 71. 1.0:}436E-Ob 21 277.5 60. 9.39131E-07 22 292.5 37. 5.74345E-07 23 307.5 19. 2.94934E-07 24 322.5 5. 7.7b141E-08 25 337.':) -3. -5.43299E-08 26 352.5 -10. -1.55228E-07 27 382.5 -17. -2.63B88E-Ol 28 412.5 -25. -3.95832E-07 29 442.5 -19. -2.94934E-Ol 30 472.5 13. 2.0~558E-07 31 502.5 4. 6.98527E-08

APPLIED LOAD
fUP DEfLI::CrllJ~
PJTENTIDMElt=r{ DIAL G~GE
300530 TIME
31.11 fONS
0.327 INCHES 0.339 I~CHE5
3.33000E-03 RADIANS
GAGE LEVEL
3 4 5 b 7 (i
9 10 II l2 l3 l4 15 16 1 7 18 19 20 21 22 23 24 2~
26 27 28 29 30 31
X-DISTANCE (L'4CHES)
7.5 22.5 37.5 ':>2.') 67.') ~2.,)
97.5 1 U .• 5 127.5 142.5 157.5 172.5 181.5 202.5 2t7.5 232. ') 247. ~ 262 • ~ 217.5 212.':> 307.5 122.'::> 3 H.5 352.5 38~. 5 ' .. 12.5 442.5 472. ':) 502.5
STRAIN RDG. (MICKOVDLTS)
44. 330. 537. 780. 99B.
l141. 1080. 1056. l064. 980. 650. 417. 312. 244. 191. 149. 108.
75. 62. 40. 2.2. 6. O.
-9. -14. -23. -19.
l2. 2.
1341.
M/Et ( 1 II '4CHE5)
6.83)04E-07 5.13029E-06 8.33516E-Ob 1.21378E-05 1.S4~95£-05
1.71193£-05 1.675b9t:-05 1.63~21E::-J5
1.65163£-05 1.52124E-05 1.00S21E-05 6.47302E-Ob 4.84312E-06 3.1=JJ33E-06 2.97262E-06 2.32066£-06 1.b7~41E-Ob
1.16421E-D6 9.b2415E-07 6.13152E-07 3.41502£-07 1.00398E-07 7. 76141E-09
-1.39705E-07 -2.2538IE-07 -3.49264E-07 -3.02~q5E-01
1.94::>35E-07 3.10457E-08
155

156
IDE\! Tl F leA r 'ON
APPLII: D L DAI)
fOP DEFLECTID"4 POTENflLJMETER DIAL (jA~E
300630 TI ME
31.16 ro~s
0.336 INCHES 0.347 INCHES
fOP SLOPE 3.4l000E-03 RADIANS
3 4 ')
6
7 8 9
Iv 11 12 13 14 15 16 17 1 ~ 19 20 21 22 23 24 25 26 27 28 29 30 31
X-DISTANCE (INCHES'
l.5 2~.5
H.'::> ':>2.'::> 67.5 82.5 97.5
112.5 127.5 142.5 1':>1.5 172.5 187.5 202.5 217.5 232.5 241.5 2.62.5 277.5 292.5 307.5 32l.5 337.5 352.5 382.~
412.5 442.5 472.5 502.')
STRAl\1 RDG. (MICROVOLTS)
44. 332. 544. 187.
1015. 1160. 1101. 1079. 10d9. 1003. 674. 430. 320. 251. 195. 153. 10~.
13. 62. 39. 20. 4.
-3. -10. -18. -26. -21.
13. 3.
1350.
""EI U/1 ~CHES)
6.83004E-07 5.15358E-06 8.43666E-06 1.221651:-05 1.57b34E-O, 1.8J142E-05 1.70~06E-05 1.67414E-05 1.69J44E-05 1.55~94E-05 1.04101E-05 6.67482E-06 4.96731E-06 3.89bZ3E-06 3.0269'E-06 2.37499E-06 1.69199E-06 1.12541E-Ob 9.1D116E-01 5.97;29E-01 3.18218E-07 6.98521E-08
-3.BSll1E-08 -1.47461E-07 -2.81172E-07 -4.11355E-07 -3.25~19E-Ol
2.09558E-07 5.43299E-08
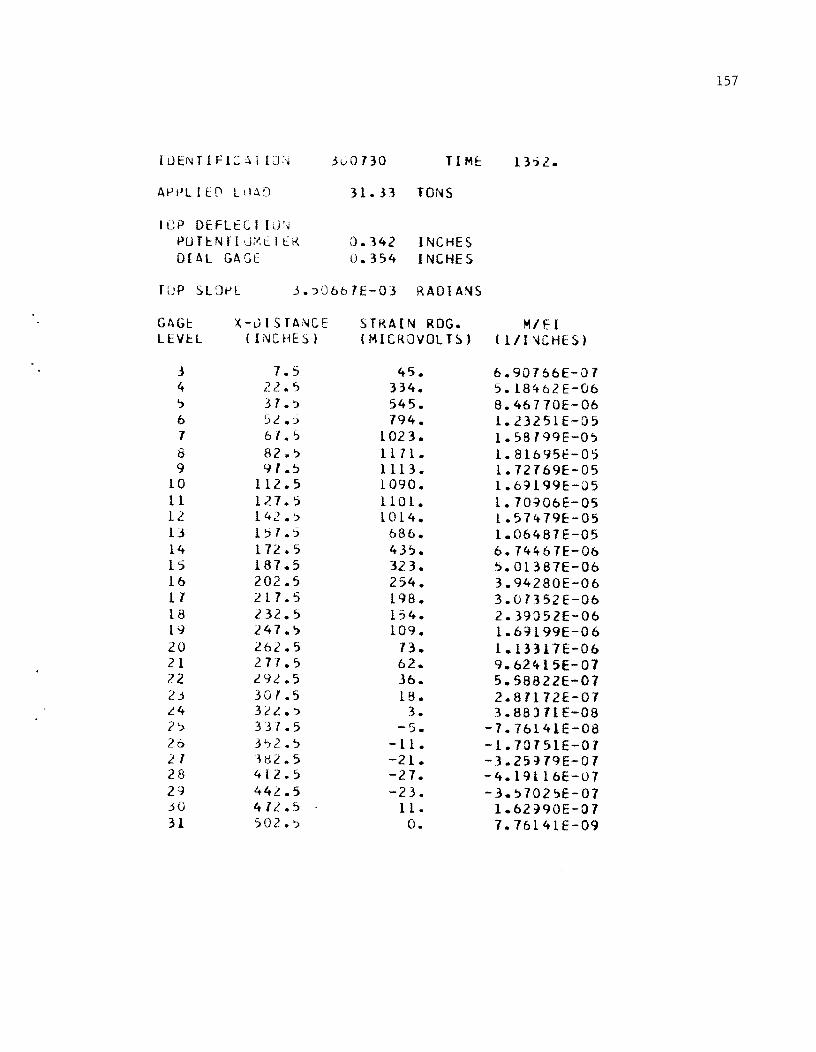
1 U EN r I FIe :'\ r I J '"
APPLIED LilAD
I CP DEFLtC T I U\J i>U r I:: N rI d:-: i It K DIAL GAGE
31..10130 TIME:
31.33 TONS
0.342 INCHES 0.354 INCHES
TOP SLOf-'[ J.~G6b7E-03 RADIANS
GAGt: lEVI::L
j
4 '> 6 1 8 9
10 11 12 13 14 15 16 1 1 18 lY 20 21 22 23 L4 2'> 2t> 2. 1 28 29 30 31
x-tJ I S TMIiCE (INCHES)
7.5 22.') 37.') 5.:::'.) 61.':> 82.~
'H .5 112.S 127.5 142.,> IS7.:> 172.5 187.5 202.5 2l7.5 2. 32. '> 247.'> l62..5 277.5 29.:::'.5 307.5 322.j 337.5 3')2.') "iti2.S 412.5 442.S 41.:::'.5 502.~
STRA[N RDG. (MICROVOLTS)
45. 334. 545. 194.
1023. II 71. 1113. 1090. llO 1. 10l4. 686. 435. 323. 254. 198. 154. 109. 13. 62. 36. lB. 3.
-5. -11. -21. -27. -23. ll.
O.
13,2.
M/EI (llI'-lCHES)
6.90166E-01 5.184-62E-06 8.46770E-06 1.23251E-05 1.5B199E-05 1.81695E-05 1.72169E-05 1.6~199E-05
1.70~06E-05 l.S7479E-OS 1.06487E-05 6. 744-67E-06 5.01387E-06 3.94280E-06 3.07352E-06 2.390S2E-06 1.6~199E-06
1.13317E-06 9.624-1SE-07 5.58822E-07 2.81172E-01 3.8Sl71E-08
-7.76141E-oa -1.70751E-01 -3.25:J19E-01 -4.19116E-07 -3.'>7025E-07
1.62:J90E-07 7.76141E-09
157

158
IUENTIFICATION 30GenO TIME 1356.
APPL I E:D L LlAU .H.14 TONS
lOP DEFLECTION POTENTIOMETER 0.348 INCHES DIAL ";A::;E 0.360 INCHES
fOP SLOPE 3.56333E-03 RADIANS
GAGt:: X-DISTANCE STRAP~ RDG. .. lEI LtVEL ( INCHES) (MICROVOLTS) U/I"CHES)
3 1.5 46. 1.06289E-01 4 22.5 332. 5.14582E-06 5 31.5 544. 8.44\42E-06 6 52.5 191. 1.22863E-05 1 61.5 1023. 1.58816E-05 b 82.5 1173. 1.82l83E-OS 9 91.5 1117. 1.73390E-05
10 112.5 1093. 1.69665E-05 1 1 121.5 1104. 1.71372E-OS 12 14.2.5 1023. 1.58121E-05 13 151.5 693. 1.07\96E-05 14 112.') 438. 6.79900E-06 15 181.5 325. S.03116E-06 16 .202.5 256. 3.97384E-06 17 211.5 198. 3.08128E-06 18 232.5 154. 2.39l52E-06 19 247.5 109. 1.69:)15E-06 20 262.5 14. 1.14093E-06 71 217.5 61. 9.54~54E-01 22- 292.5 36. S.66583E-Ol 23 307.5 19. 2.94~34E-01 24 322.5 3. 3.88071E-08 25 331.S -4. -6.2:1113E-08 26 352.5 -12. -1.94J35E-01 21 382.5 -20. -3.10451E-07 28 412.5 -26. -4.11355E-07 29 442.5 -22. -3.41S02E-07 30 472.~ 12. 1.86274E-01 31 502.5 1. 1.55228E-08

(O[\jTIFI::::AfIJN
APtJLIED LuAU
fLlP Lh:FLt~rlY~
PuTENll]Mf:Tr:K DIAL ~A~;E
300"130 TI ME
31.44 TONS
0.357 I'4CHES 0.370 INCHES
TUP SUJP[ 3.630uOE-03 RADIANS
GAljE LEvEL
3 4 :)
6 7 c3 9
10 1 1 12 13 14 15 l6 17 IS 19 ~O
21 22 l3 24 25 2.0 27 2d 29 30 3L
x-lJISTA'\ICt (I'\lCHt:~)
7.S 22.':> 37.5 '>2.'5 61.';) 82.5 Y 7 •. ')
112.'J 127.') 142.5 157.5 112.5 187.5 202.':> 2l7.5 232.5 247.5 262.5 2. 7 7.5 292..5 307.5 322.5 331.5 3:'2.5 j82.5 4l2.~
442.5 472.5 502.'-)
STKAIN ROG. (MICROVOLTS'
44. 334. 551. 80l.
l031. 1191. 1134. 1111. 1126. 1045. 110. 450. 333. 262. 204. l58. 113.
78. 64. 40. 22. 4.
-1. -10. -19. -25. -22.
13. 3.
1359.
MI E I (til ~CHES)
6.83004E-07 5.1B!t62E-06 8.54532E-06 1.24415E-05 1.60:)72E-05 1.84954E-OS 1.76l06E-05 1.72459E-05 1.74187E-05 1.62291E-05 1.10212E-05 6.98521E-06 5.11586E-06 4.0669aE-06 3.15990E-06 2.45261E-06 1.75408E-06 L.20J02E-06 1.0:H22E-06 6.13152E-01 3.41502E-01 6.99521E-08
-1.55228E-08 -1.41467E-01 -2.94:)34t:-01 -3.95B32E-07 -3.33741E-01
2.09558E-01 3.88J71E-Oti
159

160
lOENTIFICATION 301030 TI ME 1421.
API'LIED LOAD 31.13 TONS
TLlP DEFLECTION POTENrI OM': H::R 0.351 INCHES DIAL GAGE 0.364 INCHES
lOP SLUP!: 3.t:dOOOE-03 RADIANS
GAGE X-DISTANCE STRAP~ KDG. M/Ef LEVEL (INCHES) (MICROVOLTS) 11/I'1CHES)
3 7.5 45. 6.9B521E-Ol 4 22.".> 335. 5.19239E-06 5 31.5 552. 8.56860E-06 6 52.5 800. 1.2"183E-05 1 61.5 1031. 1.60118E-05 8 82.5 1186. 1.84118E-05 9 91.5 1136. 1.76339E-05
10 L12.5 1116. 1.13235E-05 11 121.5 1133. 1.15951E-05 12 142.5 1057. 1.64154E-05 13 157.5 121. 1.11~42E-05 14 112.5 458. 1.10~46E-06 15 181.5 343. 5.31!>51E-06 16 l02.5 211. 4.2:)~69E-06 11 211.5 215. 3.32965E-06 18 232.5 169. 2.62336E-06 19 241.5 124. 1.93259E-06 20 262.5 88. 1.31311E-06 21 217.5 14. 1. 14869E-O'6 22 292.5 49. 7.60619E-07 23 307.5 30. 4.65685E-01 24 322.5 14. 2.25081E-07 25 331.5 6. 8.53156E-08 26 352.5 -1. -1.1b!t21E-Ol 27 382.5 -11. -2.63888E-07 28 412.':> -26. -4. 11355E-01 29 442.5 -24. -3.72548E-01 30 412.5 14. 2.11320E-Ol 31 502.5 4. 6.20913E-08
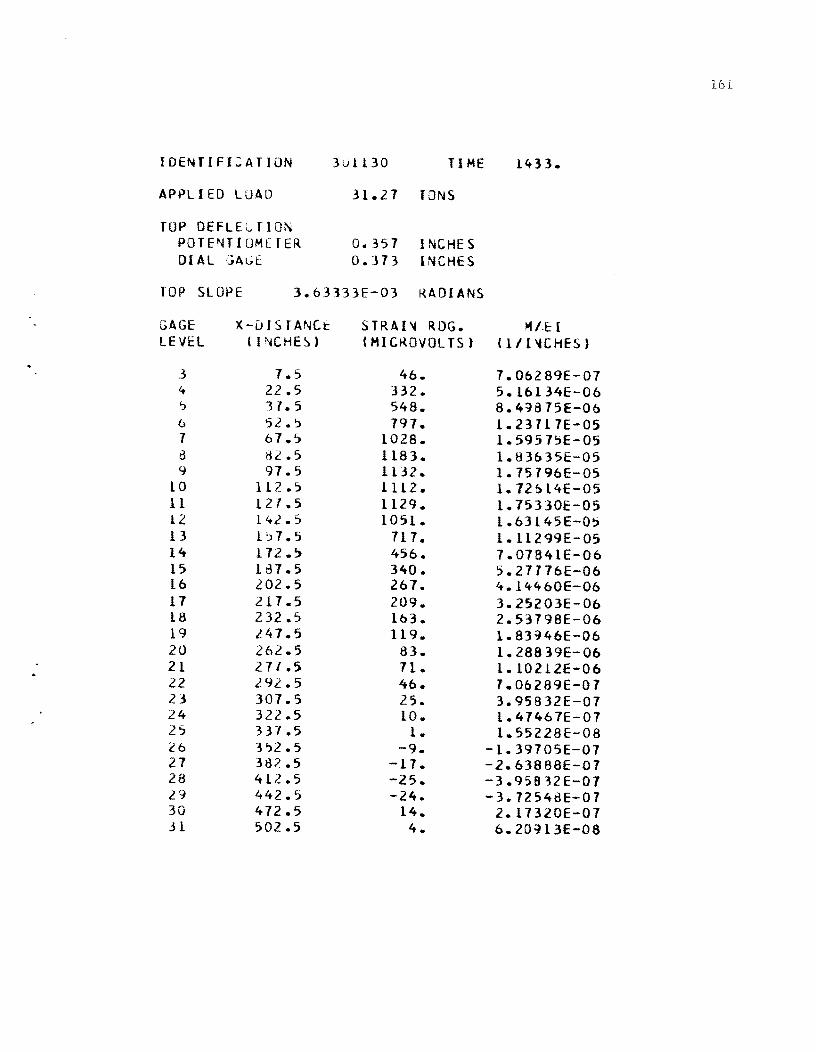
IDENTIFI':ATION
APPL I ED L DAD
fOP DEFLEl,flON POTE~TIOMETER
DI AL ';A~E
301130 TIME
31.21 TONS
0.351 INCHES 0.313 INCHES
TOP SLOPE 3.63333E-03 ~ADIANS
GAGE LEVEL
.3 4 ')
()
7 a <1
10 11 12 13 14 15 16 17 18 19 20 21 22 23 24 25 26 21 28 29 30 .:H
)(-i) I Sf ANCt: lIr-;CHES)
1.5 22.5 37.5 52.'> 61.'> 8L.5 91. 5
112.'> 127.5 142.5 1':>1.5 112.5 1131.5 202.5 211.5 232.5 2.47.5 262.5 211.5 l<1L.5 301.5 322.5 337.5 3 ')2.5 381..5 412.5 442.5 412.5 502.5
S T R A I'~ R OG. (MICKOVOLTS)
46. 332. 548. 191.
1028. 1183. 1132. 1112. 1129. 1051.
111. 456. 340. 267. 209. 163. 119.
83. 71. 46. 25. 10. 1.
-9. -17. -25. -24.
14. 4.
1433.
~/.E I ll/1'4CHES)
7.0b289E-07 5.1b134E-06 8.4~875E-06
1.23717E-05 1.59575E-05 1.83b35E-05 1.75796E-05 1.72bl4E-05 1.75330E-05 1.63145E-05 1.11299E-05 7.07841E-06 5.27776E-06 4.14460E-06 3.25203E-06 2.53798E-06 1.83~4bE-06
1.28839E-06 1.10212E-06 7.06289E-01 3.95832E-01 1.47467E-07 1.55228E-08
-L.39705E-07 -2.63888E-07 -3.95B32E-01 -3.7254t:1E-07
2.11320E-07 6.20~13E-08
161

162
1 DEN r I FIe A r IDN 301230 TIME 1435.
APPLIED LOAD 31.34 TONS
rop DEFLEC r IJN purENTIOMETtR 0.361 I"tCHES DIAL GAGE 0.378 INCHES
rup SLUPe 3.b8333E-03 RADIANS
ljf\GE X-DISTANCE STRAIN RDG. HI E I LEVEL (INCHES) (MICROvOLTS) (l/l~CHES)
.3 1.5 45. 6.98521E-07 4 22.5 332. 5.16134E-06 '.> 37.5 549. 8.52203E-06 6 52.':> 800. 1.24260E-05 1 67.5 1033. 1.6Jr.28E-05 8 82.'.> 1193. 1.85110E-05 9 97.5 1142. 1.71211E-05
LO 112.5 1121. 1.74:111E-05 1 l l21.5 1141. 1.71193E-05 12 142.5 1063. 1.65008E-05 L3 157.5 126. 1.12113E-05 14 1 72.5 463. 1.11~31E-06 15 187.5 346. 5.37090E-06 16 202.5 212. 4.22991E-06 17 2l7.5 212. 3.29860E-06 18 232.5 166. 2.51619E-06 19 247.5 l21. 1.81826E-06 20 262.5 85. 1.31~44E-06 21 211.5 7l. 1.ll988E-06 22 292.5 41. 1.21812E-01 23 307.5 29. 4.42401E-01 24 322.5 12. 1.18513E-01 25 337.5 3. 5.43299E-08 26 352.5 -8. -1.24183E-01 27 382.5 -16. -2.48365E-01 L8 412.5 -24. -3.12548E-01 29 442.5 -23. -3.49264E-01 30 472.5 13. 2.09558E-01 3l 502.5 1 • 2.32842E-08

[ 0 EN T ( FIe A Tl 0 I\J
APPLI ED LOAD
TDP OEFLECTILJ~
PUTENTIOMETER DIAL GAGE
3J1330 TIME
31.20 TONS
0.364 INCHE S 0.381 INCHES
IDI-' SLOPE 3.69333E-03 RADIANS
GAGt LEVEL
j
4 ~
6 7 H 9
Lu 1 1 12 13 14 1~
16 17 18 1'J 20 21 22 23 24 25 26 27 28 29 30 31
X-DISTANCI::: ( I NCHE S)
7.5 22.5 37.S 52. 'j 6/.5 82.5 ~7.5
112.5 127.5 142.5 1'>7.5 172.5 1~7.S
202.5 217.S 232.5 247.5 262.5 277 .S 2q2.5 307.S 322.5 ):17.5 3'>2.5 382.~ 412.':> 442.5 471.':> '>02.'>
STKAIN RDG. (MlCROVOlTSI
45. 331. 548. 798.
1033. 1191. 1144. 1122. 1142. 1067.
730. 464. 347. 27S. 212. 166. 120.
8S. 12. 47. 27. li. 3.
-8. -17. -26. -22.
15. 3.
14-38.
~/E(
1111 \jCHES ,
6.90166E-07 5.13806E-Oo 8.49875E-06 1.23872E-05 1.60351E-05 1. 84:.JS4E-OS 1.17j81E-OS 1.74L66E-05 L.77348E-OS 1.65106E-05 1.13317E-05 7.21035E-06 S.38b42E-06 4.2bl02E-06 3.29860E-06 2.57679E-06 1.85498E-06 1.31944E-06 1.1l164E-06 1.29S73E-Ol 4.19116E-07 1.62990E-07 4.65b8~E-08
-1.24183E-01 -2.71649E-01 -4.11355E-Ol -3.41502E-07
2.32842E-Ol 4.6568SE-oa
163

164
I D E~ r I F I :::. A TI J N 301430 TI ME 1440.
APPl I EO LOAD 30.94 TONS
TOP DEFLECT UN PuTENTI OMETER 0.365 INCHES DIAL GAGE 0.382 INCHES
TOP SLOPE 3.69333E-03 RADIA\lS
GAGE X-DISTANCE STRAIN ROG. HIEI lEVEL C 1 NC HES ) (MICROVOLTS' 'llI~CHES)
3 1.5 45. 6.9B)21E-01 4 22.5 329. 5.11~11E-06 oj 31.5 545. 8.46110E-06 6 52.5 195. 1.23~06E-05 1 67.5 1028. 1.59652E-05 8 82.5 1188. 1.84334E-05 9 91.5 1141. 1.71193E-05
10 112.5 1123. 1.14244E-05 11 12"/ .5 1143. 1.71~26E-05 12 142.5 1066. 1.65396E-05 13 151.5 134. 1.13860E-05 14 112.5 461. 1.25692E-06 15 181.5 350. 5.44075E-06 16 202.5 216. 4.21f,54E-06 11 217.5 214. 3.32189E-06 18 232.5 169. 2.61560E-06 19 247.5 121. 1.81B26E-06 20 262.5 84. 1.30392E-06 21 217.5 11. 1.10988E-06 22 292.5 41. 7.29573E-01 23 301.5 21. 4.1~116E-Ol 24 322.5 10. 1.41~61E-01 2~ 331.5 1. 2.32842E-08 26 352.5 -8. -1.24183E-Ol 21 382.5 -6. -9.31310E-08 28 412.5 -14. -2.11320E-07 29 442.5 -11. -1.62990E-07 30 412.5 23. 3.51325E-Ol 31 502.5 13. 2.09558E-07

IIJE:\,jl1FIC..\TI()~
APlllIED LOAD
TOP DEFLECT 1].\j
PUTtNTrOML1ER DiAL GA.;E
301';)30 TIME
31.33 TONS
0.371 INCHES 0.38b INCHES
TOP SLOPE 3.7bbb7E-03 RADIANS
GAGE LEVEL
3 4 ':)
6 1 8 9
10 11 12
. 13 14 15 Ib 11 18 19 20 21 22 23 24 25 26 21 28 29 30 31
X-DISTANCE ( I NCHE;) J
7.5 22.5 37.5 :'2.5 67.5 82.5 97.':>
112.5 127.':> 142.5 157.5 17L.5 187.5 202.5 211.5 232.5 247.5 262.5 277.5 292.5 307.5 322.5 337.5 352.5 382.':> 412.5 442.5 412.5 502.5
STRAIN RDG. (MICROVULTS)
45. 335. 551. 803.
1037. Ipn. 1153. 1131. 1154. 1079.
739 • 474. 353. 280. 219. 172. 12b. 89. 77. 51. 30. 13. 4.
-4. -5.
-13. -11.
22. 14.
14!t7.
MI E I (l/l'4CHES)
b.9'J16bE-07 5.20015E-Ob 8.55308E-Ob 1.Z4548E-05 1.b0972E-OS 1.8588bE-05 1.78~18E-05
1.75563E-05 1.79211E-OS 1.b1414E-05 1.14114E-05 7.3500bE-06 5.4795bE-Ob 4.35415E-06 3.3-1174E-06 2.6b9<HE-06 1.95S88E-06 1.38:.J29E-Ob 1.18150E-Ob 7.91b64E-07 4.73446E-07 2.01197E-07 6.98'27E-08
-6.98527E-08 -1.76L41E-0t! -2.09558E-07 -1.62990E-07
3.33741E-07 2.17320E-07
165

166
I 0 EN T I F 1 :: A T [ 0 N 301630 11 ME 1ft-54.
APPLIED LOAD 31.02 TONS
TOP OEFL EC r ION POTI:::NTIDMEIER 0.370 INCHES OIAl GAGE 0.387 INCHES
TUP SLOPE 3.73000E-03 RADIANS
~AGE X-DISTANCE STRAIN ROG. "'" E I lEVEL (INCHES) (MICROVOLTS) (l/I~CHES)
3 1.5 46. 7.06289E-07 4 22.S 329. 5.11 It 77E-06 5 37.5 547. 8.48323E-06 6 52.5 795. 1.23406E-05 7 67.':> 1030. 1.59885E-05 8 82.5 1189. 1.84566E-05 9 97.5 1144. 1.77581E-05
10 112.':> 1128. 1.1'J<:ISE-05 11 127.5 114<:1. 1.78ft35E-05 12 142.5 1074. 1.66715E-05 13 157.~ 739. 1.14791E-05 14 172.5 411. 7.31125E-06 1~ 187.5 353. 5.41956E-06 Ib 202.5 280. 4. 34639E-06 17 217.5 218. 3.383<:18E-06 18 232.5 170. 2.63888E-06 19 247.~ 123. 1. <:10 ~ 3 1 E - 06 20 262.5 88. 1.35825E-06 21 277.5 74. 1.14869E-06 22 292.5 49. 7.68380E-07 23 307.5 28. 4.34639E-07 24 322.5 11. 1.62'190E-07 25 337.5 3. 4.65685E-08 26 352.':> -8. -1.31~44E-07 21 382.5 -18. -2.81112E-07 28 412.5 -26. -4.11355E-07 29 442.5 -23. -3.49264E-07 30 472.5 14. 2.25D81E-01 31 502.5 3. 3.88)71E-08

IDENTIFICATION
APPLIED LOAD
lOP DEFLECliON PUT ENT I OM E H:R DIAL ';AGE:
101730 TtME
31.01 TONS
0.371 INCHES 0.389 I~CHES
lOP SLOPE 3.926&1E-03 RADIANS
GAGE LEVEL
3 4 ')
b
1 h 9
10 1 1 12 1.3 14 15 16 1 7 18 19 20 21 22 23 l.4 2~
26 27 28 L9 30 31
X-DISTANCE (INCHES)
7.'j 22.5 37.5 ')2.5 67.5 82.5 'J7.'.>
112.5 127.~
142..5 157.5 172. ':) 187.5 202.5 211.5 232.:> 241.5 262.5 217 .5 292.5 307.5 322..5 337.5 352.5 382.5 412.5 442.5 472.5 502.5
STRAIN ROG. (MICROVOLTS)
45. 329. 546. 798.
1035. 1199. 1155. 1140. 1163. l089.
7'.:)1. 479. 359. 284. 220. 113. l25. 88. 74. 48. 2Y. l2. 1.
-8. -17. -26. -24.
14. 3.
1't56.
"'ti ( 111 ~CHES )
6.98521E-07 5.l010lE-06 8.47546E-06 1.23B12E-05 l.60139E-05 l.86ll9E-05 1.79366E-05 l.76883E-05 1.80453E-05 1.69)44E-05 1.16576E-05 7.43543E-06 5.57270E-06 4.41b24E-06 3.42278E:-06 2.68545E-06 1.94BlIE-06 1.37377E-06 1.14B69E-06 7.52357E-07 4.50l62E-07 1.78513E-07 2.32342E-08
-1. 2H B3E-07 -2.63888E-07 -4.03594E-07 -3.72548E-07
2.25J81E-07 5.43299E-08
167

168
IDENTIFICATION 301830 T!ME 1458.
APPLIED LOAD 30.87 TONS
lUP DEFU:CTIO~ POTENTlm~ETER 0.375 INCHES DIAL GAGI:: 0.392 INCHES
lOP SLOPE: 3.756671:-03 RADIANS
GAGE X-DISTANCE STRAIN RDG. M/EI LEVEL CINCHES) «MICROVOLTS) ( l/l'lCHES )
3 7.? 45. 6.98527E-07 4 22.5 329. 5.09925E-06 , 37.5 547. 8.4B323E-06 6 ?2.5 801. 1.24338E-OS 7 67.5 1040. 1.61360E-O~ 8 82.5 1204. l.86~12E-05 '1 97.5 1164. 1.8l!J86E-05
10 112.5 1149. 1.18351E-05 II 121.5 1116. 1.82b26E-05 12 142.5 1106. 1.11605E-05 13 151.5 165. l.l8B21E-05 14 172.5 489. 1.59842E-06 Ij 187.5 361. 5.68~12E-06 16 202.5 290. 4.!>l162E-06 17 217.5 221. 3.52368E-06 L8 232.5 177. 2.14154E-06 19 247.5 130. 2.01791E-06 20 262.5 93. 1.44362E-06 21 211.5 81. 1.24959E-06 22 292.5 53. 8.2Z110E-01 23 307.5 33. I).04492E-Ol 24 322.5 13. 2.09558E-07 25 331.5 I). 1.1bl41E-08 26 352.5 -b. -8.5375bE-08 27 382.5 -16. -2.48365E-07 28 412.5 -26. -4.03594E-01 29 442.5 -23. -3.49264E-07 30 412.5 17. 2.63888E-07 31 502.5 4. 6.98527E-08

169
1 L) ['~ r I F 1 c, A T [ J ''l 301930 TIME 1519.
APPLIED LOAD 31.2:' TONS
lOP DEFLi::CJ[JN PUTiN rl OME TEl< 0.318 INCHES DIAL G\GE 0.395 INCHES
lUP SLOPI:: 3.19333E-03 RADIANS
GAGt: X-DISTANCE STRAIN RDG. MI E I LEVtL (INCHES) (MICROVOLTS) (lll~CHES.
3 7.5 46. 1.00289E-07 4 ,U.S 332. 5.14582E-06 ':> 37 .5 5:>2. 8.51636E-06 6 52.5 809. 1.25580E-05 7 07.5 10S5. 1.63166E-05 d 82.5 1233. 1.91396E-05 9 97.':> 1195. 1.H5515E-05
10 112.5 1182. 1.83551E-05 lL 127.5 1214. 1.88441E-0~ 12 142.5 1145. 1.11659E-05 13 157.5 792. 1.23316E-05 14 1 72.5 509. 7.90112E-06 15 187.5 382. 5.Y2912E-06 16 202.5 304. 4.12610E-06 11 211.5 231. 3.61B91E-06 18 232.5 188. 2.91829E-06 19 247.5 138. 2.13439E-06 20 262.5 100. 1.50J04E-Ob 21 217.5 81. 1.35049E-06 22 292.5 59. 9.15641E-01 23 307.5 36. 5.66583E-01 24 322.5 18. 2.1~411E-01 25 .3 37.5 10. 1.55228E-01 20 352.5 -3. -3.88011E-08 21 3H2.5 -15. -2.32842E-01 28 412.5 -26. -4.11355E-07 29 442.5 -24. -3.80309E-01 30 412.5 11. 2.S0121E-01 31 502.5 6. 9.31310E-08

170
IOE:NTIFl::AT(ON 302030 TIME 1528.
APPLIED LLlAO 31.67 TONS
fOP DEFLECTIUN PUTENTI OME T ER 0.382 INCHES DIAL GAGE 0.399 INCHES
TOP SLOPE 3.84000E-03 RADIANS
GAGE: X-DISTANCE S TRA P.l RDG. ~/EI LEVEL (INCHES) (MICH.OVOlTS) (l/I~CHES)
3 7.5 47. 7.21B12E-01 4 22.5 331. 5.23895E-06 5 31.5 562. 8.13159E-Ob 6 52.5 822. 1.21615E-05 7 61.5 1061. 1.65106E-05 8 82.5 1239. 1.92405E-05 9 91.5 1203. 1.8b740E-0'
10 112.5 1191. 1.84811E-05 11 121.5 1222. 1.89b89E-05 12 142.5 1150. 1.1B513E-05 13 151.5 199. 1.24021E-05 14 172.5 512. 7.93:J93E-06 15 187.5 383. 5.94524E-06 10 202.5 304. 4.12010E-Oo 11 217.5 231. 3.68661E-06 18 23~.5 181. 2.90211E-Oo 19 241.5 139. 2.1b543E-Oo 20 202.5 100. 1.55228E-Oo 21 271.5 86. 1.34212E-Oo 22 292.5 58. 8.92503E-01 23 301.5 35. 5.51060E-01 24 322.5 11. 2.b3888E-01 25 331.5 9. 1.39105E-01 26 352.5 -9. -1.39705E-01 21 382.5 -17. -2.63888E-01 28 412.5 -21. -4.19116E-01 29 442., -20. -4.03594E-01 30 412., 17. 2.11b49E-01 31 502.5 4. 6.20913E-08

I Dt;\! r I F- I C. A TI UN
APPLIED LOAD
rop DEFLECTIOI\I POTENTIOMETER DIAL GAGE
400140 TI ME
43.06 TONS
0.575 INCHES 0.596 INCHES
TOP SLOi>E 5.53667E-03 ~AD[ANS
GAGE: LEVEL
3 4 5 6 7 8 9
10 11 12 13 14 15 16 17 18 19 20 21 22 23 24 25 26 27 28 29 30 31
X-DISTANCE ( I NCHE S J
7.5 22.5 37.5 52.5 67.5 82.5 97.5
112.5 127.5 142.5 157.5 172.5 187.5 202.5 217.5 232.5 241.5 Z 62.5 277.5 291.5 307.5 322.5 337.5 352.5 382.5 412.5 442.5 472.5 502.5
STRAIN RDG. (MICROVOLTS)
55. 462. 803.
1212. 1606. 1874. 1868. 1890. 1900. 1843. 1371.
917. 711. 565. 436. 333. 241,. 191. 172. ll6. 75. 43. 25. 6.
-20. -41. -43.
33. 13.
15r.7.
'4IE[ (l/INCHES)
8.61517E-01 7.16379E-06 1.24()48E-05 1.88214E-05 2.4~314E-05
2.90898E-05 2.89B89E-05 2.93381E-OS 2.950llE-05 2.86086E-05 2.12318E-05 1.42267E-05 1.10367E-05 8.76264E-06 6.70795E-06 5.17686E-06 3.81B62E-06 3.05BOOE-06 2.66993E-06 1.80065E-06 1.17197E-06 6.61482E-07 3.95832E-Ol 8.53756E-08
-3.18218E-07 -6.36!t36E-07 -6.61482E-Ol
5.04492E-07 2.09558E-07
171
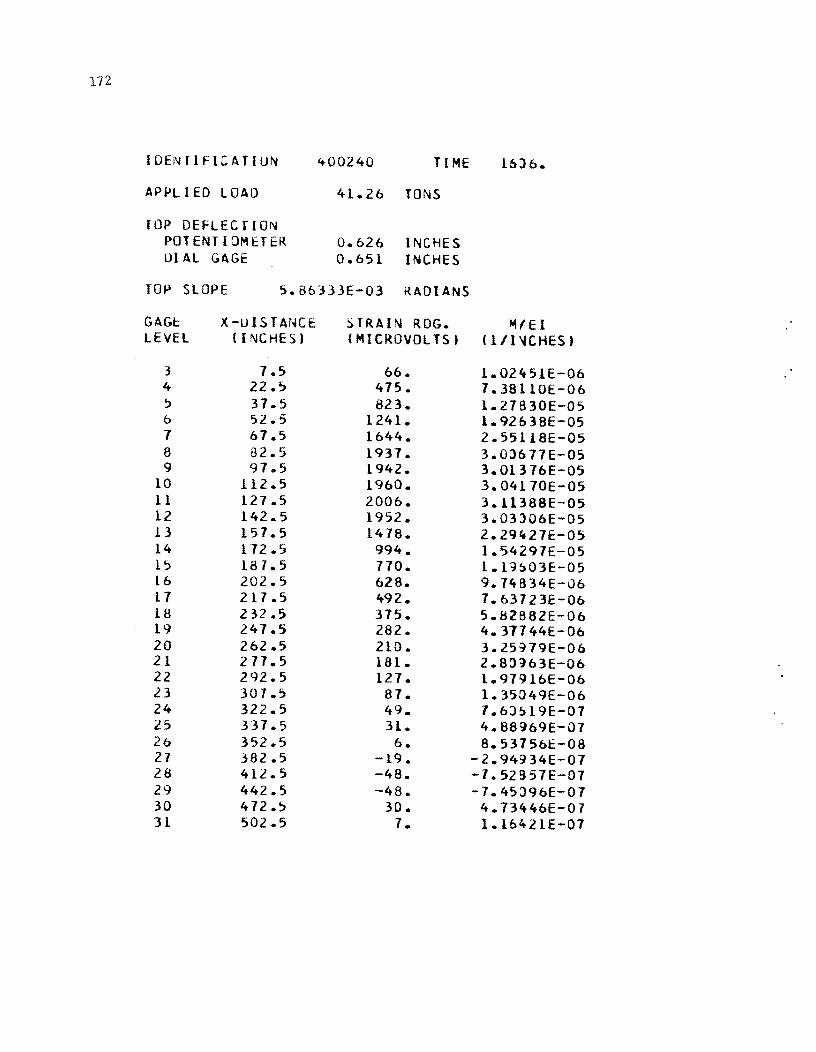
172
IDENTIFICATIUN 400240 TIME 16)6.
APPL I ED LOAD 41.26 TONS
rop DEFL E C Tl ON POTENTIOMETER 0.626 INCHES DIAL GAGE 0.651 INCHES
TOP SLOPE 5.86333E-03 RADIANS
GAG!: X-DISTANCE STRAIN ROG. ~/EI LEVEL ( INCHES' (MICROVOLTS) (lII '4CHES )
3 1.5 66. 1.02451E-06 4 22.5 415. 7.38110E-06 ~ 31.5 B23. 1.27B30E-05 6 52.5 1241. 1.92638E-05 1 61.5 1644. 2.55118E-05 8 82.5 1931. 3.0l617E-OS 9 91.5 1942. 3.01316E-05
10 112.5 19bO. 3.04110E-05 11 127.5 2006. 3.11388E-05 12 142.5 1952. 3.03l06E-05 13 151.5 1478. 2.29lt21E-05 14 112.5 994. 1.54297E-05 l~ 181.5 770. 1.19603E-05 L6 202.5 628. 9.1ltB34E-06 17 217.5 492. 1.63123E-Ob 18 232.S 315. 5.8lB8lE-Ob 19 241.5 282. 4.31744E-Ob 20 2b2.5 210. 3.25~19E-Ob 21 277.5 IB1. 2.8:H63E-Ob 22 292.5 121. 1.9791bE-Ob 23 307.5 81. 1.35049E-06 24 322.5 49. 7.6J!>19E-Ol 25 337.5 31. 4.8Bl}b9E-07 2b 352.5 b. 8.5375bE-08 27 382.5 -19. -2.94934E-Ol 2B 412.5 -48. -7.52S51E-Ol 29 442.5 -48. -7.45)9bE-07 30 472.5 30. 4.7344bE-07 31 502.5 7. 1.16421E-Ol

IUL~T[FI=ATILl,'i
rop lH:FLEC liON t>UTENTlOMET[~
UI AL ~A\;E
400140 J( ME
41.41 TONS
0.060 [NCHES 0.667 INCHES
TOP SLOPE 6.13000E-03 KADIANS
GAGE LEVEL
j
4 5 6 7 a 9
10 11 l2 13 14 15 16 l7 18 1'1 20 21 22 23 2.4 25 26 27 28 2'? 30 31
X-DISTANCE ( INCHE~)
7.':> 22.5 '37.5 52.5 67.5 82.5 97.5
il2.5 121.5 142.5 151.5 112.'> 181.'> 202.5 2l1.5 232.5 241.5 262.5 211.5 292.5 _i01 • ') 322.') 337.5 352.5 3112.5 412.5 442.5 472.5 502.5
STRAI'J RDG. (MICKOVDLTS)
68. 411. 8,2 b.
1251. 1663. 1968. 1918. 2009. 2060. 2010. 1536. 1031. 199. 655. 515. 396. 288. 212. 183. 125. 84. 46. 21.
3. -24. -49. -49.
30. 6.
1616.
~/E[
(1/1"4CHES)
1.06331E-06 1.41215E-06 1.28219E-05 1.94191E-05 2.58222E-0':> 3.05t't89E-05 3.01l19E-0'> 3. Llg31E-05 3.19110E-05 3.12.l86E-05 2.38431E-05 1.60J40E-05 1.24)21E-05 1.01615E-0~
1.98&50E-06 6.13~28E-06
4.41J51E-Ob 3.29084E-06 2.83292E-06 1.94J35E-06 1.30392E-06 1.14:>501:-01 4.1~116E-C7 3.8801lE-08
-3.12548E-07 -1 .. 60019E-01 -1.60019E-01
4.13446E-01 1.0J898E-01
173
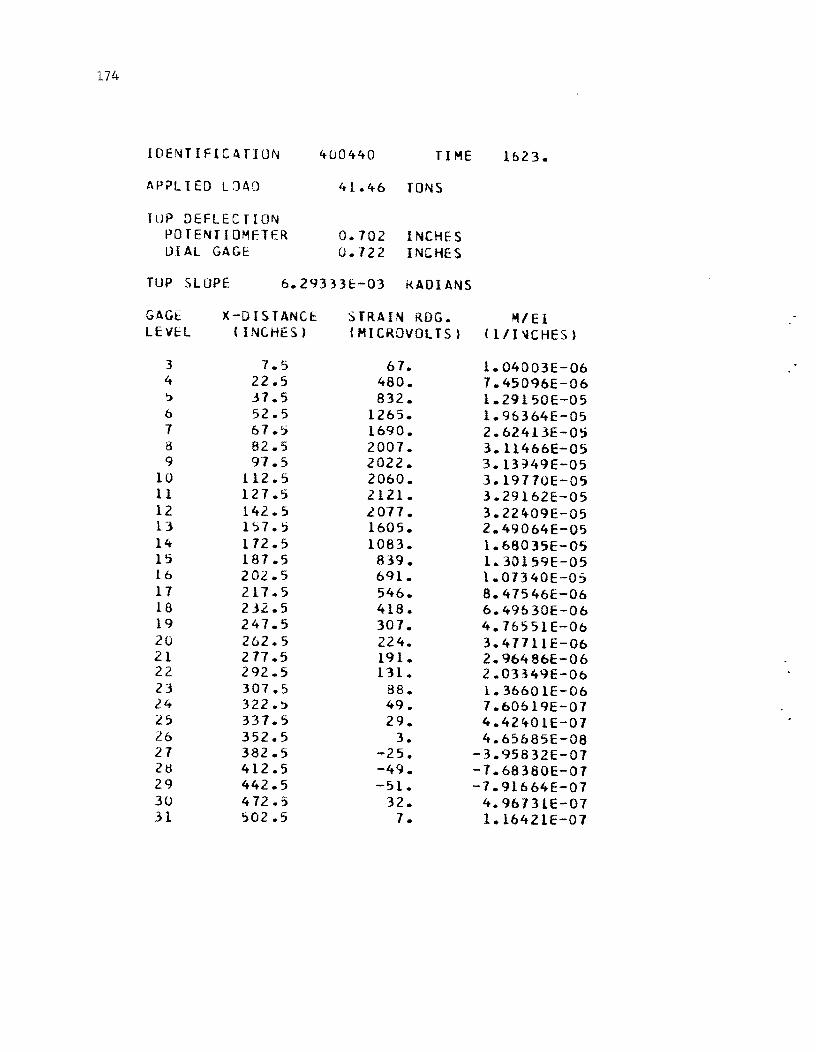
IDENTIFICATION 400440 TI ME 1623.
APPLIED L:JAO 41.46 TONS
TUP DEFLEC flON POTENTIOMETER 0.702 INCHES lHAL GAGE 0.722 INCHES
TUP SLOPE 6.293331:-03 RADIANS
GAGE X-DISTANCe: STRAIN RDG. /II/EI LEVEL (INCHES) (MICROVOLTS) (l/l~CHES)
3 7.5 67. 1.04003E-06 4 22.5 480. 7.45096E-06 ~ 37.5 832. 1.29150E-05 6 52.5 1265. 1.96364E-05 7 67.5 1690. 2.62413E-0~ 8 82.5 2007. 3.11466E-05 9 91.5 2022. 3.13~49E-05
10 112.5 2060. 3.19770E-05 11 127.5 2121. 3.29162E-05 12 142.5 l. 07 7. 3.22409E-05 1] 1'.>7.5 1605. 2.49064E-05 14 172.5 1083. 1.68035E-05 15 187.5 839. 1 .. 301 59E-05 16 202.5 691. 1.01340E-05 17 217.5 546. 8.47546E-06 18 232.5 418. 6.49630E-06 19 247.5 301. 4.76551E-06 20 262.5 224. 3.47111E-06 21 277.5 191. 2.96486E-06 22 292.5 131. 2.03349E-06 23 307.5 88. 1.36601E-06 24 322.5 49. 7.60619E-07 25 337.5 29. 4.42'tOlE-01 26 352.5 3. 4.65685E-08 27 382.5 -25. -3.95832E-01 21:1 412.5 -49. -1.68380E-07 29 442.5 -51. -7.91664E-07 30 472. I) 32. 4.9613LE-07 31 502.5 7. 1.16421E-Ol
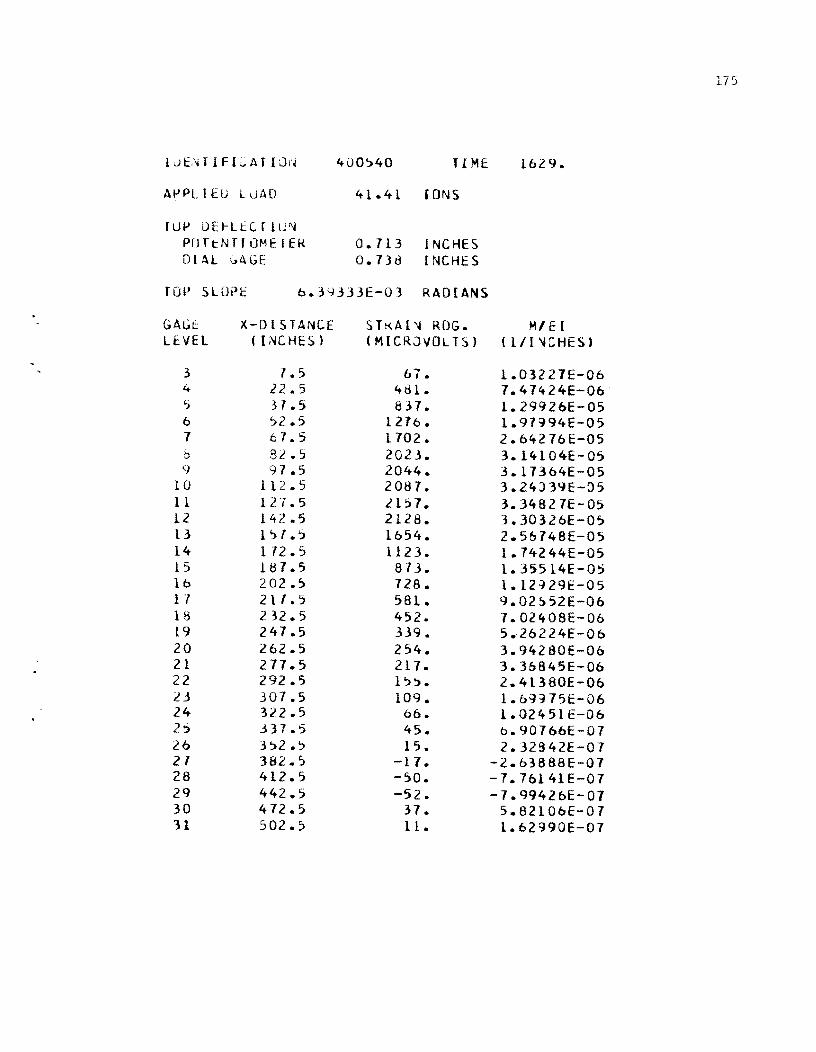
APPLIELJ LLJAO
lUP DEt-LEe r lON PlJftNTIOMETEf\ 01 Al C.4GE
4QO~40 TIME
41.41 rONS
0.713 INCHES D.73d INCHES
fOP SLOPe 6.3Y333E-03 RADIANS
GAGt LEVEL
3 4 ':> 6 7 /j
9 10 11 12 13 14 15 16 1 7 18 t9 20 21 22 23 24 2~
26 21 28 29 30 11
X-DISTANCE (INCHES)
7.5 22.5 "37 .5 ':>2.5 67.5 82.5 97.5
112.5 127.5 142.5 1'>1.:> 1 72.5 187.5 202.5 211.5 232.5 247.5 262.5 277.5 292.5 307.5 322.5 337.5 352.5 382.~ 412.5 442.5 472.5 502.5
STKAl~ RDG. (MICRJVOLT~)
6,. 4d1. 837.
1216. 1702. 2023. 2044. 2 Ott] • 21:l7. 2128. 1654. 1123. 873. 728. 581. 452. 339. 254. 217. 1~~.
109. 06. 45. 15.
-17. -50. -52.
37. 11.
1629.
MI E t I1/I'4CHES)
1.03221E-06 7.47424E-06 1.29926E-05 1.91994E-05 2.64276E-05 3.14104E-05 3.17364E-05 3.24J39E-05 3.34B27E-05 3.30326E-0l) 2.5~748E-05
1.74244E-05 1.35514E-05 1.12-}29E-05 9.02~52E-06
7.02408E-06 5.26224E-Ob 3.94280E-06 3.36B45E-Ob 2.4l380E-Ob 1. bin 75E-06 1.02451E-06 b.90766E-07 2.32942E-07
-2.b3888E-07 -7.76141E-07 -7.9942bE-Ol
5.82106E-07 1.62990E-07
175

176
10 EN TI FIe A T ION 400640 TIME 16ftO.
APPLIED LOAD 41.36 TONS
TDP DEFLECTIJN POTENTIOMETER 0.123 IIIjCHES DIAL GAGE 0.760 INCHES
fOP SLDPE 6.5l667E-03 RADIANS
GAGt. X-DISTANCE STRAIN ROG. HI E I LEVEL ( INCHES) (MICROVOLTS) (l/l"'CHES)
3 1.5 68. 1.06331E-06 4 22..5 486. 1.54409E-06 5 37.5 842. 1.30625E-05 6 52.5 1284. l.99236E-05 1 61.5 1719. 2.66837E-05 8 82.5 2050. 3.18218E-05 9 97.5 2073. 3.21188E-05
10 112.5 2124. 3.29182E-05 11 121.5 2203. 3.41=J68E-05 12 142.5 2176. 3.37B54E-05 13 157.5 1707. 2.65J52E-05 14 172.5 1164. 1.80163E-05 15 187.5 908. 1.40870E-05 16 202.5 756. 1.17430E-05 17 217.5 605. 9.39131E-06 18 232.5 471. 1.31125E-06 19 247.5 350. 5.44075E-06 20 262.5 259. 4.02041E-06 21 271.5 222. 3.43831E-06 22 292.5 156. 2.42156E-06 23 301.5 109. 1.68423E-06 24 322.5 63. 9.85tJ99E-Ol 25 337.5 42. 6.59720E-07 2.6 352.5 13. 2.09558E-07 27 382.5 -19. -2.94934E-07 28 412.5 -54. -8.38233E-07 29 442.5 -55. -8.61517E-07 ]0 472.5 35. 5.43299E-07 31 502.5 B. 1.2lt183E-Ol

177
ILJt.~rIF[CATIUN "tOO/40 TIME 16"t'3.
APt'LIED L0AO 41.43 fONS
fOP DE:FLtCTIU'~
POTENTIOMETER 0.743 I~CHES DIAL Ghl,;E 0.772 I NCHE S
fOP 5LOPt 6.56661E-03 KADIANS
GAGE: X-IJISTANCE STRAI'4 RDG. "'lEI LEVEL (INCHES) (MICROVOLTS) (111 ~CHES)
3 7.5 66. 1.02451E-06 4 22.5 484. 7.52;)81E-06 ') 37.5 842. 1.3;)102E-05 b ';)2.5 1289. 2.00;)89E-05 1 61.5 172B. 2.68234E-05 8 82.5 2064. 3.20391E-05 9 97.5 2092. 3.24738E-O~
10 112.5 2149. 3.335 86E- 05 11 127.5 22~3. 3.46625E-05 12 142.5 2215. 3.43~08E-05 13 157.5 1746. 2.70151E-05 14 172.5 1195. l.tJ5498E-05 15 187.5 932. 1.4tt:;'73E-05 16 202.';) 779. 1.21000E-05 17 2l7.1j 626. 9.71729E-06 18 232.5 488. 7.51514E-06 19 247.5 364. 5.65;)31E-06 20 262.5 271. 4.19893E-06 21 277.5 230. 3.57801E-06 22 292.5 163. 2.53;)22E-06 23 307.5 113. 1.76184E-Ob 24 322.') 68. 1.06331E-06 25 :d7.5 46. 7.14;)50E-07 26 3 ':>2 .5 15. 2.32642E-07 27 382.5 -18. -2.79411E-07 28 412.5 -53. -8.22710E-07 29 442.5 -55. -8.53156E-07 30 472.5 37. 5.82106E-07 31 502.5 9. 1.39105E-07

178
IOt:;'HIFICArIJN 400840 TI ME l!)~)l.
APPLIED LOAD 41.2 a rONS
TOP DEFLEC T ION POTENTI OMETER O.75!) INCHES DIAL G~uE 0.785 INCHES
TOP SLOPe 6.70667E-03 RADIANS
GAGE X-DISTANCE STRAIN RDG. H/EI LEvEL ([NCHES) (MICROVDLTS) (lll'4CHES)
3 7.5 67. 1.03221E-06 4 22.5 481. 7.47ft24E-06 5 37.5 839. 1.30314E-05 6 52.5 1287. 1.99856E-05 7 67.5 1729. 2.6B390E-05 8 82.5 2067. 3.20857E-05 9 97.5 2096. 3.25358E-05
LO lL2.5 2156. 3.34~72E-05 11 127.5 2244. 3.48332E-05 L2 142.5 2227. 3.45616E-05 13 157.5 1762. 2.73ft35E-05 14 172.5 L207. 1.a736lE-05 L5 187.5 941- 1.46141E-05 L6 202.5 788. 1.22320E-05 17 217.5 b32. 9.81J43E-06 18 232.5 492. 7.64499E-06 L9 247.5 365. 5.67359E-06 20 262.5 269. 4.17564E-06 2L 277.5 227. 3.52368E-06 22 292.5 159. 2.46813E-06 23 307.5 110. 1.71527E-06 24 322.5 64. 1.0:.H22E-06 25 337.5 42. 6.51959E-07 26 352.5 10. 1.47467E-07 27 382.5 -22. -3.33741E-D7 28 412.5 -55. -8.bI517E-07 29 442.5 -55. -8.53756E-07 30 472.5 37. 5.74345E-:)7 31 502.5 9. 1.39705E-07

179
1 ~) t: T\I T I H CAr ION ~uO,}40 TIME 1~54.
APPL I ED LUAD 41.42 TONS
lUP DEFlEC r I ON PCTE"iTIOMETER 0.774 I"1CHES DIAL ~AGt (;.798 INCHES
TliP SLOPt 6.80607t:-03 KAOIANS
GAGE: X DISTANCE STRAIN RDG. IoIIIEI LEVEL ( I NCHE S ) (MICROVOLTS) (lIr~CHES)
3 7.5 67. 1.04779E-06 4 22.5 483. 7.49753E-06 5 37.5 845. 1.31168E-05 6 5i.5 1298. 2.01486E-05 7 67.') 1741. 2.70330E-05 8 H?':> 20S5. 3.23651E-05 9 97.5 2It 7. 3.2B51tlE-05
10 112.5 2179. 3.39242E-05 11 127.5 2272. 3.52&79E-05 12 142.5 2261. 3.5::>~71E-05 13 157.5 1793. 2.78402E-05 14 177.5 1235. 1.91707E-OS 15 181 .5 963. 1.49485E-OS 16 2 OZ. 5 808. 1.25424E-05 1 7 217.5 6S1. 1.01054E-05 18 232.5 509. 7.90888E-06 1:/ 241.5 379. 5.BB315E-06 20 262.5 280. 4.35415E-06 21 277.5 236. 3.66339E-06 22 292.5 166. 2.57579E-06 23 YH. ':) 117. 1.82393E-06 24 322.':> 70. 1.08660E-06 25 337.5 47. 7.21912E-07 26 352. S 14. 2.25J81E-07 27 382.') -20. -3.10457E-07 28 412.5 -55. -8.61517E-07 29 442.5 -51. -S.71J40E-07 30 477.5 40. 6.20913E-07 3i iDZ.S li. 1. 70751E-07
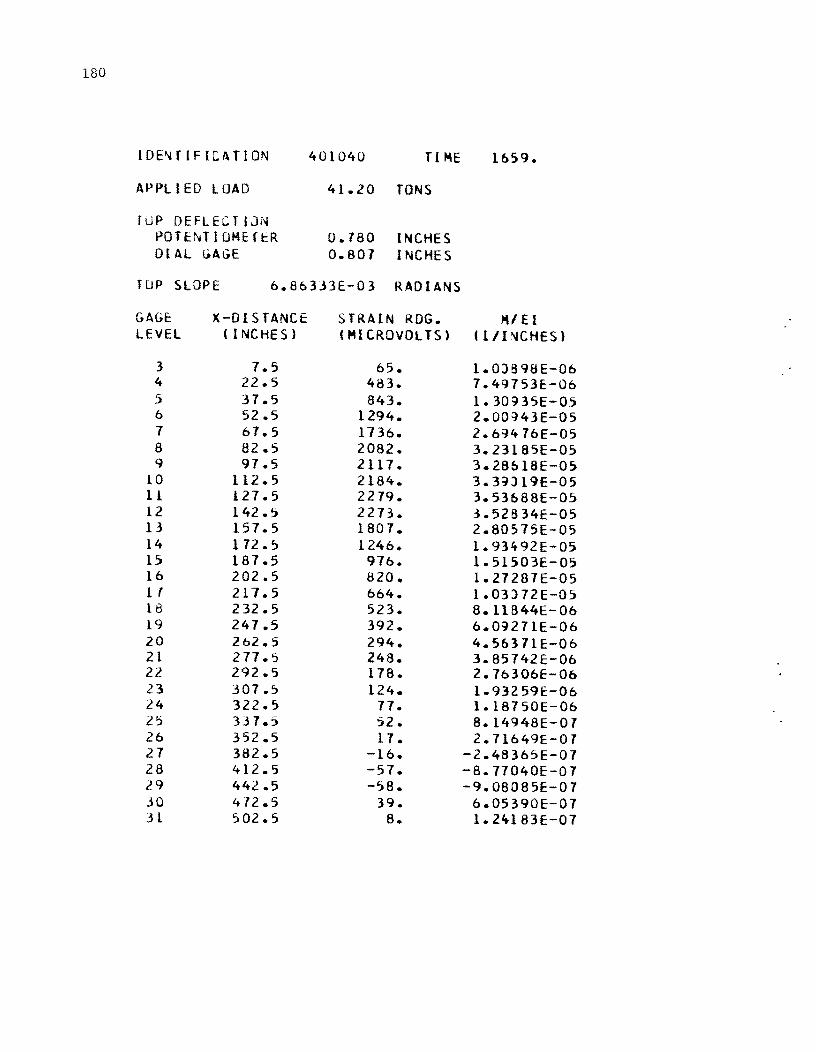
180
IDPHIFICATION 401040 TI ME 1~S9.
APPLIED LOAD 41.20 TONS
rup DEFLECTIJN POTENT lOME H:R 0.180 INCHES DIAL GAGE 0.807 INCHES
rup SLOPE 6.80333E-03 RADIANS
GAGE: X-DISTANCE STRAIN RDG. M/EI LEVEL (INCHES) (MICROVOLTS) (lII"4CHES)
3 7.5 65. 1.0JB98E-06 4 22.5 483. 7.49753E:-06 ':) 37.5 843. 1.30935E-05 6 52.5 1294. 2.00~43E-05 7 67.5 1736. 2.6~476E-05 8 82.5 2082. 3.23185E-OS 9 97.5 2117. 3.28~18E-05
10 112.5 2184. 3.39J19E-05 11 127.5 2279. 3.53~88E-OS 12 142.5 2273. 3.52B34E-05 13 157.5 1807. 2.80575E-05 14 172.5 1246. 1.934-92E-05 15 187.5 976. 1.51503E-05 16 202.5 820. 1.27287E-05 11 217.5 664. 1.03J72E-05 18 232.5 523. 8. II B44E- 06 19 247.5 392. 6.09271E-06 20 262.5 294. 4.5~371E-06 21 277.5 248. 3.85742E-06 22 292.5 178. 2.76306E-Ob 23 307.5 124. 1.93259E-06 24 322.5 77. 1.18750E-06 25 337.5 52. 8. 14948E-Ol 26 352.5 17. 2.71649E-Ol 27 382.5 -16. -2.48365E-07 28 412.5 -57. -8.77040E-07 29 442.5 -58. -9.08085E-07 30 472.5 39. 6.05390E-07 31 502.5 8. 1.24183E-07

181
1 DE \j T I F I L..\ r (n:'~ 4dl140 Tl ME 11)8.
.\,'PL [t I) L ' \ !;\u "t 1.41 TONS
[UP DEFLE\"rI:j~
POT I::: NT I :)ME T cR 0.797 INCHES DIAL .,A ,;It ;).823 INCHES
TOP SLOPE 6.Yl.dJ3E-03 RADIANS
GAGE X-DISrANCE STRAIN RDG. MI E I LEVEL ( I NC HE S ) (MICRUVOLTS) (llI~CHES)
3 '1.5 66. L.02451E-06 4 22.5 4115. 7.53td3E-Ob :;, 37.5 847. l.31478E-05 b 52.5 L301. 2.01952E-05 1 61.5 L150. 2.71572E-05 8 H2.S 2099. 3.25747E-05 9 <.J1.'.> 2L35. 3.31490E-05
10 112. S 220s. 3.4220LE-05 11 Ll7.S 2306. 3. 579':>6E-05 12 142.5 2303. 3.57491E-0~ L3 151.5 ltU8. 2.853LOE-05 14 172.5 L273. L.91~ObE-O':> 15 187.5 9'15. L.54452E-05 L6 Z02.5 835. 1.29593E-05 1 ( 211.5 675. L.04179E-05 Id 232.5 531. 8.25J38E-06 19 247.5 398. 6.L7809E-Ob 20 262.5 297. 4.6D28E-Ob 21 2 f7. 5 25 L. 3.89623E-Oo 22 292.5 178. 2.7630bE-Oo 23 3U7.5 L24. 1.93259E-06 24 322.5 16. L. 17~ 73E-06 2':> .; 37. ':> 52 • 7.9942bl:-07 26 3 ',2 .5 18. 2.87112E-07 21 3tiL.5 -LB. -2.7~411E-Ol La 4L2.5 -5,:>. -8.6L5L7E-07 29 442 • :> -57. -8.d480LE-07 30 472.5 4 L. 6.2867':>E-07 31 S02.5 LO. 1.55228E-07

182
IDENTIFICATION 401240 TIME 1112.
APPL [ED LOAf) 41.44 TONS
rap DEF-LECTION POTENTIUMETEK 0.803 INCHES DIAL GAGE 0.833 I NCHE S
TOP SLOPE 1.003]3E-03 KADIANS
GAGE:: X-DISTANCE STRAI~ RDG. M/EI LEVf:L ( INCHES) (MICR3VOLTS) ( 111 '4 C HE S )
3 1.5 61. 1.03221E-06 4 22.5 485. 1.52851E-06 ~ 31.5 849. 1.31189E-05 (:) 52. ~ 1303. 2.02340E-05 1 61.5 1153. 2.72J38E-O~ 8 82.5 2104. 3.26523E-05 9 91.5 2143. 3.32!)54E-05
10 112.5 2214. 3.43598E-05 1 L 121.5 2319. 3.59891E-05 12 142.5 2315. 3.59431E-05 13 151.5 1855. 2.88J26E-05 14 112.5 1285. 1.99391E-05 15 181.5 1001. 1.56315E-05 16 202.5 846. 1.31323E-05 11 211.5 684. 1.06D99E-05 18 232.5 538. 8.35128E-06 19 247.5 404. 6.21122E-06 20 262.5 299. 4.64133E-06 21 211.5 251. 3.89623E-06 22 292.5 111. 2.75530E-06 23 307.5 123. 1.91707E-06 24 322.5 16. 1.11913 06 25 331.5 51. 7.83~03E-01 26 352. ';) 11. 2.11b49E-Ol 21 382.5 -19. -2.94934E-01 28 412.5 -51. -8.11040E-01 29 442.5 -58. -9.00324E-Ol 30 412.5 41. 6.44197E-07 31 502.5 12. 1.18513E-01

IDi:::'iTIFI:':ATILl\i
APPLII:::D L~lAP
rut> DEFu .. c:rION POTENTIOMETER DII'IL GA:JE
401340 TIME
41.45 TO~S
0.812 INCHES 0.341 INCHES
flW SLOPE 7.0~OOOE-03 RADIANS
GAG!: li:VE:L
3 4 :>
6 7 8 <}
10 11 12 13 14 1~
10 11 13 19 III 21 22 L3 24 25 26 27 28 2..9 30 H
X-DISTANCE (lNCHt::i)
7.':> 22.'.> 3/.":> 52.~
07.':> ,~2 • ') 97.5
112.5 127.5 142.5 1~1.5
172.':) Ifll.5 2el.. OJ
211.5 232.') 1.4l.':> 202.5 27(.':) L'J1..5 3 J 7 • j
322.5 3 j , .5
,82.5 412 .. 5 442.5 4U .5 ~02.'
STRAI.\1 RDG. (MICKOVULTS)
67. 484. ti51.
1304. 1155. 211 O. 21jO. 2220. 2329. 2335. 1872. 1299. 1018.
8':>6. 694. 548. 411. 307. 258. 182. 128.
78. 52. 18.
-19. -58. -'.>9.
40. 10.
171 ~.
'111:: 1 (ll1~CHES)
1.03227E-06 1.50:>29E-06 1.32J22E-O:' 2.02!t95E-05 2.72503E-05 3.21532E-0~ 3.33741E-05 3.44601E-OS 3.61:'04E-05 3.62458E-05 2.90510E-05 2.01719E-05 1.')B100E-05 1.32875E-05 1.01b'.>lE-05 8.49875E-06 b.':38764E-06 4.15775E-06 3.99713E-06 2.82515E-06 1.98~92E-06 1.2lJ78E-06 8.14~48E-07 2.87172E-07
-2.94934E-07 -9.0BJ85E-07 -9.15847E-07
6.13152E-07 1.55228E-07
185

IDENflFICAflJN 401440 TI ME 1718.
APPLlED LOAD 41.42 TONS
fUP DEFLECfIJN PUTENTIOMl::fE:R 0.819 INCHES IJIAL "';AGE 0.8S3 INCHES
fOP SLOPE 7.09000E-03 KADIANS
GAGE X-DISTANCE STRAIN ROG. ~I EI LEVEL ( INCHES) (MICROIJOLTS) (l/I~CHES)
3 7.5 67. 1.03227E-06 4 22.5 481. 7.4b648E-06 5 37.S 848. 1.31556E-05 6 52.':> 1298. 2.01409E-OS 7 67.5 1757. 2.72736E-OS 8 82. ~ 2118. 3.28B51E-05 9 97.5 2160. 3.35293E-05
10 112.5 2232. 3.46410E-05 11 127.5 2354. 3.65ft85E-05 12 142.5 2354. 3.65407E-OS 13 157.5 1894. 2.93925E-OS 14 172.5 1318. 2.04b68E-05 15 187.5 1035. 1.60584E-05 L6 202.5 871. 1.35281E-05 17 217.5 708. 1.09~02E-05 18 232.5 560. 8.69278E-06 19 247.5 422. 6.55839E-06 20 262.5 315. 4.88~69E-06 21 277.5 265. 4.1:'P>79E-06 22 292.5 187. 2.90277E-06 23 307.5 131. 2.04125E-06 24 322.5 81. 1.24~59E-06 25 337.5 55. 8.53756E-07 26 352.5 20. 3. IB21 BE-01 27 382.5 -lB. -2.79411E-01 21::\ 412.5 -58. -9.00324E-01 29 442.5 -60. -9.31370E-07 30 472.5 41. 6.44197E-01 31 502.5 10. 1.47467E-07
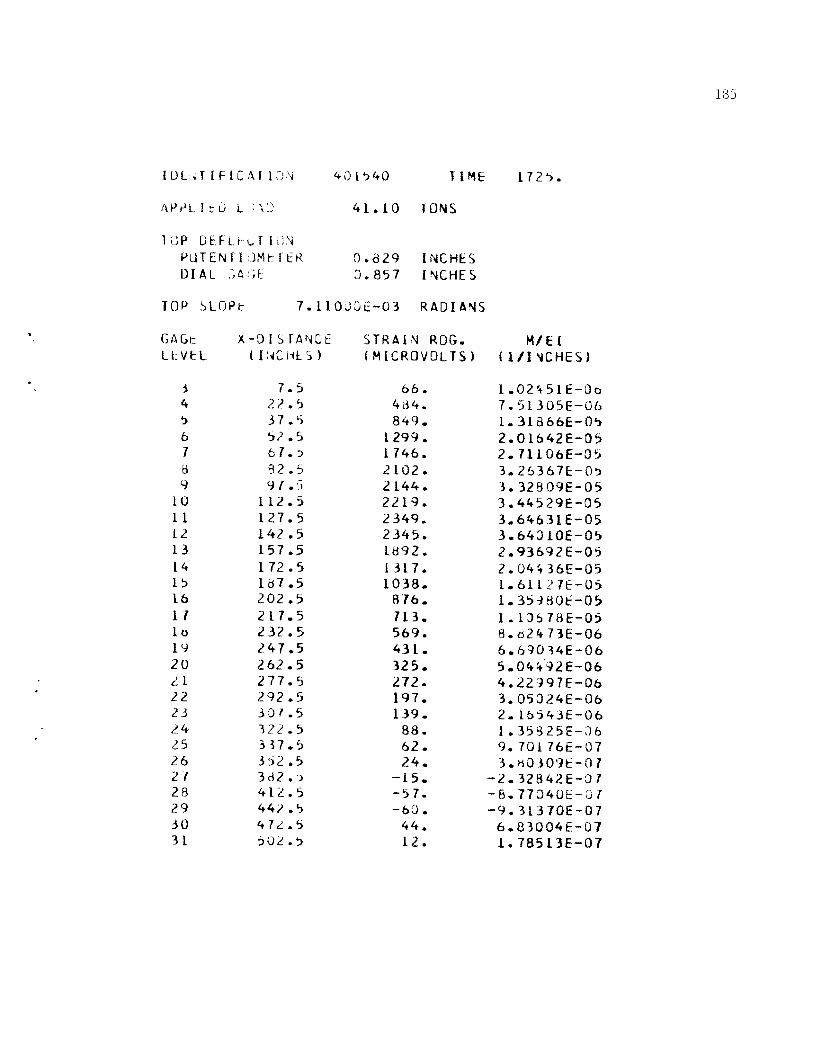
185
IOba [FIC;\r lC:J.'i 401'>40 TIME 172.,.
APril! to L " ' , 41.10 fONS
lUP DEFu-:1,.. r 1l1\i PUTENfI dMtftK 0.829 INCHES [)IAL ,~C\ ,t 0.857 INCHES
TDP ::'LOPt 7.11000E-03 RADIA~S
GAGt X-DISfAI\4Ct:: STRAIN RDG. M/Ef U:Vf:L t I !>IC fi t:: S ) (MICROVOLTS) (lll~CHES)
i 7.5 66. 1.024-51E-Oo 4 22.'.> 4d4. 7.51305E-06 ~ .37. '} 849. 1.31866E-O,> b 52.5 1299. 2.01642E-05 1 61.':> 1146. 2.1l106E-05 tj g2.5 2102. 3.26367E-O') 9 97 .:l 2144. ~.32809E-05
10 112.5 2219. 3.44529E-O,) 11 127.5 2349. 3.64631E-05 12 142.5 2345. 3.64J10E-05 13 157.5 IH92. 2.93692E-05 14 1 72. ') I 317. 2.04~36E-05 1~ un • ., 1038. 1.61121E-05 L6 202.5 816. 1.35·HiOt-05 1 1 2L7.5 713. 1. l)~ 73E-05 10 232.5 569. 8.B2473E-06 19 247.5 43 L. 6.6':J034E-06 20 262.5 325. 5.04!t92E-06 Ll 277.5 212. 4.22j97E-06 22 292.5 L97. 3.05024E-06 23 30'.5 139. 2.1b543E-06 24 122.5 88. 1.35825E-,)6 25 3H.~ 62. 9.70176E-07 26 3i2.5 24. 3.tiO]09i::-07 27 3H2.:> -15. -2.32842E-37 28 412.5 -57. -8.77~40E-07 29 44?,> -60. -9.31310E-07 30 47t!..5 44. 6.83004E-01 31 'oz.? 12. 1.78513E-01

186
rOtI\JTIFIC,\TION 401640 TIME 1730.
APPLIED LUAD 41.15 TONS
TOP DEFLECTION PuT ENTI OME T ER 0.841 INCHES DIAL GAGE 0.861 I NCHE S
TOP SL~pt 1.12333E-03 RADIANS
GAGE X-DISTANCE STRAIN RDG. "'lEI LEVEL (INCHES) (MICROVOLTS) (l/l'iCHES)
3 7.5 66. 1.01675E-06 4 22.5 481. 7.45S72E-06 ~ 31.5 848. 1.31711E-05 6 52.5 1296. 2.01253E-05 7 67.5 1747. 2.71261E-05 8 82.5 2105. 3.26833E-05 9 91.5 2147. 3.33215E-05
10 112.5 2222. 3.44917E-05 11 121.5 2357. 3.65873E-Oj 12 142.5 2358. 3.65:J51E-05 13 157.5 1899. 2.9lt856E-05 14 177.5 1325. 2.05755E-05 15 187.5 1041. 1.61593E-05 16 202.5 811. 1.36135E-05 17 217.5 715. 1.10911E-05 18 232.5 568. 8.80921E-06 19 247.5 431. 6.66258E-06 20 262.5 323. 5.01387E-06 21 271.5 211. 4.2D669E-06 22 292.5 194. 3.01919E-06 23 307.5 138. 2.14215E-06 24 322.5 86. 1.33496E-06 25 337.5 60. 9.39131E-01 26 3 5~. 5 24. 3.8l309E-Ol 21 382.5 -14. -2.25081E-01 28 412.5 -51. -8.17J40E-07 29 442.5 -59. -9.23608E-07 30 412.5 41. 6.44197E-07 31 502.5 10. 1.47467E-01
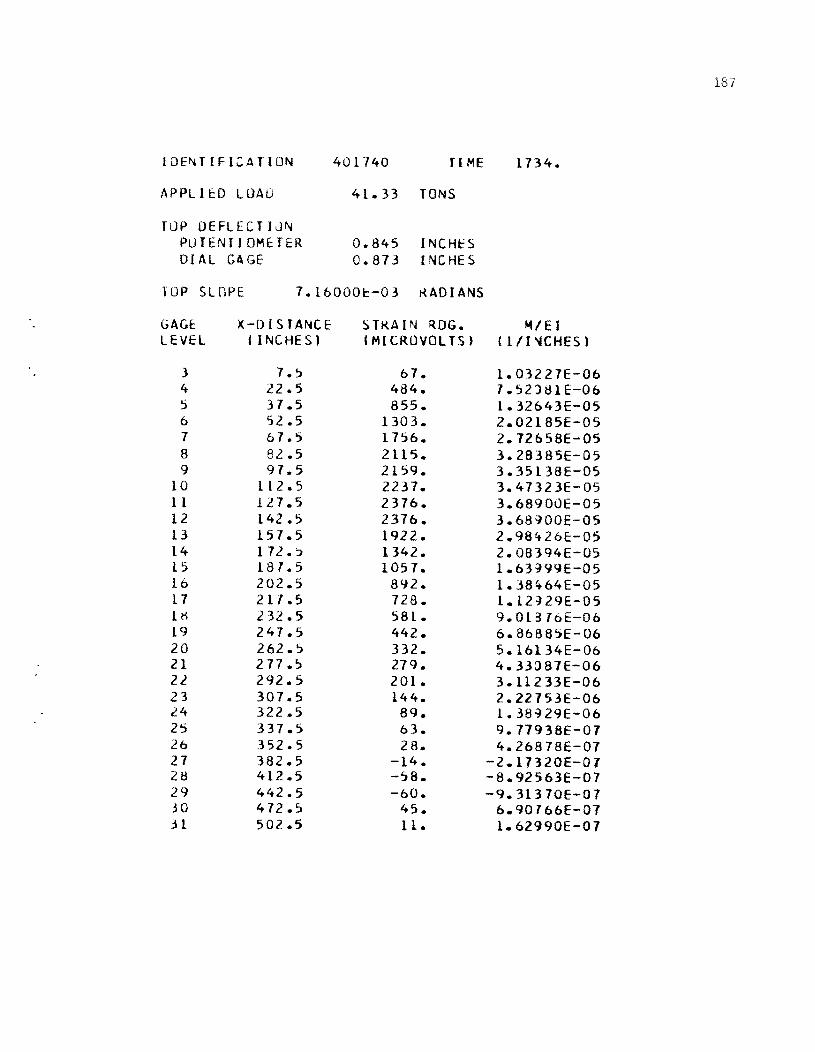
187
IDE~TIFI;:AT(ON 401740 TIME 1734.
APPLIED LOAD 41.33 TONS
TOP DEFLECTIJN POTENJIOME.TER 0.845 INCHES DIAL G~GE 0.873 [NCHE S
TOP SLOPE 7.160001:::-03 KADIANS
GAGE X-DISTANCE 5TKAIN RDG. ~/EI
LEVEL ( I NC HE S ) (MICROVOLTS' ClII ~CHES )
3 7.'::J 67. 1.03227E-06 4 22.5 484. 7.~2)I:HE-06 5 31.5 855. 1.32643E-05 6 52.5 1303. 2.02185E-05 7 61.5 1756. 2.72658E-05 8 82.5 2115. 3.28385E-05 9 91.5 2159. 3.35138E-05
10 112.5 2237. 3.41323E-05 1 1 127.5 2376. 3.68900E-05 12 142.5 2376. 3.68~00E-05 13 157.5 1922. 2.984-26E-05 14 172.:> 1342. 2.08394E-05 15 181.5 1051. 1.63-199E-05 16 202.5 892. 1.J84-64E-05 17 217.5 728. 1.12~29E-05 111 .2 32.5 581. 9.01316E-06 19 247.5 442. 6.86865E-06 20 262.5 332. 5.16134E-06 21 277., 279. 4.33087E-06 22 292.5 201. 3.11233E-06 23 307.5 144. 2.22753E-06 24 322.5 89. 1.38~29E-06 25 337.5 63. 9.77938E-07 26 352.5 28. 4.26878E-07 27 382.5 -14. -2.17320E-07 21; 412.5 -~8. -8.92563E-07 29 442.5 -60. -9.31370E-07 30 412., 45. 6.90166E-07 ,H 502.5 11. 1.62990E-07
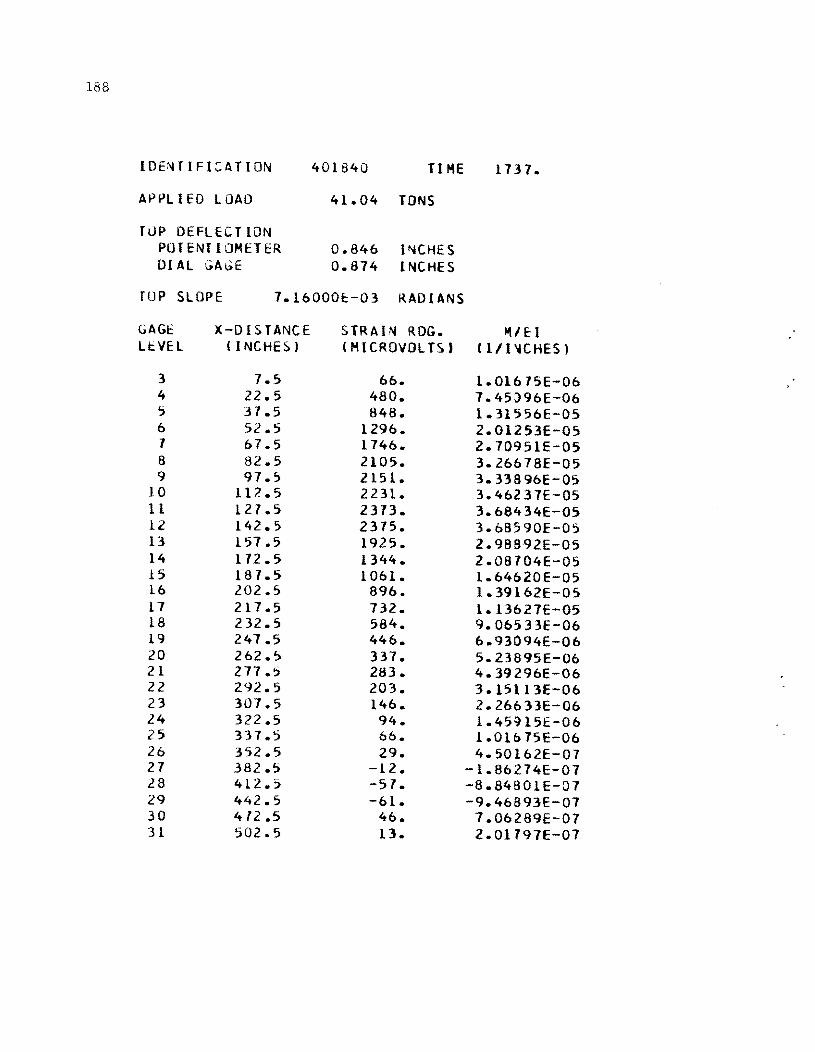
188
IOE~TIFI::':ATION 401840 TIME 1137.
APPLIED LOAD 41.04 TONS
T LlP DEFL EC T ION POTENTIOMETER 0.846 I~CHES DIAL GAGE 0.874 1 NCHE S
TOP SLOPE 1.16000E:-03 RADIANS
GAGE X-DISTANCE STRAIN RDG. H/El LEVEL (INCHES) (MICROVOLTS) (l/l'4CHES)
3 7.S 66. 1.0161SE-06 4 22.5 480. 1.45)96E-06 5 31.5 848. 1.31556E-OS 6 52.5 1296. 2.01253E-05 1 67.5 1146. 2.10951E-05 B 82.5 2105. 3.26618E-05 9 91.:' 2151. 3.33896E-05
10 112.S 2231. 3.46231E-05 11 127.5 2313. 3.68434E-OS 12 142.:' 2315. 3.685'10E-05 13 151.5 1925. 2.98892E-OS 14 112.5 1344. 2.08104E-05 15 181.5 1061. 1.64620E-05 16 202.5 896. 1.39162E-05 17 217.5 132. 1.13621E-05 18 232.5 584. 9.06533E-06 19 247.5 446. 6.93094E-06 20 262.5 331. 5.23895E-06 21 Z77.~ 283. 4.39296E-06 22 292.5 203. 3.15I13E-06 23 301.S 146. 2.26633E-06 24 322.5 94. 1.45:)15E-06 25 331.5 66. 1.01615E-06 26 352.5 29. 4.50162E-07 27 382.5 -12. -1.86214E-01 28 412.5 -51. -8.84BOIE-07 29 442.5 -61. -9.46893E-01 30 4'2.5 46. 7.06289E-07 31 502.5 13. 2.01197E-01

189
IDENTIFICATION 401940 TIME 1740.
AtJt>L I ED LOAD 41.59 TONS
TOP DEFLECTION POTENTI OME TER 0.856 INCHES DIAL GAGE 0.883 INCHES
TOP SLOPE 7.23667E-03 RADIANS
GAGE X-DISTANCE STRAIN RDG. M/EI LEVI:L (INCHES) (MICROVOLTS) 111I~CHES)
j 1.5 66. 1.02~51E-06 4 22.5 481. 1.55186E-06 5 31.5 858. 1.33263E-05 6 52.5 1312. 2.03660E-05 1 67.5 1161. 2.74366E-05 d 82.5 2129. 3.30481E-05 9 91.5 2115. 3.31699E-05
10 112.5 2254. 3.49162E-05 11 121.5 2401. 3.72703E-05 12 142.5 2406. 3.13402E-05 13 157.5 1951. 3.02173E-05 14 172.5 1365. 2.11887E-05 IS 187.5 1016. 1.67103E-05 16 202.5 910. 1.41258E-05 11 217.5 146. 1.15123E-05 18 232.5 597. 9.26113E-06 19 247.5 456. 7.01841E-06 20 262.5 346. 5.31)90E-06 21 211.5 290. 4.50~38E-06 22 292.5 210. 3.25919E-06 23 301.5 150. 2.32842E-06 24 322.5 95. L.41461E-06 25 331.5 68. 1.05555E-06 26 352.5 28. 4.34639E-Ol 27 382.5 -12. -1.94)35E-07 28 412.5 -59. -9.15841E-Ol 29 442.5 -62. -9.62415E-Ol 30 412.5 43. 6.61~82E-Ol 31 502.5 12. 1.86274E-Ol

190
I DEN TI Fie A TI ON 402040 TIME 1746.
APPll ED lOAD 41.27 TONS
TOP DEFLECTION POTENTIOMETER 0.856 INCHES DIAL GAGE 0.885 I NCHE S
TOP SLOPE 7.22000E-03 RADIANS
GAGE X-DISTANCE STRAIN RDG. M/EI LEVEL ( INCHES) (MICROVOLTS) (llI"ICHES)
3 7.":J 66. 1.02451E-06 4 22.5 482. 1.48200E-06 5 31.5 854. 1.32565E-05 6 52.5 1300. 2.01797E-05 7 67.5 1751. 2.71805E-05 8 82.5 2112. 3.21765E-05 9 97.5 2159. 3.3S138E-OS
10 112.S 2241. 3.47867E-05 11 127.5 2389. 3.70840E-OS 12 142.5 2394. 3.71617E-OS 13 157.5 1944. 3.01764E-05 14 172.5 1360. 2.11188E-05 15 187.5 1074. 1.6671SE-05 16 202.5 907. 1.40792E-05 17 217.5 743. 1.15412E-05 18 232. S 597. 9.25-137E-06 l~ 247.S 457. 7.09393E-06 20 262.5 346. S.37866E-06 21 217.S 291. 4.S1714E-06 22 292.S 209. 3.25203E-06 23 307.5 151. 2. 34395E-06 24 322.S 97. 1.S0571E-06 25 337.5 68. 1.06331E-06 26 352.5 29. 4.57923E-07 27 382.!) -12. -1.18S13E-07 28 412.5 -59. -9.23~08E-01 29 442.5 -64. -9.93460E-07 30 472.5 45. 6.98527E-07 31 502.5 11. 1.70751E-07

191
IDENTIFICArION 402140 TIHE 9L1.
APPLIED LOAD 41.33 TONS
fOP DEFlECflUN POTENTI UHE fER 0.909 INCHES DIAL GI\GE 0.904 INCHES
fOP SLOPE 1.13333E-03 RADIANS
GAGE X-DISTANCE STRAIN RDG. HIE [ LEVEL ( INC HES ) (MICROVOLTS) (lII~CHES)
3 1.5 61. L.04J03E-06 4 22.5 485. 7.52851E-06 5 31.5 854. 1.32565E-05 6 52.5 L289. 2.00089E-05 1 61.5 L140. 2.10091E-05 8 82.5 2100. 3.25919E-05 9 91.5 2141. 3.33215E-05
10 L12.5 2229. 3.4bJ04E-05 LL 121.5 2389. 3.10B40E-05 12 142.5 2391. 3.12005E-05 13 151.5 1952. 3.03D83E-05 14 L12.5 1310. 2.12140E-05 15 181.5 1083. 1.68035E-05 L6 202.5 <H3. 1.41123E-05 11 211.5 150. 1.16421E-05 18 232.5 603. 9.3b021E-Ob 19 241.5 463. 7.19483E-Ob 20 262.5 353. 5.41956E-06 21 211.5 300. 4.65685E-06 22 292.5 223. 3.45383E-06 23 301.5 163. 2.53798E-06 24 322.5 L01. 1.6b)94E-06 25 331.5 80. L.24183E-06 26 352.5 41. 6. 28b 15E-01 27 382.5 -2. -3.i:l451E-08 28 412.5 -52. -7.99426E-01 29 442.5 -59. -9.15841E-01 30 412.5 43. 6.15243E-01 31 502.5 11. 1.62990E-01

192
IlH::N TI fie A TI ON 402240 TI ME ~11.
APPL I ED L DAD 41.26 TONS
rop DEFlEC fION POTENTIOMETER 0.920 INCHES DIAL GAGE 0 .. 911 INCHES
TOP SLOPE 7.20661E-03 RADIANS
GAGE X-DISTANCE STRAIN RDG. MI EI LI:VEl (INCHES) (MICROVOLTS) (l/J~CHES)
3 7.5 64. 9.93460E-07 4 22.5 418. 7.41991E-06 :> 37.5 848. 1.3I1l1E-OS b 52.5 1285. 1.9~468E-05 7 61.5 1738. 2.69864E-OS 8 82.5 2101. 3.26l35E-05
" 91.5 2148. 3.33508E-OS lU 112.5 2239. 3.41S56E-05 11 127.5 2398. 3.72160E-05 12 142.5 2412. 3.74488E-OS 13 151.5 1956. 3.037D4E-05 14 172.5 1372. 2.I2973E-05 15 181.5 1071. 1.61l81E-05 16 202.5 904. 1.40326E-05 17 217.5 737. 1.14403E-05 18 232.5 587. 9.10414E-06 19 247.5 445. 6.90766E-06 20 262.5 339. 5.25448E-06 21 277.5 286. 4.43111E-06 22 292.5 206. 3.19710E-06 23 307.5 148. 2.3J514E-06 24 322.5 95. 1.48243E-06 25 337.5 61. 1.04719E-06 26 352.5 32. 4.96131E-Ol 27 382.5 -8. -1.31944E-07 28 412.5 -53. -8.30471E-07 29 442.5 -58. -8.92563E-07 30 412.5 44. 6.83D04E-07 31 502.5 12. 1.94035E-07

193
IDENTIFICATION 402340 TIME 920.
APPLIED LOAD 41.43 TONS
TOP DEFLECTIJN POTENTIOMETER 0.929 I:'4CHES DIAL GAGE 0.929 INCHES
TOP SLOPE 7.2~333E-03 RADIANS
GAGE: X-DISfANCE STRAIN RDG. MI E 1 LEVI::L (lNCHE~ ) (MICROVOLTS) (1/I'iCHES)
1 1.5 64. 1.00122E-06 4 22.~ 482. 7.48200E-06 'j 37.5 855. 1.32043£-05 6 52.5 1294. 2.00665E-05 1 67.5 1150. 2.71572E-05 8 82.5 2113. 3.28075E-05 Y 97.5 2164. 3.35914E-05
10 112.5 2258. 3.50505E-05 11 127.5 2417. 3.75187E-05 12 142.5 2429. 3.17127E-05 lJ 157.5 1977. 3.0bB09E-05 14 172.5 1390. 2.15767E-05 15 187.5 1093. 1.69742E-05 16 202.5 918. 1.42500E-05 17 217.5 750. 1.16344E-05 18 232.5 598. 9.28265E-06 19 247.5 454. 7.04736E-06 20 262.5 345. 5.35538E-06 21 277.5 290. 4.50938E-06 22 292.5 209. 3.25203E-06 23 307.5 151. 2.33619E-06 24 322.5 95. 1.48243E-06 25 337.5 68. 1.00331E-06 26 352.5 31. 4.81l08E-07 27 382.5 -11. -1.70751E-07 28 412.5 -54. -8.45)94E-07 29 442.5 -58. -9.08085E-07 30 472.5 42. 6.59720E-07 31 502.5 11. 1.62990E-07
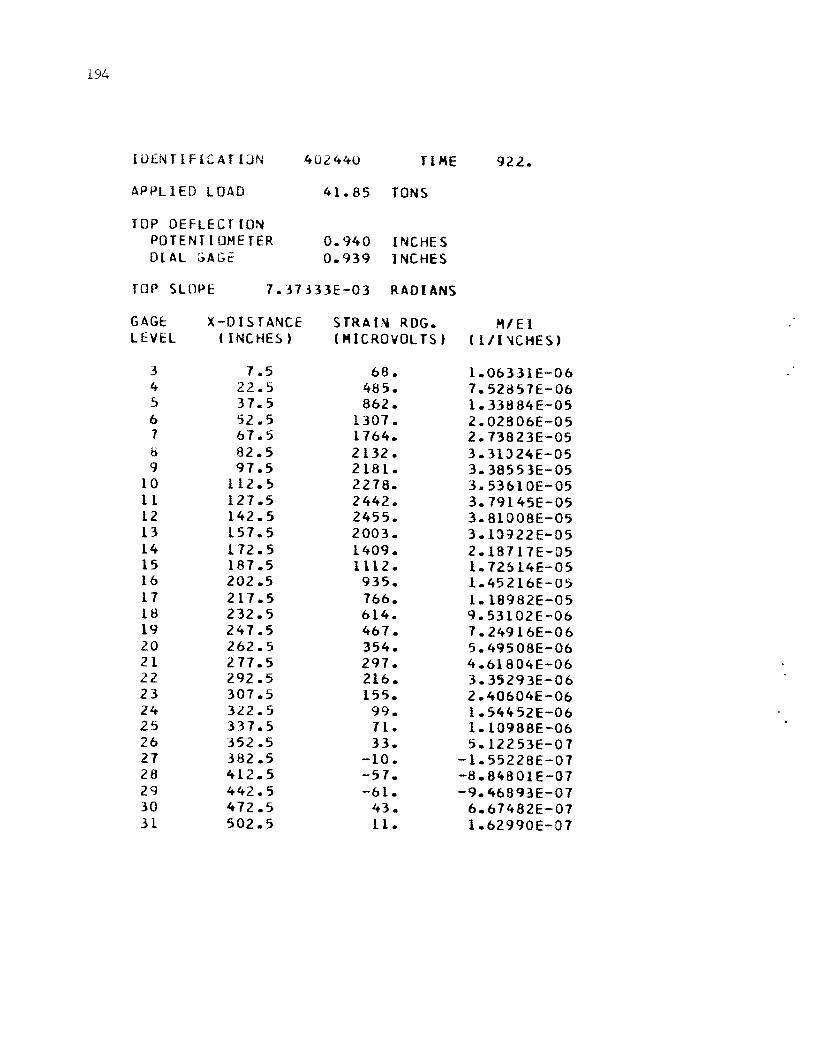
194
IU£NTIF1CATIJN 402440 TlME 922.
APPLIED LOAD 41.85 TONS
TOP DEFLECTION POTENTIOMETER 0.940 INCHES DIAL ::;AGi: 0.939 INCHES
TOP SLOPE 7.37333E-03 RADIANS
GAGE: X-DISTANCE STRA(~ RDG. M/EI lEVEL (INCHES) (MICROVOLTS) (l/(~CHES)
3 7.5 68. 1.0b331E-06 4 22.5 485. 7.52857E-06 5 37.5 862. 1.33884E-05 6 52.5 1307. 2.02806E-05 1 67.5 1764. 2.73823E-05 b 82.5 2132. 3.31J24E-05 9 97.5 2181. 3.38553E-05
10 112.5 2278. 3.53bl0E-05 11 127.5 2442. 3.79145E-05 12 142.5 2455. 3.81008E-05 13 157.5 2003. 3.1J922E-05 14 172.5 1409. 2.18717E-05 15 187.5 1112. 1.72~14E-05 16 202.5 935. 1.45216E-05 17 217.5 766. 1.18982E-05 18 232.5 614. 9.53102E-06 19 247.5 467. 7.24916E-06 20 262.5 354. 5.49508E-06 21 277.5 297. 4.61804E-06 22 292.5 216. 3.35293E-06 23 307.5 155. 2.40b04E-06 24 322.5 99. 1.54452E-06 25 337.5 11. 1.10988E-06 26 352.5 33. 5.12253E-07 27 382.5 -10. -1.55228E-07 28 412.5 -57. -8.84801E-07 29 442.5 -61. -9.4b893E-07 30 472.5 43. 6.67482E-07 31 502.5 11. 1.62990E-07

IOEN1IF[";ATIUo''l
APPLIED LOAD
TOP DEFLECrlON POTENTIOMETER DIAL GAGE
4U2540 TIME
41.35 TONS
0.944 INCHES 0.942 !NCHES
rop SLOPE 7.39667E-03 RADlANS
GAGE LEVEL
3 4 , 6 7 8 9
10 11 12 13 14 15 16 17 18 19 20 2i 22 23 24 25 26 27 28 29 30 31
X-DISTANCE ( I NCHE S,
7.5 22.5 37.5 52.5 67.5 82.5 97.5
112.5 i27.5 142.5 157.5 172.5 187.5 202.5 217.5 232.5 247.5 262.5 277.5 292.5 307.5 322.5 337.5 352.5 382.5 412.:' 442.:' 472.5 502.5
STRAIN RDG. (MICROVOLTS'
67. 481. 857.
1296. 1750. 2117. 2171. 2266. 2432. 2448. 1995. 1408. 1111. 935. 768. 615. 471. 360. 304. 223. 160. 105.
76. 36. -7.
-54. -61.
46. 13.
~28.
,../E( (1/1"4CHES)
1.04779E-06 7.47424E-06 1.33)31E-05 2.01176E-05 2.71649E-05 3.28596£-05 3.37J78E-05 3.51670E-05 3.77438E-05 3.80J76E-05 3.09680E-05 2.18484E-05 1.72459E-05 1.45138E-05 1.19215E-05 9.55430E-06 7.31901E-06 5.58822E-06 4.71894E-06 3.45383E-06 2.49141E-06 1.62214E-06 1.17~73E-06 5.66583E-07
-1.16421E-07 -8.45'J94E-07 -9.46893E-07
7.06289E-07 2.09558E-07
195

196
I DEN fI F I CATION 500150 TIME 938.
APPL I ED LOAD 55.06 TONS
TOP DEFLECTION POTENTIOMETER 1.165 INCHES DIAL GAGE 1.165 INCHES
rop SLOPE 9.13333E-03 KADIANS
GAGE X-DISTANCE STRAIN RDG. ""'EI LEVEL (INCHES) (MICROVOLTS) (l/I~CHESl
3 1.5 86. 1.34272E-06 4 22.5 607. 9.41460E-06 'j 31.5 1133. 1.15951E-05 6 52.5 1675. 2.60085E-OS 7 67.5 2237. 3.47323E-05 8 82.5 2704. 4.19B15E-05 9 97.5 2718. 4.31141E-05
to 112.5 2891. 4.4B165E-05 11 121.5 3090. 4.79555E-05 t2 142.5 3102. 4.81441E-05 13 157.5 2560. 3.97462E-05 14 112.5 1851. 2.87328E-05 15 187.5 1488. 2.31057E-05 16 202.5 1263. 1.96053E-0:> 17 211.5 1043. 1.61903E-05 18 232.5 847. 1.31478E-05 19 247.5 669. 1.03925E-05 20 262.5 515. 1.98650E-06 21 217.5 425. 6.59120E-06 22 292.5 306. 4.14999E-06 23 301.5 223. 3.45383E-06 24 322.5 145. 2.l5081E-06 25 337.5 102. 1.59109E-06 20 352 .. 5 49. 7.68380E-07 27 382.5 -6. -1.00898E-07 28 412.5 -19. -1.22630E-06 29 442.5 -83. -1. 28B 39E-06 30 412.5 62. 9.10116E-07 31 502.5 19. 2.94934E-07

197
IDENT1F1CAT1JN 500250 TIME 949.
AI-'PL H:D LOAD 54.79 TONS
TOP DEFLEC TI ON POTENT IOMEJER 1.191 INCHES DIAL GAGE 1.195 INCHES
lOP SLOPE 9.26333E-03 RADIANS
GAGE X-DIS,TANCE STRAIN RDG. "" E 1 LEVEL ( INCHES) (MICROVOLTS) (l/BICHES)
3 7.5 84. 1.30392E-06 4 22.5 584. 9.06533E-06 :; 37.5 1103. 1.71217E-05 6 52.5 1640. 2.54652E-05 7 67.5 2193. 3.40416E-05 8 82.5 2656. 4.12209E-05 9 91.5 2739. 4.25)93E-05
10 112.5 2844. 4.41469E-05 11 127.5 3010. 4.76628E-05 Ii 142.5 3094. 4.80199E-05 13 157.5 2578. 4.00256E-05 14 172.5 1869. 2.90199E-05 15 181.5 1506. 2.33951E-05 16 202.5 1282. 1.99003E-05 17 217.5 1064. 1.65163E-05 18 232.5 869. 1.34916E-05 19 247.5 691. 1.07340E-05 20 262.5 535. 8.31247E-06 21 277.5 433. 6.72138E-06 22 292.5 318. 4.92B50E-06 23 307.5 229. 3.54697E-06 24 322.5 150. 2. 32842E-06 25 331.5 106. 1.65318E-06 26 352.5 52. 8.01187E-07 27 362.5 -4. -6.20~13E-08 28 412.5 -74. -1.14869E-06 29 442.5 -81. -1.26511E-06 30 412.5 62. 9.70176E-07 31 502.5 16. 2.40604E-07

198
IUENTIFICATION 500350 TIME 959.
APPLIED LOAD 58.18 TONS
rop DEFLEC T ION POTENTIOMETER 1.210 INCHES DIAL GAGE 1.215 INCHES
TUP SLOPE 9.32661E-03 RADIANS
GAGE X-DISTANCE STRAIN RDG. MI f: I LEVEL (INCHES) [MICROVOLTS) ( 1 J1~CHES)
3 1.5 85. 1.31~44E-06 4 22.5 514. 8.91186E-06 5 31.5 1093. 1.69065E-05 6 52.5 1629. 2.52861E-05 1 61.5 2119. 3.38165E-05 8 82.5 2640. 4.09880E-05 9 91.5 2125. 4.22991E-05
10 112.5 2849. 4.42323E-05 11 121.5 3013. 4.11)94E-05 12 142.5 3103. 4.81151E-05 13 151.5 2591. 4.03205E-05 14 112.5 1891. 2.93531E-05 15 181.5 1525. 2.36046E-05 16 202.5 1291. 2.01331E-05 11 211.5 1080. 1.61569E-05 18 232.5 882. 1.36~11E-05 19 241.5 101. 1.09146E-OS 20 262.5 553. 8.58412E-06 21 211.5 442. 6.85333E-06 22 292.5 328. 5.08313E-06 23 301.5 231. 3.67115E-06 24 322.5 156. 2.42156E-06 25 337.5 112. 1.13)80E-06 26 352.5 57. 8.84801E-01 21 382.5 -3. -4.65b85E-08 28 412.5 -14. -1.15b45E-06 29 442.5 -82. -1.21281E-06 30 412.5 61. 9.54654E-01 31 502.'> 11. 2.63888E-07

199
I 0 EN T I FIe A r D N -:.00450 TI ME 1016.
APPLIED LOAD 49.82 TONS
TlJP DEFLECT ION POTENTIOMETER 1.264 INCHES DlAL GAGE 1.278 INCHES
rop SLOPE 9.86333E-03 RADIANS
GAGE X-DISTANCE STRAIN ROG. M/EI LEVEL (INCHES) (MICROVOLTS) ( 111'1CHES)
3 7.5 92. 1.43586E-06 4 22.5 604. 9.37579E-06 5 37.5 1142. 1.77271E-05 6 52.5 1730. 2.6B545E-05 7 67.5 2303. 3.57491E-05 8 82.5 2784. 4.32J78E-05 9 97.5 2877. 4.46592E-05
10 112.5 2994. 4.64831E-05 11 127.5 3252. 5.04B02E-05 12 142.5 3296. 5.11110E-05 13 157.5 2779. 4.31302E-05 14 172.5 2039. 3.16510E-05 15 un.5 1652. 2.56437E-05 16 202.5 1412. 2.19182E-05 17 217.5 1184. 1.83790E-05 18 232.5 975. 1.51270E-05 19 247.5 794. 1.23174E-05 ZO 262.5 636. 9.87252E-Ob 21 277.5 505. 7.83903E-Ob 22 292.5 378. 5.87539E-06 23 307.5 280. 4. 34639E-Ob 24 322.5 191. 2.9b486E-06 2~ 337.5 141. 2.18872E-06 26 352.5 78. 1.20302E-06 27 382.5 12. 1.7B513E-07 28 412.5 -74. -1.15045E-06 29 442.5 -88. -1.35B25E-06 30 472.5 68. 1.05555E-06 . H 502.5 20 • 3.10Ct57E-Ol

200
IOENTIFICATION :,OO~50 fI ME 1022.
ApPLIED LOAD 50.08 TONS
TOP DEFLECTION POTPHIOMETEt{ 1.306 INCHES 01 AL GAGE 1.317 INCHES
TOP SLOPE 1.00267E-02 RADIANS
GAGE X-DISTANCE STRAIN RDG. '1/EI LEVEL ( INCHES) (MICROVOLTS) (l/(~CHES)
.3 7.5 93. 1.45138E-06 4 22.5 604. 9.36B03E-06 ~ 37 .~ 1158. 1.79677E-05 6 '>2.5 1745. 2.70B73E-05 1 67.5 2321. 3.6:1285E-05 8 82.5 2813. 4.36657E-05 q 97.5 2906. 4.511 71E-05
10 112.5 3028. 4.70:)31E-05 11 127.5 3301. 5.12409E-05 12 142.5 3348. 5.19704E-05 13 151.5 2830. 4.39296E-05 14 172.5 2083. 3.23418E-05 15 187.5 1689. 2.62103E-05 16 202.5 1445. 2.24382E-05 17 217.5 1211. 1.88l59E-05 18 232.5 998. 1.54995E-05 19 247.5 812. 1.25968E-05 20 262.5 651. 1.01054E-05 21 271.5 514. 7.97B73E-06 22 292.5 384. 5.96077E-06 23 307.5 280. 4.34-639E-06 24 322.5 188. 2.92605E-06 25 337.5 135. 2.09558E-06 26 352.5 72. 1 • 1116 4E - 06 27 382.5 5. 7.76141E-08 28 412.5 -79. -1.22630E-06 29 442.5 -90. -1.39705E-06 30 472.5 71. 1.10212E-06 31 502.5 20. 3.10457E-07

201
IDE~TIFICATIO"" 500650 TIME 1029.
APPLIED LOAD 49.82 TONS
TOP DEFLECTION POTENT I m~ E T ER 1.343 INCHES DIAL GAGE 1.351 INCHES
TOP SLOPE 1.02400E-02 RADIANS
GAGE: X-DISTANCE STRAIN RDG. HI EI LEVEL (INCHES' (MICROVOLTS) 11/INCHES)
3 7.5 93. 1.45138E-06 4 22.5 600. 9.30594E-06 5 37.5 1160. 1.80065E-05 6 52.5 1750. 2.71649E-05 1 67.5 2332. 3.61=115E-05 8 82.5 2829. 4.3~141E-05 9 91.5 2928. 4.54431E-05
10 112.5 3051. 4.73524E-05 11 127.5 3324. 5.15919E-05 12 142.5 3395. 5.21000E-05 13 157.5 2883. 4.41523E-05 14 112.5 2131. 3.30714E-05 15 187.5 1132. 2.68118E-05 16 202.5 1488. 2.30980E-05 11 217.5 1250. 1.94:J35E-05 18 232.5 1038. 1.6ll21E-05 1~ 247.5 841. 1.31478E-05 20 262.5 685. 1.06331E-05 21 277.5 540. 8.31451E-06 22 292.5 410. 6.36436E-06 23 307.5 300. 4.66461E-06 24 322.5 203. 3.15113E-06 25 331.5 146. 2.21409E-06 26 352.5 en. 1.25135E-06 27 382.5 11. 1.62990E-07 28 412.5 -78. -1.21S54E-06 29 442.5 -91. -1.40482E-06 30 472.5 73. 1.12541E-06 31 502.5 22. 3.33141E-Ol

202
ItJENTIFICAIION 'jo07~O TIME 1033.
APPLIED LOAD ~O.49 TONS
lUP DEFLECTION PO TENT[ OMET £R 1.314 INCHES DIAL GAGE 1.382 INCHES
J(jIJ SlUPi: 1.04600E-02 ~ADIANS
GAGE X-DISTANCE STRAIN RDG. M/EI LEIJEl (INCHES) (MICROIJOlTS) (lIINCHES)
3 7.5 94. 1.45~15E-06 4 22.5 604. 9.38355E-06 'j 37.5 1111. 1.8278lE-OS 6 52.5 1775. 2.75530E-05 7 67.~ 2371. 3.61969E-05 8 82.5 2811. 4.45b60E-OS 9 97.5 2912. 4.6l338E-05
10 112.5 3100. 4.81208E-05 11 127.5 3382. 5.24':J82E-05 12 142.5 3458. 5.36851E-05 13 IS1.5 2951. 4.S8156E-05 14 112.5 2189. 3.39795E-05 15 181.5 1 780. 2.7b384E-05 16 202.5 1532. 2.31810E-05 17 217.5 1289. 2.00:>89E-05 18 232.5 1072. 1.66tt82E-05 19 247.5 877. 1.3b135E-05 20 262.5 110. 1.10212E-05 21 271.5 556. 8.63845E-06 22 292.5 420. b.51183E-06 23 301.5 308. 4.1Bl03E-06 24 322.5 208. 3.23b5lE-06 25 337.5 149. 2.31290E-06 26 352.5 81. 1.24959E-06 21 382.5 9. 1.39705E-01 21) 412.5 -84. -1.29~lbE-06 29 442.5 -95. -1.4~!:I91E-Ob 30 472.5 13. 1.12541E-06 31 502.5 19. 3.02b95E-07
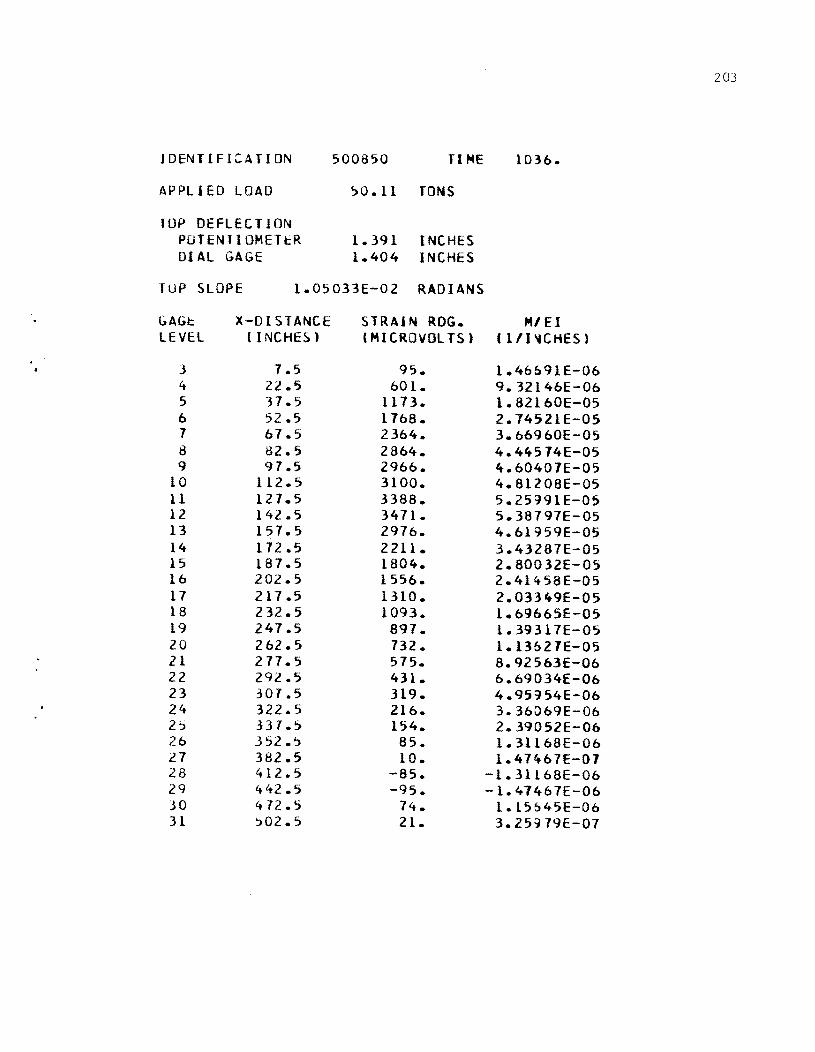
203
IDENTIFICATION 500850 TI ME 1036.
APPLIED LOAD ~O.ll TONS
TOP DEFLECTION POTENTl OMETt::R 1.391 INCHES DIAL GAGE 1.404 INCHES
TUP SLOPE 1.05033E-02 RADIANS
GAGE X-DISTANCE STRAIN RDG. MI EI LEVEL (INCHES) (MICROVOLTS) (11J"CHES)
3 1.5 95. 1.46b91E-06 4 22.5 601. 9.32146E-06 5 31.5 1113. i.82160E-05 6 52.5 1768. 2.74521E-05 1 61.5 2364. 3.66960E-05 8 82.5 2864. 4.44574E-05 9 91.5 2966. 4.60407E-05
10 112.5 3100. 4.81208E-05 11 121.5 3388. 5.25=}91E-05 12 142.5 3411. 5.38191E-05 13 151.5 2916. 4.61959E-05 14 112.5 2211. 3.43281E-05 15 181.5 1804. 2.80032E-05 16 202.5 1556. 2.41458E-05 11 217.5 1310. 2.03349E-05 18 232.5 1093. 1.69665E-05 19 241.5 891. 1.39311E-05 20 262.5 132. 1.13627E-05 21 211.5 515. 8.92563E-06 22 292.5 431. 6.69034E-06 23 301.5 3i9. 4.95954E-06 24 322.5 216. 3.36D69E-06 2':> 331.5 154. 2.39052E-06 26 352.5 85. 1.31168E-06 21 382.5 10. 1.41461E-07 28 412.5 -85. -1.3lL68E-06 29 442.5 -95. -1.47461E-06 )0 472.5 14. 1.15!>45E-06 31 502.5 21. 3.25~19E-01
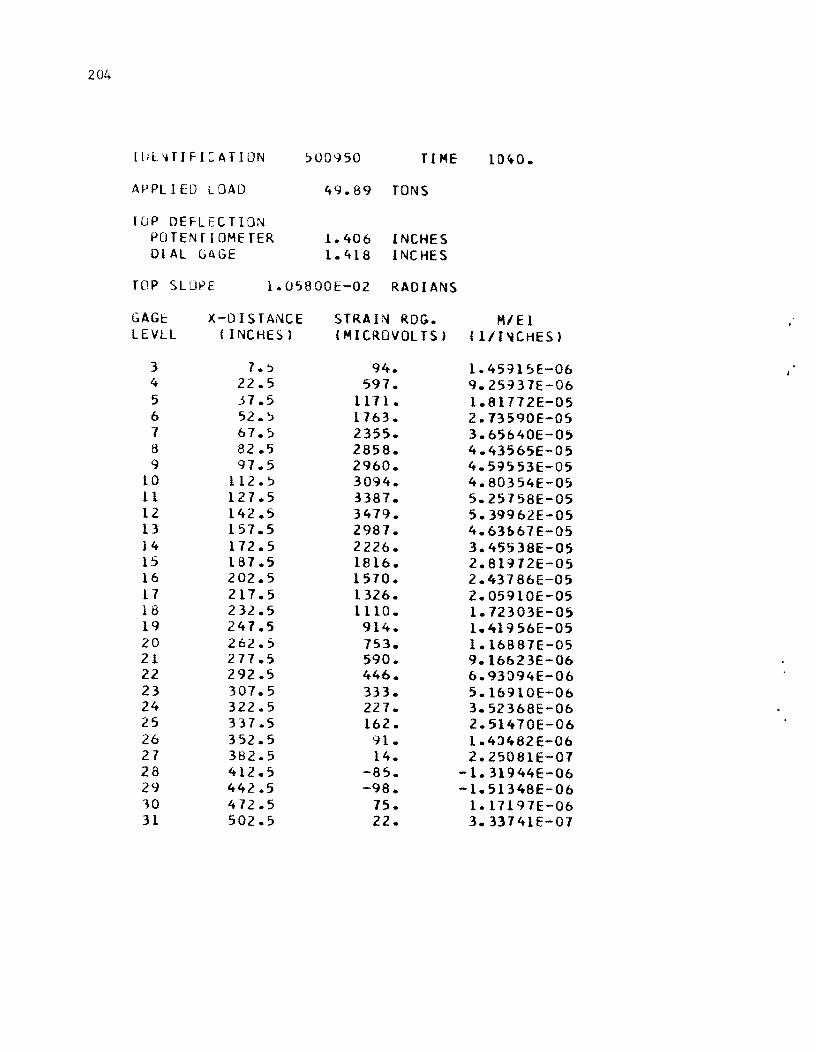
204
[ U 1:.'1 fI F 1 ;: A TID N 500950 TIME 10ltO.
APPL I ED lOAD 49.89 TONS
lOP DEFLECTION pelT EN r lOME rER 1.406 INCHES DIAL GAGE 1.418 iNCHES
TOP SLOf>E 1.05800E-02 RADIANS
GAG!: X-DISTANCE STRAIN RDG. H/EI LEVlL (INCHES) (MICROVOLTS) (1/1'iCHES)
3 1.':> 94. 1.45=Jl~E-06 4 22.5 591. 9.25=J37E-06 5 Jl.5 1111. 1.8l172E-05 6 52. ~ 1763. 2.73590E-05 7 67.';) 2355. 3.65640E-0' 8 82.5 2858. 4.43565E-05 9 97.5 2960. 4.59553E-05
LO 112.~ 3094. 4.80354E-05 II 121.5 3387. 5.25758E-05 12 142.5 3479. 5.39962E-05 13 157.5 2981. 4.63b67E-05 14 172.5 2226. 3.45538E-05 15 187.5 1816. 2.81912E-05 16 202.5 1570. 2.43786E-05 II 217.5 1326. 2.05910E-05 18 232.5 1110. 1.72303E-05 19 247.5 914. 1.41956E-05 20 262.5 753. 1.16BB7E-05 21 271.5 590. 9.l6623E-06 22 292.5 446. 6.93094E-06 23 307.5 333. 5.16910E-06 24 322.5 227. 3.52368E-06 25 331.5 162. 2.511t70E-06 26 352.5 91. 1.4l482E-06 21 382.5 14. 2.25081E-07 28 412.5 -85. -1.31944E-06 29 442.5 -98. -1.51348E-06 10 472.5 15. 1.17197E-06 31 502.5 22. 3.33741E-07

205
IOENTIFICATION 5010~0 TI ME IJ~ 7.
APPLIED LOAD 50.38 TONS
lOP DEFLECTION POTHHIOMETER 1.426 1 NCHE S DIAL GAGE 1.439 INCHES
TOP SLOPE 1.07067E-02 RADIANS
GAGE X-DISTANCE STRAI~ RDG. M/EI LEVEL (INCHES) (MICROVDLTS) (l/l'1CHES)
3 7.5 95. L.41467E-06 4 22.S 604. 9.36803E-06 5 37.5 1184. 1.83790E-05 6 52.S 177S. 2.75S30E-OS 7 67.5 2375. 3.68667E-05 8 82.5 2877. 4.46592E-05 9 97.5 2985. 4.63434E-05
10 112.5 3121. 4.84390E-05 11 127.5 3422. 5.31191E-05 12 142.5 3489. 5.41S9LE-05 13 157.5 3020. 4.68789E-05 14 172.5 2254. 3.49:}62E-05 15 187.5 1845. 2.8f)319E-05 16 202.5 lS97. 2.47977E-05 17 217.5 1348. 2.09325E-05 18 232.S 1133. 1.75874E-05 19 247.S 938. 1.4S~04E-05 20 262.5 773. L.20069E-05 21 277.5 607. 9.42236E-06 22 292.5 463. 7.19Ct83E-06 23 307.5 344. 5.34761E-06 24 322.5 234. 3.64D10E-06 25 337.5 170. 2.63112E-06 26 352.5 95. 1.471t67E-06 21 382.5 L7. 2.63888E-07 28 412.5 -85. -1.32120E-06 29 442.5 -99. -1.52~OOE-06 30 472.5 18. 1.20302E-06 31 502.5 22. 3.41502E-07
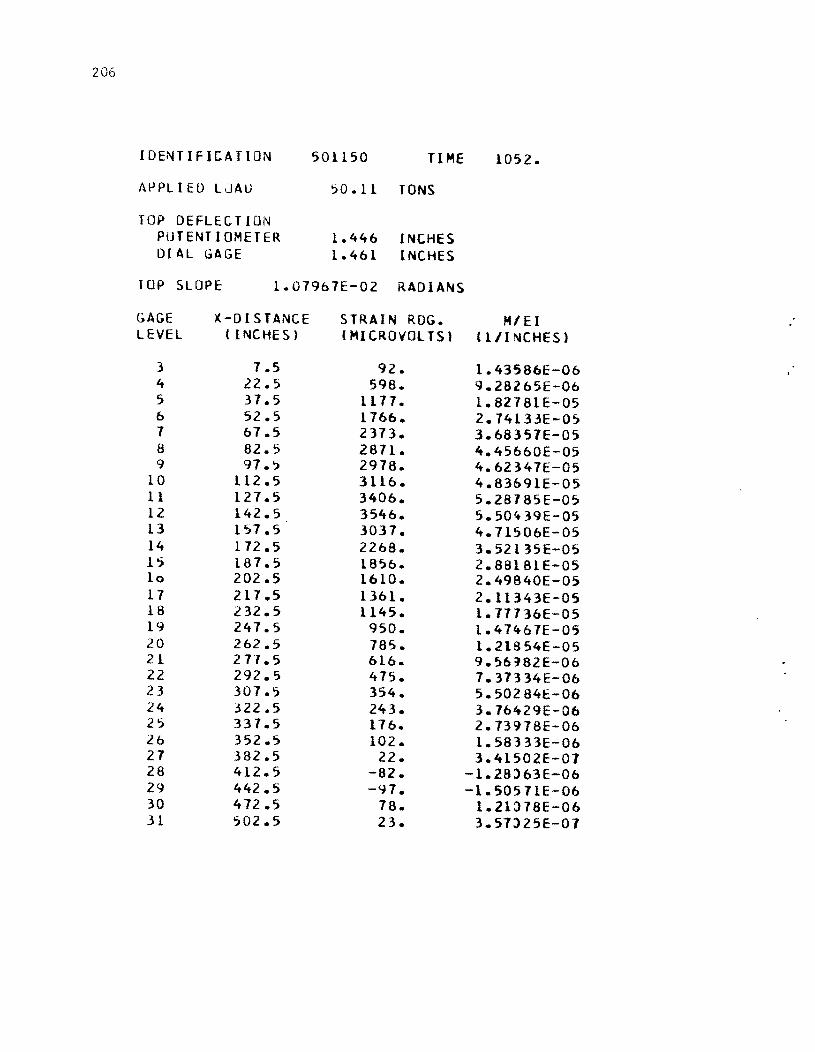
206
IDENTIFICATION 501150 TIME 1052.
At'PLI EO LJAU ':>0.11 TONS
TOP DEFLECTION PUTENTIOMETER 1.446 INCHES DlAL GAGE 1.461 INCHES
TOP SLOPE 1.07967E-02 RADIANS
GAGE X-DISTANCE STRAIN RDG. M/EI LEVEL ( I NCHE S) (MICROVOLTS) lill NCHES)
3 7.S 92. l.43586E-06 4 22.5 598. 9.28265E-06 5 37.S 1177. 1.8278lE-OS 6 52.5 1766. 2.74133E-05 1 67.5 2373. 3.683S1E-OS 8 82.5 2811. 4.45660E-05 9 97.':> 2978. 4.62347E-OS
10 112.5 3116. 4.83691E-OS 11 127.5 3406. 5.28185E-05 12 142.5 3546. 5.S0ft39E-05 13 157.5 3037. 4.71506E-OS 14 172.S 2268. 3.52135E-05 15 187.5 1856. 2.88181E-OS 10 202.S 1610. 2.49840E-05 17 217.S 1361. 2.11343E-05 18 232. S 114S. 1.71736E-OS 19 247.5 950. 1.47467E-OS 20 262.5 785. 1.21854E-05 21 21"1.5 616. 9.56~82E-06 22 292.5 475. 7.31334E-06 23 307.5 354. 5.50284E-06 24 322.S 243. 3.76429E-06 25 331.5 176. 2.73978E-06 26 352.5 102. 1.S8333E-06 27 382.5 22. 3.41502E-07 28 412.5 -82. -1.28J63E-06 29 442.5 -97. -1.50571E-06 30 472.5 78. 1.2lJ78E-06 31 502.S 23. 3.S7J25E-01

207
I DEN T I f I CAr I (l N 501250 TIME 1056.
APPLIED LOAD 49.27 TONS
TOP DEFLECTION POTENTl OMETtR 1.448 INCHES DIAL GAGE 1.462 INCHES
TOP SLOPE 1.07433E-02 RADIANS
GAGE X-DISTANCE STRAIN RDG. HIE I LEVEL (INCHES) (MICROvOLTS) 11/1'lCHES)
J 1., 91. 1.4D!t82E-06 4 22.5 581. 9.11966E-06 5 31.5 1161. 1.80220E-05 b 52.5 1731. 2.69109E-05 7 61.5 2345. 3.(4)88E-05 6 82.5 2838. 4.40615E-05 9 91.5 2941. 4.57458E-05
10 112.5 3087. 4.19261E-05 11 121.5 3381. 5.24904E-05 12 142.5 3538. 5.49198E-05 13 157.5 3031. 4.10491E-05 14 112.5 2270. 3.52291E-05 15 181.5 1859. 2.88492E-05 16 202.5 1614. 2.50461E-05 17 211.5 1369. 2.12508E-05 18 232.5 1154. 1.19133E-05 19 241.5 959. 1.48:J64E-05 20 262.5 191. 1.23117E-05 21 277.5 628. 9.74634E-06 22 292.5 486. 7.54409E-06 23 301.5 364. 5.65801E-06 24 322.5 251. 3.88841E-06 2, 337.5 181. 2.81139E-06 26 352.5 107. 1.(6)94E-06 21 382.5 26. 4.11355E-07 213 412.5 -81. -1.24959E-06 29 442.5 -91. -1.50511E-06 30 472.5 17. 1.18750E-06 31 502.5 22. 3.33141E-01
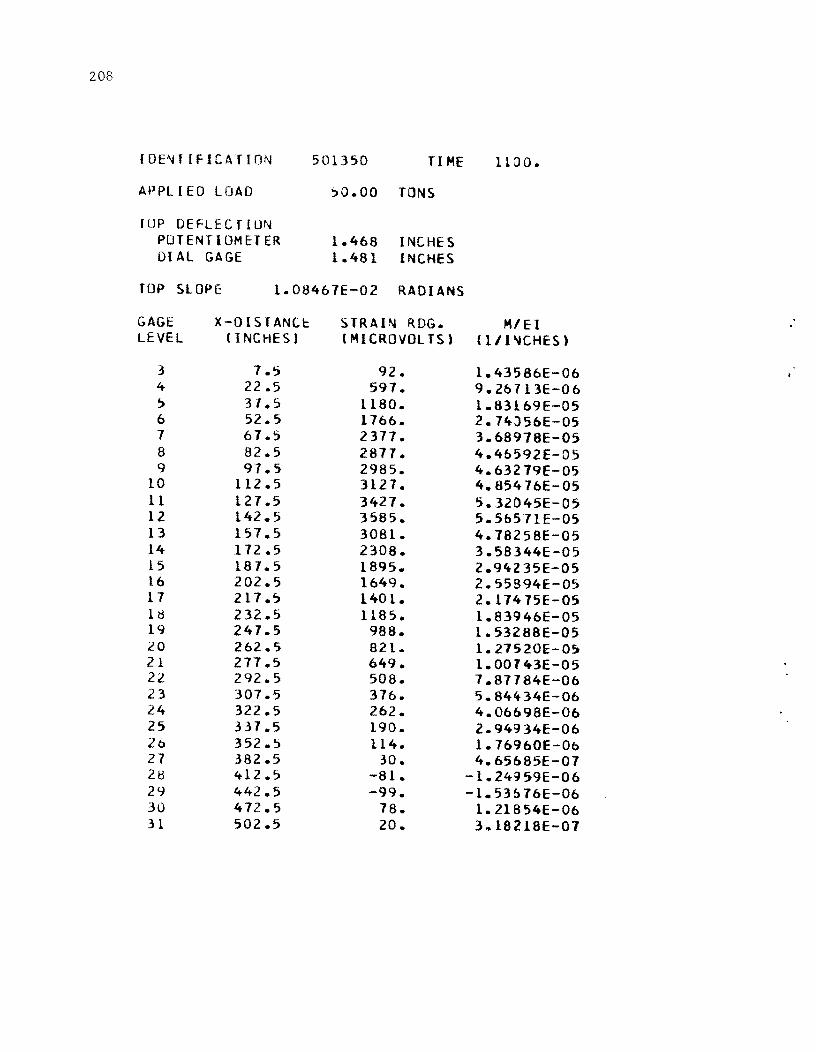
208
IOE ... rIFICATION 501350 TI ME 11)0.
APPL I EO LOAD ~O.OO TONS
HlP DEFLEC r ION POTENTIOMETER 1.468 I NCHE S Dl AL GAGE 1.481 INCHES
TOP SLOPE 1.08467E-02 RADIANS
GAGE X-DISTANCE STRAP-ol RDG. M/Ef LEVEL (INCHES) (MICROVOLTS) (l/1~CHES)
3 7.5 92. 1.43586E-06 4 22.5 597. 9.26713E-06 ~ 31.5 1180. 1.83169E-05 6 52.5 1766. 2.74)56E-05 7 67.5 2377. 3.68918E-05 8 82.5 2871. 4.46592E-05 9 91.5 2985. 4.63219E-05
10 112.5 3127. 4.85476E-05 11 121.5 3427. 5.32045E-05 12 142.5 3585. 5.56511E-05 13 157.5 3081. 4.18258E-05 14 172.5 2308. 3.58344E-05 15 181.5 1895. 2.94235E-05 16 202.5 1649. 2.55894E-05 17 217.~ 1401. 2. 17475E-05 18 232.5 1185. 1.83946E-05 19 241.5 988. 1.53288E-05 20 262.5 821. 1.27520E-05 21 277.5 649. 1.00143E-05 22 292.5 508. 7.87184E-06 23 307.5 376. 5.84434E-06 24 322.5 262. 4.06698E-06 25 331.5 190. 2.94934E-06 26 352.5 114. 1.76960E-06 27 382.5 30. 4.65685E-07 21:3 412.5 -81. -1.24~59E-06 29 442.5 -99. -1.53!l76E-06 30 472.5 78. 1.21854E-06 31 502.5 20. 3 .. 18218E-07

209
IDENTIFICATION 501450 TI ME 1103.
APPLIED LOAD 49.63 TONS
TOP DEFU:CTION POTENTl OMETER 1.477 INCHES DIAL GAGE 1.491 INCHES
TOP SLOPE 1.09133E-02 RADIANS
GAGE X-D(STANCE STRAIN ROG. M/EI LEVEL (INCHES) (MICROVOLTS) ( llI~CHES)
3 7.5 92. 1.42:>34E-06 4 22.5 593. 9.20504E-06 5 37.5 1173. 1.821bOE-05 6 52.5 1756. 2.725S1E-05 1 61.5 2367. 3.67503E-05 8 82.5 2865. 4.44729E-05 9 97.5 2976. 4.61SB2E-05
10 112.5 3117. 4.83S47E-05 11 127.5 3421. 5.31036E-05 12 142.5 3592. 5.57S80E-05 13 151.5 30Sb. 4.79J34E-05 14 172.5 2318. 3.59742E-05 15 187.5 1903. 2.95322E-05 16 202.5 1658. 2.57291E-05 11 217.5 1409. 2.1S117E-05 18 232.5 1192. 1.85J32E-05 19 247.5 999. 1.55073E-05 20 262.5 834. 1.2~538E-05 21 277.5 661. 1.02~06E-05 22 292.5 516. 8.00202E-06 23 307.5 386. 5.99~57E-06 24 32L.5 271. 4.19B93E-06 25 337.5 197. 3.05024E-06 26 352.5 119. 1.83'l46E-Ob 27 382.5 35. 5.35538E-07 28 412.5 -79. -1.22630E-06 29 442.5 -97. -1.50571E-06 30 412.5 81. 1.24959E-06 31 502.5 23. 3.57025E-07

210
I DPH I F I;: A T ION 501550 TI ME 1110.
APPll ED LOAD 50 .. 16 TONS
TOP DEFLECTION POTENTIOMETER 1.494 INCHES DIAL GAGE 1.509 INCHES
TOP SLOPE 1.10167E-02 RADIANS
GAGE )(-D[STANCE STRAIN RDG. MI E I lEVEL CINCHES) (MICROVOLTS) Cl/l'4CHES)
3 7.'> 95. 1.46691E-06 4 22.5 599. 9.2'1S11E-06 5 37.5 1184. 1 .. 83190E-05 6 52.') 1169. 2.14616E-05 7 61.5 2385. 3.70142E-05 8 82.5 2884. 4.41156E-05 9 97.5 2994. 4.64831E-05
10 112.5 3139. 4.81262E-05 11 121.5 3445. 5.34b84E-05 12 142.5 3621. 5.62082E-05 13 157.5 3112. 4.92993E-05 14 112.5 2339. 3.63019E-05 15 187.5 1924. 2.98582E-05 16 202.5 1614. 2.59115E-05 17 217.5 1423. 2.20~b7E-05 18 232.5 1204. 1.86'172E-05 19 241.5 1006. 1.56237E-05 20 262.5 839. 1.30314E-05 21 271.5 664. 1.03149E-05 22 292.5 516. 8.00202E-06 23 301.5 388. b. 022 8bE-Ob 24 322.5 271. 4.19693E-06 25 137.5 194. 3.01~19E-06 26 352.5 116. 1.80B41E-06 27 382.5 33. 5.04492E-01 28 412.5 -82. -1.21281E-06 29 442.5 -99. -1.52900E-06 30 472.5 80. 1.24183E-06 31 502.5 23. 3.51025E-01

211
IDENTIFICATION ~O1650 TIME 1120.
APPLIED LOAD 49.71 TONS
TUP DEFLECTIJN POTENTIOMETER 1.502 INCHES DIAL GAGE 1.517 INCHES
rop SLOPE 1.10100E-02 RADIANS
GAGE X-DISTANCE STRAIN ROG. M/EI LEVEL ( INCHES) (MICROVOLTS) (l/INCHES)
3 1.5 93. 1.45138E-06 4 22.5 595. 9.24384E-06 5 31.S 1117. 1.82104E-05 6 52.5 1759. 2.73l24E-OS 1 67.S 2374. 3.68512E-OS 8 B2.5 2815. 4.46281E-05 9 97.5 2985. 4.63434E-05
10 112.5 3134. 4.86563E-05 11 121.S 3445. 5.34839E-05 12 142.5 3625. 5.62180E-05 13 157.5 3121. 4. 854 76E~05 14 172.5 2354. 3.65401E-05 15 181.5 1938. 3.00910E-05 16 202.5 1690. 2.62413E-05 11 211.S 1441. 2.23584E-05 18 232.5 1223. 1.89167E-05 19 241.5 1026. 1.59264E-05 20 262.5 858. 1.33186E-05 21 211.5 682. 1.05666E-05 22 292. S 534. 8.28143E-06 23 301.5 405. 6.28675E-06 24 322.5 287. 4.45505E-Ob 25 331.5 210. 3.25979E-06 26 352.5 130. 2.01197E-06 27 382.5 42. 6.59120E-07 28 412.5 -15. -1.16421E-06 29 442.5 -95. -1.46691E-06 30 472.5 18. 1.21B54E-06 31 502.5 23. 3.49264E-Ol
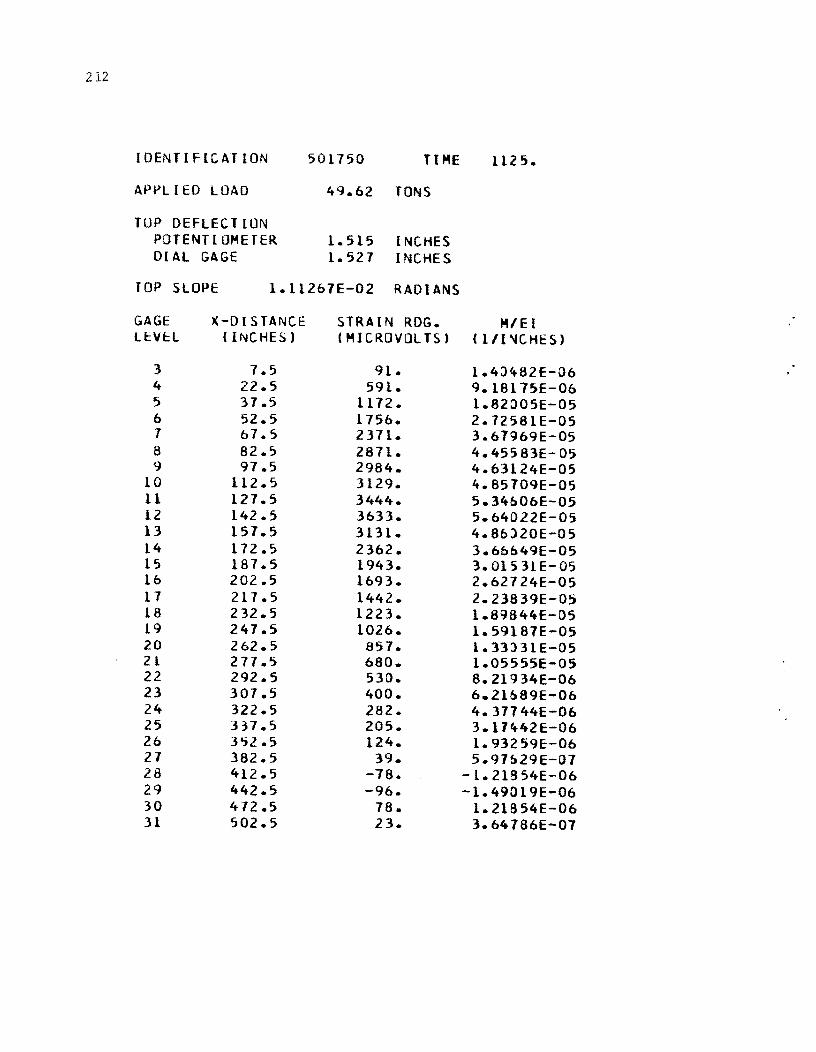
212
IDENTIFICATION 501750 TIME 1125.
APPLIED LOAD 49.62 TONS
TUP DEFLECTION POTENTIOMETER 1.515 INCHES DIAL GAGE 1.527 INCHES
TOP SLOPE 1.11261E-02 RADIANS
GAGE X-DISTANCE STRAIN RDG. M/EI LE::VI::L (INCHES) (MICROVOLTS) (l/l'4CHES)
3 7.5 91. 1.4Jlt82E-06 4 22.5 591. 9.18175E-06 5 37.5 1112. 1.82005E-05 6 52.5 1756. 2.72581E-05 7 67.5 2371. 3.67969E-05 8 82.5 2871. 4.455 83E- 05 9 97.5 2984. 4.63124E-05
10 112.5 3129. 4.85709E-05 11 127.5 3444. 5.34b06E-05 12 142.5 3633. 5.64022E-05 13 151.5 3131. 4.8bl20E-05 14 172.5 2362. 3.6bb49E-05 15 187.5 1943. 3.01531E-05 16 202.5 1693. 2.62724E-05 17 217.5 1442. 2.23839E-05 18 232.5 1223. 1.89S44E-05 19 247.5 1026. 1.59181E-05 20 262.5 857. 1.33l31E-05 21 277.5 680. 1.05555E-05 22 292.5 530. 8.21934E-06 23 301.5 400. 6.21b89E-06 24 322.5 282. 4. 37144E-06 25 337.5 205. 3.17lt42E-06 26 3<;2.5 124. 1.93259E-06 27 382.5 39. 5.97b29E-01 28 412.5 -78. -1.21!J54E-06 29 442.5 -96. -1.49019E-06 30 472.5 78. 1.21S54E-06 31 502.5 23. 3.64786E-07
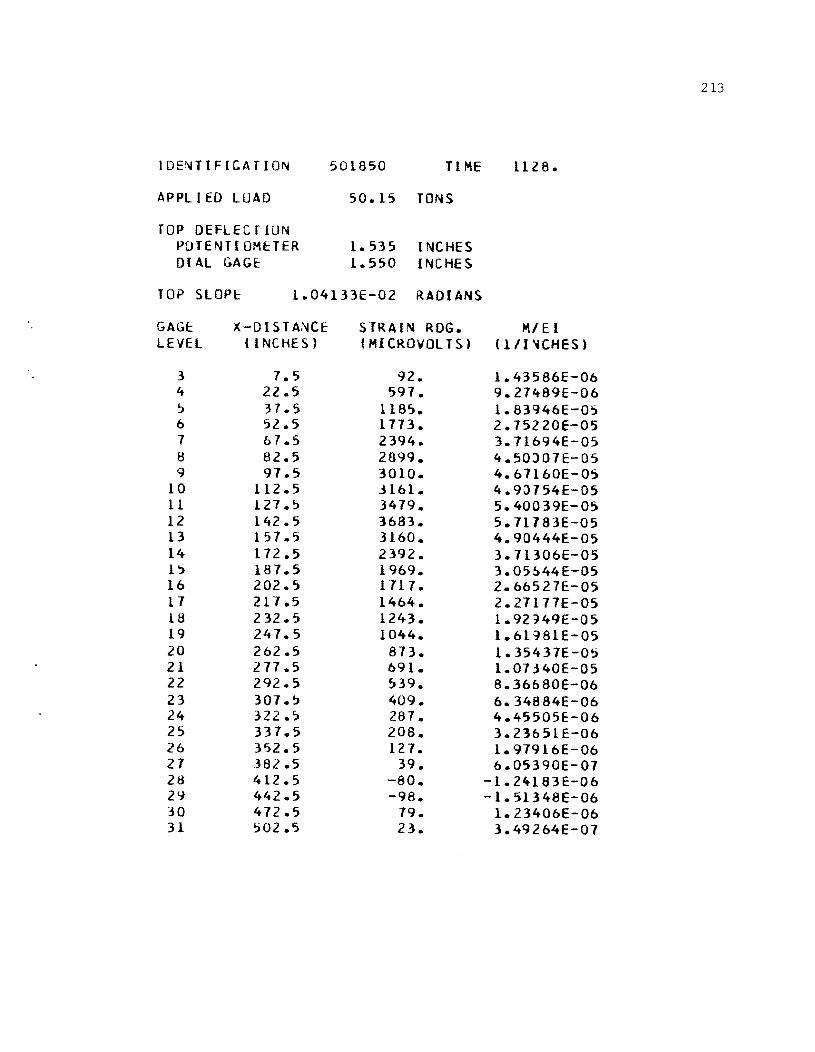
213
I D E'\I T I FIe A TI ON 501850 TI ME 1126.
APPLIED LOAD 50.15 TONS
TOP DEFLEC r ION POTENTI OMtTER 1.535 INCHES D[AL GAGE 1.550 INCHES
TOP SLOP!:: 1.04133E-02 RADIANS
GAGt X-DISTANCE: STRAIN ROG. M/EI LEVEL (INCHES) (MICROVOLTS) nIl ~CHES)
3 7.5 92. 1.43586E-06 4 22.5 591. 9.27469E-06 ? 37.5 1185. 1.63946E-05 6 52.5 1713. 2.15220E-05 7 67.5 2394. 3.11694E-05 t3 82.5 2899. 4.50J01E-05 9 91.5 3010. 4.61160E-OS
10 112.5 3161. 4.90154E-05 11 127.5 3419. 5.40039E-OS 12 142.5 3683. 5.1l183E-05 13 151.5 3160. 4.90444E-05 14 112.5 2392. 3.11306E-0' 1') 181.5 1969. 3.05~44E-05 16 202.5 1711. 2.bb527E-05 11 211.5 14b4. 2.21111E-05 18 232.5 1243. 1.92~49E-05 19 241.5 1044. 1.b1981E-05 20 262.5 873. 1.35431E-05 21 211.5 b91. 1.01340E-05 22 292., 539. 8.36b80E-Ob 23 301.!J 409. 6.34884E-Ob 24 322.5 287. 4.45'05E-Ob 25 331., 208. 3.23b'lE-Ob 2b 352.5 121. 1.9191bE-Ob 21 382., 39. b.05390E-01 28 412.5 -80. -1.24183E-Ob 29 442.5 -98. -1.51348E-Ob 30 412.5 79. 1.23406E-Ob 31 S02.5 23. 3.492b4E-01
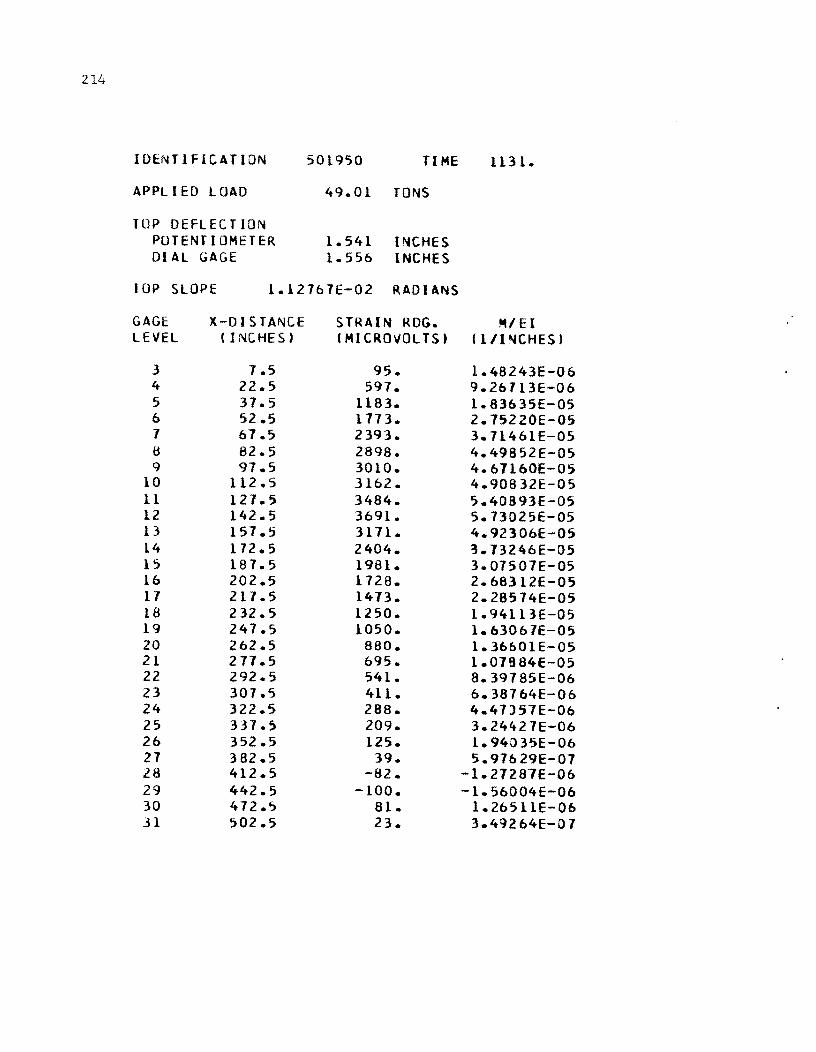
214
IDt:NTIF1CATION 501950 TIME 1131.
APPLI ED LOAD 49.01 TONS
TOP DEFLECTION POTENTIOMETER 1.541 I~CHES DIAL GAGE 1.556 INCHES
rop SLOPE 1.12767E-02 RADIANS
GAGE X-DISTANCE STRAIN RDG. MIEI LEVEL ( INCHES) (MICRO\lOLTS' (1/1NCHES)
3 7.5 95. 1.48243E-06 4 22.5 597. 9.2b713E-Ob 5 37.5 1183. 1.63b35E-05 6 52.5 1773. 2.75220E-05 1 67.5 2393. 3.71461E-05 B 82.5 2898. 4.49B52E-05 9 97.5 3010. 4.61160E-05
10 112.5 3162. 4.90832E-05 11 121.5 3484. 5.40893E-05 12 142.5 3691. 5.73025E-05 13 157.5 3171. 4.92306E-05 14 172.5 2404. 3.13246E-05 IS 187.5 1981. 3.07507E-05 16 202.5 1728. 2.b6312E-05 11 211.5 1473. 2.28574E-05 18 232.5 1250. 1.94113E-05 19 247.5 1050. 1.630b7E-05 20 262.5 880. 1.36b01E-05 21 271.5 695. 1.07884E-05 22 292.5 541. 8.39785E-Ob 23 307.5 411. 6.38764E-06 24 322.5 288. 4.47J57E-06 25 337.5 209. 3.24427E-06 26 352.5 125. 1.94035E-06 27 382.5 39. 5.97b29E-07 28 412.5 -82. -1.21281E-06 29 442.5 -100. -1.56004E-06 30 472.5 81. 1.26511E-06 31 502.5 23. 3.49264E-07

215
IDENTIfICATION 502050 II ME 1138.
APPLIED LOAD 48.94 TONS
TOP DEFLECTION POTENTIOMETER 1.553 INCHES DIAL GAGE 1.571 INCHES
TOP SLOPE 1.13261E-02 RADIANS
GAGE X-DISTANCE STRAIN RDG. MIEI LEVEL (INCHES) (MICROVOLTS) (l/l ..... CHES)
3 1.5 93. 1.45138E-06 4 22.5 601. 9.32922E-06 5 31.5 1191. 1.84811E-05 6 52.5 1180. 2.16229E-05 1 61.5 2402. 3.12858E-05 B 82.5 2901. 4.51249E-05 9 91.5 3019. 4.68&34E-05
10 112.5 3113. 4.92b11E-05 11 127.5 3499. 5.43144E-05 12 142.5 3710. 5.15891E-05 13 151.5 3188. 4.94868E-05 14 112.5 2419. 3.15lt20E-05 15 181.5 1995. 3.09158E-05 16 202.5 1142. 2.10485E-05 11 217.5 1487. 2.3:)141E-05 18 232.5 1263. 1.96131E-05 19 247.5 1061. 1.64&20E-05 20 262.5 891. 1.38231E-05 21 217.5 106. 1.09591E-05 22 292.5 551. 8.55308E-06 23 301.5 419. 6.50407E-06 24 322.5 293. 4.55595E-06 25 337.5 213. 3.30636E-06 26 352.5 128. 1.99468E-06 27 382.5 41. 6.3blt36E-01 28 412.5 -82. -1.27281E-06 29 442.5 -102. -1.51551E-06 30 472.5 81. 1.24~59E-06 31 502.5 23. 3.64186E-07