latimer road w10 commercial properties viability study · chelsea to consider the market for...
TRANSCRIPT
Latimer Road W10 Commercial Properties Viability Study
April 2015
1
Contents 1. Introduction ....................................................................................................................... 2
1.1. The Brief ............................................................................................................................ 2
1.2. Frost Meadowcroft ............................................................................................................. 2
2. Latimer Road Overview ...................................................................................................... 3
2.1. Location ............................................................................................................................. 3
2.2. Access ................................................................................................................................ 4
2.3. Local Amenities .................................................................................................................. 4
3. Market Summary................................................................................................................ 6
3.1. The London Office Market .................................................................................................. 6
3.2. The Local Market ................................................................................................................ 6
3.3. Office Rental Market .......................................................................................................... 8
3.4. Office Transactions ............................................................................................................. 9
3.5. Light Industrial Rental Market ........................................................................................... 10
3.6. Light Industrial Rental Transactions .................................................................................. 10
3.7. Local Sales Transactions .................................................................................................... 11
3.8. Vacancy Rates .................................................................................................................. 11
3.9. Outlook ............................................................................................................................ 12
3.10. Local Planning Policies ...................................................................................................... 12
4. Viability Assessment - Introduction ................................................................................... 14
4.1. Purpose of Viability Assessment ....................................................................................... 14
4.2. Methodology.................................................................................................................... 14
4.3. Residual and Investment Method Valuations .................................................................... 14
4.4. Profit on Cost ................................................................................................................... 16
4.5. Assumptions .................................................................................................................... 16
5. Viability Assessment - Overview ....................................................................................... 19
5.1. Qualitative Assessment .................................................................................................... 19
5.2. Quantitative Assessment .................................................................................................. 19
6. Conclusions ...................................................................................................................... 20
7. Appendices ...................................................................................................................... 21
2
1. Introduction
1.1. The Brief
1.1.1. The Royal Borough of Kensington and Chelsea is the smallest London Borough. It is also
the second most densely populated Borough in London. It is one of the most desirable
parts of London to live as historically the industry of London was further east and the
wealthier properties and parks were located to the west of central London.
1.1.2. This report is prepared by Frost Meadowcroft for the Royal Borough of Kensington &
Chelsea to consider the market for commercial properties in Latimer Road and viability in
their continued use.
1.1.3. In order to assess the viability of continued office and light industrial uses in the Latimer
Road buildings, we have considered the market conditions and current supply and
demand whilst assessing each building individually, taking into account the features,
specification and condition.
1.1.4. This will help inform the Council to ensure that they are only protecting sites for
employment use, “where we are satisfied that there is a reasonable prospect of a site
being used for that purpose”1. This guidance is reiterated within the NPPG, which notes
that an understanding of local economic conditions and market realities are an integral
part of effective planning.2 It forms part of what the NPPF refers to as the “evidence
based judgement” and “a realistic value of development in the local area and an
understanding of the operation of the market.3”
1.2. Frost Meadowcroft
1.2.1. Frost Meadowcroft is a firm of Chartered Surveyors specialising in commercial agency,
consultancy advice and valuation. The firm has a detailed local knowledge of the local
market through its agency business with over 400,000 sq ft of transactions in the west
London market in 2014. The firm also carries out asset valuation work for private and
corporate clients as well as secured lending valuations for banks.
1 Para 22 of the NPPF.
2 Para 10-001-20140306 of the NPPG
3 Para 10-004-2014006 of the NPPG

3
2. Latimer Road Overview
2.1. Location
2.1.1. Latimer Road is situated in the north west of the Royal Borough of Kensington and
Chelsea bordering the London Borough of Hammersmith and Fulham. The road runs in a
northward direction from beneath the elevated section of the Westway, parallel to the
railway line, to North Pole and Barlby Road. The properties in the road are a mix of
commercial and residential use. The area to the east of Latimer Road is residential being
predominantly early 20th Century terraced housing. The study area forms part of the
Freston Road and Latimer Road Employment Zone, predominantly a commercial area
which runs along the eastern side of the railway and is bisected by the elevated section of
the Westway.
2.1.2. The commercial properties in Latimer Road are in general small standalone buildings
situated on both the east and west sides at the southern end of the road. The centre and
northern sections of the road are predominantly light industrial units known as the
‘Latimer Industrial Estate’ on the west side of the road backing on to the railway line.
There are only a few office buildings on the eastern side of the road at this end. A mixture
of flats and terraced housing form the rest of Latimer Road.
4
2.1.3. The southern section of the study area is made up of a diverse mix of commercial
properties of varying age, style and architecture. The total commercial floor space in
Latimer Road is:
Offices 8,307 sq m 89,414 sq m
Light industrial/ hybrid uses 4,615 sq m 49,585 sq ft
Total 12,922 sq m 139,000 sq ft
2.2. Access
2.2.1. Assessments of the Public Transport Accessibility Level (PTAL) carried out by Transport
for London has given Latimer Road ratings ranging from 3 (moderate accessibility) – 6a
(excellent accessibility) , with the northern end being slightly less accessible and scoring 3
and the southern end, at the junction of Oxford Gardens, benefitting from a score of 6a.
A local PTAL map can be found in Appendix A. Latimer Road is within walking distance of
4 underground stations - Latimer Road and Ladbroke Grove on the Circle and
Hammersmith & City lines and White City and Shepherds Bush on the Central and
Overground lines.
2.2.2. The schedule below shows the walking distances to the stations in the near vicinity.
Station Latimer Road (North) Latimer Road (South)
Latimer Road 0.8 miles 0.5 miles
Ladbroke Grove 0.9 miles 0.6 miles
White City 0.6 miles 0.9 miles
Shepherds Bush 1.5 miles 1.2 miles
2.2.3. The pending planning application from Imperial College to construct an underpass at the
site located at 301 Latimer Road will undoubtedly improve access to the immediate area
and reduce the travelling time to White City station.
2.3. Local Amenities
2.3.1. In the area surrounding the Freston Road/ Latimer Road Employment Zone, there are a
number of local amenities supporting local occupiers:
North Pole Road (0.2 miles) –there are a variety of small retailers ranging from a Tesco
convenience store, pharmacy, post office and take-away establishments.
St Helens Gardens (0.5 miles) – this small parade of shops comprises a bakery, dry-
cleaners, café and other retail uses.

5
Ladbroke Grove (0.7 miles) – in addition to the underground station, there are a number
of amenities ranging from eateries, convenience stores and fitness centres.
Latimer Road (0.7 miles) – in the southern parts of the Employment Zone, there are
several cafes that support the local businesses and a new Tesco convenience store
opposite the station.
Portobello Road/Golborne Road (0.9 miles) – this area features a larger number of shops
and eateries including the famous Portobello Market.
Westfield London (1.1 miles) – the development of Westfield London has resulted in a
major transformation of the surrounding area, offering local businesses and residents a
wide selection of retail, catering and services.

6
3. Market Summary
3.1. The London Office Market
3.1.1. 2014 was a strong year in terms of office take-up in the London office market and this
trend is continuing during 2015. Outside of the West End, the surrounding markets have
seen high levels of demand and rental growth. West London, along with other popular
submarkets such as Southbank, Old Street (Silicon Roundabout) and Midtown have seen
particularly strong growth and limited supply as there has been good demand.
3.1.2. Recent data has found that the amount of available office space in Central London has
fallen 50% since 2009, from 24.4 million sq ft to 12.7 million sq ft. In the last 12 months
total space fell 14% and all of the core central London markets have seen a decline in
available space in 2014. The West End's vacancy rate is now critically low, at just below
4%.
3.2. The Local Market
3.2.1. In the investment market, funds and property companies have shown strong interest in
West London as an area of opportunity as values in central London continue to increase
leaving less attractive yield. In comparison, West London has been seen as an area for
above average rental growth prospects.
The Western Fringe submarket consists of 1,570 office buildings totalling 14,320,000
sq ft.
The vacancy rate at the end of 2014 Q3 was just 1.6% continuing the declining trend.
Transaction volume over the last 12 months totalled £207.2 million on 11
investment deals.
7
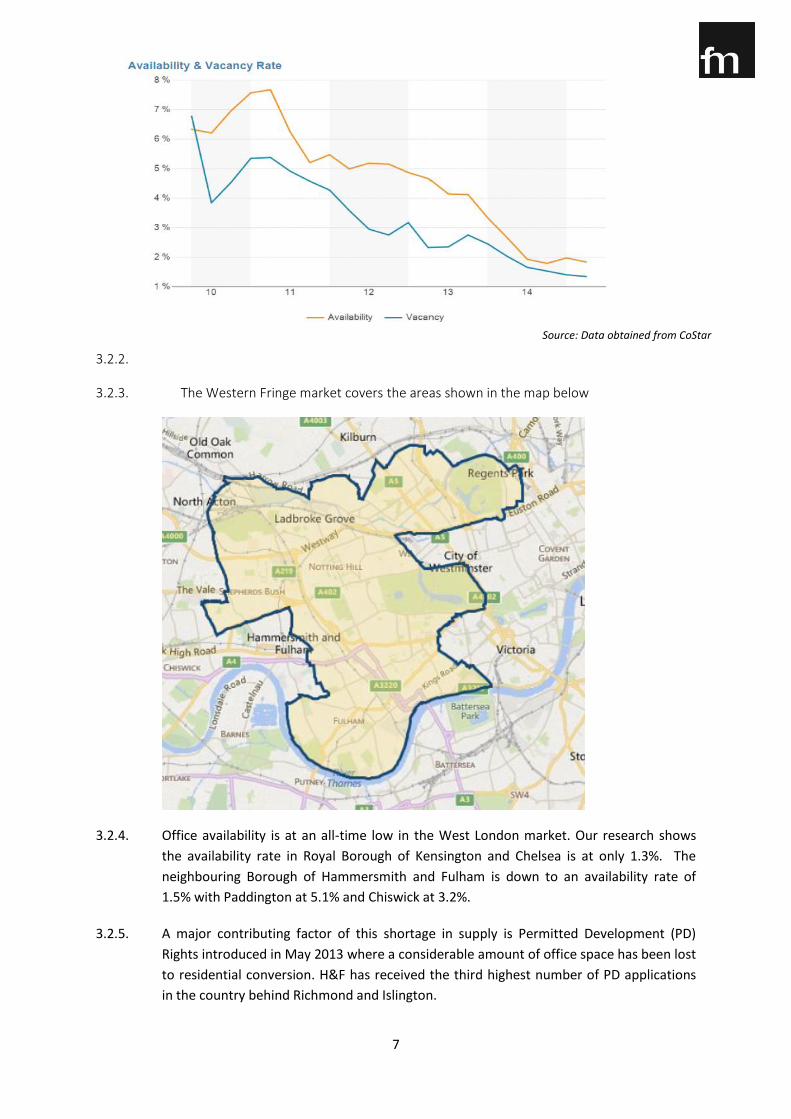
3.2.2.
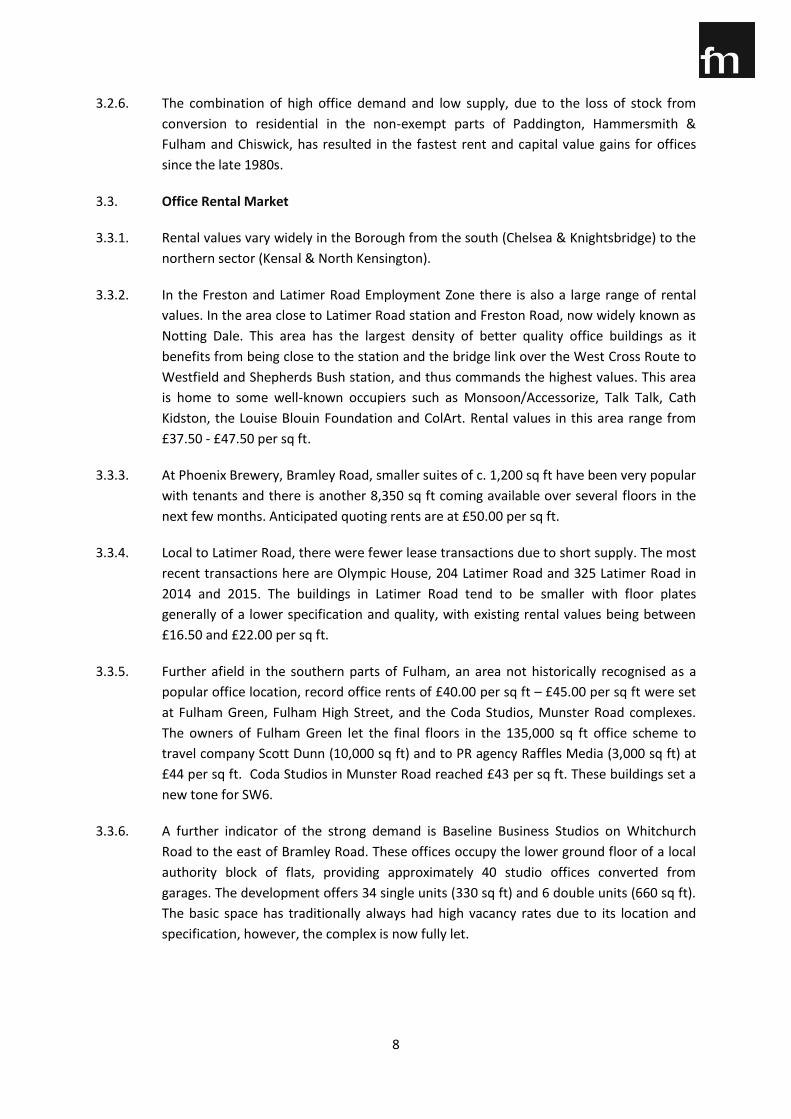
3.2.3. The Western Fringe market covers the areas shown in the map below
3.2.4. Office availability is at an all-time low in the West London market. Our research shows
the availability rate in Royal Borough of Kensington and Chelsea is at only 1.3%. The
neighbouring Borough of Hammersmith and Fulham is down to an availability rate of
1.5% with Paddington at 5.1% and Chiswick at 3.2%.
3.2.5. A major contributing factor of this shortage in supply is Permitted Development (PD)
Rights introduced in May 2013 where a considerable amount of office space has been lost
to residential conversion. H&F has received the third highest number of PD applications
in the country behind Richmond and Islington.
Source: Data obtained from CoStar
8
3.2.6. The combination of high office demand and low supply, due to the loss of stock from
conversion to residential in the non-exempt parts of Paddington, Hammersmith &
Fulham and Chiswick, has resulted in the fastest rent and capital value gains for offices
since the late 1980s.
3.3. Office Rental Market
3.3.1. Rental values vary widely in the Borough from the south (Chelsea & Knightsbridge) to the
northern sector (Kensal & North Kensington).
3.3.2. In the Freston and Latimer Road Employment Zone there is also a large range of rental
values. In the area close to Latimer Road station and Freston Road, now widely known as
Notting Dale. This area has the largest density of better quality office buildings as it
benefits from being close to the station and the bridge link over the West Cross Route to
Westfield and Shepherds Bush station, and thus commands the highest values. This area
is home to some well-known occupiers such as Monsoon/Accessorize, Talk Talk, Cath
Kidston, the Louise Blouin Foundation and ColArt. Rental values in this area range from
£37.50 - £47.50 per sq ft.
3.3.3. At Phoenix Brewery, Bramley Road, smaller suites of c. 1,200 sq ft have been very popular
with tenants and there is another 8,350 sq ft coming available over several floors in the
next few months. Anticipated quoting rents are at £50.00 per sq ft.
3.3.4. Local to Latimer Road, there were fewer lease transactions due to short supply. The most
recent transactions here are Olympic House, 204 Latimer Road and 325 Latimer Road in
2014 and 2015. The buildings in Latimer Road tend to be smaller with floor plates
generally of a lower specification and quality, with existing rental values being between
£16.50 and £22.00 per sq ft.
3.3.5. Further afield in the southern parts of Fulham, an area not historically recognised as a
popular office location, record office rents of £40.00 per sq ft – £45.00 per sq ft were set
at Fulham Green, Fulham High Street, and the Coda Studios, Munster Road complexes.
The owners of Fulham Green let the final floors in the 135,000 sq ft office scheme to
travel company Scott Dunn (10,000 sq ft) and to PR agency Raffles Media (3,000 sq ft) at
£44 per sq ft. Coda Studios in Munster Road reached £43 per sq ft. These buildings set a
new tone for SW6.
3.3.6. A further indicator of the strong demand is Baseline Business Studios on Whitchurch
Road to the east of Bramley Road. These offices occupy the lower ground floor of a local
authority block of flats, providing approximately 40 studio offices converted from
garages. The development offers 34 single units (330 sq ft) and 6 double units (660 sq ft).
The basic space has traditionally always had high vacancy rates due to its location and
specification, however, the complex is now fully let.
9
3.4. Office Transactions
3.4.1. The following pages identify some recent office letting and sales transactions in the local
market.
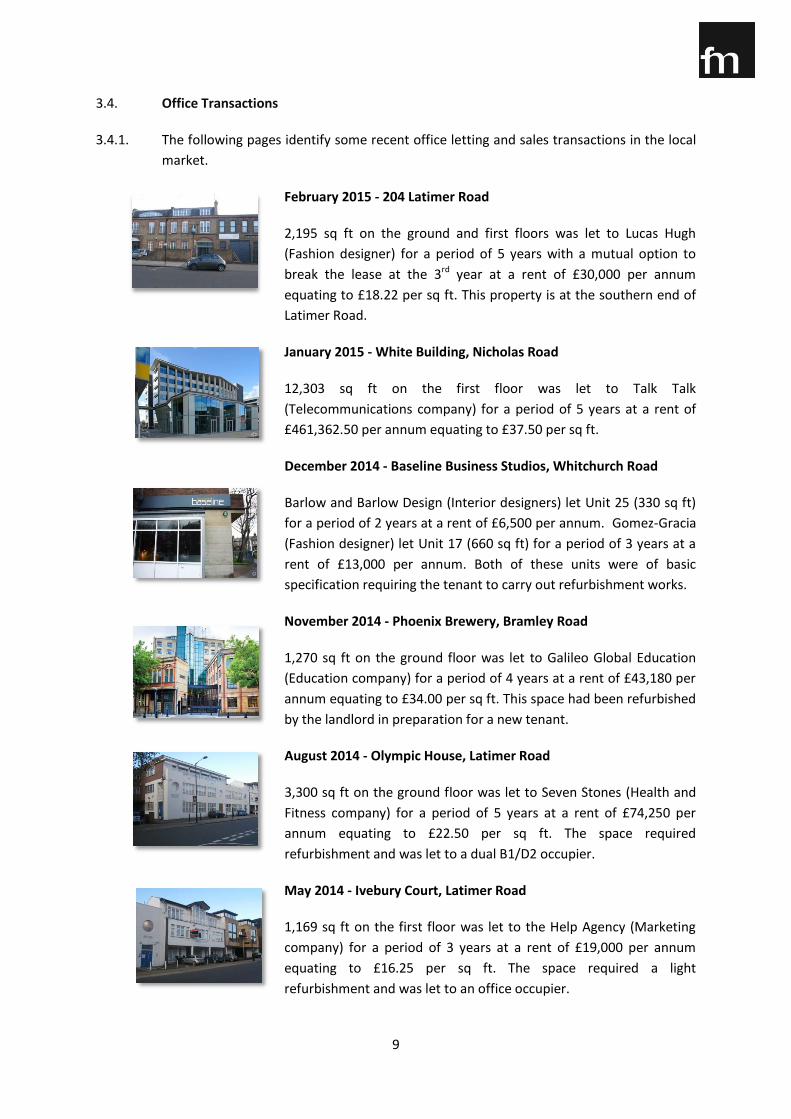
February 2015 - 204 Latimer Road
2,195 sq ft on the ground and first floors was let to Lucas Hugh
(Fashion designer) for a period of 5 years with a mutual option to
break the lease at the 3rd year at a rent of £30,000 per annum
equating to £18.22 per sq ft. This property is at the southern end of
Latimer Road.
January 2015 - White Building, Nicholas Road
12,303 sq ft on the first floor was let to Talk Talk
(Telecommunications company) for a period of 5 years at a rent of
£461,362.50 per annum equating to £37.50 per sq ft.
December 2014 - Baseline Business Studios, Whitchurch Road
Barlow and Barlow Design (Interior designers) let Unit 25 (330 sq ft)
for a period of 2 years at a rent of £6,500 per annum. Gomez-Gracia
(Fashion designer) let Unit 17 (660 sq ft) for a period of 3 years at a
rent of £13,000 per annum. Both of these units were of basic
specification requiring the tenant to carry out refurbishment works.
November 2014 - Phoenix Brewery, Bramley Road
1,270 sq ft on the ground floor was let to Galileo Global Education
(Education company) for a period of 4 years at a rent of £43,180 per
annum equating to £34.00 per sq ft. This space had been refurbished
by the landlord in preparation for a new tenant.
August 2014 - Olympic House, Latimer Road
3,300 sq ft on the ground floor was let to Seven Stones (Health and
Fitness company) for a period of 5 years at a rent of £74,250 per
annum equating to £22.50 per sq ft. The space required
refurbishment and was let to a dual B1/D2 occupier.
May 2014 - Ivebury Court, Latimer Road
1,169 sq ft on the first floor was let to the Help Agency (Marketing
company) for a period of 3 years at a rent of £19,000 per annum
equating to £16.25 per sq ft. The space required a light
refurbishment and was let to an office occupier.
10
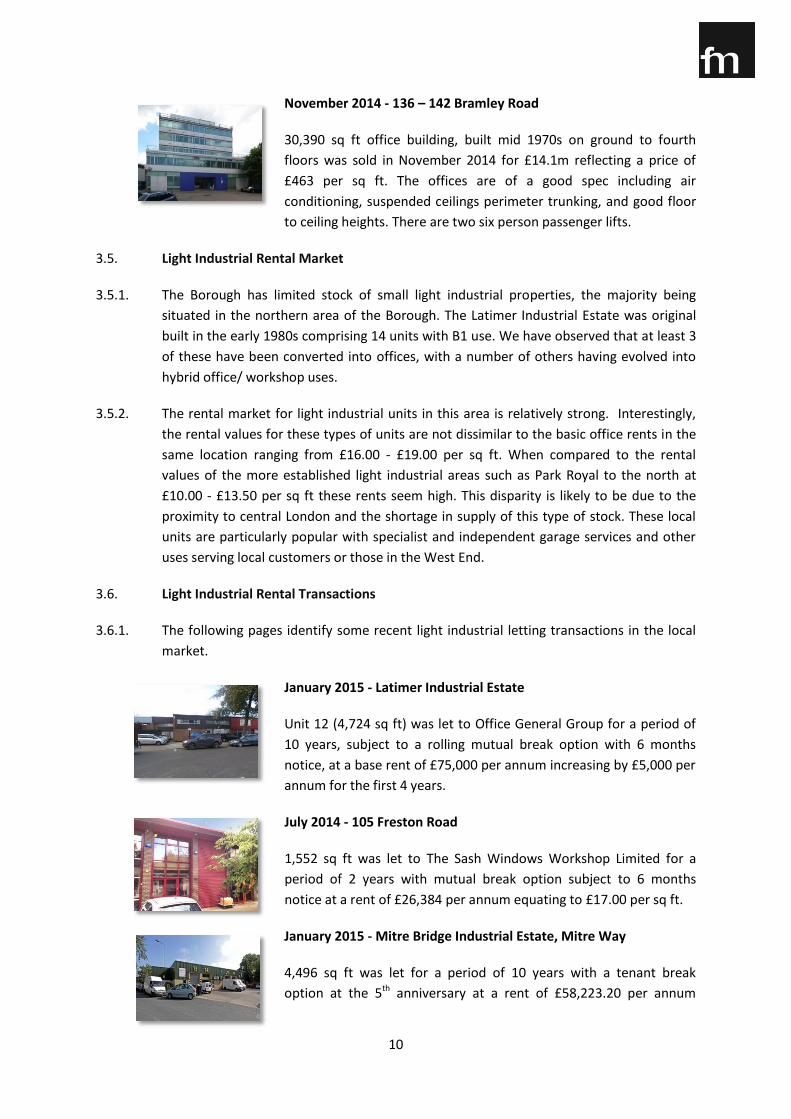
November 2014 - 136 – 142 Bramley Road
30,390 sq ft office building, built mid 1970s on ground to fourth
floors was sold in November 2014 for £14.1m reflecting a price of
£463 per sq ft. The offices are of a good spec including air
conditioning, suspended ceilings perimeter trunking, and good floor
to ceiling heights. There are two six person passenger lifts.
3.5. Light Industrial Rental Market
3.5.1. The Borough has limited stock of small light industrial properties, the majority being
situated in the northern area of the Borough. The Latimer Industrial Estate was original
built in the early 1980s comprising 14 units with B1 use. We have observed that at least 3
of these have been converted into offices, with a number of others having evolved into
hybrid office/ workshop uses.
3.5.2. The rental market for light industrial units in this area is relatively strong. Interestingly,
the rental values for these types of units are not dissimilar to the basic office rents in the
same location ranging from £16.00 - £19.00 per sq ft. When compared to the rental
values of the more established light industrial areas such as Park Royal to the north at
£10.00 - £13.50 per sq ft these rents seem high. This disparity is likely to be due to the
proximity to central London and the shortage in supply of this type of stock. These local
units are particularly popular with specialist and independent garage services and other
uses serving local customers or those in the West End.
3.6. Light Industrial Rental Transactions
3.6.1. The following pages identify some recent light industrial letting transactions in the local
market.
January 2015 - Latimer Industrial Estate
Unit 12 (4,724 sq ft) was let to Office General Group for a period of
10 years, subject to a rolling mutual break option with 6 months
notice, at a base rent of £75,000 per annum increasing by £5,000 per
annum for the first 4 years.
July 2014 - 105 Freston Road
1,552 sq ft was let to The Sash Windows Workshop Limited for a
period of 2 years with mutual break option subject to 6 months
notice at a rent of £26,384 per annum equating to £17.00 per sq ft.
January 2015 - Mitre Bridge Industrial Estate, Mitre Way
4,496 sq ft was let for a period of 10 years with a tenant break
option at the 5th anniversary at a rent of £58,223.20 per annum
11
equating to £12.95 per sq ft. The site is located north of Latimer
Road in the neighbouring borough.
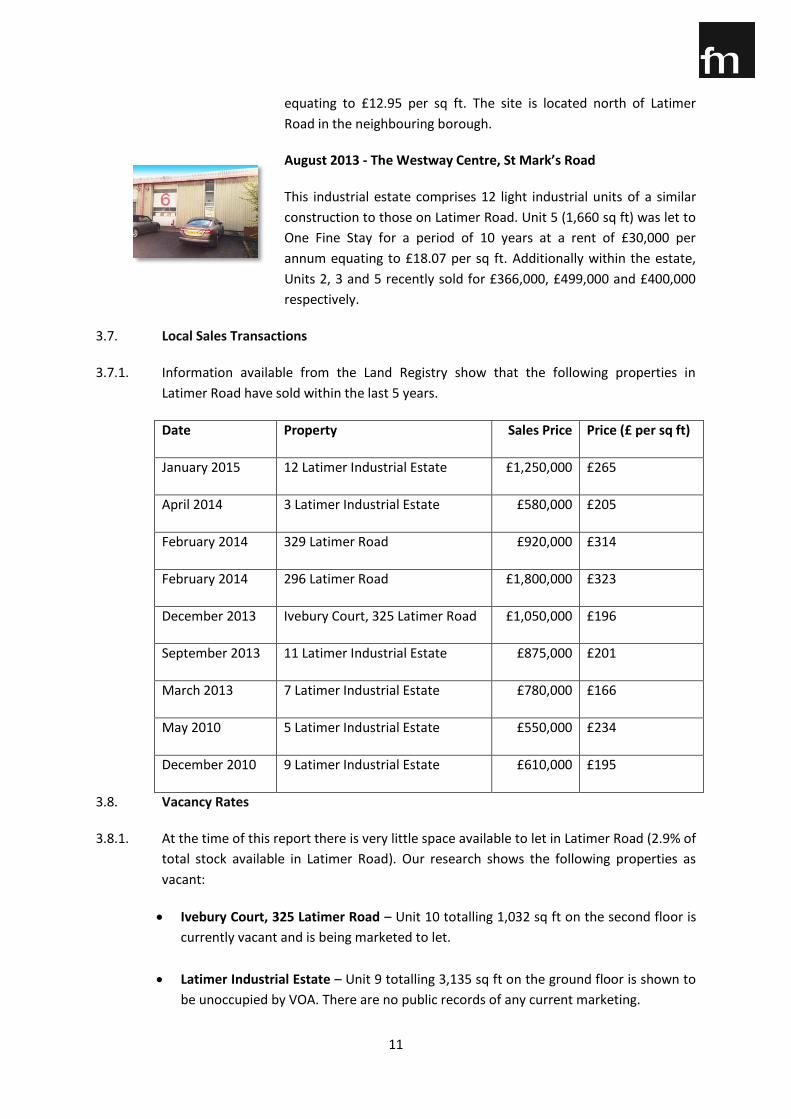
August 2013 - The Westway Centre, St Mark’s Road
This industrial estate comprises 12 light industrial units of a similar
construction to those on Latimer Road. Unit 5 (1,660 sq ft) was let to
One Fine Stay for a period of 10 years at a rent of £30,000 per
annum equating to £18.07 per sq ft. Additionally within the estate,
Units 2, 3 and 5 recently sold for £366,000, £499,000 and £400,000
respectively.
3.7. Local Sales Transactions
3.7.1. Information available from the Land Registry show that the following properties in
Latimer Road have sold within the last 5 years.
Date Property Sales Price Price (£ per sq ft)
January 2015 12 Latimer Industrial Estate £1,250,000 £265
April 2014 3 Latimer Industrial Estate £580,000 £205
February 2014 329 Latimer Road £920,000 £314
February 2014 296 Latimer Road £1,800,000 £323
December 2013 Ivebury Court, 325 Latimer Road £1,050,000 £196
September 2013 11 Latimer Industrial Estate £875,000 £201
March 2013 7 Latimer Industrial Estate £780,000 £166
May 2010 5 Latimer Industrial Estate £550,000 £234
December 2010 9 Latimer Industrial Estate £610,000 £195
3.8. Vacancy Rates
3.8.1. At the time of this report there is very little space available to let in Latimer Road (2.9% of
total stock available in Latimer Road). Our research shows the following properties as
vacant:
Ivebury Court, 325 Latimer Road – Unit 10 totalling 1,032 sq ft on the second floor is
currently vacant and is being marketed to let.
Latimer Industrial Estate – Unit 9 totalling 3,135 sq ft on the ground floor is shown to
be unoccupied by VOA. There are no public records of any current marketing.
12
3.9. Outlook
3.9.1. The outlook for the West London office market looks positive in terms of demand,
assuming no adverse economic interventions. We see continuing demand from tenants
and owner occupiers of varying sizes. The improving recognition of the immediate area as
an accepted office location, as further developments come to fruition, is helping to
establish this area as an established commercial centre.
3.9.2. The area immediately to the west of Latimer Road on the other side of the railway line is
undergoing substantial redevelopment as part of a new 3.04 hectare (7.5 acre)
innovation campus being developed by Imperial College London. Part of this scheme is
the construction of 110,000 sq ft of offices at the Translation Building, to be marketed in
2015, situated close to the proposed underpass link connecting Latimer Road and
Imperial West. This is within the White City Opportunity Area4, a 110 hectare (272 acre)
strategic regeneration zone in West London which is transforming the local area around
Shepherds Bush. This is undoubtedly going to have a positive influence on the Latimer &
Freston Road Employment Zone.
3.9.3. In the local market, developments in the pipeline over the next few years include the
next phase of the Notting Dale Village providing approximately 45,000 sq ft of offices on
Freston Road which will start construction this year.
3.9.4. The site on the corner of Bard Road and Freston Road, previously occupied by Travis
Perkins and including the separate office building at 140-144 Freston Road, has recently
been sold and the purchasers are considering redeveloping the site for commercial use.
This could be in excess of 50,000 sq ft, subject to planning.
3.10. Local Planning Policies
3.10.1. The immediate area around Notting Dale Village is within the Freston Road & Latimer
Road Employment Zone, an area specifically designated by RBKC for employment
generating uses. The Employment Zone final designation dates from 2002 with the
adoption of the 2002 UDP. However, the designation would have appeared in various
drafts of the UDP between 1995 and 2002 before the examination.
3.10.2. Within current policy there is a presumption in Employment Zones against the creation of
residential premises at the expense of employment space. The policy looks to protect
commercial uses and encourage employment-generating space under new planning
applications. New developments will therefore have a bias to office use rather than
residential and we would anticipate that if this policy continues it will encourage the
growth of this area as an important commercial hub. Access to this Employment Zone has
been vastly improved since 2002 by the upgrade of the local underground service now
incorporating the Circle Line. Combined with a pedestrian link close by to Westfield and a
further proposed additional link across the West Cross Route dual carriageway, the area
will be better connected to the rest of London for businesses and their employees.
4 White City Opportunity Area Planning Framework (2013), London Borough of Hammersmith & Fulham.

13
3.10.3. Permitted Development has had a noticeable effect on the stock of smaller older office
buildings in the surrounding areas and boroughs. Kensington & Chelsea secured an
exemption from this policy. Other central London councils such as Richmond, Camden
and Islington are now sufficiently concerned over the high levels of conversion of offices
to residential that they are implementing Article 4 directives to stop further loss of
supply.
3.10.4. The Core Strategy includes a suite of policies which seek to preserve existing office stock.
In addition this includes an ambition to provide for an additional 2,500 sq m (27,000 sq ft)
per annum, over the lifetime of the plan, if the Borough is to benefit from the predicted
need for office floor space over this time.

14
4. Viability Assessment - Introduction
4.1. Purpose of Viability Assessment
4.1.1. This section of the report considers 27 commercial properties in Latimer Road to provide
an overview of general viability of the buildings in their continued use.
4.1.2. Viability can be assessed by both qualitative and quantitative approaches.
4.1.3. The qualitative method considers the viability in a more holistic approach by assessing
the level of demand, both from owner occupiers and tenants, the number of vacant units
and the market, considering rental values in relation to capital values and recent
evidence of leased and sale transactions.
4.1.4. The quantitative approach considers the viability for the continued existing use of a
building through recognised valuations methods. In this approach we consider the
financial viability of the investment required to keep the building in its existing use.
4.1.5. It must be made clear that there are many variables that will affect the viability
assessment of any particular property at any one time. The most obvious being costs, end
values, market conditions and the rate of return required by a particular owner.
4.1.6. In a Borough largely dominated by a high value residential property market, there is clear
evidence that across all areas, conversion from office to residential would see a
significant uplift in value. This provides a high incentive for landowners to seek consent
to convert to residential uses.
4.2. Methodology
4.2.1. The RICS guidance note, Financial Viability in Planning sets out recommendations,
methodology and principles to assist those involved in viability testing which states that
an objective test of financial viability for projects should be used employing well-
established appraisal techniques. This guidance is really designed for larger
redevelopment situations, for determining the level for affordable housing or Section 106
agreements. The basic principle however is adaptable for the subject survey whereby we
need to consider the viability of keeping the buildings in their existing use. Its
consideration of land value, costs and the need for competitive returns to developers and
land owners reflects the guidance offered within both the NPPF and NPPG. 5
4.3. Residual and Investment Method Valuations
4.3.1. An accepted method of valuation of development schemes and land is called the residual
method. This recognises that the value of a development scheme is a function of a
number of elements:
the value of the completed development (gross development value (GDV));
5 NPPG Reference ID 10

15
the direct costs of developing the property (gross development cost (GDC));
the return to the developer for taking the development risk and delivering the
scheme;
the cost of any planning obligations;
the cost or value of the site (residual value).
4.3.2. In this study for the qualitative approach, we have employed the accepted investment
appraisal method to assess the existing investment value of the building and the
predicted value following refurbishment based on market yields.
4.3.3. In the basic residual approach, as identified above, the “development” is the
refurbishment works required to bring the subject property up to a condition and
specification to maximise its rental value in its existing use. In its simplest translation, this
means that if an out-dated building requires a level of expenditure in order to make it
lettable, then the building’s net worth after all the associated costs, should be greater
than the existing value. If this is not the case then it is clearly an unviable project.
4.3.4. The existing value is determined by an investment based valuation approach, applying a
market yield to the actual or estimated current rental value of the property. The
difference in values after deduction of refurbishment costs, as in the residual approach,
provides a net profit or loss figure which determines viability in this study.
4.3.5. On this approach we have adopted a 5% return on cost as indicating viability, between 0 -
5% as marginal and any negative return being unviable.
4.3.6. We previously conducted a similar study in 2014 for the whole Borough using a higher
return on cost of 10% to indicate the level of viability. That assessment was conducted on
a broader blanket approach, where a higher margin was considered more realistic. In the
subject study we have been able to assess each property individually using costings and
value inputs specific to those buildings thereby allowing a greater degree of accuracy to
be obtained. A reduction in the adopted profit level threshold to 5% for the
measurement is therefore more appropriate and recognises less risk, variance and the
market conditions.
4.3.7. It should be stressed that whilst we have assessed each building individually with the
information available to us, our appraisals are not formal valuations and have been
conducted using standard methodology and assumptions (see Assumptions below) to
provide what we consider to be the best indication available within the limitations.
4.3.8. The basic residual concept is straightforward but difficulties can arise, not only in the
method itself, but also in estimating the values of the many variables that go into the
appraisal. The residual value can also be sensitive to small changes in some variables.
4.3.9. The residual method is also highly susceptible to the attitudes of the developer or
investor, for example optimism/pessimism on values and costs and profit required. It also
makes the hypothetical assumption that the building is being purchased by an investor or

16
developer who would be carrying out these works and as such, the costs of purchasing
the building are included in the calculations when valuing, and expressed as a net yield
(see Assumptions below).
4.4. Profit on Cost
4.4.1. Another approach for existing and occupied buildings analyses the return on capital
employed to assess viability where the increased income derived from a refurbishment is
related as a commercial return (yield) on that investment. This is the other viability
assessment method adopted for this study and is more appropriate for existing owners as
it does not approach the assessment from a purchaser’s position with the associated
acquisition costs and risk which would be factored into the yield in the case of the
investment appraisal method above.
4.4.2. Whilst any refurbishment works to a property will result in an increase in value, it is
important to assess the return on investment, as the cost of refurbishment may exceed
the net improvement in value therefore raising issues relating to the true viability of a
property.
4.4.3. This approach assesses the viability of the investment required in cash terms to bring the
property up to a modern standard suitable for the tenant market. This assessment does
not consider the effect on the buildings investment value but purely the return gained
from the capital employed to effect the refurbishment project. For example if £100,000
was required to refurbish a property and the predicted uplift in the rental value was
£10,000 pa as a result of these works, then the gross return or yield on this investment
would be 10%.
4.4.4. In our assessments, case studies with a negative return on capital employed were
deemed ‘Unviable’, positive return above 5% have been classed as ‘Viable’, whereas
positive returns of less than 5% have been graded as ‘Marginal’.
4.5. Assumptions
4.5.1. For the investment and residual appraisal method for the qualitative approach utilised in
Analysis One, the following assumptions have been used in the calculations.
4.5.2. Rental Values - the rental values are the basis for the calculation of the capital value since
it is the annual income that is capitalised at a market yield to derive the investment value.
The rental value used for the subject properties in their existing condition has been based
on a combination of information available, and the estimation of the existing rental value
using our building and market knowledge. The rental values for a refurbished building
are estimated in the same way as they would be in all residual or investment appraisals.
4.5.3. Yield - the rate of capitalisation of the rental income takes into account factors such as
age and obsolescence of a building, its tenant profile and length of income. The yield is
generally referred to as an “all risks yield” which factors in risks for rental voids
associated with finding new tenants and general improvements. The yield is subject to

17
the market conditions and sentiment and also directly linked to other asset class yields
(gilts, equities etc) and interest rates.
4.5.4. Refurbishment costs - these costs will vary from building to building depending on the
size, specification, existing and intended use, but in general the range is from £20 per sq
ft for a light redecoration equivalent to standard dilapidations works following a lease
expiry, to a full refurbishment involving new services and upgrade and modernisation in a
purpose built building where costs can be £85-£100 per sq ft. These figures have been
obtained from actual recent refurbishments on buildings in the West London area in the
last 12 months (Appendix B). Figures have been adjusted for varying levels of
refurbishment and types of property. These costs can have a wide range depending on
detailed specification, procurement methods and contract size.
4.5.5. Profit - in a development scenario a residual valuation approach would factor in for a
reasonable level of profit from a development project. A developer’s profit reflects the
level of risk attached to a specific project. It can vary significantly depending on the
approach to implementation and can range from 15% to 25% on costs. We have adopted
a profit level of 10% for the profit on costs analysis and 20% for the investment approach
to reflect market risk and yields.
4.5.6. Finance costs - it is assumed that costs will be financed and interest charged at 6% to
reflect the likely short to medium term lending requirements for the period from start to
completion of a letting/sale.
4.5.7. Professional Fees - professional fees for the project have been included within the
refurbishment costs. They have been based on comparative figures but would normally
be 12.5% of estimated costs. Legal fees, marketing and agents fees have not been
included.
4.5.8. Floor Areas - the floor areas used in the calculations have been obtained from the
Valuation Office Agency for business rates as we have not been able to inspect and
measure each property internally. Generally this data is accurate however it has been
supplemented by known measured floor areas from recent sales or letting transactions
where available.

18
Address Description Occupier(s) Size
Return on
CostsViability
Change in
ValueViabilty
(sq ft) (%) (%)
200 Latimer Road Bathroom showroom and office Goslett Bathrooms 3,973 sq ft 14.8% viable 20.1% Viable
204 Latimer Road Multi-tenanted office building Multiple tenancies 2,991 sq ft 14.8% viable 8.0% Viable
Park House, 206-208 Latimer Road Multi-tenanted office building Multiple tenancies 6,067 sq ft 18.6% viable 9.1% Viable
Soane House, 305 Latimer Road Owner-occupied office building Gumball 3000 6,314 sq ft 9.3% viable 6.5% Viable
Olympic House, 317 & 321 Latimer
Road
Office building with recent planning
consent for mixed use on part ground
floor
Multiple tenancies 8,620 sq ft 12.8% viable 7.7% Viable
Ivebury Court, 325 Latimer Road Multi-tenanted office building Multiple tenancies 5,352 sq ft 12.8% viable 8.0% Viable
329 Latimer Road Owner-occupied office building Multiple tenancies 2,929 sq ft 18.5% viable 17.0% Viable
333 Latimer Road Multi-tenanted office building Multiple tenancies 2,821 sq ft 14.8% viable 8.5% Viable
335 - 339 Latimer RoadOwner-occupied office building with
recording studioMorelli & Co 4,444 sq ft 17.9% viable 9.2% Viable
272 Latimer Road Ground floor office The English Cleaning Company 721 sq ft 15.0% viable 13.9% Viable
3 Latimer PlaceModern office building occupied by
ownerDesigners Guild 14,117 sq ft 21.6% viable 6.8% Viable
290-294 Latimer RoadMixed-use residential and office
schemeMultiple tenancies 7,418 sq ft 6.2% viable 3.7% Marginal
296 Latimer RoadCurrently being redeveloped as
photographer's studio for ownerPrivate occupier 5,565 sq ft n/a n/a n/a n/a
316 - 318 Latimer Road2 storey office building occupied by
owner.re:fine 18,084 sq ft 14.4% viable 7.6% Viable
Unit 1, Latimer Industrial Estate Car repair workshop Farouk Garage 2,311 sq ft 18.6% viable 10.0% Viable
Unit 2, Latimer Industrial Estate Car repair workshop and MOT Centre MGA Motors 2,893 sq ft 18.5% viable 9.9% Viable
Unit 3, Latimer Industrial Estate Owner-occupied converted office S&O Media 2,825 sq ft 11.2% viable 5.8% Viable
Unit 4, Latimer Industrial Estate Commercial laundry service Unknown 2,876 sq ft 14.7% viable 7.9% Viable
Unit 5, Latimer Industrial Estate Assumed warehouse storage Butchoff Antiques 2,347 sq ft 11.9% viable 6.8% Viable
Unit 6, Latimer Industrial Estate Commercial catering service Unknown 4,193 sq ft 14.8% viable 7.9% Viable
Unit 7, Latimer Industrial Estate Floral decoration and office space Multiple tenancies 4,709 sq ft 14.8% viable 7.9% Viable
Unit 8, Latimer Industrial Estate Theatre space for hire The Playground Studios 3,063 sq ft 14.9% viable 8.0% Viable
Unit 9, Latimer Industrial Estate Currently vacant Vacant 3,135 sq ft 14.9% viable 7.8% Viable
Unit 10, Latimer Industrial Estate Recording studio for hire Grove Studios 4,653 sq ft 11.2% viable 5.8% Viable
Unit 11, Latimer Industrial Estate Multi-tenanted converted office Multiple tenancies 4,343 sq ft 14.8% viable 6.8% Viable
Unit 12, Latimer Industrial Estate Converted office space Office and General Cleaning 4,724 sq ft 14.8% viable 5.6% Viable
Unit 13, Latimer Industrial Estate Converted trade counter City Electrical Factors 4,777 sq ft 14.9% viable 7.8% Viable
Unit 14, Latimer Industrial Estate Assumed warehouse storage Frontiers 2,736 sq ft 11.1% viable 5.9% Viable
Viability for an Existing
Owner
Viability for an Investor
Purchaser

19
5. Viability Assessment - Overview
5.1. Qualitative Assessment
5.1.1. Market information has demonstrated the limited levels of supply and strong occupier
demand which has led to minimal vacancy levels in the local market and in the study area
of Latimer Road. This has stimulated rental growth.
5.1.2. Sales records and Land Registry information shows that 16 out of the 28 properties have
changed ownership within the last 10 years, 9 of which were sold within the last 5 years,
demonstrating an active market and good demand from both owner-occupiers and
investors. We would estimate that current market values are likely to be well in excess of
the original purchase price of the majority of the commercial properties. With these
characteristics and ready demand from owner-occupiers and tenants, we consider the
continued commercial use of these properties must be viable.
5.1.3. In the case of properties held as investments it is clearly not possible to comment on
individual investors own internal rates of return during the period of their ownership,
however there are several properties where the current income would show a
commercially viable yield based upon the original purchase price.
5.2. Quantitative Assessment
5.2.1. The results of our quantitative analysis below shows the financial viability in both of the
models. The full details of the calculation and assumptions for the individual properties
are broken down in Appendix C.
20
6. Conclusions
6.1.1. The current market is arguably at a high point for commercial property with high demand
and minimal vacancy in Latimer Road. The results of this study have conclusively shown
the viability of the existing commercial properties.
6.1.2. We are aware that historically some of the commercial properties in Latimer Road have
been harder to let than those in surrounding markets. There are a number of factors to
consider, the most influential being fluctuating market conditions when demand for
secondary property outside of the core hubs has been very low. In areas such as Latimer
Road, there can be a situation where vacancy levels rise quickly due to the shorter term
nature of the leases allowing for vacancies to become available sooner. In times of low
demand, all markets are affected to a greater or lesser degree, but in the Latimer Road
area this has led to higher than average vacancy rates. At times of low income
performance, it can be harder for owners to afford the investment to improve the
product, which in turn makes it harder to let.
6.1.3. From our agency experience in the local market, in times of both high and low demand,
we have seen reluctance from some property owners to make these investments, even
though there is clear evidence of results in securing longer term tenants at better rents if
the quality of the offering is improved.
6.1.4. Whilst it is evident that there would be potential to refurbish or upgrade existing office
and light industrial accommodation to achieve higher rent and capital values, from our
study it appears that not all owners of commercial property on Latimer Road are
undertaking such works for varying and individual reasons.
6.1.5. Assessing the viability in 2015 is very different to 5 years ago in the aftermath of the
Recession. As shown earlier in the market commentary section of this report, the supply
of commercial property today has reduced significantly and is unlikely to increase.
Combined with the improvements in the level of local amenities, transport and further
commercial developments in the area, the dynamics of the local market have also
changed permanently, with better prospects for existing properties in terms of both
occupier demand and rental growth.

21
7. Appendices
8. APPENDIX A: Public Transport Accessibility Level Map for Latimer Road and surrounding areas
22
APPENDIX B: Office Refurbishment Costs 2014/2015
Below is a sample of actual costs obtained from owners of the following buildings illustrating the range of costs
for refurbishing offices:
Broadway Studios, Hammersmith
The owners are currently modernising an entire floor of 6,800 sq ft from an old specification. Works include:
New split system air-conditioning units, plaster suspended ceilings, new lighting, new oak flooring, and general
redecoration.
Total Cost £440,000 (Approximately £65 per sq ft)
St Mary Abbots Place, Kensington
The owners carried out a Category A refurbishment two three connecting buildings which included former
tenant’s dilapidations. Works included: Roof repairs, external windows decoration, new lighting, air-
conditioning repairs, splitting of electrical services and general redecorations.
Total cost £200,000 including fees (Approximately £26 per sq ft)
Phoenix Brewery, Bramley Road
The owners are refurbishing the upper 3 floors of offices to Category A. Works includes: complete stripout of
previous tenant’s specification, new air-conditioning units, electrical work, new WCs, new oak flooring and
general redecoration.
Total cost £280,000 (Approximately £45 per sq ft)
2 Bridge Avenue, Hammersmith
The owners carried out a completion refurbishment of the entire building. Works included stripping out
existing specification, full refurbishment of the entire building, new reception, and new M&E.
Total Cost £1,350,000 (Approximately £85 per sq ft)
One King Street, Hammersmith
The owners are carrying out a full refurbishment of the fourth floor and creating an additional fifth floor.
Works include: full refurbishment of the fourth floor to Category A specification, lift extension works, new air-
conditioning units, raised flooring, new lighting, and general redecorations.
Total Costs £660,000 (Approximately £75 per sq ft)
239 Kensington High Street, Kensington
The owners carried out a full Category A refurbishment to this building, including new lighting, raised flooring,
new reception but excluding air-conditioning works.
Total Cost £2,016,000 (Approximately £67 per sq ft)
81 Kings Road, Chelsea
The owners carried out a full Category A refurbishment. Works included the upgrading of existing M&E, new
lighting and general redecorations. 1,495 sq m
Total Cost £1,030,000 (Approximately £64 per sq ft)
2 Allen Street, Kensington
The owners had a contractor priced basic refurbishment of the upper floors. Works included stripping out
existing partitioning, new air-conditioning units, installation of a suspended ceiling, new lighting and general
redecoration.
Total Cost £191,000 (approximately £41 per sq ft)

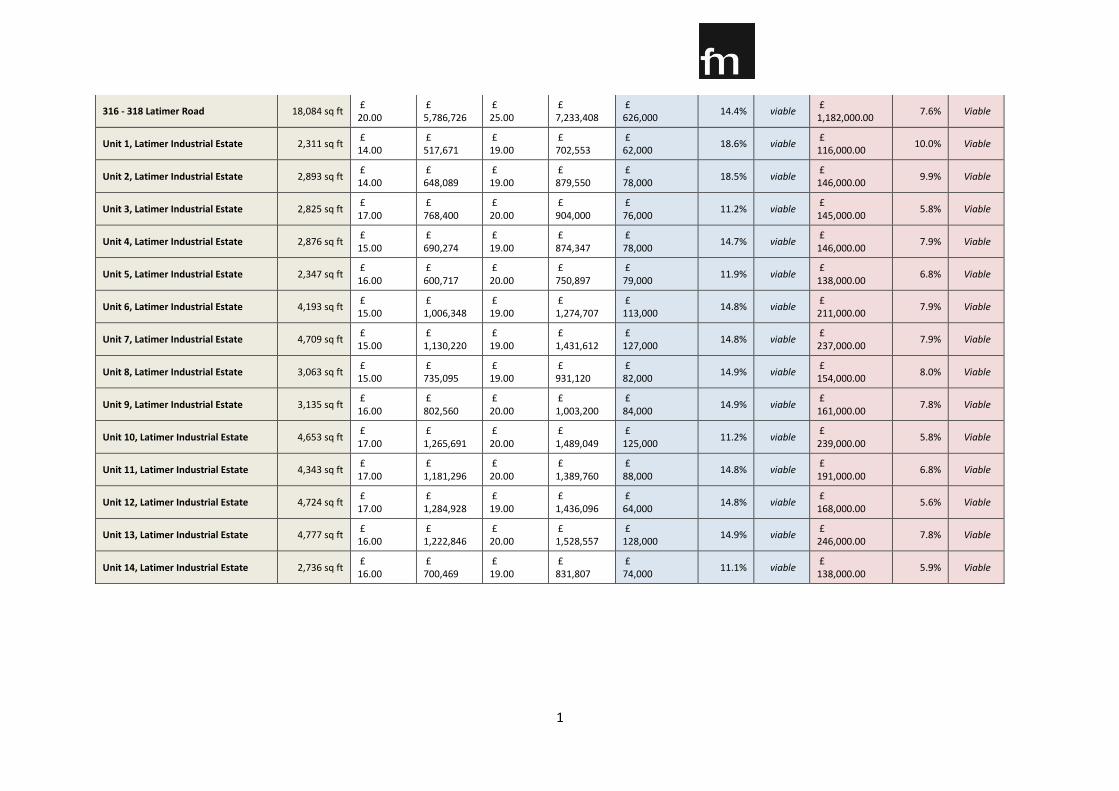
APPENDIX C: Results of Viability Assessment
Address Size Current Rental Value
Current Use Value
Estimated Rent
Value GDV Viability for an Existing Owner Viability for an Investor Purchaser
Total Costs Return
on Costs
Viability Total Costs Change in Value
Viabilty
(sq ft) (£ per sq ft) (£) (£ per sq ft) (£) (£) (%) (£) (%)
200 Latimer Road 3,973 sq ft £ 22.50
£ 1,430,277
£ 29.00
£ 1,843,468
£ 174,000
14.8% viable £ 288,000.00
20.1% Viable
204 Latimer Road 2,991 sq ft £ 18.50
£ 885,206
£ 23.50
£ 1,124,451
£ 101,000
14.8% viable £ 187,000.00
8.0% Viable
Park House, 206-208 Latimer Road 6,067 sq ft £ 18.50
£ 1,795,711
£ 23.50
£ 2,281,038
£ 163,000
18.6% viable £ 335,000.00
9.1% Viable
Soane House, 305 Latimer Road 6,314 sq ft £ 20.00
£ 2,020,532
£ 29.00
£ 2,929,771
£ 612,000
9.3% viable £ 870,000.00
6.5% Viable
Olympic House, 317 & 321 Latimer Road
8,620 sq ft £ 21.00
£ 2,896,184
£ 28.00
£ 3,861,579
£ 471,000
12.8% viable £ 780,000.00
7.7% Viable
Ivebury Court, 325 Latimer Road 5,352 sq ft £ 18.00
£ 1,541,336
£ 25.00
£ 2,140,744
£ 292,000
12.8% viable £ 466,000.00
8.0% Viable
329 Latimer Road 2,929 sq ft £ 19.00
£ 890,381
£ 24.00
£ 1,124,692
£ 79,000
18.5% viable £ 86,000.00
17.0% Viable
333 Latimer Road 2,821 sq ft £ 18.00
£ 812,363
£ 24.00
£ 1,083,151
£ 114,000
14.8% viable £ 199,000.00
8.5% Viable
335 - 339 Latimer Road 4,444 sq ft £ 20.00
£ 1,422,080
£ 26.00
£ 1,848,704
£ 149,000
17.9% viable £ 291,000.00
9.2% Viable
272 Latimer Road 721 sq ft £ 17.00
£ 196,192
£ 22.00
£ 253,896
£ 24,000
15.0% viable £ 26,000.00
13.9% Viable
3 Latimer Place 14,117 sq ft £ 23.00
£ 5,195,051
£ 26.00
£ 5,872,666
£ 196,000
21.6% viable £ 619,000.00
6.8% Viable
290-294 Latimer Road 7,418 sq ft £ 22.00
£ 2,611,216
£ 25.00
£ 2,967,290
£ 360,000
6.2% viable £ 597,000.00
3.7%
Marginal
296 Latimer Road 5,565 sq ft £ 25.00
£ 2,225,995
£ 25.00
£ 2,225,995
n/a n/a n/a n/a n/a n/a
1
316 - 318 Latimer Road 18,084 sq ft £ 20.00
£ 5,786,726
£ 25.00
£ 7,233,408
£ 626,000
14.4% viable £ 1,182,000.00
7.6% Viable
Unit 1, Latimer Industrial Estate 2,311 sq ft £ 14.00
£ 517,671
£ 19.00
£ 702,553
£ 62,000
18.6% viable £ 116,000.00
10.0% Viable
Unit 2, Latimer Industrial Estate 2,893 sq ft £ 14.00
£ 648,089
£ 19.00
£ 879,550
£ 78,000
18.5% viable £ 146,000.00
9.9% Viable
Unit 3, Latimer Industrial Estate 2,825 sq ft £ 17.00
£ 768,400
£ 20.00
£ 904,000
£ 76,000
11.2% viable £ 145,000.00
5.8% Viable
Unit 4, Latimer Industrial Estate 2,876 sq ft £ 15.00
£ 690,274
£ 19.00
£ 874,347
£ 78,000
14.7% viable £ 146,000.00
7.9% Viable
Unit 5, Latimer Industrial Estate 2,347 sq ft £ 16.00
£ 600,717
£ 20.00
£ 750,897
£ 79,000
11.9% viable £ 138,000.00
6.8% Viable
Unit 6, Latimer Industrial Estate 4,193 sq ft £ 15.00
£ 1,006,348
£ 19.00
£ 1,274,707
£ 113,000
14.8% viable £ 211,000.00
7.9% Viable
Unit 7, Latimer Industrial Estate 4,709 sq ft £ 15.00
£ 1,130,220
£ 19.00
£ 1,431,612
£ 127,000
14.8% viable £ 237,000.00
7.9% Viable
Unit 8, Latimer Industrial Estate 3,063 sq ft £ 15.00
£ 735,095
£ 19.00
£ 931,120
£ 82,000
14.9% viable £ 154,000.00
8.0% Viable
Unit 9, Latimer Industrial Estate 3,135 sq ft £ 16.00
£ 802,560
£ 20.00
£ 1,003,200
£ 84,000
14.9% viable £ 161,000.00
7.8% Viable
Unit 10, Latimer Industrial Estate 4,653 sq ft £ 17.00
£ 1,265,691
£ 20.00
£ 1,489,049
£ 125,000
11.2% viable £ 239,000.00
5.8% Viable
Unit 11, Latimer Industrial Estate 4,343 sq ft £ 17.00
£ 1,181,296
£ 20.00
£ 1,389,760
£ 88,000
14.8% viable £ 191,000.00
6.8% Viable
Unit 12, Latimer Industrial Estate 4,724 sq ft £ 17.00
£ 1,284,928
£ 19.00
£ 1,436,096
£ 64,000
14.8% viable £ 168,000.00
5.6% Viable
Unit 13, Latimer Industrial Estate 4,777 sq ft £ 16.00
£ 1,222,846
£ 20.00
£ 1,528,557
£ 128,000
14.9% viable £ 246,000.00
7.8% Viable
Unit 14, Latimer Industrial Estate 2,736 sq ft £ 16.00
£ 700,469
£ 19.00
£ 831,807
£ 74,000
11.1% viable £ 138,000.00
5.9% Viable