latin america class 4. components of new economic policy packages f creating macroeconomic stability...
Post on 22-Dec-2015
217 views
TRANSCRIPT

Latin AmericaClass 4

Components of New Economic Policy Packages
creating macroeconomic stability by controlling public sector deficits
opening up the external sector reduce the role of the state in the
productive process targeted poverty-reducing
packages

Opening up of Latin America Trade Reforms include:
– Reduction of coverage of non-tariff barriers
– reduction of average tariff level
– reduction of dispersion of tariff structure
– reduction or elimination of export taxes
– creation of regional trading blocs

0 50 100
1. Bolivia
1. Chile
1. Mexico
2. Costa Rica
2. Uruguay
3. Argentina
3. Brazil
3. Colombia
3. Guatemala
3. Paraguay
3. Peru
3. Venezuela
1985
1991-92
Average protection of tariffs & paratariffs
(percent)
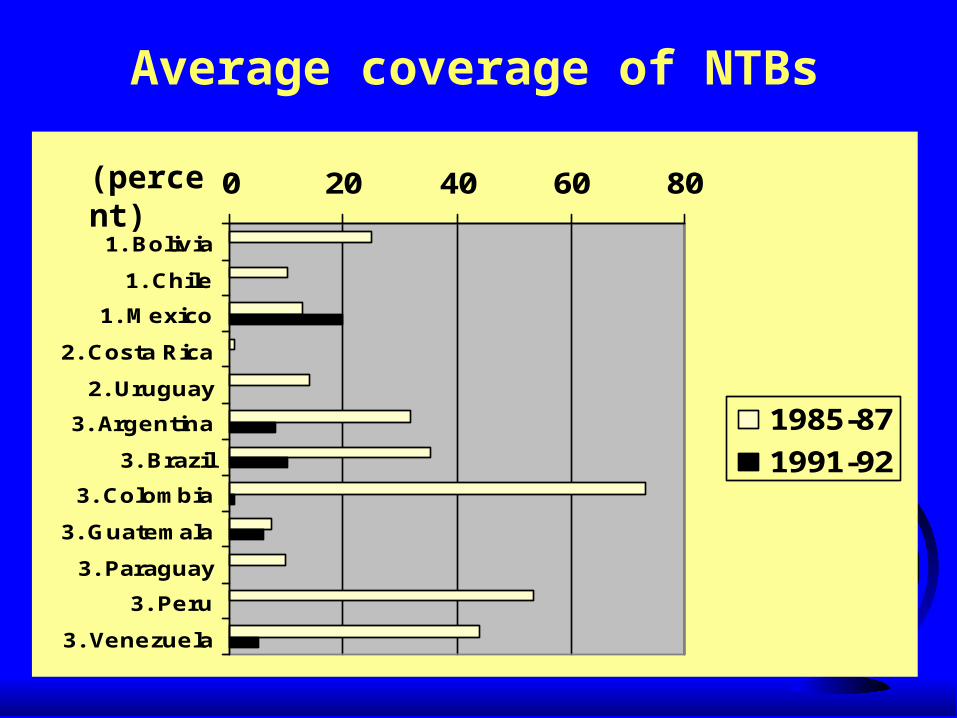
0 20 40 60 80
1. Bolivia
1. Chile
1. Mexico
2. Costa Rica
2. Uruguay
3. Argentina
3. Brazil
3. Colombia
3. Guatemala
3. Paraguay
3. Peru
3. Venezuela
1985-87
1991-92
Average coverage of NTBs
(percent)
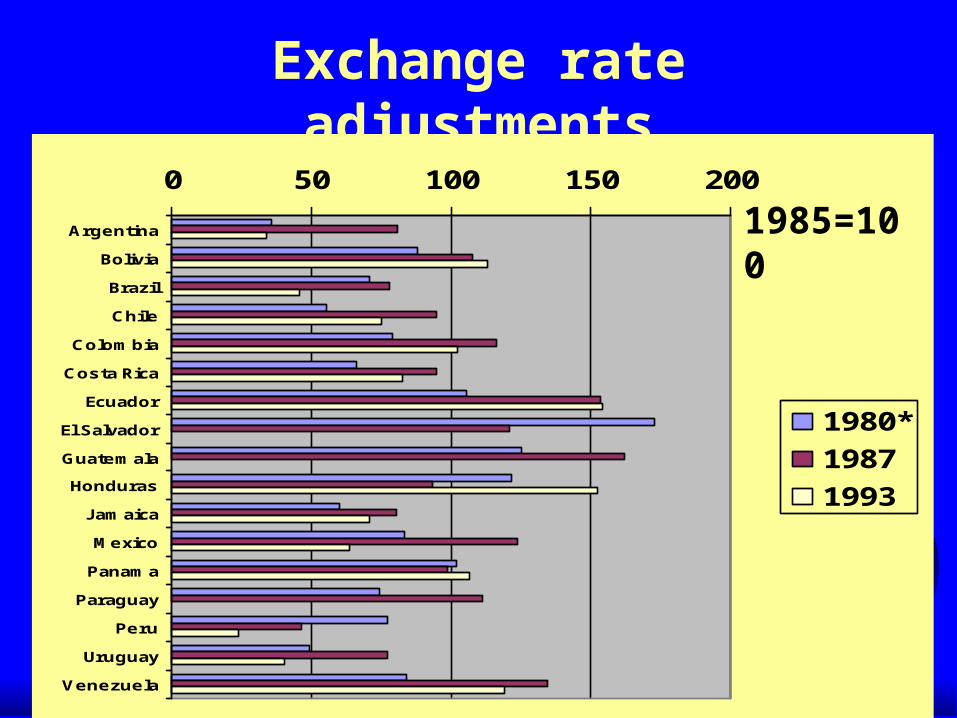
Exchange rate adjustments
0 50 100 150 200
Argentina
Bolivia
Brazil
Chile
Colombia
Costa Rica
Ecuador
El Salvador
Guatemala
Honduras
Jamaica
Mexico
Panama
Paraguay
Peru
Uruguay
Venezuela
1980*
1987
1993
1985=100

Volume of exports
-10 0 10 20
Argentina
Bolivia
Brazil
Chile
Colombia
Costa Rica
Ecuador
Mexico
Paraguay
Peru
Uruguay
Venezuela
1970-80
1982-87
1987-91
Annual % rate of change

Exports of manufactured goods as percent of all
exports0 20 40 60
Argentina
Bolivia
Brazil
Chile
Colombia
Costa Rica
Ecuador
Mexico
Paraguay
Peru
Uruguay
Venezuela
1980*
1991

Annual % change in export volume and value,
1991-93-10 0 10 20
Argentina
Bolivia
Brazil
Chile
Colombia
Costa Rica
Ecuador
Mexico
Paraguay
Peru
Uruguay
Venezuela
Volume
Value

Impacts of opening up these economies
to the global economy???
Impacts of opening up these economies
to the global economy???
Problem: Relatively short experience
Problem: Relatively short experience

Mexico’s Maquiladora Progam
Dates back to 1960s allows duty-free import of inputs to
make products for re-export U.S. levies tariffs on value added
only originally intended to solve
development problems of northern border zone
later extended to entire country
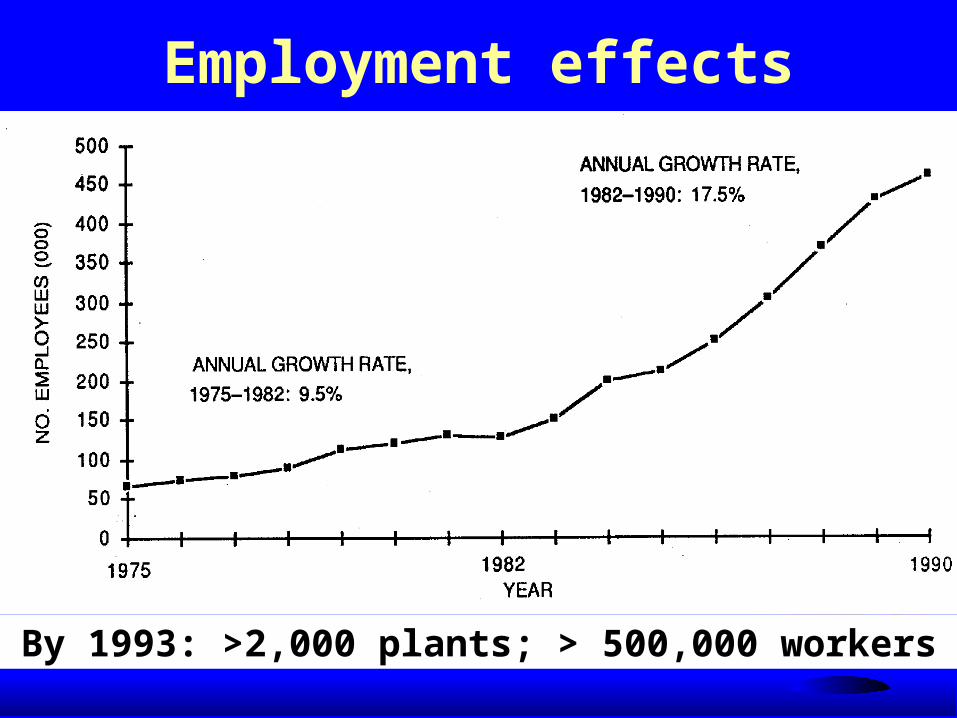
Employment effects
By 1993: >2,000 plants; > 500,000 workers

Changes in the work process
Year Labor costs %of operating
% skilledworkers
Avg.employees per
plant1875-81 avg 18 9 186
1982 16 11 2171984 12 12 2971986 10 13 2811988 11 13 2651990 13 13 238
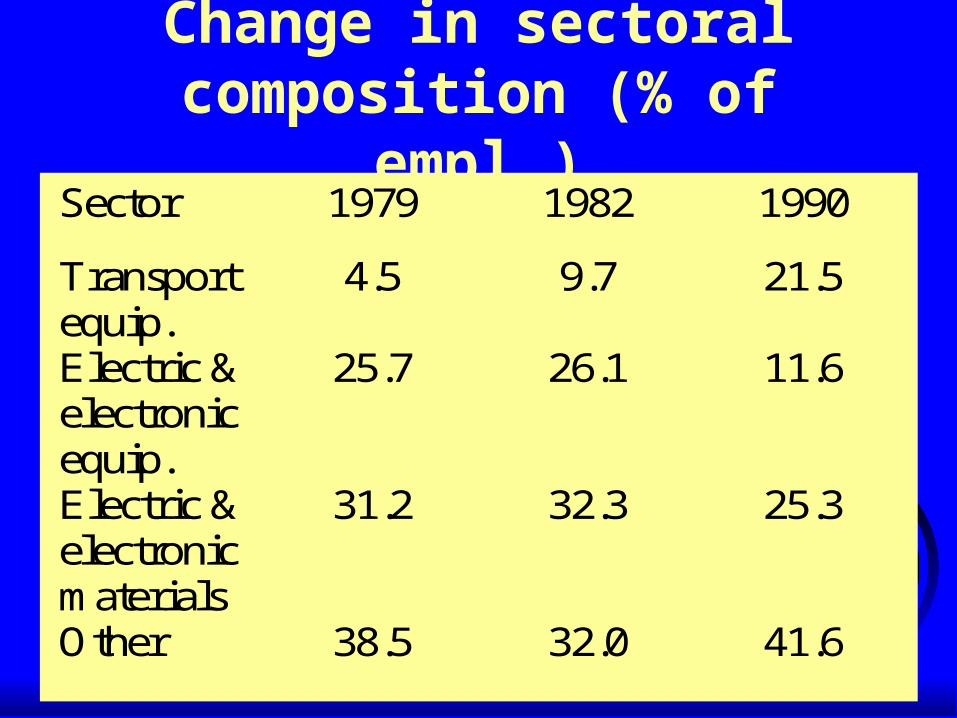
Change in sectoral composition (% of
empl.)Sector 1979 1982 1990
Transportequip.
4.5 9.7 21.5
Electric &electronicequip.
25.7 26.1 11.6
Electric &electronicmaterials
31.2 32.3 25.3
Other 38.5 32.0 41.6
0
5
10
15
20
1979
*19
8019
8119
8219
8319
8419
8519
8619
8719
8819
8919
90
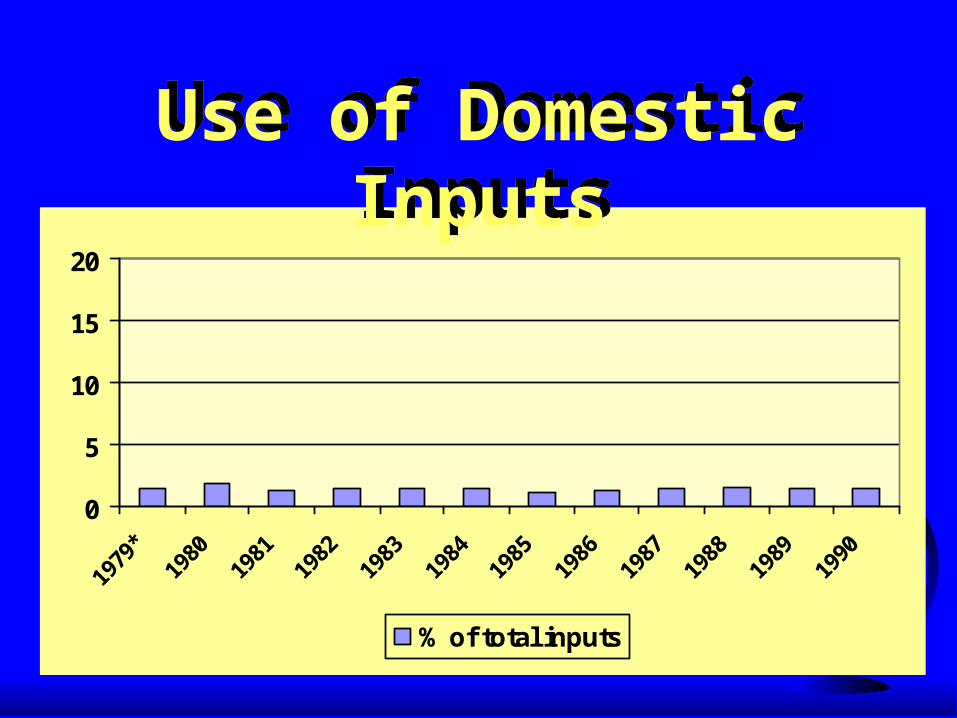
% of total inputs
Use of Domestic Inputs
Use of Domestic Inputs

Factors Factors High prices, low quality and
unpredictable delivery limited industrial history of
northern region locus of authority for purchasing
inputs tariff problems somewhat unique
to this program

Impact of modest local inputs
Impact of modest local inputs
Modest economic multiplier effects

Have post-reform growth prospects met
expectations???One assessment.–Easterly et al. 1997. Has
Latin America’s post-reform growth been disappointing? Journal of International Economics 43: 287-311.
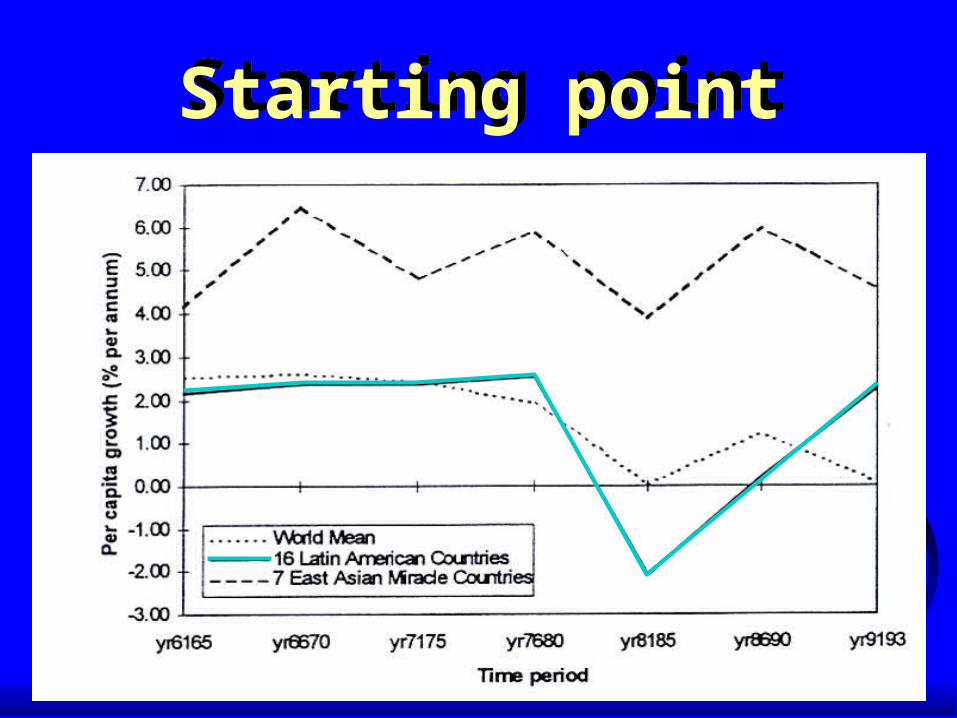
Starting pointStarting point
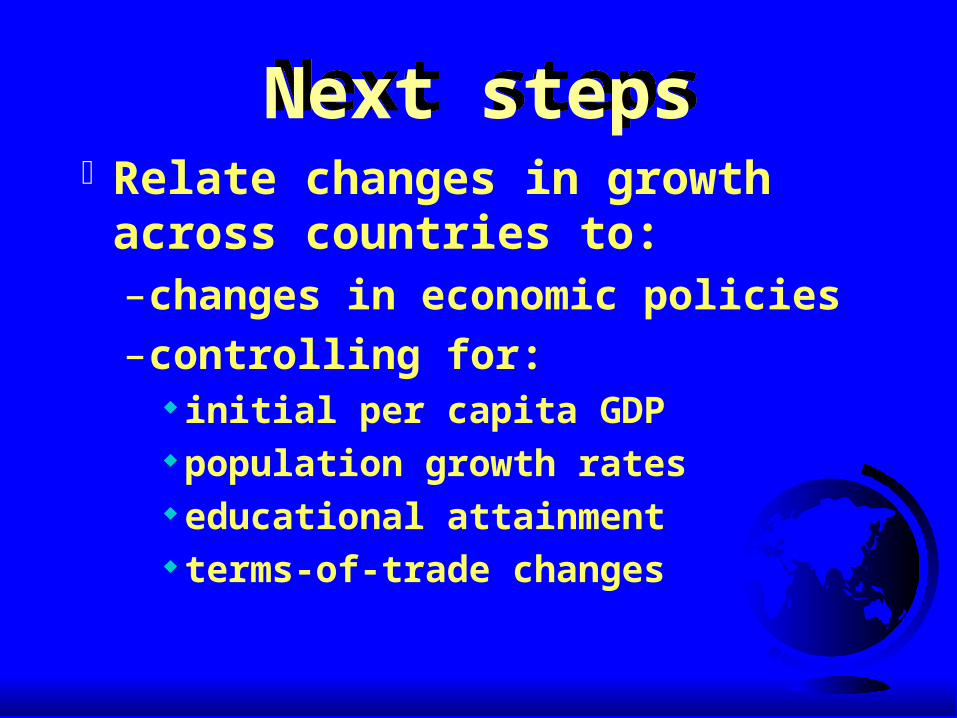
Next stepsNext stepsRelate changes in growth across countries to:–changes in economic policies–controlling for:
initial per capita GDP population growth rates educational attainment terms-of-trade changes
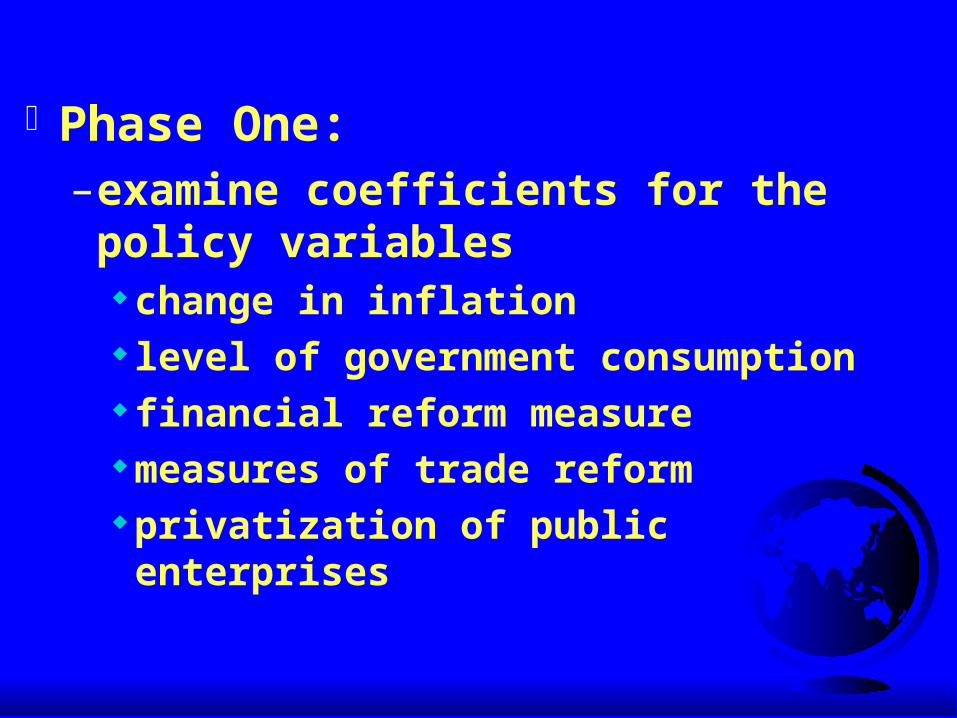
Phase One:–examine coefficients for the policy variables change in inflation level of government consumption financial reform measure measures of trade reform privatization of public enterprises

Phase Two:–Create predicted change values
for Latin American countries–Compare to actual growth rates
Findings. There is no Latin American growth puzzle. Latin American economies performed roughly as expected.
Phase 3An explicit comparison of
Latin America and East and SE Asia in the early 1990s
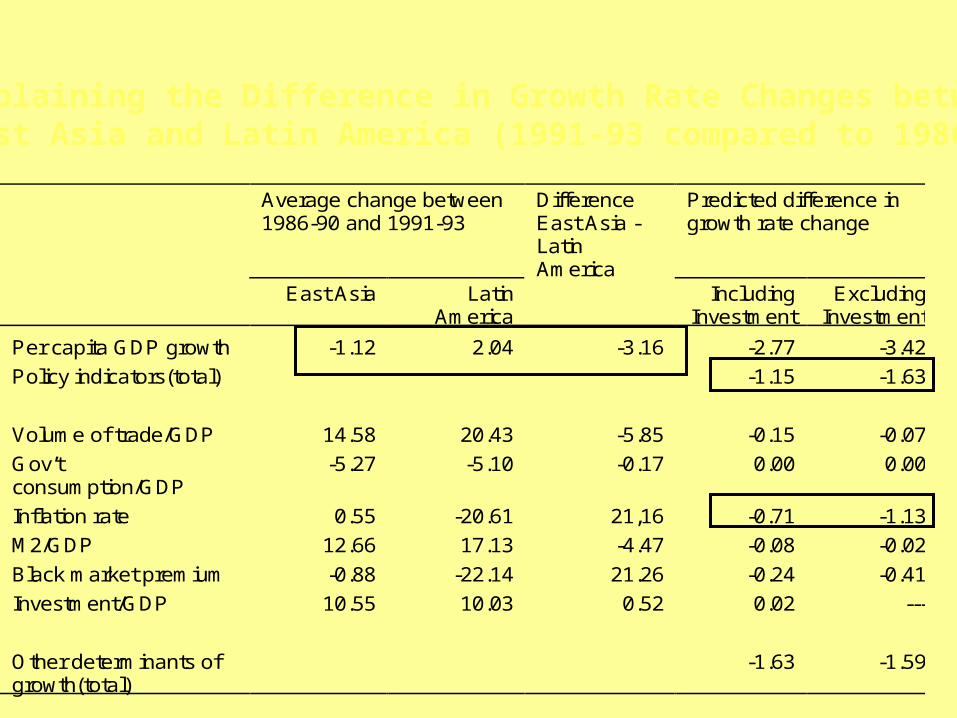
Average change between1986-90 and 1991-93
DifferenceEast Asia -LatinAmerica
Predicted difference ingrowth rate change
East Asia LatinAmerica
IncludingInvestment
ExcludingInvestment
Per capita GDP growth -1.12 2.04 -3.16 -2.77 -3.42
Policy indicators(total) -1.15 -1.63
Volume of trade/GDP 14.58 20.43 -5.85 -0.15 -0.07
Gov’tconsumption/GDP
-5.27 -5.10 -0.17 0.00 0.00
Inflation rate 0.55 -20.61 21,16 -0.71 -1.13
M2/GDP 12.66 17.13 -4.47 -0.08 -0.02
Black market premium -0.88 -22.14 21.26 -0.24 -0.41
Investment/GDP 10.55 10.03 0.52 0.02 ---
Other determinants ofgrowth(total)
-1.63 -1.59
Explaining the Difference in Growth Rate Changes between East Asia and Latin America (1991-93 compared to 1986-90)
Mexican Debt Crisis of Late 1994 and the Tequila Effect
(Sachs et al. 1996)weak banking sectorscurrency overvaluationlimited foreign currency reserves