latino representation on primetime...
TRANSCRIPT

LATINO REPRESENTATIONON PRIMETIME TELEVISION
By Dana E. Mastro and Elizabeth Bchm-Morazvifz
This study analyzes the frequency and quality of depictions of Latinosduring the 2002 primetime television season. Research on cultivationtheory and social identity theory provides insight into the potentialimplications of exposure to these images. Findings suggest that wliileadva)ices have been made in terms ofthe quality of depictions of Latinos,many of these images remain tied to a few, longstanding media stereo-types. In addition, the rate at which Latinos are portrayed on televisionremains dramatically below that ofthe real-world population-
Introduction Despite promises of improvements in Latino depictions by majorU.S. networks, the limited portrayal of Latinos on primetime televisionremains a persistent issue. Headlines such as "Where are the Latinos?"'highlight this striking absence. Since the National Council of La Razaparticipated in a 1999 "brownout" encouraging a one-weelt boycott ofprogramming, networks have pledged to increase the frequency andquality of Latino representations. To date, however, efforts have result-ed in only incremental advances.- At 12.5% of the population. Latinosconstitute the largest racial /ethnic minority group in the United States.'Yet research suggests that they remain dramatically underrepresentedon television compared with real-world figures—typically comprising1% to 3% of the primetime television population.^
Although decades of research document images of AfricanAmericans on television, few quantitative studies have focused specifi-cally on characterizations of Latinos. To this end, a two-week sampleof primetime entertainment programming was systematically ex-amined to determine the quantity and quality of portrayals of Latinos.Although effects cannot be determined from content, such data provideinsights into the potential influence of consumption on consumers whenviewed from the perspectives of cultivation theory and social identitytheory.
Portrayals of Latinos on Television. Empirical research has consis-tently demonstrated the influence of exposure to television imagery onviewers' real-world perceptions regarding racial/ethnic groups in U.S.society." These studies have revealed modest but significant associationsbetween viewing media portrayals of race/ethnicity and outcomes con-cerning attributions of competence," socioeconomic status,^ group sta-
jbMC Quarterly Qaita E. Miistrii is an asti.istant professor and Elizabeth Behm-Moraivitz is n Ph.D. stti-ll'rill'2005' ' ' '• '"' '" ""' ^^7"""'""'"' of Commimicntiofi at the Uniivrsiti/ of Arizona.110-uomoon AEIMC

tus,** social roles,'' as well as stereotypical judgments.'" Examining theportrayals of Latinos on television, therefore, is of both social and theo-retical significance.
Eindings from the few content analyses of television programmingthat included Latinos indicate a pattern of persistent underrepresenta-tion spanning more than five decades. In the 1950s, Latinos comprisedapproximately 3% of the television population; however, by the 1980sthat number fell to approximately V:i percent of television characters."Representation remained consistently low throughout the early 1990s,during which time the occurrence of Latinos on television (between 1.1%and 1.6%) remained well below real world demographics (approximate-ly 11% of the U.S. population).'- Minor improvements were experiencedin the late 1990s; however, at 3'}'" of the TV population and 12%- of thereal-world population. Latinos remained dramatically underrepre-sented compared to census figures.'^ When depicted. Latinos were pri-marily cast in secondary and nonrecurring roles,'* with males typicallyout-numbering females.'"̂ As such, Latinas have been underrepresentedin terms of both their gender and their ethnicity.
Content analyses have also established that, when depicted. Lati-nos have historically been confined to a narrow set of stereotypic, often-times negative, characterizations.'" They include the criminal, the lawenforcer, the Latin lover, the Harlot, and the comic/buffoon.'^ The crim-inal is typically a male identified by his youthful appearance, aggressivenature, dishonesty, and unkempt appearances.'" The law enforcer is arti-culate, well-groomed, and respected. The Latin lover is also well-groomed and professionally attired, but is defined by his heavy accent,hot-temper, and sexual aggression.•' The female harlot, on the otherhand, while hot-tempered and sexually aggressive, is provocatively andunprofessionally dressed.-" Einally, the comic or buffoon is characterizedby a heavy accent, laziness, secondary status, and lack of intelligence.-'This depiction can be seen in a character such as Rosario on NBC's Will&• Grace—notable for her clear embodiment of these stereotypical attrib-utes."
Theoretical Implications of Exposure. In addition to findings fromboth survey and experimental studies demonstrating an associationbetween exposure to such televised depictions of race/ethnicity and sub-sequent social stereotyping,^' research further indicates that as televisionconsumption rates rise, white viewers are more likely to report a belief inthe veracity-"* and evenhandedness-^ of these portrayals. In order to pro-vide a systematic understanding of this relationship, however, any con-siderations of the potential outcome(s) of exposure must be theoreticallyderived. Both cultivation theory and social identity theory are uniquelysuited because both frameworks focus specific attention on the process-es of stereotype formation and application.
Cultivation theory proposes that long-term exposure to television'sstable set of selective messages ultimately shifts viewers' social percep-tions towards the television version of reality, regardless of its accuracy.-'̂Within this framework, television is identified as a primary socializingforce in society, providing knowledge about the social world and con-
L.-\riSO RFPRLSI STATION ON PuiMl.nMt TU.CVISIOS 111

112
tributing to cultural constructions.^^ Specifically, cultivation researchhas shown heavy viewers to be more likely than light viewers to reportperceptions of reality consistent with TV's messages. Such "learning"from television can come in the form of both first order and secondorder information.^" First order cultivation suggests a belief in the con-crete features of television fare, for example, that television's demo-graphic mix reflects actual population demographics. Alternatively, sec-ond order cultivation represents the relationship between the impliedcontent in television messages and the inferences viewers make basedon exposure, such as racial/ethnic stereotyping. Consequently, viewersmay learn about both the relative status and normative characteristics ofLatinos (whether or not accurate) based in part on exposure to TV images.
Learning from exposure to television images of Latinos, then, islikely to have implications for real-world intergroup interactions withLatinos, However, cultivation theory does not identify the processesthrough which such outcomes might take place. The assumptions ofsocial identity theory (SIT) speak to this issue. Although few studies ofmedia content have utilized Tajfel's-̂ " social identity theory, the relation-ship between SIT and media representations is a natural one, particular-ly with regard to race representations on television. The theory's tenetscan be used to explain the processes through which exposure to both thequantity and quality of television messages impact on real-world inter-racial interactions."'
SIT posits that individuals seek to create and maintain a positiveidentity by comparing the favorable characteristics attributed to theiringroup{s} with corresponding, unfavorable characteristics of relevantoutgroupis)."" These comparison strategies help protect and bolster self-esteem by focusing on the most advantageous, salient attributes of one'sown group compared to the outgroup(s).^- It would be expected thatmedia portrayals would assume an important role in such intergroupprocesses as stereotypes cultivated from media exposure may be used asindicators of norms of treatment and appropriate power relationships.^"'In other words, media images would become part of the ongoing nego-tiation of identity and social standing in relatit)n to others by creatingand supporting group-based characteristics which might be used inreal-world social comparisons. From this perspective, the sheer quanti-ty of media representation becomes important (i.e., first order cultiva-tion) as the rate of minority occurrences represents the "group's strengthin the intergroup context" and reflects the social value and status of thegroup.^' Additionally, the exact nature of these portrayals {i.e., secondorder cultivation) indicates normative and appropriate intergroup rela-tions. Thus, non-Latino viewers may use the information gleaned fromtelevised representations of Latinos as a way to make generalizationsabout them as an outgroup, utilizing these characterizations to advan-tage their ingroup and boost self-esteem.
Indeed, researchers contend that mediated representations ofLatino stereotypes persist because they fulfill important identity needsfor the dominant culture.'"" Ramfrez Berg'" maintains that by presentingLatinos as subordinate, corrupt, etc, media producers preserve the sta-

tus quo and reinforce the existing hegemony. Some support for thisassertion can be found in Coover's^^ experimental examination of theimpact of exposure to televised race representations on white viewers'liking of outgroup members. Her findings cautiously indicate that depic-tions of race on television are more favorably received when they accom-modate white viewers' ingroup norms. Accordingly, if media depictionscontribute to creating social perceptions of Latinos that may be used inintergroup comparisons, then understanding the nature of this imagerybecomes critical.
Although content analyses cannot offer causal evidence linkingmedia exposure to real-world attitudes and behaviors, the content fea-tures derived from these analyses are integral to the development ofcomprehensive examinations of media effects."'̂ Therefore, documentingthese images is an essential first step in identifying the relationshipbetween exposure and subsequent effects.
Hypotheses and Research Questions. The assumptions of cultiva-tion theory and social identity theory, as well as the findings from exist-ing content analyses, suggest that the manner in which Latinos aredepicted on television may be of consequence to real-world intergroupinteractions. As such, the following hypotheses and research questionswere formulated to document the nature of Latino characterizations ontelevision and the rate at which they are depicted, compared with theiron-air counterparts.
HI: Latinos will appear in primetime television pro-gramming significantly less frequently than either their blackor white counterparts.
H2: Status-based characteristics associated withLatinos will be significantly less favorable than those associ-ated with their on-air counterparts.
RQl: Do the physical attributes of primetime charac-ters vary by race?
RQ2: Do the character traits associated with prime-time models vary by race?
, . . , . . • lo ^•^ MethodA two-week composite of primetime television programming (o-l 1
p.m. EST, Mondays-Sahjrdays and 7-10 p.m. EST, Sundays) across fivebroadcast networks (ABC, CBS, NBC, FOX, and WB) was constructedduring a six-week sampling period from October to November 2002. Thesampling procedure utilized a simple random sample using a randomnumbers table. Existing research suggests that this method is appropri-ate to allow for generalization.^" Although no precise standard existsconcerning the sample size,'"' using standard error estimates to calculateconfidence intervals around the current measures provided 95% confi-dence in the generalizability of findings at the .05 level. '̂ All primetime
LATINO RLPRISLNTATIO:^ OW PRIMLTIME TEI.I VISION 113

114
entertainment programming was included, resulting in 67 distinct pro-grams. Special events (e.g.. The Oscars), sports, news, reality-based pro-grams, and Hollywood films were excluded.
Coder Training. Three student coders received approximately 40hours of training on programming randomly selected from outside theactual sample until acceptable levels of inter-coder reliability wereobtained. Reliabilities reported in the present study were recalculatedwith a subset of the actual sample. Coders were assigned an overlap of7% of the sample programs (n = 5). Although this may appear to be asmall number of programs, coding done at the interaction level resultedin 74 character interactions for each coder to evaluate. Nominal vari-ables were assessed using Scott's pi'^ while Likert items were evaluatedusing Krippendorf s alpha." Individual reliabilities are reported along-side each variable (below).
Units of Analyses. To determine the extent to which current por-trayals of Latinos on primetime television have advanced or stagnated,variables were designed to reflect the features/traits associated with themost prominent television stereotypes of Latinos. Judgments were madeat two levels of analyses: (1) program level and (2) interaction level.Program level variables included the genre (K = 1.0) of the show and thecharacter's appearance number. Eight genre categories were used: sit-com, family drama, crime/court drama, soap, TV movie, cartoon, sci-ence fiction, and other. Appearance number was used to determine thenumber of characters by race. Such frequency measures are meaningfulas research has shown Latinos to be dramatically underrepresented onprimetime television compared with real-world census figures."^
Consistent with existing research, the level of interaction wasdefined as a social interaction involving at least two characters andincluding at least three "turns" such that, at minimum the first charac-ter engaged in conversation, followed by a response by the second char-acter, and then a second reaction from the first character.-*' Only the firstinteraction of each white character was coded, whereas each interactionincluding a minority character was coded.
Interaction Level Variables. Variables included in interaction levelanalyses were designed to evaluate the status, physical attributes, andcharacter traits of the model. Only the single, most appropriate responseoption was coded for each variable.
Status. In order to determine the relative standing of characters,the following items designed to assess status were included. The role {K= .83) of the character was categorized as major (integral to the story-line), minor (important to the plot, but not a necessity), or background(incidental, speaking appearance). The occupation (it - .92) of the char-acter was his/her primary functional responsibility including officer ofthe court (e,g,, lawyer, judge, police officer), criminal/suspect, familymember, medical personnel, service provider, service receiver, student,professional/businessperson, or other. The conversation topic (n ^ .92)in the interaction was coded into one of the following: work, family,social/dating, food/drink, education, health, crime, finances, sports, orother. The socioeconomic status (SES, a = .86) of the characters was
/('((W.V/lf ISM tV MA^S Cl I M M d W r ^ " / R W QiMRTFRI V

rated on a 5-point scale from little/no wealth (1) to well-off/rich (5). Thecharacter's yoft authority (a = .92) identified the primary work-related sta-tus of a character compared with other characters in the program on a 5-point scale from low job authority/servant (1) to high job authority/boss(5). Last, social authority {a = .84) gauged the primary relationship a char-acter had with other characters in the program. This was measured basedon the presence of explicit dialogue including sought-after advice giving(high social authority) and advice receiving (low social authority). Thisitem ranged from low social authority (1) to high social authority (5) ona 5-point scale.
Physical Attributes. Several items evaluating appearance character-istics were included. First, the race {K = .92) of the character was identi-fied as, African American/black, Asian American, Latino, NativeAmerican, white/Caucasian, or other. Age (a = .88) was defined asunder 20, 20s, 30s, 40s, and 50 or older. Sex (K = 1.0) was categorized asmale or female. The attire (a ^ .84) of the characters was appraised on a5-point scale from inappropriate dress (e.g., provocative, informal, untai-lored) for the social context (1) to appropriate dress (5).
Also on a 5-point scale from unattractive (1) to attractive (5), thegeneral physical attractiveness (a = .80) of the characters was identifiedbased on mainstream U.S. standards of beauty (e.g., facial symmetry, lackof imperfections or blemishes, etc). The extent to which characters spokewith an accent (a ^ 1.0) was additionally evaluated. An accent wasdefined as a speaking inflection that deviated from the mainstream U.S.standard (i.e., national news broadcast). Three response options wereincluded: heavy accent (1), discernable/moderate accent (2), or no accent(3). The final item assessing physical attributes was that of body type(a = .96). Stunkard, Sorenson, and Schulsinger's (1983)^ 9-point graphicmeasure ranging from emaciated to obese was utilized. These itemswere then collapsed into the following three levels: thin (1),average/healthy weight (2), and overweight (3).
Character Traits. Items assessing character traits also were included.Each was measured on a 5-point scale with "1" designating the most neg-ative/unflattering embodiment of the trait and "5" corresponding withthe most positive/flattering representation. The motivation (a = .83)item evaluated the extent to which the character was generally motivat-ed/active versus lazy/inactive. Work ethic [a =.83) assessed the charac-ter's goal-oriented nature and drive to succeed in the work place. Respect(a = .80) appraised whether the character was generally the object ofsocial derision or highly esteemed. In order to gauge the mental abilitiesand basic reasoning skills of the portrayal, an intelligence (a ^ .92) itemwas included. The character's ability to verbally express his/her ideas ina comprehensible manner also was judged with a measure of articulation(a = .88).
Temperament (a =: .84) of the character was evaluated based on theexcitable/hot-tempered nature versus calm/patient state of the depic-tion. Three measures of aggression also were included. Physical aggres-sion (a ^ .94) identified the use of unnecessary physical force (e.g., fight-ing, assaulting, etc.) as a solution to social issues. A verbal aggression
LAIISO RrPKfsi.vTflnoN iw PKJ.MI.HML Tn.rvtsios 115

(a = .88) item assessed the extent of use of abusive language and verbalconflict. Last, a sexual aggression (a ^ 1.0} item evaluated the tendency tobe sexually forward versus more passive.
Analyses. Chi-squares were calculated in order to assess differ-ences in depictions based on character race. Only chi-square values sig-nificant at the p < .05 level were considered to be statistically significantand only percentages differing by at least 10% were considered of prac-tical significance."'" For further insights, analyses of proportions basedon the chi-square analog to the Scheffe test also were computed.^"Because the most prominent stereotypes for Latinos suggest differentrepresentations based on sex, separate chi-square tests were conductedfor males and females at the interaction level.
KesultS Across this two-week sample of primetime programming, 67 dis-tinct programs and 1,488 characters were identified. Whites were mostprevalent, accounting for 80.4%, {n = 1197) of the primetime sample fol-lowed by black characters at 13.8% {n = 205). Latinos represented 3.9%(H ^ 58) of characters and Asians comprised 1.5% {n = 22). Only 6 NativeAmerican characters (0.4%) were identified. Men outnumbered womenamong white (n = 692, 57.8%), black (;( = 127, 62.0%,), Latino {n = 34,58.6%,), and Native American {n = 4, 66.67%) depictions; however,among Asian American characters, women (« = 11, 50.0%) and men wereequivalent in number. Due to the small number of appearances of bothAsian Americans and Native Americans, they were excluded from fur-ther analyses.
Program Level Variables. Chi-square analyses at the programlevel revealed significant differences in the genres with which differentraces were associated [x^ (8, JV = 1460) = 38.57, Cramer's V - .12, p < .01].In addition, Scheffe tests found that blacks (n = 109, 53.2%,) were sig-nificantly more likely than whites (JI ̂ 425, 35.5%0 to appear in crimedramas {t = 3.40, p < .05), while Larinos {n - 22, 39.8%) appeared signif-icantly more often in sitcoms {t = 3.00, p < .05) than whites (n = 315,26.3%).
Interaction Level Variables. Across this sample of black. Latino,and white characters, a total of 2,107 interactions were identified.Interacrion level variables were utilized for more meaningful evalua-tions of the quality of television characterizations, particularly in termsof the assumptions of social identity theory. Again, analyses were con-ducted separately for males and females.
Status. With regard to the characters' role, chi-squares revealedsignificant differences based on the race of the model for both men [x~ (4,N = 1146) - 104.40, Cramer's V = .21, /) < .01] and women [x' (4, N = 728)= 23.84, Cramer's V = .13, p < .01]. Among male characters, Scheffe testsshowed blacks {n - 253, 65.7%) and Latinos (JI - 59, 67.8%) significantlymore likely than whites {n = 241, 35.8%) to be portrayed in major roles(/ = 7.5, & t = 4.58, p < .05 respectively). For females, only blacks (jf ^ 111,58.1%) were significantly more likely than whites (JI = 188, 38.7%) to berepresented in major roles (f = 3.8, p < .05).
U6 kn,K>.,v
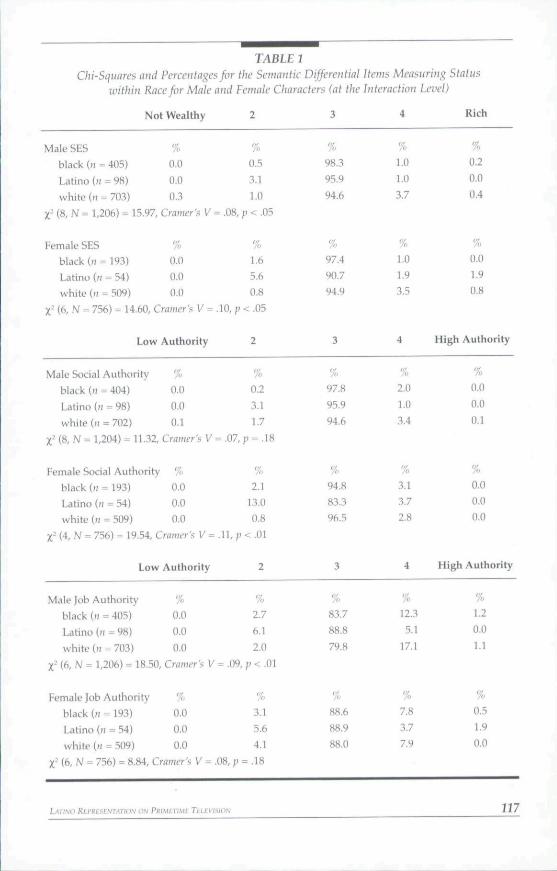
TABLE 7Chi-Squares and Percentages for the Semantic Differential Items Measuring Status
within Race for Male ami Female Characters (at the Interaction Level)
Nol Wealthy
Male Social Authority %black {}! = 404) 0.0Latino (>i = 98) 0.0white in = 702) 0,1
0.23.11.7
97.895.994.6
(' (8, N - 1,204) = 11.32, Crnmt-r's V = .07,;' = ,18
Female Social Authority
Rich
Male SESblack in = 405)Latino (» = 98)white (ii = 703)
X- (8, N = 1,206) = 15.97,
Female SESblack [n - 193)Latino (n = 54)white (II = 509)
0.00.00,3
Cramer's V
%0.00.00.0
X' (6, N = 756) = 14.60, Cramer's V =
Low Authority
%0.53.11,0
= .08, p < .05
%1.65.60.8
.10, p < .05
2
%98.395.994.6
%97.490.794.9
3
%1.01,03.7
%1.01,93.5
4
%0.20.00,4
%0.01,90.8
High Authority
2,01,03.4
0,00.00.1
black (» = 193)Latino (n - 54)white [a = 509)
Z'(4, N = 756) =19,54,
0.00.00.0
Cramer's V =
Low Authority
Male Job Authorityblack ((I = 405)Latino (ii = 98)white in = 703)
%0,00.00,0
X- (6, N = 1,206) - 18.50, Cramer's V
Female job Authorityblack (n = 193)Latino in = 54)white (JI = 509)
X̂ (6, N = 756) = 8,84,
L./,,voKt/'«FSfM-4r.<wc>^J
%0,00,00.0
Cramer's V = .
2.113.00.8
,11,;^<.O1
2
%2.76.12.0
= .09,;) < .01
%3.15.64.1
08, f = .18
94.883.396.5
3
%83.788.879.8
%88.688.988.0
3.13.72.8
4
%12.35.1
17.1
%7.83.77.9
0.00,00,0
High Authority
%1.20.01.1
%0.51.90,0
117

118
Occupations associated with different races also varied signifi-cantly by chi-square tests for both men [x' (16, N = 1,206) = 148.12,Cramer's V - .25, p < .01] and women [x' (16, N = 756) = 97.68, Cramer'sV = .25, p < .01]. Among the men, Scheffe tests showed blacks {n - 167,41.2%) significantly more likely than whites (;; - 150, 21.3%) to bedepicted as officers of the court (t - 5.0,;) < .05). Latinos {n = 32, 32.7%)were significantly more often family members {t ^ 2.44, /' ^ .05) com-pared with whites (n = 87, 12.4%). For women, black characters weremost often found in medical roles (n = 53, 27.5%) while both Latinas(n = 17, 31.5%) and whites (n = 122, 24.0%,) were most often identified asfamily members. However, these differences were not significant bvScheffe tests.
Chi-square analyses revealed a significant difference in conversa-tion topic by character race for both men [x' (18, N - 1206) - 85.61,Cramer's V - .19, p < .01] and women [x^ (18, N = 756) = 39.83, Cramer'sV - .16, p < .01]. Black men {ii = 114, 28.1%) discussed work most oftenand significantly more so than whites (ii - 129, 18.3%,, t = 4.5, p < .05).Although not significant by Scheffe tests. Latino men most frequentlydiscussed crime {n = 23, 23.5%,) and topics identified as "other" [n = 24,24.5%). The chi-square analog to the Scheffe test revealed no significantdifferences for the women.
Chi-squares examining socioeconomic status revealed a statistical-ly significant difference {p < .05) based on race for both men and women;however, group comparisons of both men and women failed to reachsignificance by Scheffe tests. Table 1 contains chi-squares and percent-age distributions. While no race-based differences in social authorityemerged for men by chi-square tests, findings for social authority byrace were significantly different for women at the .01 level (Table 1).Scheffe tests showed whites (n - 491, 96.5%) significantly higher insocial authority than Latinas (ii = 45, 83.3%, t - 2.48, p < .05). In terms ofmale job authority, statistically significant differences (p < .01) emergedin chi-square tests based on race (Table 1). Scheffe tests showed Latinos(// = 87, 88.8%) portrayed significantly lower in job authority than whites(n = 561, 79.8%,, t = 2.5, p < .05), Differences based on race were notrevealed for female job authority.
Physical Attributes. Physical attribute data are in Table 2. Basedon chi-squares, significant differences in age by character race wererevealed (at the .01 level) for both men and women. Although Latinos ofboth sexes were younger than their on-air counterparts, proportionaldifferences were not significant by Scheffe tests. Significant attire byrace differences (p < .01) for both men and women also existed. For men,Scheffe tests demonstrated that Latinos were significantly less appro-priately dressed than whites (t = 3.14, p < .05). Among the women,Latinas were significantly less appropriately dressed than blacks(t = 2.75, p < .05). Attractiveness of both men and women also wasfound to vary significantly (p < .01) based on character race. Latino menwere generally deemed most physically appealing among males andwhite women most attractive among females; however, these group dif-ferences were not significant by Scheffe tests.
/O(IK,V/1( FWI & M/ISS CoMWIWJC/lKll.V QUARTLRII

TABLE 2Chi-Squares and Percentages for Physical Attributes within Race
for Male ami Female Characters (at Ihe Interaction Level)Under 20 20s 30s 40s 50+
Male Ageblack (n = 398)Latino (» = 98)white in = 648)
XM8-JV = 1,144) = 60,61
Female Ageblack in = 182)Latino in = 49)white (n = 478)
%
7.521,411,0
, Cramer's V = ,16,
%6,6
28.616.5
X- (8, N = 709) = 36,03, Cramer's V = .16, p
Male Attirt?black ((( = 405)Latino (ii = 98)white in = 703)
X̂ (6, N = 1,206) = 22,9C
Female Attireblack (ii = 193)Latino (ii = 54)white (JI - 509)
Inappropriate
%0.00.00,0
1, Cramer's V = .10,
%0.00.00,0
X' (6, N = 756) = 31.67, Cramer's V = .15, ; '
Male Attractivenessblack in = 405)Latino (« = 98)white (n = 703)
Unattractive
%2.00.00.1
X- (8, N = 1,206) = 25,32, Cramer's V = .10,
Female Attractivenessblack (ii - 193)Latino (« = 54)white (« = 509)
X- (8, N = 756) = 35.57,
%0.00,0[1.2
Cramer's V = ,15, j^
LATINO RLI'RESLNTATinN OfJ pRimiTIMt TtLCUISfON
%13.621.412.0
(' < .01
%13.714.315.1
<.O1
2
%3.00.03.8
p < .01
%3.65,63.3
<,01
2
%6,22,010.1
f < -01
%3.15.64.7
x.Ol
%45.531.635.8
%47.340.842.1
3
%39.355.133.1
%24.453.737.9
3
%76.575.565.4
%64.253.741,8
%28,424.526.2
%31.310.219.7
4
%16.013.320.5
%18.15.6
22.4
4
%16.521.421.B
%32.640,748.9
%5.01.0
15.0
%1.16.16.7
Appropriate
%41.731,642,5
%53,935,236,3
Attractive
%0.5LO2.6
%0,00,04.3
Jc 2 cont. iicxtpa^c
119

Table 2 cent.
Male Accentblack (ti = 405)Latino (« = 97)white (II = 703)
XM4,N = 1,205) =
Female Accentblack {n = 193)Latino (n = 54)white (n = 509)
Heavy Accent
%9.6
67.05.4
326.90, Cramer's V = .37, p < .01
%12.435.2
2.6
2
%89,929.994.2
%87.663.096.5
No Accent
%0.53.10.4
%0.01.9i n
f (4, N - 756) = 88.02, Cramer's V = .24, p < .01
Thin Overweight
Male Body Typeblack (II = 405)Latino (ii = 96)white (ll = 703)
71.193.876.5
X" (4, N = 1,204) = 22.15, Cmmer 5 V = .10,;? < .01
Female Body Typeblack (« = 193)Latino (n = 53)white (n = 507)
60.177.482.8
27.4
6.322.3
39.422.615.4
1.50.01.1
0.50.01.8
t (4, N = 753) = 48.37, Cramer's V = .18, ;i< .01
Chi-square tests examining character accent found significantdifferences based on race (p < .01) for men and women. Scheffe testsrevealed that for both male and female characters. Latinos were signifi-cantly more likely (at the .05 level) than either blacks (t = 8.14, t - 2.91,respectively) or whites (f = 10.33, t = 4.25, respectively) to be depictedwith an accent. On the measure of body type, chi-squares showed sig-nificant race-based differences (p < .01) for both men and women.Among the men, Scheffe tests showed Latinos slimmer than eitherblacks {t = 6.39, p < .05) or whites (/ = 5.83, p < .05), while amongwomen only whites were identified as significantly slimmer than blacks{t = 3.29, p < .05).
Character Traits. Character trait data are in Table 3. On the meas-ure of motivation, chi-square tests revealed statistically significant dif-ferences at the .01 level based on race for both men and women.Specifically, Latino men and women were depicted as lazier than theiron-air counterparts. However, these group differences were not signifi-cant by Scheffe tests. Similarly, while chi-square tests of intelligenceshowed Latino men (p < .01) and Latinas (/' < .05) significantly less intel-
320 -iM & MASS COMMUNICATION

TABLE 3Chi-Squares and Percentages for Character Traits within Race
for Male ami Female Characters (at the hiteraction Level)
Male Motivationblack [ri = 404)Latino [ri = 98)white in = 702)
XM8-N = 1,204) = 47,13
Female Motivationblack (;; - 193)Latino (n = 54)
white ( ' I -508)t (6, N = 755) - 27.49,
Male Intelligenceblack (fi = 405)Latino in = 98)white Ul = 703)
Lazy
0.03,10.0
1, Cramer's V = .14,;
%0.00.00.0
Cramer's V = ,14, p •
Unintelligent
%0.02.00.4
2
%1.02.00.9
,<.O1
%0.07.40.8
. .01
2
%4.0
16.37.3
3
%36.442,943.0
%42.048.148.6
3
%70.659.270.1
4
%60.452.055,6
%57.044.450.2
4
%25.222.420.5
Motivated
%2.20.00.6
%1.00.00,4
Intelligent
%0.20.01.7
X' (8, fV = 1,206) = 36,24, Cramer's V = .12, p < .01
Female Intelligence % %black Ul = 193) 0.0 1.6LaHno W = 54) 0.0 7.4white (H = 509) 0.0 4.3
= 13,59, Cramer's V = ,10, p < ,05
Derided 2
70.583.375,0
27.59.3
20.0
0.50.00.6
Respected
Male Respectblack (tl = 405)Latino Ui = 98)white (tl = 703)
%
0,21.00.0
X' (8, N = 1,206) = 15,88, Cratiier's V
Female Respectblack Ul = 193)Latino (n - 54)white (tl = 509)
%0.00,00.0
X̂ (6, N = 756) = 13.18, Crimier's V =
%8.1
17.3n.i
= .08, p < .05
%2.69.38.3
.09, /' < .05
LATINO REfRLSENTATiON OM pRiMcnME TEU:VISION
%54.344.952.3
%54.464.857.8
%37,336.736.1
%43.025,933.8
Table 3 cont.
%0.00.00.4
%0.00.00.2
next page
121

Table 3 avit.Low
Male Work Ethic % %black Ol - 404) 0.0 2.2Latino Oi = 98) 3.1 5.1white (f( = 703) 0.0 4.1
X- (B, N = 1,205) = 42.23, Cratiier's V = ,13,;) < .01
Female Work Ethic % %black (H = 193) 0,0 1.6Latino (n - 54) 0.0 5.6white U' = 508) 0.0 1.8
X- (6, N - 755) = 24.41, Cratncr's V - .13,;. < .01
Inarticulate 2
High
63.668.467.1
33,423.528.2
0,70,00.6
62.281.575.8
3
94.681.689.5
36.313.021,9
4
3.00,05.4
0.00.00,6
Articulate
0.00.00.0
Male Articulation % %black (ii - 405) 0,2 2.2Latino Oi= 98) 1.0 17.3white (n - 702) 0.0 5.1
Z' {6, N - 1,205) = 50,54, Cramer's V = .15, p < ,01
Female Articulation % %black (n = 193) 0.0 2.1Latino {H = 54) 0.0 11.1white (tl = 509) 0.2 2.9
X' (6, N = 756) = 15,60, Cramer's V - .10, p < ,05
Hot-Tempered 2
91.288.992.1
6,7n.o47
0.00.00,0
Calm
Male Temperament % %black (tl = 405) 2,5 22.2LaHno (n = 98) 3,1 26.5white (ii = 702) 0.3 17.0
X- (6, N = 1,205) = 24.90, Cramer's V = .10, p < ,01
Female Temperament % %black ()i = 193) 1.0 23.8Latino (JI = 54) 0.0 14.8white {i( = 509) 0,2 13.8
X' (6, N = 756) = 1478, Cramer's V = .10, p < .05
75.369.482.1
0,01.00,7
0.00.00,0
75.185.285.5
0.00.00.6
0.00.00.0
.5 avil.
ligent than their on-air counterparts, these proportional differenceswere not significant by Scheffe tests.
On the measure of respect, significant differences emerged formales in chi-square tests (;) < .05); however, the results revealed nomeaningful pattern based on race and no significant differences byScheffe tests. For the women, chi-square tests demonstrated that
122 AH CoM^u!>JK-^Th^>N
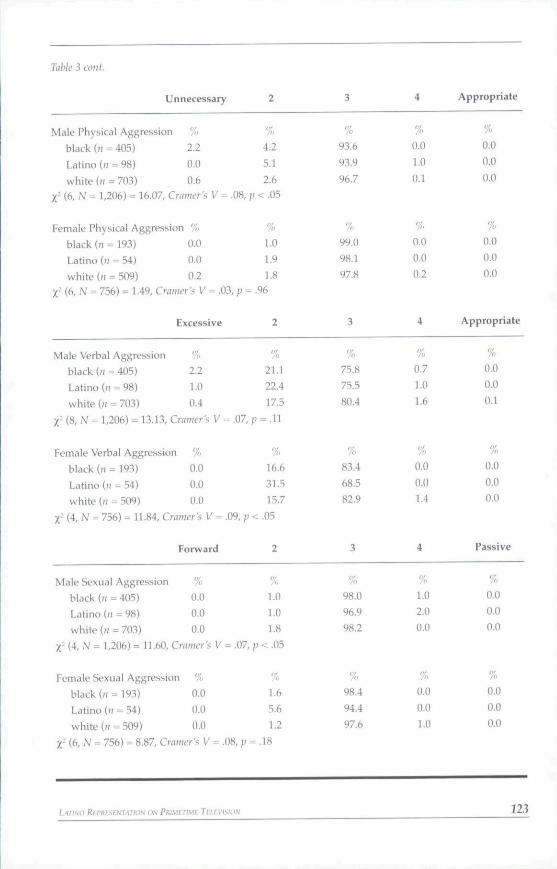
Table 3 avit.
Unnecessary
Male Physical Aggression %black 0/ = 405) 2,2Latino 0; = 98) 0.0white Oi = 703) 0.6
2
%4.25.12.6
3
%93.693.996,7
4
%0.01,00,1
Appropriate
%0.00.00.0
X- (6, N = 1,206) = 16-07, Cramer''^ V = ,08, p < ,05
Female Physical Aggression % %black Oi = 193) 0.0 1.0Latino 0' = 54) 0.0 1.9white (Ji = 509) 0,2 1,8
X- (6, N = 756) = 1-49, Criwier-f. V = .03, p = ,96
Excessive 2
Male Sexual Aggression %black (t! = 405) 0.0Latino (»= 98) 0.0white (H = 703) 0,0
1.01.01,8
,-̂ (4, JV = 1,206) = 11,60, Cratiicr's V = ,07, p < .05
Female Sexual Aggression %black Oi = 193) 0,0Latino Ul = 54) 0.0white (n = 509) 0,0
X- (6, N = 756) = 8,87, Cramer's V = ,08,
99,098,197.8
98,096,998.2
0.00,00.2
1.02.00.0
0.00.00.0
Appropriate
Male Verbal Aggressionblack (ti = 405)Latino (n = 98)white Of = 703)
%2.21.00.4
X" (8, N = 1,206) - 13.13, Cratiier's V = .07, p
Female Verbal Aggressionblack Ul = 193)Latino (H = 54)white (ji = 509)
%0,00,00.0
^^ (4, N = 756) = 11.84, Cratiier's V = .09, p <
Forward
21.122.417.5
= .n
%16.631.5157
,05
2
%75.875.580.4
%83,468.582.9
3
%0,71.01.6
%0.00.01.4
4
%0.00.00.1
%0.00.00.0
Passive
0.00.00.0
1.65.61.2
= .18
98.494.497,6
0.00.01,0
0.00.00,0
123

Latinas and whites were significantly more ridiculed than were blacks(;' < .05). However, this finding was not significant by Scheffe tests.
Statistically significant differences in work ethic were found forboth men and women based on chi-sc]uare tests (/; < ,01). Among themen, these distinctions were not meaningful based on race. For thewomen, chi-squares showed Latinas with the lowest work ethic,significantly lower than blacks by Scheffe tests (t = 2.86, p < .05). Interms of articulate speech, significant differences were found in chi-square analyses among men {p < ,01). Specifically, Latinos were por-trayed as less articulate than either blacks or whites. Scheffe testsdemonstrated this difference to be significant only in comparison withblacks (f - 2.89, p < .05). Although statistical significance was achievedamong the women in chi-square tests (/' < .05), practical differences inarticulate speech were not revealed based on race. Chi-squares examin-ing temperament yielded significant differences based on race for bothmen (/) < .01) and women (/' < .05). Latino and black men were identi-fied as more hot-tempered than were white men; however, this differ-ence was not significant by Scheffe tests. The chi-square analog to theScheffe procedure demonstrated black women to be significantly morevolatile than whites (/ = 2.5, p < .05).
Chi-squares assessing differences in physical aggression amongmen were significant (p < .05); however, findings were not meaningfulbased on the race of the character. No significant differences emergedfor race on physical aggression for the women. On the measure ofverbal aggression, no significant differences based on race were yieldedin chi-square tests for the men; however, statistical significance wasreached based on race among the women (p < .05). Chi-square resultsidentified Latinas to be more verbally aggressive than either white orblack women. These differences were not significant by Scheffe tests.On the measure of sexual aggression, statistical significance wasachieved in chi-square tests among men (p < ,05) but the distinctionswere not meaningful based on race. No statistically significant differ-ences based on race emerged for sexual aggression among women.
Discussion -ru c- .^- c uIhe tmdings from the present study suggest that race/ethnicity
does, in fact, impact the manner in which characters are depicted onprimetime television. While results indicate that in some cases Latinostereotypes are fading from the television landscape, these data simul-taneously demonstrate that in other instances stereotypical portrayalspersist. In either circumstance. Latino images on television remain infre-quent and well below real-world census figures, as predicted in HI.This outcome is not surprising, however, given many scholars' con-tention that television programming is a site of cultural politics wherereliance on stereotypes exists, reinforcing the dominant ideology aboutrace rather than challenging it.*''* Thus, instead of inviting viewers toquestion Latino stereotypes, television generally provides hegemonicmessages about Latinos in the United States. Moreover, while the addi-tion of Latino family sitcoms such as The George Lopez Slnnr (on ABC)
724 ssi & M.as':- COMMUNICATION

provides some cause for optimism, few such shows exist and critics arequick to point out that while constructive Latino characters may be pre-sented in such programs, they are not likely to interact with whitepeers^consequently removing Latinos from cultural inclusion.""'
From the theoretical perspectives of cultivation theory and socialidentity theory, these images may contribute to the development ofstereotypes about Latinos and attitudes toward Latinos by outgroupmembers, potentially establishing unwarranted status differences for uti-lization in intergroup contexts. Of course, linking exposure with vieweroutcomes will require effects studies incorporating both audience andcontent level characteristics,''' Nonetheless, the current results provide astep in this process.
Findings provided mixed support for H2, which predicted thatcharacteristics associated with Latinos would be less favorable thanthose associated with blacks or whites. In contrast to previous research,'^results revealed a tendency to depict Latino men and women in moreconsequential roles, rather than the secondary roles typically found to becharacteristic of Latinos on TV. Moreover, no differences were revealedfor social authority or socioeconomic status for either the men or thewomen. Despite the fact that Latino males were shown to have lower jobauthority and were depicted less frequently in professional occupationsthan were other male characters, the longstanding tendency to depictLatinos as subservient and/or subordinate"^^ appears to be diminishing.
Again, in terms of numeric parity, however. Latinos were grosslyunderrepresented on both an absolute and comparative basis. At 3.9% ofthe television population. Latino depictions were well below that of theirreal-world proportion of the U.S. population at t2.5%.'̂ '' Moreover, theirnumbers fell far beneath those of their on-air counterparts such as whites(at 69.1% of the U.S. population and 80.4%, of the TV landscape) andblacks (at 12.3% of the real world and 13.8% of the television population).In fact, this rate of representation suggests near stagnation in Latino por-trayals over the last several decades.'' Within the theoretical frameworkspropo.sed here. Latino media exclusion can be regarded as an indicationof group strength in intergroup settings.'^' More specifically, such mediarepresentation can be regarded as a designation of group equity, signify-ing support, respect, and tolerance (or lack thereof) for particular groupsin society. The dearth of representation, then, may suggest the absence ofpublic support, thereby disadvantaging Latinos,
RQl probed the extent to which the physical attributes of televisioncharacters varied by race. The results suggest that Latinos were theyoungest, most inappropriately dressed characters, with the heaviestaccents on television. Among men. Latinos also were generally thinnerand more attractive fhan their on-air counterparts. These attributes aredistinctive to the Latin Lover, Harlot, and perhaps Dark Lady stereotypesdocumented in previous research,''̂ The features of these longstandingstereotypes depicf an image of Latinos as addictively romantic, sensual,sexual, and even exotically dangerous. From the perspective of cultiva-tion theory, the nature of these portrayals is consequential as heavy, long-term exposure to these persistent images should ultimately result in a
LATINO REPRESENTATION ON PRIMETIME TF.iLvisioN 125

belief in the authenticity of these characterizations. Further, based onSIT, it would be expected that while not wholly negative, these charac-teristics may subsequently serve as indicators of norms of treatment inreal-world intergroup contexts."^
Finally, RQ2 asked, "Do the character traits associated with prime-time models vary by race?" Findings suggest that the answer is some-times. Among the men. Latinos were the least intelligent and least artic-ulate characters. Additionally, they were coupled with blacks as themost hot-tempered men on television. Similarly, Latinas were the lazi-est characters in primetime. Further, they were the least intelligent,most verbally aggressive, embodied the lowest work ethic, and (along-side whites) were the most ridiculed. On a positive note, no race-baseddifferences for men emerged on motivation, work ethic, respect, physi-cal aggression, verbal aggression, or sexual aggression. For women, nodifferences based on race were revealed for motivation, physical aggres-sion, or sexual aggression. While these results demonstrate noticeableimprovements over previous decades,'" adherence to numerous unreal-istic and demeaning depictions of Latinos on primetime appears to per-sist. As such, the potential for cultivating harmful racial perceptions,which may be used in subsequent interracial interactions, is consider-able.
Limitations and Suggestions for Future Research. Like muchof the quantitative content analytic research examining depictions ofrace/ethnicity on television, this study was limited by sampling andanalytical techniques that, despite their ability to provide objective andgeneralizabte information, preclude more meaningful examination dueto the minimal rate of representation of Latinos. In collecting data of thisnature, it was hoped that analysis of variance could be used to providegreater insights into the specific quality of the characterizations ofLatinos in comparison to their primetime counterparts. However, size-able imbalances in appearances across racial/ethnic groups presentedtoo great a violation of ANOVA assumptions to employ such analyseson these variables. Considering the limited number of nonwhite por-trayals and the complexity of the construction of race on television,incorporating qualitative components into future analyses of this kindmight offer richer results. Further research in this area also may be bet-ter served by utilizing longitudinal data. In addition, the present studyincluded only fictional, primetime entertainment programming. Giventhe popularity of genres such as reality-based programming and newsmagazine programming, the findings here may be conservative innature. Future studies may want to consider the inclusion of both gen-res so that more accurate estimates of Latino representation (as well asother racial/ethnic groups) can be calculated.
NOTES
1. Eric Deggens, "Where are the Latinos?" Hispanic 16 (September2003): 38-40-
2. NAACP, TV Diversity Report YicUis Mixed Results on Network
'•^^ Innl/VAn^^A f..- M^:,^ COMMUNICATION QUARTl HI Y

Performance, available from <http://www.naacp,org/news/releases/tvdiversityl02803.shtml> accessed 28 October 2003,
3. United States Census, available from <http://www.census.gov/population> accessed 15 September 2003.
4. Children Now, Latinozvooil and TV: Prime Time for a Reality Check(Oakland, CA: Children Now, 2000); Bradley S. Greenberg, Dana E.Mastro, and Jeffrey E. Brand, "Minorities and the Mass Media: Televisioninto the 21st Century," in Mciiia Effects: Advances in Theory and Research,ed. Jennings Bryant and Dolf Zillmann (Hillsdale, NJ: Lawrence ErlbaumAssoc, 2002), 333-51; NCLR, "Out of the Picture: Hispanics in theMedia," in State of Hispanic America 1994 (Washington, DC: NationalCouncil of La Raza, 1994).
5. G. Blake Armstrong, Kimberly A. Neuendorf, and James H.Brentar, "TV Entertainment, News, and Racial Perceptions of CollegeStudents/' Journal of Communicatiou 42 (summer 1992): 153-76; Charles K.Atkin, Bradley S. Greenberg, and Steven McDermott, "Television andRace Role Socialization," journalism Quarterly 60 (autumn 1983): 407-414;Thomas Ford, "Effects of Stereotypical Television Portrayals of African-Americans on Person Perception," Social Psychology Quarterly 60(September 1997): 266-78; Jake Harwood and Karen Anderson, "ThePresence and Portrayal of Social Groups on Prime-Time Television,"Coiumunication Reports 15 (summer 2002): 81-98,
6. Diana M. Zuckerman, Dorothy G. Singer, and Jerome L. Singer,"Children's Television Viewing, Racial and Sex Role Attitudes," Journal ofApplied Social Psychoh^y 10 Quly/August 1980): 281-94.
7. Armstrong, Neuendorf, and Brentar, "TV Entertainment,"8. Howard Giles, Richard Bourhis, and Donald M. Taylor, "Towards
a Theory of Language in Ethnic Group Relations," in Language, Ethnicity,a}id Intergroup Relations, ed. Howard Giles (London: Academic Press,1977), 307-348,
9. Atkin, Greenberg, and McDermott, "Television and Race RoleSocialization."
10. Ford, "Effects of Stereotypical Television Portrayals."11. George Gerbner and Nancy Signorielli, Women atid Minorities in
Television Drama 1969-1978 (Philadelphia: Annenberg Scht)ol ofCommunication, University of Pennsylvania, 1979); Bradley S.Greenberg and Pilar Baptista-Fernandez, "Hispanic-Americans: TheNew Minority on Television," in Life on Television: Content Analyses of U.S.TV Drama, ed. Bradley S, Greenberg (Norwood: Ablex Publishing Corp.,1980), 3-13.
12. George Gerbner, Women and Minorities on Teiei^ision (A Report to theScreen Actors Guild and the America!) Federation of Radio and TelevisionArtists) (Philadelphia: Annenberg School of Communication, Universityof Pennsylvania, 1993),
13. Dana E. Mastro and Bradley S. Greenberg, "The Portrayal ofRacial Minorities on Prime Time Television," Journal of Broadcasting &Electronic Media 44 (fall 2000): 690-703.
14. Children Now, Latinowood and TV; Ronald J. Faber, Thomas C.O'Guinn, and Timothy P. Meyer, "Televised Portrayals of Hispanics: A
L-inNiJ Ri.pficSE,vr/iT/iw iw PKIMI'TIML TUIVJSION 127

Comparison oi Ethnic Perceptions," International journal of IntercuttiiralRelations 11 {1987): 155-69; Mastro and Greenberg, "The Portrayal ofRacial Minorities"; NCLR, "Out of the Picture."
15. Carol Eaton, "Prime-Time Stereotyping on the New TelevisionNetworks," journalism & Mass Communication Quarterly 74 (winter 1997):859-72.
16. Greenberg and Baptista-Fernandez, "Hispanic Americans";Charles Ramirez Berg, Latino Images in Film: Stereotypes, Subversions, andRcsista)tcc (Austin, TX: University of Texas Press, 2002).
17. Faber, O'Guinn, and Meyer, "Televised Portrayals"; Mastro andGreenberg, "The Portrayal of Racial Minorities"; Charles Rami'rez Berg,"Stereotyping in Films in General and of the Hispanic in Particular," TheHoward journal of Communication 2 (summer, 1990): 286-300.
18. Ramirez Berg, "Stereotyping in Films."19. Children Now, Latinowood and TV; Rami'rez Berg, "Stereotyping
in Films"; Ramirez Berg, Latino Images.20. Ramirez Berg, "Stereotyping in Films"; Ramirez Berg, Latino
Images.21. Mastro and Creenberg, "The Portrayal of Racial Minorities";
Rami'rez Berg, "Stereotyping in Films"; Rami'rez Berg, Latino Images.22. Children Now, Latinowood and TV.23. Armstrong, Neuendorf, and Brentar, "TV Entertainment"; Ford,
"Effects of Stereotypical Television Portrayals."24. Bradley S. Greenberg, "Children's Reactions to TV Blacks,"
journalism Quarterly 49 (spring 1972): 5-14.25. Faber, O'Guinn, and Meyer, "Televised Portrayals."26. George Gerbner, Larry Gross, Michael Morgan, Nancy Signorielli,
and James Shanahan, "Growing Up With Television: CultivationProcesses," in Media Effects, ed. Bryant and Zillmann, 43-67.
27. Gerbner et al, "Growing Up"; Nancy Signorielli and MichaelMorgan, "Cultivation Analysis: Conceptualization and Methodology,"in Cultivation Analysis: New Directions in Media Effects Research, ed. NancySignorielli and Michael Morgan (Newbury Park, CA: Sage Publicatioas,1990), 13-34.
28. Robert P. Hawkins and Suzanne Pingree, "Using Television toConstruct Social Reality," journal of Broadcasting 25 {fall 1981): 347-64; W.James Potter, "Examining Cultivation from a PsychologicalPerspective," Communication Research 18 (February, 1991): 77-102.
29. Honri Tajfet, Differentiation between Social Croups: Studies in theSocial Psychology of Intergroup Relations (London, UK: Academic Press,1978).
30. Gail E. Coover, "Television and Social Identity: RaceRepresentation as 'White' Accommodation," journal of Broadcasting &Electronic Media 45 {summer 2001): 413-31; Jake Harwood, "ViewingAge: Lifespan Identify and Television Viewing Choices," journal ofBroadcasting & Electronic Media 41 {spring 1997): 203-213; Jake Harwood,"Age Identity and Television Viewing Preferences," CommunicationReports 12 (summer 1999): 85-90; Harwood and Anderson, "ThePresence and Portrayal"; Dana E. Mastro, "A Social Identify Approach
128 QUAKTLRLI

to Understanding the Impact of Television Messages," ComnuDiicationMonographs 70 Oune 2003): 98-113,
31. Dominic Abrams and Michael Hogg, "An Introduction to theSocial Identity Approach," in Social Identity Theory: Constructive andCritical Advances, ed. Dominic Abrams and Michael Hogg (Hertfordshire,UK: Harvester Wheatsheaf). 1-9; Peter R. Grant, "Ethnocentrism inResponse to a Threat to Social Identity," Journal of Social Behavior andPersonality 8 (October 1993): 143-54; Linda A, Jackson, Linda A. Sullivan,Richard Harnish, and Carole N. Hodge, "Achieving Positive SocialIdentity: Social Mobility Social Creativity, and Permeability of GroupBoundaries," Journal of Personality and Social Psychology 70 (February1996): 241-54; Tajfel, Dijferentiation hetween Social Groups; John Turner,"Towards a Cognitive Redefinition of the Social Group," in Social Identityand Intergroup Relations, ed, Henri Tajfel (Cambridge: CambridgeUniversity Press, 1982).
32. Abrams and Hogg, "An Introduction"; Henri Tajfel and MichaelBillig, "Familiarity and Categorization in Intergroup Behavior," Journal ofExperimental Social Psychology 10 (March 1974): 159-70.
33. Ramirez Berg, "Stereotyping in Films,"34. Jake Harwood and Abhik Roy, "Social Identity Theory and
Mass Communication Research," in Intergroup Gommunication, ed. JakeHarwood and Howard Giles (New York: Peter Lang, 2005), 5.
35. Ramirez Berg, "Stereotyping in Films."36. Ramfrez Berg, "Stereotyping in Films."37. Coover, "Television and Social Identity"38. Pamela J. Shoemaker and Stephen D, Reese, Mediating the Message:
Theories of Influences on Mass Media Content (White Plains, NY: Longman,1996).
39. Kimberly A. Neuendorf, The Content Analysis Guidebook (ThousandOaks, CA: Sage, 2002); Daniel Riffe, Stephen Lacy, and Frederick G, Fico,Analyzing Media Messages: Using Quantitative Content Analysis in Research(Mahwah, NJ: Lawrence Erlbaum, 1998).
40. Klaus Krippendorf, Content Analysis: An Introduction to UsMethodology (Beverly Hills, CA: Sage, 1980); Neuendorf, The ContentAnalysis Guidebook; Rit'te, Lacy, and Fico, Analyzing Media Messages.
41. Neuendorf, The Content Analysis Guidebook.42. W. James Potter and Deborah Levine Donnerstein, "Rethinking
Validity and Reliability in Content Analysis," Journal of AppliedCommunication Research 17 (August 1999): 258-84.
43. Krippendorf, Content Analysis.44. Greenberg, Mastro, and Brand, "Minorities and the Mass Media";
Mastro and Greenberg, "The Portrayal of Racial Minorities."45. Mastro and Greenberg, "The Portrayal of Racial Minorities,"46. Albert J. Stunkard, Thorkild 1. Sorenson, and Fini Schulsinger, "Use
ot the Danish Adoption Register tor the Study of Obesity and Thinness,"in The Genetics of Neurological and Psychiatric Disorders, ed. Seymour Kety(New York: Raven Press, 1983), 115-20.
47. Stacy L, Smith, Barbara J. Wilson, Dale Kunkel, Daniel Linz, W.James Potter, Carolyn M. Colvin, and Edward Donnerstein, "Violence in
iw PKIMCTIMF TF.l.LVisi 129

Television Programming Overall: University of California, SantaBarbara," in National Television Violence Study, vol, 3 (Newbury Park, CA:Sage Publications, 1998), 5-220.
48. Leonard Marascuilo, "Large-Scale Multiple Comparisons,"Psychological Bulletin 65 (May 1966): 280-90; Leonard Marascuilo andRonald Serlin, Statistical Methods for the Social and Behavioral Sciences (NewYork: W.H. Freeman & Co., 1988).
49. John Fiske, Media Matters: Race and Gender in U.S. Politics(Minneapolis, MN: University of Minnesota Press, 1996); Herman Gray,Watching Race: Television and the Struggle for "Blackness" (Minneapolis:University of Minnesota Press, 1995).
50. Robert M. Entman and Andrew Rojecki, The Black Image in the WhiteMind: Media and Race in America (Chicago: The University of ChicagoPress, 2001),
51. Shoemaker and Reese, "Mediating the Message."52. Children Now, Latinowood and TV; Faber, O'Guinn, and Meyer,
"Televised Portrayals"; Mastro and Greenberg, "The Portrayal of RacialMinorities"; NCLR, "Out of the Picture."
53. Ramirez Berg, Latino Images.54. United States Census, available from <http://www.census.gov/
population> accessed 15 September 2003,55. Greenberg, Mastro, and Brand, "Minorities and the Mass Media."56. Harwood and Roy, "Social Identity Theory."57. Ramirez Berg, Latino Images.58. Harwood and Roy, "Social Identity Theory."59. Greenberg, Mastro, and Brand, "Minorities and the Mass Media,"
7 an
