lattice dynamics and elastic phonon scattering in silicon · and elastic scattering from isotopic...
TRANSCRIPT

Instructions for use
Title Lattice dynamics and elastic phonon scattering in silicon
Author(s) Shields, J. A.; Tamura, S.; Wolfe, J. P.
Citation Physical Review B, 44(7), 3001-3011https://doi.org/10.1103/PhysRevB.44.3001
Issue Date 1991-08-15
Doc URL http://hdl.handle.net/2115/5942
Rights Copyright © 1991 American Physical Society
Type article
File Information PRB44-7.pdf
Hokkaido University Collection of Scholarly and Academic Papers : HUSCAP
PHYSICAL REVIEW B VOLUME 44, NUMBER 7 15 AUGUST 1991-1
Lattice dynamics and elastic phonon scattering in silicon
S. Tamura Department of Engineering Science, Hokkaido University, Sapporo 060, Japan
J. A. Shields and J. P. Wolfe Department of Physics and Materials Research Laboratory, University of Illinois at Urbana-Champaign,
Urbana, Illinois 61801 (Received 6 March 1991)
We have examined the propagation of acoustic phonons in silicon on the basis of two lattice-dynamics models: a bond-charge model and an effective-foree-constant model consisting of only short-range forces. Phonon propagation is governed predominantly by phonon focusing due to elastic anisotropy and elastic scattering from isotopic atoms in the medium. Both of these effects depend on phonon dispersion. We find that the dispersive effects on the isotope scattering, i.e., the deviation of the scattering rate from a v4 dependence, are discernible only at frequencies higher than 1.5 THz. However, the effects of dispersion on phonon focusing are observable at frequencies as low as -0.4 THz. In a slottedcrystal geometry, the calculated ratio of the scattered to the total phonon intensities yields very similar values for these two lattice-dynamics models and for elasticity theory, validating our previous results on the measurement of the elastic-scattering rate of phonons in silicon.
I. INTRODUCTION
Phonon propagation in silicon has recently gained considerable attention both experimentally and theoretically. Specifically, measurements of phonon hot spots 1 and elastic-scattering rates of phonons2,3 have been performed with high-purity silicon crystals. Also, ideas have been proposed for phonon-mediated detection of neutrinos and dark-matter particles. 4 - 7 Crystalline silicon has much higher phonon frequencies than germanium and the III-V semiconductors previously used for phononpropagation experiments involving frequency dispersion. The lowest zone-boundary frequency of acoustic phonons in silicon is 3.41 THz,8 which is about 80% higher than the corresponding frequencies, 1.90 THz (Ref. 9) and 1.86 THz,IO in germanium and GaAs. Also, the sound velocity of the transverse-acoustic (T A) mode in silicon (5.86X 105 cm/s along the [100] direction) is 65% to 75% faster than the corresponding velocities (3.58 X 10⁵ and 3.35 X 105 cm/s) in germanium and GaAs, respectively .II Hence it is generally expected that the lattice dispersion has only a small effect on the propagation of sub-THz phonons in silicon, whereas the dispersive effects on the phonon propagation have been clearly observed at 0.7 THz in both germanium 12 and GaAs. 13
Recently, we have determined the elastic-scattering rate of phonons in silicon by combining the phononimaging technique and a slotted-crystal geometry [see Fig. 7(a)]. The slot allows one to isolate the scattered phonons from the total (ballistic plus scattered) flux. The drop in intensity behind the slot yields a "ledge ratio R" [see Fig. l1(a)], which is compared to Monte Carlo simulations. The theoretical ledge ratio calculated by elasticity theory (Le., continuum limit) including isotope scatter-
44
ing in silicon coincides well with the experimental data. The experiments, however, were conducted for phonon frequencies higher than 700 GHz. In the course of these experiments it was observed that the angular positions of the phonon caustics are noticeably shifted from those predicted by continuum elasticity theory. The questions arise whether these shifts can be accounted for by lattice dispersion and how the inclusion of lattice dispersion affects the theoretical ledge ratio obtained by the Monte Carlo simulation. In the present article, we address these issues by using lattice-dynamics models to study the phonon propagation in silicon.
In Sec. II, we briefly describe the lattice-dynamics models used in this study. The isotope scattering of phonons derived by these models is given in Sec. III. In Sec. IV, we compare the phonon-focusing calculations to phonon images of (100) silicon obtained by experiments. Scattering calculations of the ledge ratios in (110) silicon are given in Sec. V. The results are summarized in Sec. VI.
II. LATTICE-DYNAMICS MODELS
For group-IV elements, the most physical model is the adiabatic bond-charge model (BCM) of Weber. 14 In this model, the electrons forming the covalent bond constitute pointlike bond charges (BC's) localized in the region between two atoms. In addition to the three kinds of short-range forces between nearest-neighbor ions, ion BC and BC's, the long-range Coulomb interactions between the BC's and ions are taken into account. Although the number of adjustable parameters is only four (three describing the short-range forces and one giving the mag-
3001 © 1991 The American Physical Society

3002 S. TAMURA, J. A. SHIELDS, AND J. P. WOLFE 44
20.--------,--,------.--------.
- Si N
~15~-~~~~~~~1I~~~,-.~ >-~ 10 w :J o 5 w a: u.
o~r----A----~XL-~K---~
FCM BCM
r L
FIG. 1. Phonon-dispersion relations in silicon calculated by FCM (solid curves) and BCM (dashed curves). Experimental data (dots) are from Ref. 8.
nitude of the BC), this model accurately reproduces the phonon-dispersion curves obtained from inelastic neutron-scattering experiments, including the flat T A branches away from the zone center which are difficult to reproduce in other models.
BCM calculations are, however, very time consuming because three kinds of Coulomb interactions have to be calculated by the Ewald method before diagonalizing the dynamical matrix for a given wave vector. For the study of transport properties of phonons at dispersive frequencies, we need to calculate the phonon frequency, the group velocity, and the polarization vector for a large number of phonon wave vectors. So, an efficient latticedynamics model consisting of only short-range forces is desirable for our purpose. Hence, in this work, we also consider a force-constant model (FCM) based on the Born-von Karman scheme. 15 In this scheme for diamond-structure crystals, the interatomic forces up to at least fifth-nearest neighbors are required to reproduce the notable flattening of the dispersion curves in the T A branches. Employing this model, a quantitative fitting of the phonon-dispersion curves of germanium has already been made by including the forces up to eighth-nearest neighbors. 16 Here, we apply the same scheme to silicon. This FCM has 31 adjustable parameters, or force constants, to be determined from the experimental phonondispersion curves and elastic constants. In spite of the large number of parameters involved, the calculation of
TABLE I. Elastic constants of silicon predicted by FCM, BCM, and the experimental values at low temperatures (Ref. 11) (in 1011 dyn/cm2 ).
FCM BCM Expt.
16.8 15.6 16.76
6.51 5.80 6.51
7.98 7.80 8.01
phonon frequencies is considerably faster than BCM with only four adjustable parameters.
In Fig. I, we plot the phonon-dispersion curves in silicon calculated by FCM and BCM. The agreement between these curves and the experimental data is slightly better for the 31-parameter FCM. We also tabulate in Table I the elastic constants predicted by these models along with the experimental values measured at low temperatures. II Again, excellent agreement is attained for FCM because the number of parameters is large. We tried to refit the BCM parameters so that a better agreement with the measured elastic constants is obtained; however, no improvement was achieved with only four parameters. In this respect, an extension of BCM, e.g., the shellibond-charge model by Labrot, Mayer, and Wehner,17 which contains additional parameters, is appealing, but is not pursued here.
III. ISOTOPE SCATTERING OF PHONONS IN SILICON
In isotopically impure crystals like silicon, highfrequency phonons are scattered strongly by the mass fluctuation caused by the randomly distributed isotopic atoms. 18,19 The isotope scattering rate of phonons in a crystal of diamond structure is given by20
21T3 7- 1=---V gv2D(v) (1) 3 0 ,
where Vo is the volume per atom, g is a factor measuring the magnitude of the mass fluctuation (g =2.02 X 10⁻⁴
for silicon), and v is the phonon frequency. In Eq. (1), D ( v) is the one-phonon density of states (DOS) per unit volume defined by
D(v)=_1_3 l: I dS(q,!) = l:Dj(v) , (2) (21T) j v v (q,}) j
where v is the group velocity of a phonon of mode j with vector q, dS is an element of area, and the integral should be taken over a constant-frequency surface v(q,j)=v in wave-vector space. An important feature of the isotope scattering is that Eq. (1) is independent of the mode and propagation direction of phonons. This is valid for cubic crystals consisting of single constituent atoms, but not strictly justified for other crystals with more complex lattice structures.
For long-wavelength phonons, D ex: ~ and the scattering rate is proportional to v4. Explicitly,
(3)
where A 0 = 2.43 X 10 -42 S3 is obtained for silicon in the elasticity limit. This formula, combined with the sound velocity of 5.86X 10⁵ cmls for the [100] propagating TA mode, leads to mean free paths of 9.0 and 1.0 cm at 0.4 and 0.7 THz, respectively.
For ordinary crystals, the DOS of the acoustic branches at finite frequencies (except for the vicinity of zone boundaries) increases with increasing frequency more rapidly than v2 due to dispersive effects. Therefore one of our interests is to see at what frequency the disper-

44 LATTICE DYNAMICS AND ELASTIC PHONON SCATTERING ... 3003
sive effects become important in silicon. In Fig. 2(a), we have plotted the frequency dependences of the isotope scattering rates (1) calculated by FCM and BCM. The dashed line exhibits the scattering rate (3) valid in the
w 1do ~ a:
~ 109
a: w I-
~ 108 () Cf)
w ~ 107 Ia Cf)
(a) / /
FCM
BCM 105~"~'-____ '-~ __ """" __ ~-1
0.5 5 10 15 20
FREQUENCY (THz)
11 10
(b) en
10 W 10 I-« a:
~ 109
a: w I-
~ 108 () Cf)
w 1d a...
a I-a Cf)
106
105
0.5 1 5 10 15 FREQUENCY (THz)
FIG. 2. (a) Isotope scattering rate of phonons in silicon vs frequency calculated by FCM (bold line) and BCM (thin line). Dashed line is the isotope scattering rate obtained from elasticity theory, which exhibits a v4 behavior. (b) Decomposition of the total isotope scattering rate (calculated by FCM) into the contributions from the three acoustic branches.
low-frequency regime. Both models predict almost identical scattering rates at frequencies lower than 3 THz <the region where the scatterings into TA phonons are dominant [see Fig. 2(b)]), and the dispersive effects are recognizable at frequencies higher than about 1.5 THz.21 For sub-THz phonons in silicon, the scattering rate (3) derived from elasticity theory is a good approximation to real silicon. In Fig. 2(b) the relative magnitudes of the scattering rates into the three acoustic branches, i.e., slow transverse (ST), fast transverse (FT), and longitudinal (L), are shown for FCM. These magnitudes are proportional to the DOS [i.e., D j in Eq. (2l], and in the lowfrequency region DST:DFT:DL =0.531:0.376:0.093. Finally, we note that according to Fig. 2(a), the isotope scattering time becomes 0.1-1 ns (acoustic branches) and 10-100 ps (optical branchesl for zone-boundary phonons in silicon.
IV. PHONON IMAGES IN (100) SILICON
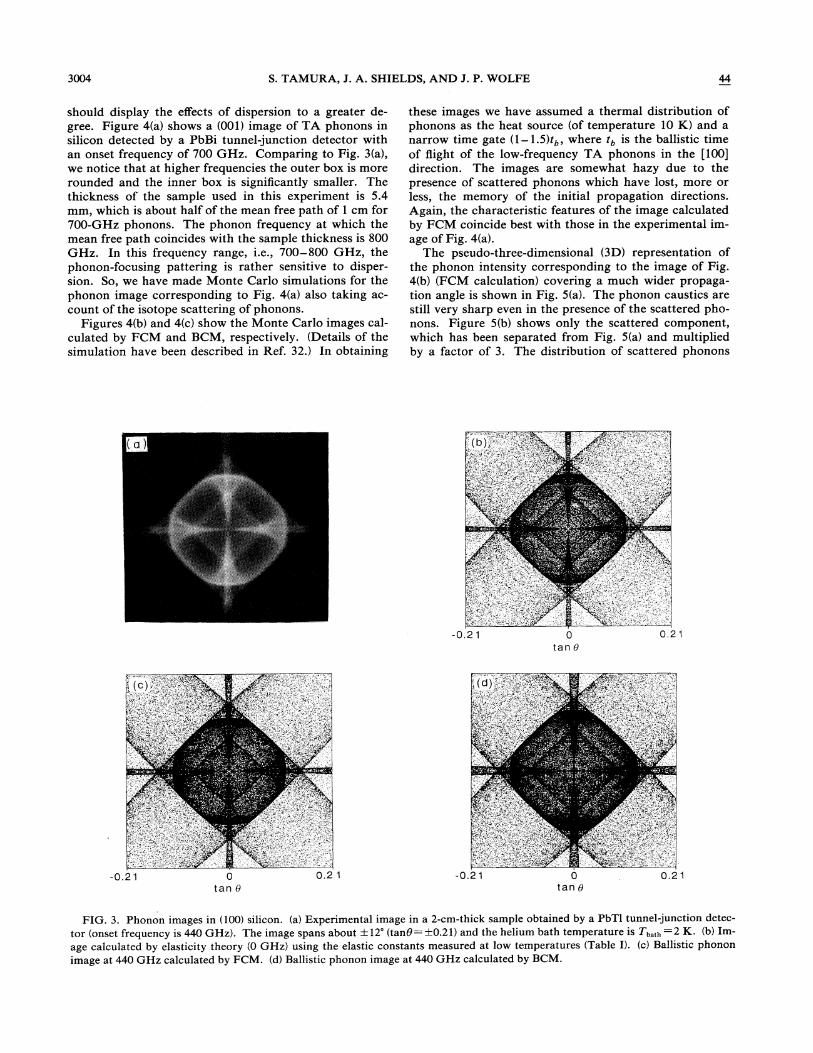
The propagation of ballistic phonons in a crystal exhibits a huge anisotropy called phonon focusing22 due to elastic anisotropy. At low temperatures, the ballistic phonons are frequently the dominant component of the observed phonon intensity, as indicated by strong phonon-focusing caustics in the heat flux. 23,24 Recently, a high-resolution measurement of the T A phonon image in a (OOll-oriented silicon crystal was made by Shields and. Wolfe, 1 using a 2-cm-thick silicon sample. Figure 3(a) shows the image obtained with a (10X lOl-J.lm2 superconducting tunnel-junction detector with an onset frequency of 440 GHz. In this (001) image, the focusing structures of ST phonons, i.e., the box structures exhibiting the fourfold symmetry, are well understood. The narrow structures extending both vertically and horizontally are due to FT phonons.
For comparison, the ballistic phonon image in the same configuration calculated by elasticity theory is plotted in Fig. 3(bl. The overall features are very similar. However, there exist small differences between these images, i.e., in the experimental images, the outer ST box is a little rounder and the inner ST box is smaller than in the calculation. This suggests that even at frequencies as low as 440 GHz, the dispersive shifts of the phonon focusing structures are observable in the phonon images of silicon. Systematic studies of dispersive effects on phonon focusing have been previously conducted on GaAs, 13,25-27Ge, 12,16,28,29 and InSb. 30,31
In Figs. 3(c) and 3(d), we have plotted the ballistic TA phonon images at 440 GHz calculated by FCM and BCM, respectively. Comparing with Fig. 3(a), the FCM best reproduces the experimental image at this frequency. This is expected because the force constants of FCM were adjusted to reproduce the elastic constants and the low-frequency part of the dispersion curves accurately. Thus FCM should be a good model at least for lowfrequency phonons in silicon. The image calculated by BCM at 440 GHz is also similar to the image obtained by elasticity theory, although the sizes of the ST box structures are somewhat different.
Next, we consider higher-frequency phonons, which
3004 S. TAMURA, J. A. SHIELDS, AND J. P. WOLFE 44
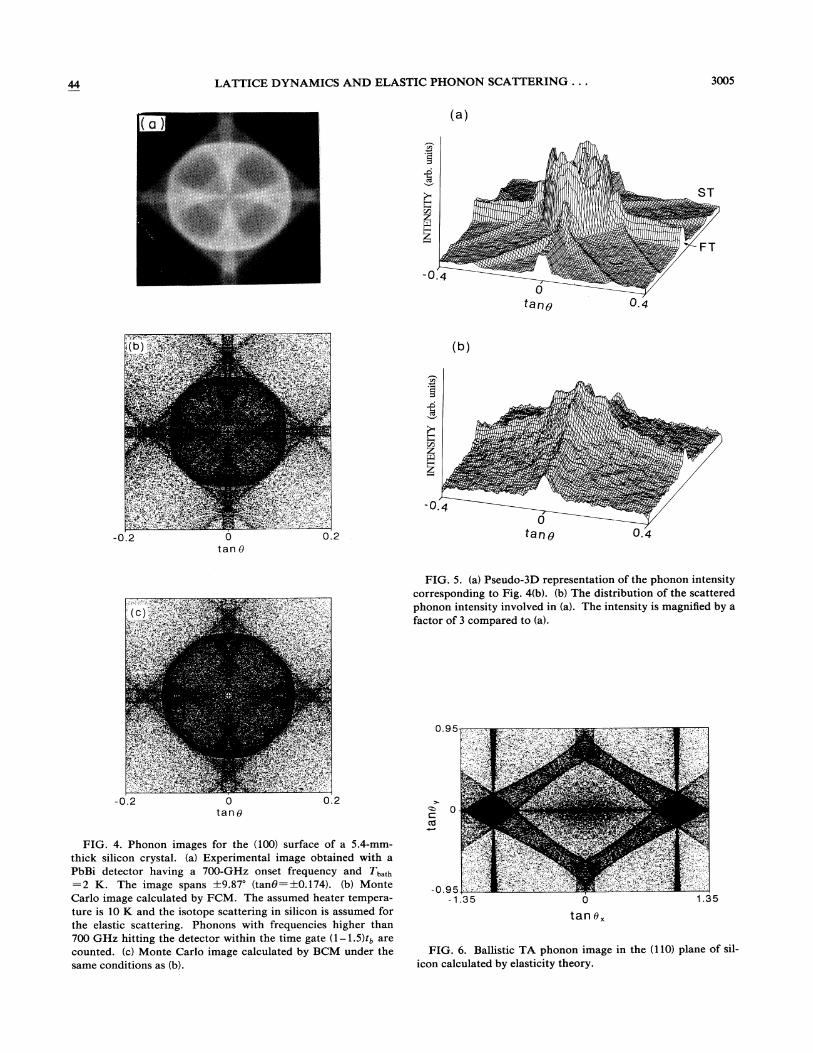
should display the effects of dispersion to a greater degree. Figure 4(a) shows a (001) image of TA phonons in silicon detected by a PbBi tunnel-junction detector with an onset frequency of 700 GHz. Comparing to Fig. 3(a), we notice that at higher frequencies the outer box is more rounded and the inner box is significantly smaller. The thickness of the sample used in this experiment is 5.4 mm, which is about half of the mean free path of 1 cm for 700-GHz phonons. The phonon frequency at which the mean free path coincides with the sample thickness is 800 GHz. In this frequency range, i.e., 700-800 GHz, the phonon-focusing pattering is rather sensitive to dispersion. So, we have made Monte Carlo simulations for the phonon image corresponding to Fig. 4(a) also taking account of the isotope scattering of phonons.
Figures 4(b) and 4(c) show the Monte Carlo images calculated by FCM and BCM, respectively. (Details of the simulation have been described in Ref. 32.) In obtaining
tan e
these images we have assumed a thermal distribution of phonons as the heat source (of temperature 10 K) and a narrow time gate (l-1.5)tb , where tb is the ballistic time of flight of the low-frequency TA phonons in the [100] direction. The images are somewhat hazy due to the presence of scattered phonons which have lost, more or less, the memory of the initial propagation directions. Again, the characteristic features of the image calculated by FCM coincide best with those in the experimental image of Fig. 4(a).
The pseudo-three-dimensional (3D) representation of the phonon intensity corresponding to the image of Fig. 4(b) (FCM calculation) covering a much wider propagation angle is shown in Fig. 5(a). The phonon caustics are still very sharp even in the presence of the scattered phonons. Figure 5(b) shows only the scattered component, which has been separated from Fig. 5(a) and multiplied by a factor of 3. The distribution of scattered phonons
-0.21
-0.21
o tan e
o tan e
0.21
0.21
FIG. 3. Phonon images in (l()()) silicon. (a) Experimental image in a 2-cm-thick sample obtained by a PbTI tunnel-junction detector (onset frequency is 440 GHz). The image spans about ± 12° (tane = ±0.2l) and the helium bath temperature is T bath = 2 K. (b) Image calculated by elasticity theory (0 GHz) using the elastic constants measured at low temperatures (Table I). (c) Ballistic phonon image at 440 GHz calculated by FCM. (d) Ballistic phonon image at 440 GHz calculated by BCM.
44 LATIICE DYNAMICS AND ELASTIC PHONON SCATIERING ... 3005
-0.2
tan e
o tan e
0.2
FIG. 4. Phonon images for the (100) surface of a 5.4-mmthick silicon crystal. (a) Experimental image obtained with a PbBi detector having a 700-GHz onset frequency and Tbath
=2 K. The image spans ±9.87" (tan8=±O.174). (b) Monte Carlo image calculated by FCM. The assumed heater temperature is 10 K and the isotope scattering in silicon is assumed for the elastic scattering. Phonons with frequencies higher than 700 GHz hitting the detector within the time gate (1-1.5)tb are counted. (c) Monte Carlo image calculated by BCM under the same conditions as (b).
( a)
fane 0.4
(b)
FIG. 5. (a) Pseudo-3D representation of the phonon intensity corresponding to Fig. 4(b). (b) The distribution of the scattered phonon intensity involved in (a). The intensity is magnified by a factor of 3 compared to (a).
FIG. 6. Ballistic TA phonon image in the (110) plane of silicon calculated by elasticity theory.

3006 S. TAMURA, J. A. SHIELDS, AND J. P. WOLFE
(a)
1 11 ~ : " " 'i
" )-':. ,/
I , , I , I
I , r------, I '-:..,'": .. -==
5.7jmm II
.~~i;;=:==i<..L..-
T J Detector
Slot boundary
" '6 v
0.7,------~
>-
"" 0 c: ell -
(c)
-0.1 +---------l -0.6 o 1.2
tan9x
Slot boundary
0.7.-------'
q:,>- 0 c: ell -
(e)
-0.71---------0.6 0
Slot boundary
0.7,.-------1
>-
"" 0 c: ell
(b)
-0. 71---____ ~ -0.6
tan9x
Slot boundary
0.7-,-----------' (d)
>-
~ 0 ell
-0.7-1-_____ ~ -0.6 o
tan9x
44
1.2
FIG. 7. (a) Schematic of the slotted-crystal geometry. (b) FCM calculation for the purely ballistic flux at 0.85 THz in the (110) plane for a silicon crystal with a slot (for a wide time gate). (c) Same as (b) except for BCM at 0.85 THz. (d) Same as (b) except for FCM at 1.2 THz. (e) Same as (b) except for BCM at 1.2 THz.

44 LAITICE DYNAMICS AND ELASTIC PHONON SCAITERING ... 3007
retains some of the directionality present in the ballistic flux. This is the channeling effect of scattered phonons which was already observed in GaAs (Ref. 32) and silicon,2 i.e., phonons scattered a few times retain a directed flux due to the combination of the elastic-scattering selection rule and focusing effects. The channeling in silicon is more prominent for the narrowly focused FT mode than for the ST mode.
v. PHONON IMAGES IN (110) SILICON WITH A SLOT
Phonon images of the (110) face of silicon provide us with detailed information on the narrow focusing structures of FT phonons extending from the [100] to [110] directions. Recently, a phonon-imaging experiment was performed with a slotted silicon crystal of this orientation to measure the elastic scattering rate of high-frequency phonons. 3
In order to get a basic idea of the phonon focusing in (11O)-oriented silicon, we have plotted in Fig. 6 the ballistic phonon image calculated by elasticity theory. This image spans ex = ±53. 5° (tanex = ± 1.35) and ey = ±43. 5° (taney = ±0.95), with the [110] direction at the center. The FT "ridges," running both horizontally and vertically across the image, are very narrow, implying that the elastic anisotropy of silicon is rather small. In this continuum limit, the width of the FT ridge (i.e., the greatest separation between the two caustics bounding the ridge) is 1.5° for silicon and becomes larger as the anisotropy is increased. 33
In the phonon-imaging experiment, the sample is slotted as shown in Fig. 7(a). When the laser is behind the slot, only scattered phonons can be detected. The ballistic phonon images predicted by the lattice-dynamics models for the (110) silicon with a slot are illustrated in Figs. 7(b)-7(e) for 0.85 and 1.2 THz, respectively. Even at 0.85 THz (corresponding to FT wave vector which is only about 7.5% of the zone-boundary value in the [110] direction), the dispersive shifts of the FT caustics are quite noticeable, especially for BCM. (The width of the FT ridge is 3.2° for FCM and 4.8° for BCM.)
Figure 8(a) shows the experimental image obtained by the tunnel-junction detector with an onset frequency of 850 GHz. The width of the FT ridge is 4.17°. The sample thickness is 4.85 mm and the chosen time gate is (1-1.5)tb, where tb is now the ballistic time of flight of low-frequency FT phonons in the [110] direction. A nonzero distribution of scattered phonons is observed behind the slot. Here, we note that the calculated phonon mean free path due to isotope scattering at 850 GHz is 4.4 mm, which is close to the sample thickness, implying that the contribution of the scattered phonons to the observed phonon intensity is significant. The Monte Carlo images in the same geometry for the same time gate of (l-1.5)tb are shown in Figs. 8(b) and 8(c) for FCM and BCM, respectively. In these images the FT ridges appear slightly wider than the corresponding ballistic phonon image at 850 GHz [Figs. 7(b) and 7(c)], due to contribu-
Slot boundary
0.7T---""'--"~~
-O .• + ___ ~,",-,---,"",",--0.6 0 1.2
tanOx
Slot boundary
-0. 7+--_-'--'-~_~= -0.6
tan Ox
FIG. 8. Phonon images of (110) silicon with a slot. The thickness is 4.85 mm and the chosen time gate is (l-1.5)tb • (a) Experimental image obtained by a PbBi detector with an 850-GHz onset frequency. The image spans ±23° (tan=±0.43) horizontally and vertically. (b) Monte Carlo image calculated by FCM including isotope scattering. (c) Monte Carlo image calculated by BCM including isotope scattering.

3008 S. TAMURA, J. A. SHmLDS, AND J. P. WOLFE 44
tions from phonons with v> 850 GHz, which have broader FT ridges as a result of dispersion. In addition, similar to Fig. 8(a), we also observe a distribution of scattered-phonon intensities behind the slot (tan8,. < 0).
In order to obtain more information about the scattered phonons, we have plotted in Figs. 9(a)-9(c) the pseudo-3D representations of both the experimental and calculated phonon intensities corresponding to the 850-GHz detector in the (110) plane. In these plots, we can clearly see weak continuations of the FT ridges behind the slot, due to the channeling of scattered phonons as shown in previous papers. 2,3
We have plotted single-line traces of phonon intensities both parallel and perpendicular to the slot boundary. Figure 1O(a) shows experimental line scans parallel to the
<:;;! <='
(c)
slot boundary, which are obtained with an 850-GHz detector. The width of the FT ridges (angle between peak intensities) is .1.8y =4.2° (tan.1.8y =0.072). The corresponding theoretical line scans of the phonon intensity calculated for an 850-GHz detector are shown in Figs lO(b) and 1O(c) for FCM and BCM, respectively. The dashed lines indicate the positions of the FT caustics for 850-GHz ballistic phonons predicted by the models. [In Fig. 1O(b), we have also indicated by thin solid lines the positions of the FT caustics at 0 GHz.] Much of the phonon signals at angles larger than those marked by the dashed lines, therefore, originate from ballistic and channeled phonons with frequencies higher than 850 GHz. Comparing FT-ridge widths for 850 GHz, the BCM result [4.8° in Fig. lO(c)] is somewhat closer to the experi-
(b)
~ ::s
~ ~ r:n
~
FIG. 9. Pseudo-3D representations of the phonon intensities in (110) silicon (same as Fig. 8). (a) Experimental image. (b) Calculations with FCM. (c) Calculation with BCM.

44 LAITICE DYNAMICS AND ELASTIC PHONON SCAITERING ... 3009
mental result [4.2° in Fig. lO(a)] than the FCM result [3.2° in Fig. lO(b)]. Further phonon-imaging experiments utilizing detectors with onset frequencies in the I-THz range are necessary to judge the relative validity of various lattice dynamics models for silicon.
The drop in phonon intensity as the propagation angle is scanned across the slot boundary gives a quantitative measure of the phonon-scattering rate. On one side of the slot boundary, both ballistic and scattered signals are present, and on the other side of the slot boundary, only the scattered signal is present. By measuring arbitrarily close to the boundary, therefore, one can isolate the scattered and ballistic components of the signal. For this
~ ill z W fZ
-0.2
(a)
Experiment 1/ > 0.85 THz
-0.1 0.0
tan Ely
A
en -C :::J
.0
m > I- 0.5 Ci5 z W I-Z
Slot ~
I ,IliA I
0.1
(c)
0.2
reason, we define the ledge ratio R = S / H as shown in Fig. 11(a). In a previous paper, 3 we determined this ledge ratio for Monte Carlo models assuming the scattering rate has the form appropriate for elastic scattering, i.e., T -1 = A ,,4. Calculations of R were conducted for several values of A, and interpolation of these results gave an empirical dependence of the ledge ratio on scattering strength R ( A). The intersection of this curve with the experimental value of R gave an "experimentally measured" scattering constant A. The value determined in this way, assuming continuum elasticity theory, agreed within about 10% with the isotope scattering constant Ao·
2 (b) c :::J
> !::: 0.5 (J)
z W I-Z
V>0.85THz
Th = 10K
O~--~--~---.---.--~--~----.-~ -0.2 -0.1
V>0.85THz
Th = 10K
o tan /9
0.1 0.2
O~--.----.---.----.---~--~---.--~ -0.2 -0.1 o
tan () 0.1 0.2
FIG. 10. Line scans of the phonon intensities parallel to the slot boundary (same conditions as Fig. 8 for the 850-GHz detector). Upper traces (A) include ballistic flux unobstructed by the slot and the lower traces (B) are taken behind the slot (scattered phonons only). (a) Experimental traces. (b) FCM calculation. (c) BCM calculation.
3010 S. TAMURA, I. A. SHIELDS, AND I. P. WOLFE 44
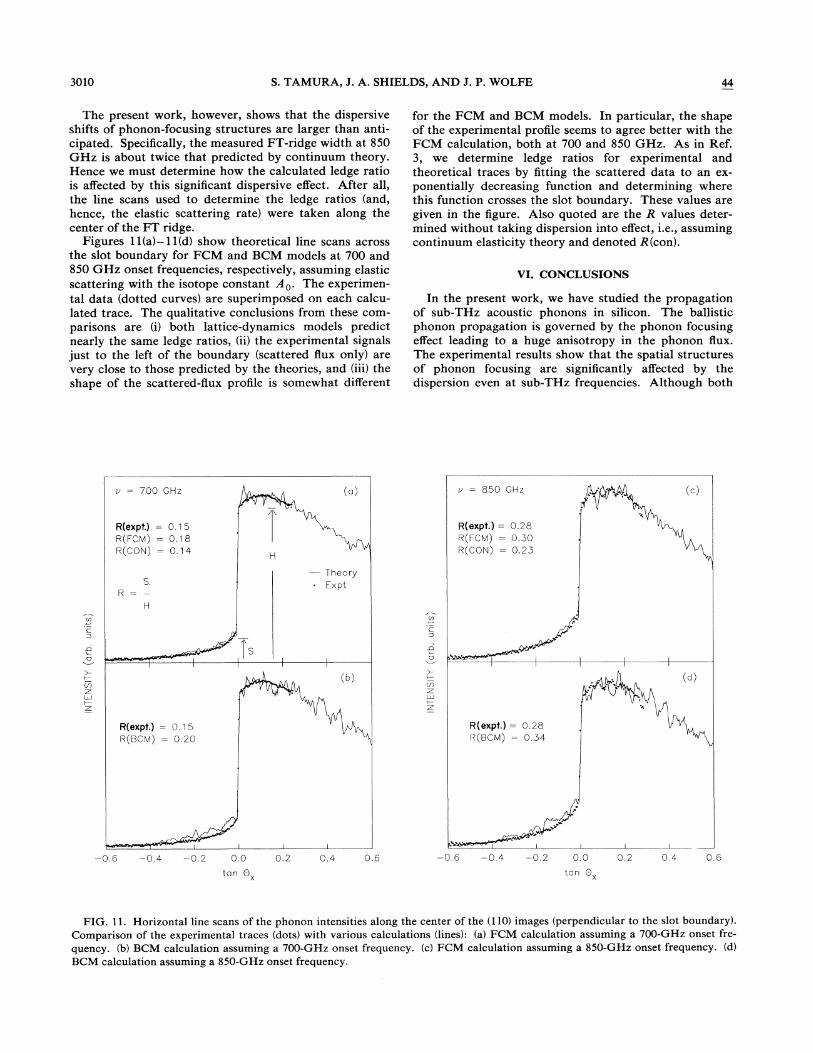
The present work, however, shows that the dispersive shifts of phonon-focusing structures are larger than anticipated. Specifically, the measured FT-ridge width at 850 GHz is about twice that predicted by continuum theory. Hence we must determine how the calculated ledge ratio is affected by this significant dispersive effect. After all, the line scans used to determine the ledge ratios (and, hence, the elastic scattering rate) were taken along the center of the FT ridge.
Figures 11(a)-11(d) show theoretical line scans across the slot boundary for FCM and BCM models at 700 and 850 GHz onset frequencies, respectively, assuming elastic scattering with the isotope constant Ao. The experimental data (dotted curves) are superimposed on each calculated trace. The qualitative conclusions from these comparisons are (i) both lattice-dynamics models predict nearly the same ledge ratios, (ii) the experimental signals just to the left of the boundary (scattered flux only) are very close to those predicted by the theories, and (iii) the shape of the scattered-flux profile is somewhat different
v = 700 GHz
R(expf.) = 0.15 R(FCM) = 0.18 R(CON) = 0.14
S. R = -
H
.~ c =>
-e ~
~ [J)
z w l-
~
R(expt.) = 0.15 R(BCM) = 0.20
-0.6 -0.4 -0.2 0.0
tan ex
H
0.2
(a)
- Theory Expt
0.4 0.6
for the FCM and BCM models. In particular, the shape of the experimental profile seems to agree better with the FCM calculation, both at 700 and 850 GHz. As in Ref. 3, we determine ledge ratios for experimental and theoretical traces by fitting the scattered data to an exponentially decreasing function and determining where this function crosses the slot boundary. These values are given in the figure. Also quoted are the R values determined without taking dispersion into effect, i.e., assuming continuum elasticity theory and denoted R(con).
VI. CONCLUSIONS
In the present work, we have studied the propagation of sub-THz acoustic phonons in silicon. The ballistic phonon propagation is governed by the phonon focusing effect leading to a huge anisotropy in the phonon flux. The experimental results show that the spatial structures of phonon focusing are significantly affected by the dispersion even at sub-THz frequencies. Although both
v = 850 GHz
R(expt.) = 0.28 R(FCM) = 0.30 R(CON) = 0.23
.~ c =>
-e ~ >-I-Vi z W I-z
R(expt.) = 0.28 R(BCM) = 0.34
-0.6 -0.4 -0.2
..
0.0
tan ex 0.2
(e)
0.4 0.6
FIG. 11. Horizontal line scans of the phonon intensities along the center of the (110) images (perpendicular to the slot boundary). Comparison of the experimental traces (dots) with various calculations (lines): (a) FCM calculation assuming a 700-GHz onset frequency. (b) BCM calculation assuming a 700-GHz onset frequency. (c) FCM calculation assuming a 850-GHz onset frequency. (d) BCM calculation assuming a 850-GHz onset frequency.

44 LATTICE DYNAMICS AND ELASTIC PHONON SCATTERINO ... 3011
FCM and BCM reproduce very well the phonondispersion curves of silicon obtained by neutronscattering experiments, these models predict quantitatively different phonon-focusing patterns at the same frequencies (e.g., Fig. 10), in spite of the fact that the dispersion curves predicted for the two models below I THz in high-symmetry directions are nearly identical. This is because phonon focusing depends on the energy flux, whose direction is given by the group-velocity vector as determined from the shapes of the constant-frequency surfaces. Thus the phonon images provide a stringent test of the lattice-dynamics models, complementary to that provided by neutron scattering. To take full advantage of this technique in silicon, phonon-imaging experiments at frequencies above 1 THz are required.
With the slotted-sample geometry, it is possible to measure the elastic-scattering rate by comparing the experimental ledge ratio of the phonon intensities at the boundary of the slot with those obtained by Monte Carlo simulations. For the sample thickness and frequencies
lJ; A. Shields and J. P. Wolfe, Z. Phys. B 75,11 (1987). 2J. A. Shields, J. P. Wolfe, and S. Tamura, Z. Phys. B 76, 295
(1989). 3J. A. Shields, S. Tamura, and J. P. Wolfe, Phys. Rev. B 43,
4966 (1991). 4H. J. Maris, in Phonon Scattering in Condensed Matter V, edit
ed by A. C. Anderson and J. P. Wolfe (Springer, Berlin, 1986), p. 404.
5B. Cabrera, in PHONONS 89, edited by S. Hunklinger, W. Ludwig, and O. Weiss (World Scientific, Singapore, 1990), p. 1373.
6B. Sadoulet, B. Cabrera, H. J. Maris, and J. P. Wolfe, in PHONONS 89, edited by S. Hunklinger, W. Ludwig, and O. Weiss (World Scientific, Singapore, 1990), p. 1383.
7B. A. Young, B. Cabrera, and A. T. Lee, Phys. Rev. Lett. 64, 2795 (1990).
80. Nilsson and O. Nelin, Phys. Rev. B 6,3777 (1972). 90. Nilsson and O. Nelin, Phys. Rev. B 3,364 (1971). 100. Dolling and J. L. T. Waugh, in Lattice Dynamics, edited by
R. F. WaIlis (Pergamon, London, 1965), p. 19. 11M. Neuberger, Handbook of Electronic Materials (Plenum,
New York, 1971), Vols. 2 and 5. 12W. Dietsche, O. A. Northrop, and J. P. Wolfe, Phys. Rev.
Lett. 47, 660 (1981). 130. A. Northrop, S. E. Hebboul, and J. P. Wolfe, Phys. Rev.
Lett. 55, 95 (1986). 14W. Weber, Phys. Rev. B 15,4789 (1977). 15F. Herman, Phys. Chem. Solids 8, 405 (1959).
used in the experiments, the intensity of the scattered phonon is a significant fraction of the ballistic phonon intensity. The important result here is that this ratio does not change significantly if the dispersive shift of the phonon focusing is included. We conclude that, at frequencies below 1 THz, isotope scattering is the dominant scattering mechanism in high-purity silicon crystals.
ACKNOWLEDGMENTS
The authors would like to thank B. Cabrera, H. J. Maris, M. T. Ramsbey, and B. Sadoulet for helpful discussions. This work was supported in part by The Suhara Memorial Foundation and a Grant-in-Aid for Scientific Research from the Ministry of Education, Science and Culture of Japan (Grant No. 0155001). The work at the University of Illinois was supported in part by the U.S. National Science Foundation under the Materials Research Laboratory Grant No. DMR-89-20538.
16S. Tamura, Phys. Rev. B 28,897 (1983). 17M. T. Labrot, A. P. Mayer, and R. K. Wehner, in PHONONS
89 (Ref. 6), p. 181. 18p. O. Klemens, Proc. Phys. Soc. London, Sec. A 68, 1113
(1955). 19p. Carruthers, Rev. Mod. Phys. 33, 92 (1961). 20S. Tamura, Phys. Rev. B 27, 858 (1983). 21Actually, a small deviation from (3) is recognizable for BCM
in the low-frequency region because of the small deviations of the predicted elastic constants from the experimental values (see Table I).
22B. Taylor, H. J. Maris, and C. Elbaum, Phys. Rev. Lett. 23, 416 (1969).
230. A. Northrop and J. P. Wolfe, Phys. Rev. B 22,6196 (1980). 240. A. Northrop and J. P. Wolfe, in Nonequilibrium Phonon
Dynamics, edited by W. E. Bron (Plenum, New York, 1985). 25S. Tamura and T. Harada, Phys. Rev. B 32,5245 (1985). 26S. E. Hebboul and J. P. Wolfe, Z. Phys. B 74,35 (1989). 27H. Kittel, E. Held, W. Klein, and R. P. Heubener, Z. Phys. B
77,79 (1989). 280. A. Northrop, Phys. Rev. B 26,903 (1982). 29W. Metzger and R. P. Heubener, Z. Phys. B 73,33 (1988). 30S. E. Hebboul and J. P. Wolfe, Phys. Rev. B 34,3948 (1986). 31S. E. Hebboul and J. P. Wolfe, Z. Phys. B 73, 437 (1989). 32M. T. Ramsbey, J. P. Wolfe, and S. Tamura, Z. Phys. B 73,
167 (1988). 330. C. Hurley and J. P. Wolfe, Phys. Rev. B 32,2568 (1985).

-0.21 o tan 0
-0 .21
o.
o tan8
tan 0
0 .21
FIG. 3. Phonon images in (100) si licon. (a) Experimental image in a 2-crn-thick sample obtained by a PbTI tunnel-junction detector (onset frequency is 440 GHz). The image spans about ± 12" (tan8= ± O.2I) and the helium bath temperature is T bath = 2 K. (b) Image ca lculated by elasticity theory (0 GHz) using the elast ic constants measured at low temperatures (Table I) . (e) Ballistic phonon image at 440 GHz calculated by FCM. (d) Ballistic phonon image at 440 GHz calculated by BCM.

· 0 .2
tan e
o ta n e
0 .2
FIG. 4. Phonon images for the (1 00) surface of a S.4-mmthick silicon crystal. (a) Experimental image obtained with a PbBi detector having a 700-GHz onset frequency and Tb• th
=2 K . The image spans ± 9.87· (tan9= ± 0. 174). (b) Monte Carlo image calculated by FCM. The assumed heater temperature is 10 K and the isotope scattering in silicon is assumed for the elastic scattering. Phonons with frequencies higher than 700 GHz hitting the detector within the time gate (I -I.S )tb are counted. (c) Monte Carlo image calculated by BCM under the same conditions as (b).

Slot boundary
0.7,------'
-0. '+:-------'-i -0 .6
tan 6x
Slot boundary
0.7,----,--r-' (e)
-0 . (+-___ ~'"-' -0. 6 1.
tan fJx
FIG. 8. Phonon images of (IIO) si licon with a slot. The thickness is 4.85 mm and the chosen time gate is (l-1.5 )tb • (a) Experimental image obtained by a PbBi detector with an 850· GHz onset frequency . The image spans ± 23° (tan = ±O.43) horizonta lly and ve rtically. (b) Monte Carlo image calculated by FCM including isotope scattering. (c) Monte Carlo image calculated by BCM including isotope scattering.