laugh yourself into a healthier person: a cross cultural ...free-journal.umm.ac.id/files/file/laugh...
TRANSCRIPT

Int. J. Med. Sci. 2009, 6
http://www.medsci.org
200
IInntteerrnnaattiioonnaall JJoouurrnnaall ooff MMeeddiiccaall SScciieenncceess 2009; 6(4):200-211
© Ivyspring International Publisher. All rights reserved Research Paper
Laugh Yourself into a Healthier Person: A Cross Cultural Analysis of the Effects of Varying Levels of Laughter on Health Hunaid Hasan , Tasneem Fatema Hasan Mahatma Gandhi Mission’s Medical College, Aurangabad, Maharastra, India, 431003
Correspondence to: Hunaid Hasan or Tasneem Fatema Hasan, “Ezzi Manzil”, CTS No. 3910, Near Bombay Mercantile Bank, Beside Amodi Complex, City Chowk, Juna Bazaar, Aurangabad, Maharashtra, India 431001. Email: [email protected] or [email protected]. Phone: +91-240-234-8673/ +91-982-390-5866/ +1-905-826-3752.
Received: 2009.05.01; Accepted: 2009.07.17; Published: 2009.07.28
Abstract
This cross-cultural study explored along with various personality factors the relationship between laughter and disease prevalence. Previous studies have only determined the effect of laughter on various health dimensions, whereas, this study quantified the level of laughter that was beneficial or detrimental to health. There were a total of 730 participants between the ages of eighteen and thirty-nine years. 366 participants were from Aurangabad, India (AUR), and 364 participants were from Mississauga, Canada (MISS). The participants were provided a survey assessing demographics, laughter, lifestyle, subjective well-being, life satis-faction, emotional well-being and health dimensions. In AUR, a beneficial effect of laughter was mediated through moderate levels (level two) of laughter, whereas both low (level one) and high (level three) levels had no effect. Similarly, in MISS, the beneficial effect was medi-ated through level two, but a negative effect was also seen at level three. This could be at-tributable to a higher prevalence of bronchial asthma in western countries. Laughter was associated with emotional well-being in MISS and life satisfaction in AUR, providing cross cultural models to describe the interactions between laughter and disease. This study vali-dated the correlation between emotional well-being and life satisfaction, with a stronger correlation seen in MISS, suggesting that individualists rely more on their emotional well-being to judge their life satisfaction. In conclusion, there is a benefit to clinicians to in-corporate laughter history into their general medical history taking. Future research should consider developing mechanisms to explain the effects of level two, determine specific sys-temic effects and obtain more samples to generalize the cross cultural differences.
Key words: Levels of laughter, History-taking, Disease, Life satisfaction, Emotional well-being
Introduction Laughter is an innate capability that not only
helps humankind express emotion, but has also shown promise as a promotive, preventive and therapeutic measure to a wide array of medical ail-ments. A study by Parse RR, structurally defined laughter as a “buoyant immersion in the presence of unanticipated glimpsings prompting harmonious integrity which surfaces anew through contemplative visioning”. (1) Interestingly, this definition was inti-
mately associated with the structural definition of health proposed by a phenomenological study of health consisting of four-hundred participants be-tween the ages of seven and ninety-three years. (2) Harmony, plenitude and energy were the three commonalities between both definitions. (1)
The study of laughter is known as “gelatology”, and its effects on health have become a popular topic in medical research. (3) Mahony, DL, et al. explored

Int. J. Med. Sci. 2009, 6
http://www.medsci.org
201
various types of laughter that were thought to be health-promotive. (4) The younger age group pre-sumed laughter to be “strong, active, inhibited and loud”, whereas the elderly (mean age difference of 60 years) believed laughter should be “gentler, kinder, and less active” for its benefit on health. Commonly, both groups, more importantly the elderly, found positive emotion to influence their laughter.
Neurophysioanatomy of Laughter The neuro-anatomical pathway for laughter has
finally been understood after twenty years of re-search. A single centre located in the dorsal upper pons controls two pathways, the “voluntary path” and the “involuntary path” otherwise known as the “emotionally-driven path”. (5) The voluntary path-way begins from the premotor opercular areas and travels via the motor cortex and pyramidal tract to the ventral brain stem. The involuntary path is comprised of amygdala, thalamic, hypothalamic, and subtha-lamic areas, in addition to the dorsal brain stem. Moreover, the Society for Neurosciences has grouped the neuronal control of laughter into three compo-nents: cognitive area, motor area and emotional area. The cognitive area, or the frontal cortex, comprehends various stimuli. The motor area, identified as the supplemental motor cortex, generates a series of muscle movements needed for producing facial ex-pression during laughter. Finally, the emotional area, mainly the nucleus accumbens perceives and ration-alizes happiness. (6)
Effects on Health [Cardiovascular System (CVS), Central Nervous System (CNS) Immunological System (IS), Res-piratory System (RS)]
Kataria M, at the School of Laughter Yoga, de-scribed laughter as a “powerful form of exercise that gives you more of a cardiovascular workout than many ‘regular’ aerobic activities. (7) Similarly, two stages of laughter have been described, the arousal phase, elevating the heart rate, and the resolution phase, resting of the heart. (8) Cardiologists at the University of Maryland found those patients who were suffering from myocardial infarction (MI) were 40% less likely to laugh. However, laughter was shown to be prophylactic against MI. Furthermore, an article by Miller M, et al. at the University of Mary-land found beneficial effects of laughter on the blood vessel. This study consisted of twenty volunteers, where two video clips from both extremes of the emotional spectrum were shown. At the end of the videos, the brachial artery constricted for five minutes and was then released. In fourteen of the twenty volunteers the artery constricted after watching the
stress stimuli, and dilated in nineteen of the twenty volunteers after watching the laughter stimuli. Moreover, the release of nitric oxide is considered vital for vasodilatation. Mental stress was shown to degrade nitric oxide, and therefore, laughter mini-mized the negative effects of stress by reducing the break down of nitric oxide and thus, leading to vaso-dilatation. (9) On average, laughter increased blood flow by twenty-two percent, and stress decreased blood flow by thirty-five percent. (10)
Immunity is a form of integral protection and defense against foreign agents. Laughter had shown to affect the release of various immune mediators. (11,12,13,14,15) Psychoneuroimmunological studies demonstrated connections between the brain and the immune system, such as the hypotha-lamic-pituitary-adrenal (HPA) axis and neural supply of lymphoid tissues. (16) In a study performed by Berk LS, et al., they found increased blood levels of interferon-gamma in ten healthy fasting males after being shown a comedy video (p=0.02). (16) As a re-sult, interferons have become a line of pharmaco-therapy in viral infections, systemic carcinomas, hepatitis B and C, in addition to the development of antiretroviral drugs.
There are two types of stress: distress (the nega-tive type), and eustress (the positive type also known as mirthful laughter). Distress was shown to increase stress hormones such as beta-endorphins, corticotro-phins and catecholamines, but laughter (a form eus-tress) decreased these hormones, fortified activity of natural killer (NK) cells, activated T cells and B cells and increased Ig levels. Thus, laughter is capable of combating the negative aspects of distress and forti-fying the individual’s immune system to help fight against various immune mediated illnesses. (11,12,13,14)
Liangas G, et al. associated the detrimental ef-fects of laughter with bronchial asthma. (17) Bronchial asthma can be triggered by: allergic reactions, various pharmacological agents, the environment, occupation, infections, exercise and emotions. Laughter is com-posed of both a physical (exercise) and emotional component. Perhaps, laughter, as a form of exercise and as an emotional response triggers bronchial asthma, and thus a potent stimulus. Specifically, the physical aspect (exercise) of laughter was considered to cause exercise associated bronchial asthma which is prevalent at a later age. (18,19, 20) According to Gay-rard P, 52.4% of 143 asthmatics stated their attacks of bronchial asthma were induced by laughing. (18) It was suggested, hyperventilation might be a cause to laughter-associated-asthma, in addition to stimulation of irritant receptors in the airway epithelium. (17) The
Int. J. Med. Sci. 2009, 6
http://www.medsci.org
202
second mechanism being the prevalent one admixed with the mechanism of hyperventilation seemed to appropriately describe laughter-associated-asthma.
The World Health Organization defined health as a “state of physical, mental and social well-being and not merely the absence of disease or bodily in-firmity,” and provided a holistic approach in assess-ing health. (21) An article by Richman J, offered in-sight into laughter and its role in mental and social health, both of which influenced each other in nu-merous ways. (22) Furthermore, humans are social animals (23), and their state of mental health is influ-enced by various interactions in society.
Aims and Objectives This study examined the relationship between
various dimensions of personality, levels of laughter and their effects on disease. Previous research has approached laughter more experimentally. However, this article focuses on bringing a systematic approach by incorporating various dimensions of personality to broaden the understanding of laughter and its appli-cation in clinical practice. Therefore, the ultimate ob-jective was to determine whether laughter history should be included as a part of routine medical his-tory taking, and if whether questions related to an individuals’ level of daily laughter should be incor-porated into a medical history to facilitate diagnosis, prognosis and management of various medical con-ditions.
Methods The study was approved by the ethics board of
research at Mahatma Gandhi Mission’s (MGM) Medical College, Aurangabad (AUR). Participants
A total of 730 young individuals between the ages of eighteen to thirty-nine were surveyed. (24) This age group was selected to control for health conditions as a direct result of aging process.
Two culturally distinct samples were surveyed. The first sample was from Mississauga (MISS), Can-ada representing an individualistic society, and the second sample from Aurangabad (AUR), India rep-resenting a collectivist society. Markus HR, et al. de-fined individualism as “an independent view of the self and an entity that is distinct, autonomous, self-contained, and endowed with unique disposi-tions”. On the other hand, they also described a col-lectivist culture as an “interdependent view of the self as part of a larger social network, which includes one’s family, co-workers and others to whom we are socially connected”. (25) Furthermore, Triandis HC, provided three criteria that would help distinguish an
individualistic society from a collectivistic one. (26) The three criteria are: complexity, affluence and het-erogeneity of society. Most important to consider is “heterogeneity of society”. Mississauga is an ethni-cally diverse society where two or more cultures co-exist, this is considered to be heterogeneous in its composition, which is by nature more liberal and al-lows for individual expression. (27) Therefore, the crux of individualism is the ethnic diversity of various individuals. It is not the particular view of the indi-vidual that makes them an individualist, but it is the differing views of a group of individuals that makes an individualist society. Conversely, Aurangabad is homogenous in its local dialect (Marathi), and socio-cultural environment for which it is considered collectivistic. The first sample, from MISS, was com-prised of 364 participants. The participants included teachers and students from Rick Hansen Secondary School, and employees of local retail shops (Coast Mountain Sports, Mexx, Fairweather, Adidas, Living Den, Fruits & Passion, Tommy Hilfiger, Nutrition House, Benix, Grand & Toy, Purdy’s, Randy River, Bell World and Coles) and GlaxoSmithKline Inc. (Departments: Solid Dose Manufacturing, Validation and Regulatory Operations). Moreover, post-secondary students were surveyed through an online survey website, Survey Monkey. The online survey (http://www.surveymonkey.com/s.aspx?sm =tTYWdl431H8mcvtwvQIwuw_3d_3d) was pre-sented in the same format as the hardcopy to ensure uniformity of results. The email was sent to the pro-spective participants via a message (Subject: Tell us about your laughter). The various locations from where the surveys were obtained ensured heterogeneity of the participant’s cultural views, therefore represent-ing a sample of an individualistic society. The second sample, from AUR, was comprised of 366 individuals. The participants included teachers and students at MGM affiliated colleges (MGM Medical College, Jawaral Nehru Engineering College, MGM’s Institute of Biosciences and Technology College of Agricultural Biotechnology and MGM’s Sangeet Academy) and employees of various retail shops (United Colours of Benetton, Cut, Accord Computers (P) Ltd. Computer Mall, Reebok Shopee, The Mobile Store, Planet Fash-ion Van Heusen, Levi’s Store, Cotton King (P) Ltd., Pepe London and Catmoss Retail Ltd).
As a participant, English literacy was a mini-mum criterion. An English language based survey conferred that participants fully understood the ques-tions and completed the survey on their own without assistance. This helped reduce differences between the adult literacy in MISS (literacy rate of 99.0%) and AUR (literacy rate of 61.0%). (28)

Int. J. Med. Sci. 2009, 6
http://www.medsci.org
203
Before administering the surveys, a letter pro-viding institutional affiliation, purpose of the study and declaration of anonymity and confidentiality was presented to all participants. After completing the survey participants were given a briefing about the study. Any incomplete surveys of the relevant infor-mation were discarded.
Survey The survey consisted of thirty-two questions, ti-
tled: Self-Report: Laughter and Health. It obtained details about the participant’s demographics, laughter, life-style, and subjective well being consisting of life sat-isfaction and emotional well being, and an assessment of health dimensions.
Components of the Survey
Demographics
Demographics pertaining to age, gender, city of residence, annual income, and education were in-cluded. Specifically, age, gender and city of residence defined the parameters of the samples. Measurement of Laughter
Laughter was assessed by two questions, Laughter Q1 and Laughter Q2.
Laughter Q1. How many times do you laugh in one day? 1. 0-5 times; 2. 6-10 times; 3. 11-15 times; 4. 16-20 times; 5. 21-25 times; 6. 25 laughs and more
Participants were to reflect upon their laughter history before providing their answer. It was difficult to remember an accurate number of laughs; therefore, in attempt to reduce the error in judgement, the numbers of laughs were grouped into six ranges. These ranges categorized individuals into low, mod-erate and high levels of laughter, namely, level one, level two and level three respectively. Furthermore, the human mind consists of two elements: the con-scious and unconscious. The conscious mind explic-itly assesses situations, whereas the unconscious mind remains implicit. (29) Thus, this question expected a conscious appraisal of the participant’s level of laughter, but, the nature of the question evoked an unconscious response.
Laughter Q2, referred to as situational laughter, measured laughter in the following scenarios:
1. When the individual hears a joke 2. When the individual watches a comedy 3. When the individual is with family/relatives 4. When the individual is with friends 5. During the individual’s regular day For each situation, the participant was required
to rate their level of laughter on a scale of one (don’t laugh) to ten (uncontrollable laughter). This question
represented the common daily scenarios in which an individual would most likely laugh. This scale re-quired a conscious appraisal of the participant’s level of laughter and expected to be less influenced by the unconscious mind and memory biases.
Three levels of laughter categorized the partici-pants into low, moderate and high. Laughter Q1 con-sisted of six ranges from which they were grouped into three levels: level one (range one and two or 0-10 laughs), level two (range three, four and five or 11-25 laughs) and level three (range six or 25 laughs and more). Likewise, in situational laughter, Laughter Q2 consisted of a scale from one to ten and was divided into three levels, level one (1-3), level two (4-7) and level three (8-10).
Both methods of measurement were equally important to validate the results of laughter. Three different sets of responses were encountered. Firstly, responses to both questions corresponded to the same level of laughter, and thus, it was accepted. Secondly, for instance if a response belonged on the two extreme levels of laughter, like the response to Laughter Q1 was level one and the response to Laughter Q2 was level three or vice versa, an average was taken, and level two, was accepted. Finally, if responses be-longed to adjacent groups such that, the response to Laughter Q1 was level two, and the response to Laughter Q2 was level three, the authors accepted level three as the response, because they gave situ-ational laughter precedence in this situation while accepting the appropriate level of laughter. Lifestyle
Questions concerning lifestyle were included to explore the various other factors that influence health. The section on lifestyle contained seven questions. The first five questions were related to general life-style.
Lifestyle Q1. How aware are you about your health? (lowest) 1---10 (highest)
Participants were made to cognitively self-evaluate and perceive their own level of aware-ness for their health.
Lifestyle Q2. How socially active are you? (low-est) 1---10 (highest)
Lifestyle Q3. How active are you in your com-munity? (lowest) 1---10 (highest)
In reference to Q2 and Q3, Aristotelian Darwin-ian’s viewed human beings as social animals by na-ture. (23) Since humans are innately programmed to be social, it was therefore vital to assess the partici-pant’s social and communal involvement.
Lifestyle Q4.How physically active are you dur-ing the day? (highest score) Active with Daily Exercise

Int. J. Med. Sci. 2009, 6
http://www.medsci.org
204
--- Not active (score of zero) The response was two-fold, comprising of an
objective and subjective component. Whether they were active or not, was subjective, and how frequently they exercised, was objective.
Lifestyle Q5. How aware are you about your daily diet? (highest score) I am well aware and I eat a well balanced diet --- I am not aware and don’t eat a well balanced diet (score of zero)
The response was two-fold, comprising of an objective and subjective component. The awareness about their diet was subjective, and whether they ate a well balanced diet was objective.
These five questions were amalgamated to form an overall score for lifestyle. The total score was thirty-seven. Lifestyle Q1 to Lifestyle Q3 were equally weighted and represented 81% of the total value of the questions, whereas, Lifestyle Q4 and Lifestyle Q5 represented only 19%. This gave an appropriate level of emphasis on Lifestyle Q4 and Lifestyle Q5, without overestimating its influence. Please note that these five questions were not intended to be a complete assessment, but a brief overview of the participant’s lifestyle. Subjective well-being
According to Schimmack U, et al., subjective well-being is comprised of a cognitive component, life satisfaction, defined as one’s life according to subjec-tively determined standards, and an affective com-ponent, emotional well-being, is defined as the bal-ance between pleasant affect and unpleasant affect. (30) Life satisfaction included satisfaction of occupa-tion, marriage and life in general, and emotional well-being consisted of mood and self-esteem. Laughter and personality were correlated through a neurobiological circuitry, which subsequently affects emotional well-being. (31) The two questions specific to life satisfaction were:
Life satisfaction Q1. How satisfied are you with your life? (lowest) 1---10 (highest)
Life satisfaction Q2. How satisfied are you with your occupation? (lowest) 1---10 (highest)
Life satisfaction and occupation satisfaction were included in this study. Marital satisfaction was not included because of social limitations, therefore minimizing any erroneous effects on the study. Also, a significant number of participants were not married.
While assessing emotional well-being, mood and self-esteem were crucial elements to consider. The three questions were:
Emotional well-being Q1. How do you feel at the moment? (sad) 1—2—3 (happy)
Emotional well-being Q2. How would you de-
fine your mood generally? (sad) 1—2—3 (happy) Emotional well-being Q1 and Emotional
well-being Q2 inquired about the participant’s present and general mood and its aggregate was a more ap-propriate indicator.
Emotional well-being Q3. In general, what do you believe about yourself? (highest score) I am a good person and very valuable to my society --- Who am I? I don’t know how I affect society (lowest score)
Emotional well-being Q3 was specific to self-esteem. Self-esteem of an individual consists of two components: 1. self evaluation, 2. feeling of self worth. (32) Self evaluation was assessed by asking the participant if they were a “good person”, “not a good person” or “not sure about who they were”. The self worth component assessed how valuable the participant believed they were to their society, such as “very valuable,” “not valuable” or “not sure”. An aggregate of mood and self-esteem provided an overall score for emotional well-being. Health Dimensions
This section of the survey inquired about the participant’s history of past illnesses. The participants were asked to indicate “yes” or “no” if they had suf-fered a medical condition pertaining to CVS, RS, gas-trointestinal tract, hepatobiliary system, genitourinary system, reproductive system, CNS and psychiatric conditions, and then to specify the name of that con-dition. If the participant failed to indicate the name of the condition regardless of a “yes”, the survey was discarded assuming the participant did not fully un-derstand the question.
Statistical analysis The data was analyzed using both parametric
and non parametric statistics and the specific test used was indicated with the respective results. If assump-tions of normality and equal variances (Levene’s test) were accepted, then parametric statistics would be appropriate method for analysis, otherwise non pa-rametric statistics were used. Correlations for all categorical data were performed by Contingency Co-efficient (R) test. Accepted value of statistical signifi-cance for all analysis was α=0.05.
Results Preliminary Analysis
Mann Whitney U test was performed to make a statistical valid comparison between age and gender distribution in both samples (Table 1). Both samples were not statistically different from each other with respect to age (Z=-1.32, p=0.129) and gender (Z=-0.228, p=0.820). Disease process was influenced
Int. J. Med. Sci. 2009, 6
http://www.medsci.org
205
by both age and gender, thus equality in distribution for both factors between both samples was essential for further analysis.
Table 1: Demographics of the sample
City n MAGE(years) SDAGE(years) Male (%) Female (%)
MISS 364 22.50 5.11 54.1 45.9
AUR 366 22.37 4.43 58.7 41.3
Total 730
According to Table 2, the presence of disease was
statistically greater (χ2=16.00, df=1, p<0.01) in the MISS sample. There was a qualitative difference in disease pattern; MISS participants suffered more chronic diseases and in particular chronic respiratory diseases, whereas AUR participants suffered more acute illnesses. Moreover, determining the prevalence and the distribution of chronic respiratory conditions like bronchial asthma in various laughter groups was imperative to gain further insight into the relationship studied by Liangas G, et al. between laughter and its detrimental effects on bronchial asthma (Figure 2). MISS had a significantly higher prevalence of bron-chial asthma than AUR (χ2=4.08, df=1, p=0.043).
Table 2: Distribution of participants in levels of laughter, disease state and bronchial asthma
City L1 (%) L2 (%) L3 (%) No disease (%) Disease (%) BA (n)
MISS 22.0 46.7 31.3 57.4 42.6 17
AUR 13.4 54.9 31.7 71.6 28.4 31
L1=Level one; L2=Level two; L3=Level three; BA=Bronchial asthma According to Table 2, the distribution of partici-
pants in both samples was statistically different for the three levels of laughter (χ2=10.05, df=2, p>0.01). MISS showed a greater percentage of participants in level one as compared to AUR. Furthermore, AUR had a greater percentage of participants in level two, as compared to the MISS. However, AUR and MISS were almost equal for level three.
The survey also included a set of questions, titled “Lifestyle”. The aggregate score in MISS was signifi-cantly greater than AUR (t=4.105, p<0.01), indicating a higher level of awareness among the MISS partici-pants. Finally, it was important to determine whether lifestyle was related to disease. Results dictate that no statistical difference existed for both samples (AUR: (Levene’s test: F=0.307, p=0.580); t=0.22, p=0.823; MISS: (Levene’s test: F=-1.58, p=0.209); t= 0.41, p=0.680).
Table 3: Life Satisfaction statistics
City No disease Disease Levene's test No dis-ease-disease comparison
M SD M SD F p-value t p-value
MISS 14.41 3.4 13.56 3.41 0.015 0.902 2.336 0.02
AUR 15.46 3.57 15.26 3.51 0.874 0.351 0.481 0.631
According to Table 3, life satisfaction scores in
MISS were significantly different between disease states, such that, diseased participants scored lower on life satisfaction than those without disease. On the contrary, no such difference was found to exist in AUR. Moreover, Schimmack U, et al. proposed emo-tional well-being as a better predictor of life satisfac-tion in individualistic society (0.76), than in collectiv-ism (0.48). (30)
Table 4: Emotional well-being statistics
City M SD Spearman Coefficient (R) p-value
MISS 8.47 1.42 0.475 <0.01
AUR 8.67 1.48 0.26 <0.01
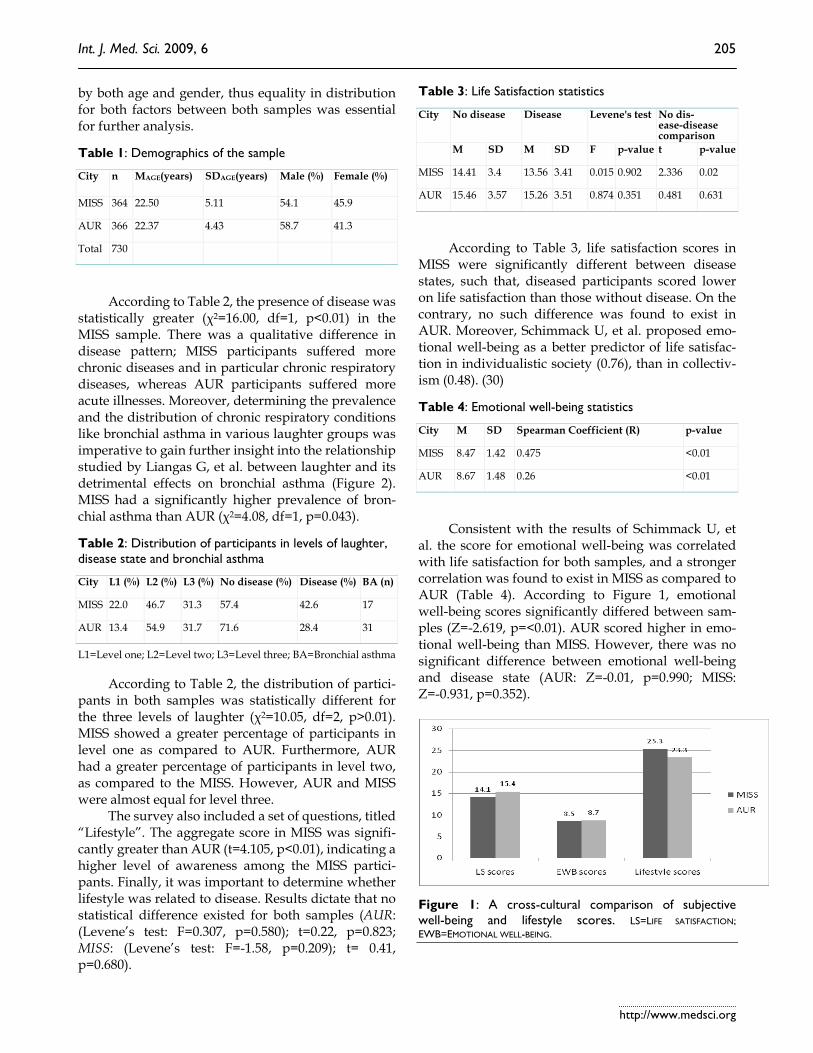
Consistent with the results of Schimmack U, et
al. the score for emotional well-being was correlated with life satisfaction for both samples, and a stronger correlation was found to exist in MISS as compared to AUR (Table 4). According to Figure 1, emotional well-being scores significantly differed between sam-ples (Z=-2.619, p=<0.01). AUR scored higher in emo-tional well-being than MISS. However, there was no significant difference between emotional well-being and disease state (AUR: Z=-0.01, p=0.990; MISS: Z=-0.931, p=0.352).
Figure 1: A cross-cultural comparison of subjective well-being and lifestyle scores. LS=LIFE SATISFACTION; EWB=EMOTIONAL WELL-BEING.

Int. J. Med. Sci. 2009, 6
http://www.medsci.org
206
The Element of Laughter The purpose of this study was to understand the
statistical relationship between laughter and disease. Further analyses were performed with Chi-squared tests. The distribution of the three levels of laughter was significantly different for both samples (χ2=10.05, df=2, p>0.01). Therefore, AUR and MISS were inde-pendently analyzed.
Table 5: Cross cultural distributions of laughter and dis-ease patterns
Level of laughter
City Freq. of no disease
Freq. of disease
χ2 df p-value
L1 MISS 38 42 0.200 1 0.655
AUR 23 26 0.184 1 0.668
L2 MISS 127 43 41.506 1 <0.01
AUR 181 20 128.96 1 <0.01
L3 MISS 44 70 5.930 1 0.015
AUR 58 58 0.000 1 1.000
L1=Level one; L2=Level two; L3=Level three According to Table 5, a statistical relationship
between laughter and presence of disease was ob-served in MISS (χ2=40.52, df=2, p<0.01), such that, level one and level three of laughter consisted of more diseased participants, whereas level two of laughter consisted of several more not diseased participants. There was no statistical difference between the dis-eased and not diseased for level one, but a significant difference was seen for level two and level three.
According to Table 5, in AUR, a statistical rela-tionship was established between the three levels of laughter and the presence of disease. A statistical dif-ference for level two was clearly seen with more not diseased than diseased participants. On the other hand, level one and level three failed to show a statis-tically significant difference, where level one con-tained a marginal number of more diseased than not diseased participants, and level three contained an equal number in both groups.
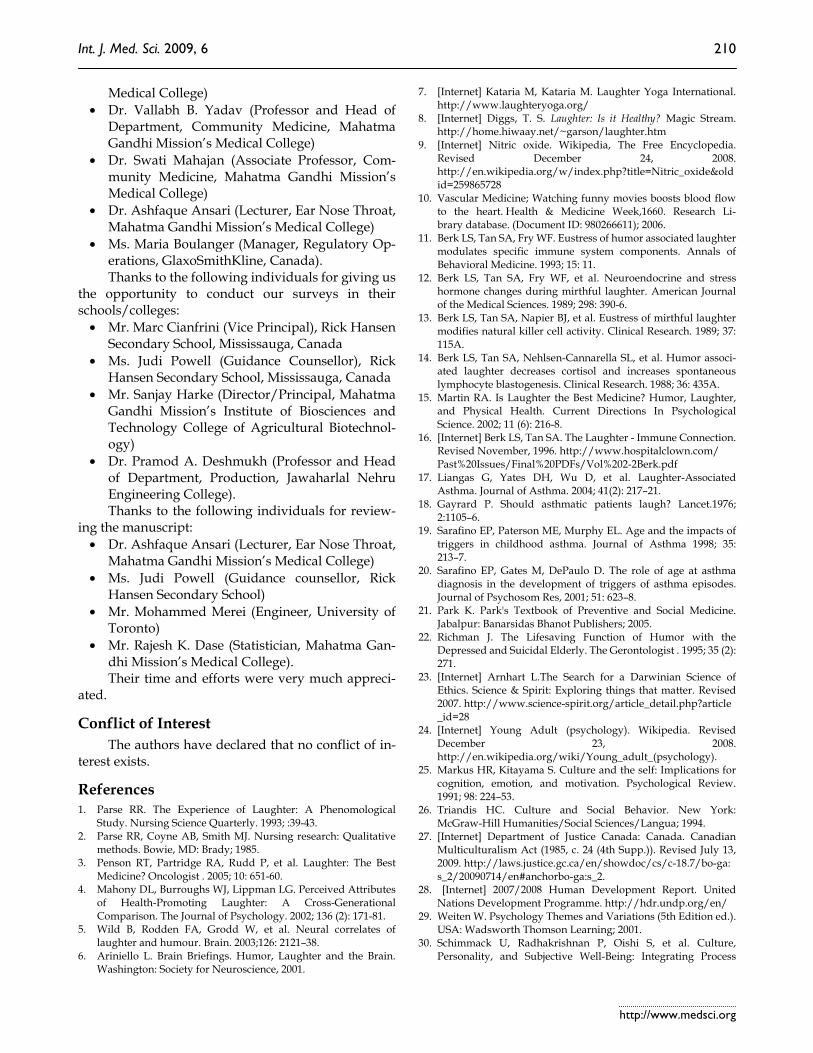
MISS was shown to be comprised of more dis-eased participants than in AUR, particularly suffering from chronic respiratory conditions like bronchial asthma. According to Figure 2, they were frequently encountered in level three of laughter, and this showed to have a negative effect on health. Within the three levels of laughter, the distribution of those par-ticipants who claimed to have bronchial asthma was significantly different, such that level three had an appreciably greater number of asthmatics than in level one and level two (χ2=8.58, df=2, p=0.014).
Figure 2: A cross-cultural distribution of participants giving a history of bronchial asthma. L1=LEVEL ONE; L2=LEVEL TWO; L3=LEVEL THREE.
In addition, laughter was also assessed with
factors, like lifestyle score, life satisfaction score and emotional well-being score. An ANOVA was used to determine statistical difference in lifestyle scores among levels of laughter. In both samples no statisti-cal difference (AUR: F=0.55, df=2, p=0.577; MISS: F=0.386, df=2, p=0.680) or significant correlation in lifestyle scores (AUR: R=0.41, p= 0.149; MISS: R=0.334, p=0.723) was found.
Moreover, life satisfaction and its association with laughter was analyzed using an ANOVA. In AUR, life satisfaction scores and the levels of laughter were statistically different (F=3.25, df=2, p=0.040). Tukey’s post hoc comparison test was performed to compare the levels of laughter that were significantly different. Life satisfaction scores were found to be significant between level one and level three (p=0.037), but revealed no significance between level one and level two (p=0.327), and level two and level three (p=0.225).
Figure 3: Cross cultural life satisfaction scores across levels of laughter. L1=LEVEL ONE; L2=LEVEL TWO; L3=LEVEL THREE.

Int. J. Med. Sci. 2009, 6
http://www.medsci.org
207
Based on figure 3, life satisfaction scores pro-gressively increased with rising levels of laughter. Finally, the correlation between life satisfaction and laughter was positive and moderately strong (R=0.341, p=0.034). Similarly, a statistical difference was found in MISS (F=6.41, df=2, p<0.01). Tukey’s post hoc comparison test was performed to interpret the differences. Level one and level two (p<0.01) and level one and level three were different (p<0.01), but level two and level three were not different (p<0.946). Similarly, life satisfaction scores increased with rising levels of laughter. Comparatively, MISS had a lower life satisfaction score than AUR, but a significant in-cline in score from level one to level two was ob-served. Finally, there was no correlation between life satisfaction scores and levels of laughter (R=0.316, p=0.096).
The effect of emotional well-being on different levels of laughter was analyzed by the Kruskal-Wallis test. In AUR, no statistical difference (χ2=2.37, df=2, p=0.306) or correlation (R=0.183, p=0.388) was seen. Conversely, in MISS a significant difference was ob-served (χ2=20.56, df=2, p<0.01). Games-Howell post hoc test was used to compare emotional well-being scores and the levels of laughter. This test suggested that level one and level two (p=0.021) and level one and level three (p<0.01) were significantly different, but level two and level three (p=0.095) were not. Fur-thermore, emotional well-being scores increased with rising levels of laughter (MLevel one=7.95, MLevel two=8.48, MLevel three=8.82), and the correlation between both variables was positive and moderate in strength (R=0.26, p=0.018).
Discussion Implications of this study
Many laughter clubs and associations exist worldwide. They use laughter as a therapeutic agent for short periods of time. It was important to note that, this study did not intend to validate the benefits of such organizations, or comment on their method-ology. On the contrary, this study looked at the gen-eral tendency of the participant to laugh. Due to per-sonality differences, some individuals tend to laugh more than others. Thus, this study measured the natural and long-term effects of laughter with keeping in mind the personality predisposition of an individ-ual, rather than a short-term measure of laughter. Personality predisposition is influenced by various factors like life satisfaction, emotional well-being, self-esteem, mood, lifestyle and so forth.
Previously, many studies have focused on de-termining the mechanism through which laughter benefits the various bodily systems. However, they have not quantified the level of laughter through which beneficial effects on CVS, IS and CNS were seen. Therefore, this study has focused on determin-ing those levels of laughter that have shown to benefit and promote health. Based on both positive and negative effects of laughter, it was hypothesized that level two of laughter was beneficial to health and that both low levels (level one) and high levels (level three) of laughter were detrimental to health.
In AUR, results suggested that level two of laughter appeared to be health promotive, but, level one and level three of laughter neither benefited nor impaired health. Thus, in AUR, we can state that moderate amounts of laughter was beneficial to health, however these benefits appeared to diminish for those that laughed very little or in excess.
In MISS, the frequency of diseased and not dis-eased participants for level two and level three was significant. Unlike AUR, level two and level three showed a statistically significant difference. This is important because in MISS, excess laughter was shown to detriment health, whereas in AUR, no effect was seen. Liangas G, et al. demonstrated the negative effects of laughter on bronchial asthma. (17) More-over, chronic respiratory conditions like bronchial asthma were found to be more prevalent among young adults in western countries. It was assumed by the hygiene hypothesis that recurrent infections dur-ing childhood helped to protect the individual from developing atopic disorders like bronchial asthma. (33) Therefore, this suggests that the detrimental ef-fects of laughter-associated-asthma on health in de-veloped countries may be mediated through level three.
This study linked mental well being and medi-cine together, with laughter playing a central role. As previously discussed, the relationship between laughter and disease was the highlight of this study. This relationship was bidirectional, such that, differ-ent levels of laughter variably affected disease, and certain diseases were also shown to affect laughter. Therefore, it was expected that a diseased individual would be less likely to laugh than their normal selves. As a result, individuals who are ill are recommended to laugh as a mode of therapy, since previous research has shown laughter to increase the bodily immune function. (15,16)

Int. J. Med. Sci. 2009, 6
http://www.medsci.org
208
Figure 4: Summary of the cross cultural effect of laughter on health influenced by emotional well-being and life satisfaction. This figure depicts two cultural specific pathways showing the interaction between subjective well- being components, laughter and disease. A cross cultural difference in the correlation between emotional well-being and life satisfaction was observed.
The Geneva Foundation for Medical Education
and Research had found that humour and laughter possibly improve emotional well-being and thereby improve health. (34) Similarly in MISS, this study showed a correlation of R=0.26 between laughter and emotional well-being. In Figure 4, both samples have shown laughter to affect the disease process at level two, but, emotional well-being had shown no effect on disease state in both samples. It was important to note that only MISS demonstrated a correlation be-tween laughter and emotional well-being. Therefore emotional well-being affected disease process through laughter.
According to Schimmack U, et al. life satisfaction is correlated with emotional well-being and the asso-ciation is stronger in individualistic societies. (30) This study had also found the same results; however, the correlates were moderately and weakly associated for individualists and collectivists, respectively. Accord-ing to the Integrated Mediator–Moderator Model, individualistic societies tend to rely on their emotions to evaluate their life satisfaction, whereas collectivistic societies are less likely to use their emotions before evaluating life satisfaction. (30) This is because collec-tivists “subordinate personal goals to the interest of the group”, and give more importance to their cul-tural norms than their emotions. (35,36,37)
Therefore, on the basis of the results and previ-ous research, MISS has demonstrated the following pathway:
Figure 5: Pathway for individualistic culture
The pathway in Figure 5 exemplifies the impor-
tance of emotional well-being in evaluating life satis-faction which eventually mediates laughter and dis-ease process. Interestingly, life satisfaction mediates laughter through emotional well-being, but does not directly mediate laughter (Figure 4). Perhaps, this suggests that self-esteem and mood are important mediators of laughter. Moderate levels of laughter are beneficial to health and level three of laughter is det-rimental to health in MISS. According to the correla-tions in Figure 4, since disease was significantly more prevalent in those who belonged to level three of laughter, it suggests that excess of either life satisfac-tion or emotional well-being could possibly be detri-mental to health.
AUR showed a significant correlation between life satisfaction and laughter. Therefore, on the basis of these results the following pathway has been pro-posed:
Figure 6: Pathway for collectivistic culture

Int. J. Med. Sci. 2009, 6
http://www.medsci.org
209
The pathway in Figure 6 directly relates life sat-isfaction with laughter mediating disease process, without the role of emotional well-being. Like MISS, laughter is beneficial at level two; however, on the contrary, both level one and level three have no det-rimental effects on health. Therefore, this suggests that both extremes of life satisfaction ratings have no effect on disease process.
Figure 7: Cross culturally universal pathway
It is vital to note that in both pathways (Figure
5,6), the central mediator between mental well-being and disease process is laughter (Figure 7). This is a cross culturally universal pathway. Since laughter has both a physical and emotional component, it repre-sents a vital intervention point for clinicians.
Recommendations Based on the Study Based on the results and inferences of this study
laughter history should be incorporated into the practice of general medical history taking. However, there were cultural differences in the effects of laugh-ter. Thus, the importance of laughter history relative to other relevant histories would vary depending on the location of the clinician. Since both samples showed a beneficial effect on health at level two, and only MISS demonstrated a detrimental effect at level three, this suggested that laughter history should be given more preference to individualist societies for laughter-associated-asthma.
In order to understand the implications of this study it was important to understand what moderate (level two) laughter meant. According to the survey, level two was considered to be in the range of ten to twenty-five laughs in one day, and on the situational laughter scale, a rating of four to seven. Clinically, laughter history can be obtained by asking the indi-vidual “how many times do you laugh during your regular day?” and have the individual rate their level on a scale of one to ten. Furthermore, other questions about situational laughter could be asked to fully as-sess the individual’s level of laughter. Questions as-sessing general and situational laughter utilize largely the conscious mind and are negligibly affected by the unconscious mind and memory biases, and should therefore be preferred in laughter history. However, choosing the number of times an individual laughs during the day is more suitable for a survey than
laughter history, because it is being influenced largely by the unconscious mind. After assessing the level of laughter, the information should be included as evi-dence to support or negate the provisional diagnosis. In the individualist societies, level three should help support the diagnosis of disease in particular laugh-ter-associated-asthma, and level two of not diseased. In collectivist societies, laughter history should be utilized as a prophylactic measure. For instance, if the individual rates level one or level three on laughter, the patient can be informed that their level of laughter has little medical benefit and that moderate levels of laughter (level two), being more beneficial to health, should be attained.
Future Research In conclusion, this study examined the levels of
laughter through which both beneficial and detri-mental effects of laughter on the various bodily sys-tems would be observed. It did not explore the mechanisms or its specific effects on different sys-temic diseases. Therefore future research should firstly, explore these relationships in more detail, and secondly, formulate mechanisms through which level two of laughter have shown to be beneficial to health. Also, there should be a detailed look at the interac-tions of different levels of laughter and various sys-temic diseases. This insight would help give impor-tance to weighting of laughter history for different systemic illnesses.
Also, this study mainly analyzed laughter in a unidirectional way, specifically the relationship of laughter on disease. However, future studies should consider the reverse relationship, the effect of disease on laughter. The bidirectional nature of this relation-ship is vital to gain a more thorough understanding of laughter and its role in the disease process. This study was unique in that it explored laughter and disease in two different parts of the world, representing indi-vidualistic and collectivistic societies. The results found cross-cultural differences; however, to gener-alize these differences future studies should focus on taking a larger and a greater number samples from each of these countries.
ACKNOWLEDGEMENTS This research was supported by the Department
of Community Medicine and Department of Medicine at Mahatma Gandhi Mission’s Medical College, Au-rangabad India.
Thanks to the following individuals for greatly supporting our study:
• Dr. Shafaat H. Talib (Professor and Head of De-partment, Medicine, Mahatma Gandhi Mission’s
Int. J. Med. Sci. 2009, 6
http://www.medsci.org
210
Medical College) • Dr. Vallabh B. Yadav (Professor and Head of
Department, Community Medicine, Mahatma Gandhi Mission’s Medical College)
• Dr. Swati Mahajan (Associate Professor, Com-munity Medicine, Mahatma Gandhi Mission’s Medical College)
• Dr. Ashfaque Ansari (Lecturer, Ear Nose Throat, Mahatma Gandhi Mission’s Medical College)
• Ms. Maria Boulanger (Manager, Regulatory Op-erations, GlaxoSmithKline, Canada). Thanks to the following individuals for giving us
the opportunity to conduct our surveys in their schools/colleges:
• Mr. Marc Cianfrini (Vice Principal), Rick Hansen Secondary School, Mississauga, Canada
• Ms. Judi Powell (Guidance Counsellor), Rick Hansen Secondary School, Mississauga, Canada
• Mr. Sanjay Harke (Director/Principal, Mahatma Gandhi Mission’s Institute of Biosciences and Technology College of Agricultural Biotechnol-ogy)
• Dr. Pramod A. Deshmukh (Professor and Head of Department, Production, Jawaharlal Nehru Engineering College). Thanks to the following individuals for review-
ing the manuscript: • Dr. Ashfaque Ansari (Lecturer, Ear Nose Throat,
Mahatma Gandhi Mission’s Medical College) • Ms. Judi Powell (Guidance counsellor, Rick
Hansen Secondary School) • Mr. Mohammed Merei (Engineer, University of
Toronto) • Mr. Rajesh K. Dase (Statistician, Mahatma Gan-
dhi Mission’s Medical College). Their time and efforts were very much appreci-
ated.
Conflict of Interest The authors have declared that no conflict of in-
terest exists.
References 1. Parse RR. The Experience of Laughter: A Phenomological
Study. Nursing Science Quarterly. 1993; :39-43. 2. Parse RR, Coyne AB, Smith MJ. Nursing research: Qualitative
methods. Bowie, MD: Brady; 1985. 3. Penson RT, Partridge RA, Rudd P, et al. Laughter: The Best
Medicine? Oncologist . 2005; 10: 651-60. 4. Mahony DL, Burroughs WJ, Lippman LG. Perceived Attributes
of Health-Promoting Laughter: A Cross-Generational Comparison. The Journal of Psychology. 2002; 136 (2): 171-81.
5. Wild B, Rodden FA, Grodd W, et al. Neural correlates of laughter and humour. Brain. 2003;126: 2121–38.
6. Ariniello L. Brain Briefings. Humor, Laughter and the Brain. Washington: Society for Neuroscience, 2001.
7. [Internet] Kataria M, Kataria M. Laughter Yoga International. http://www.laughteryoga.org/
8. [Internet] Diggs, T. S. Laughter: Is it Healthy? Magic Stream. http://home.hiwaay.net/~garson/laughter.htm
9. [Internet] Nitric oxide. Wikipedia, The Free Encyclopedia. Revised December 24, 2008. http://en.wikipedia.org/w/index.php?title=Nitric_oxide&oldid=259865728
10. Vascular Medicine; Watching funny movies boosts blood flow to the heart. Health & Medicine Week,1660. Research Li-brary database. (Document ID: 980266611); 2006.
11. Berk LS, Tan SA, Fry WF. Eustress of humor associated laughter modulates specific immune system components. Annals of Behavioral Medicine. 1993; 15: 11.
12. Berk LS, Tan SA, Fry WF, et al. Neuroendocrine and stress hormone changes during mirthful laughter. American Journal of the Medical Sciences. 1989; 298: 390-6.
13. Berk LS, Tan SA, Napier BJ, et al. Eustress of mirthful laughter modifies natural killer cell activity. Clinical Research. 1989; 37: 115A.
14. Berk LS, Tan SA, Nehlsen-Cannarella SL, et al. Humor associ-ated laughter decreases cortisol and increases spontaneous lymphocyte blastogenesis. Clinical Research. 1988; 36: 435A.
15. Martin RA. Is Laughter the Best Medicine? Humor, Laughter, and Physical Health. Current Directions In Psychological Science. 2002; 11 (6): 216-8.
16. [Internet] Berk LS, Tan SA. The Laughter - Immune Connection. Revised November, 1996. http://www.hospitalclown.com/ Past%20Issues/Final%20PDFs/Vol%202-2Berk.pdf
17. Liangas G, Yates DH, Wu D, et al. Laughter-Associated Asthma. Journal of Asthma. 2004; 41(2): 217–21.
18. Gayrard P. Should asthmatic patients laugh? Lancet.1976; 2:1105–6.
19. Sarafino EP, Paterson ME, Murphy EL. Age and the impacts of triggers in childhood asthma. Journal of Asthma 1998; 35: 213–7.
20. Sarafino EP, Gates M, DePaulo D. The role of age at asthma diagnosis in the development of triggers of asthma episodes. Journal of Psychosom Res, 2001; 51: 623–8.
21. Park K. Park's Textbook of Preventive and Social Medicine. Jabalpur: Banarsidas Bhanot Publishers; 2005.
22. Richman J. The Lifesaving Function of Humor with the Depressed and Suicidal Elderly. The Gerontologist . 1995; 35 (2): 271.
23. [Internet] Arnhart L.The Search for a Darwinian Science of Ethics. Science & Spirit: Exploring things that matter. Revised 2007. http://www.science-spirit.org/article_detail.php?article _id=28
24. [Internet] Young Adult (psychology). Wikipedia. Revised December 23, 2008. http://en.wikipedia.org/wiki/Young_adult_(psychology).
25. Markus HR, Kitayama S. Culture and the self: Implications for cognition, emotion, and motivation. Psychological Review. 1991; 98: 224–53.
26. Triandis HC. Culture and Social Behavior. New York: McGraw-Hill Humanities/Social Sciences/Langua; 1994.
27. [Internet] Department of Justice Canada: Canada. Canadian Multiculturalism Act (1985, c. 24 (4th Supp.)). Revised July 13, 2009. http://laws.justice.gc.ca/en/showdoc/cs/c-18.7/bo-ga: s_2/20090714/en#anchorbo-ga:s_2.
28. [Internet] 2007/2008 Human Development Report. United Nations Development Programme. http://hdr.undp.org/en/
29. Weiten W. Psychology Themes and Variations (5th Edition ed.). USA: Wadsworth Thomson Learning; 2001.
30. Schimmack U, Radhakrishnan P, Oishi S, et al. Culture, Personality, and Subjective Well-Being: Integrating Process

Int. J. Med. Sci. 2009, 6
http://www.medsci.org
211
Models of Life Satisfaction. Journal of Personality and Social Psychology. 2002; 82 (4): 582–93.
31. Mobbs D, Hagan CC, Azim E, et al. Personality predicts activity in reward and emotional regions associated with humor. PNAS. 2005; 102 (45): 16502–6.
32. Myers DG, Spencer SJ. Social Psychology (2nd Edition ed.). Canada: McGraw-Hill Ryerson; 2004.
33. Shah SN. API Textbook of Medicine (Vol 1). Mumbai: The Association of Physicians of India; 2008.
34. [Internet] Campana, A. Geneva Foundation for Medical Education and Research. Complementary therapies – Glossary. Revised September 4, 2008. http://www.gfmer.ch/TMCAM/TMCAM_glossary.htm
35. Radhakrishnan P, Chan DKS. Cultural differences in the rela-tion between self-discrepancy and life satisfaction. International Journal of Psychology. 1997; 32: 387–98.
36. Rozin P. Preadaptation and the puzzles and properties of pleasure. In: Kahneman D., Diener E., Schwarz N, Eds. Well-being: The foundations of hedonic psychology. New York: Russell Sage Foundation; 1999:109–133.
37. Suh M, Diener E, Oishi S, et al. The shifting basis of life satis-faction judgments across cultures: Emotions versus norms. Journal of Personality and Social Psychology. 1998; 74: 482–93.
Author biography Hunaid Hasan is a final year medical student at
Mahatma Gandhi Mission’s Medical Col-lege-Maharashtra University of Health Sciences. During his tenure as a medical student, he has strived for academic excellence with first class marks and achieving a distinction on his university examina-tions. His other research endeavors were: the effects of opioid neuropeptides and corticotrophin releasing hormone on anorexic behavior, and a re-search-argumentative paper on Nanotechnol-ogy-nanomedicine and nanoengineering, published by the University of Toronto Press. Prior, he was a student of psychology specialist at the University of Toronto, being awarded an academic scholarship from the University of Toronto. He was chosen for the Research Opportunity Program, to pursue research in the field of happiness and emotions. He was selected by GlaxoSmithKline Inc. for their summer student program in their Regulatory Affairs department. He graduated from Rick Hansen Secondary School, Mis-sissauga Canada with honors. Being 1 of 20 students selected from Canada for the Clarica Scholars Pro-gram at the University of Waterloo, he was involved in designing a software tool to help students across the school board write better essays. He was awarded the “STORM Award”, for excellence in academics and profound involvement in the community, the “Rick Hansen Award” for excellence in community leader-ship, and University of Toronto “Book Award” for excellence in leadership and academic abilities. After completing medical school, he plans on becoming a physician and hopes to further pursue his research work in the field of laughter and health. He wants to
further explore the successful integration of “laughter history” in to clinical practice.
Tasneem Fatema Hasan, is currently pursing her final year of medicine at Mahatma Gandhi Mission’s Medical College-Maharashtra University of Health Sciences. Throughout her tenure as a medical student she has achieved academic excellence with first class grades in the University examinations. As a medical student it was important for her to involve herself into scholarly research. Her other research undertaking was a study on anorexia nervosa and its modulation through opioid neuropeptides and corticotrophin releasing hormones. She graduated from Rick Hansen Secondary School, Mississauga Canada, where she was an honor roll student throughout her academic career, being awarded the University of Toronto “Book Award” for academic excellence and excellence in community leadership. She was also awarded the “Aiming for the Top scholarship” by the Government of Ontario. She was chosen as the team captain of the design team for the multinational FIRST Robotics Competition, where she led her team to the prestig-ious “Chairman’s Award at the Greater Toronto Re-gional” and “Regional 1st place winners at the Water-loo Regional”. After completing medical school she plans on becoming a pediatrician. She hopes to con-tinue her research work in further understanding laughter and its effects on health in the pediatric age-group.