laura cozzi deputy head, global energy economics ggsdf, … ggsdf d1_session 1_laura cozzi.pdf ·...
TRANSCRIPT

© OECD/IEA 2014
Laura Cozzi Deputy Head, Global Energy Economics
GGSDF, OECD, Paris, 13 November 2014
© OECD/IEA 2014
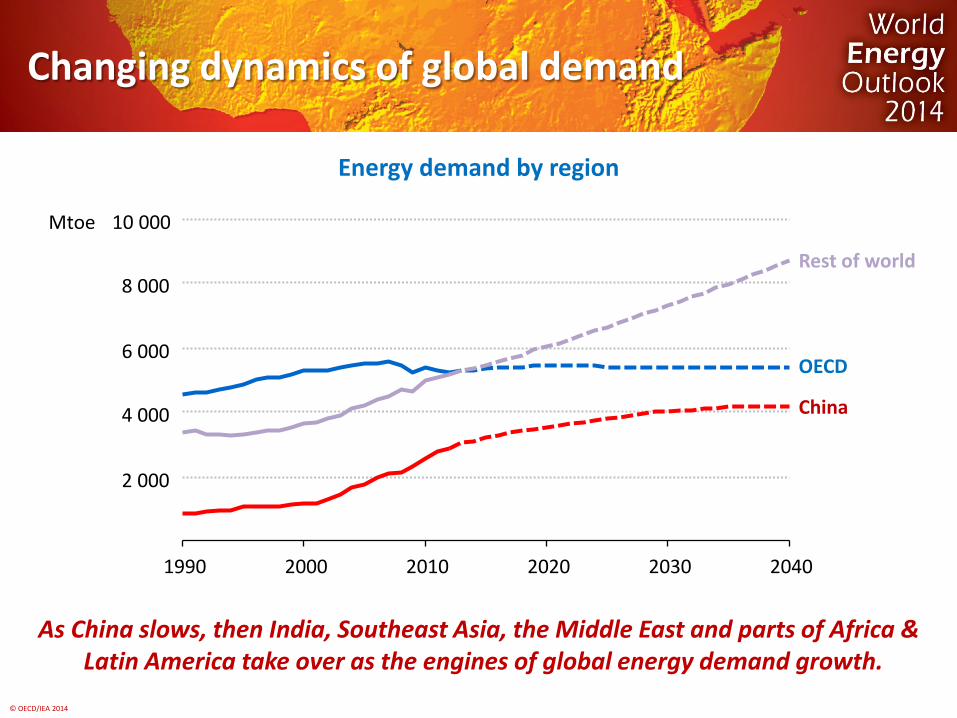
Changing dynamics of global demand
Energy demand by region
As China slows, then India, Southeast Asia, the Middle East and parts of Africa & Latin America take over as the engines of global energy demand growth.
2 000
4 000
6 000
8 000
10 000
1990 2000 2010 2020 2030 2040
Mtoe
OECD
Rest of world
China
China
Rest of world
OECD

© OECD/IEA 2014
0
1000
2000
3000
4000
5000
600020
1320
2020
40
2013
2020
2040
2013
2020
2040
2013
2020
2040
2013
2020
2040
Dolla
rs p
er h
ouse
hold
(201
3)
Others
Oil
Gas
Electricity
European Union
United States Japan China India
Diverging trends in households energy expenditures
Energy expenditures in households
Expenditures in OECD countries decline due to new vehicles efficiency standards, but they rise fast in developing countries accounting for increasing share of income.
© OECD/IEA 2014
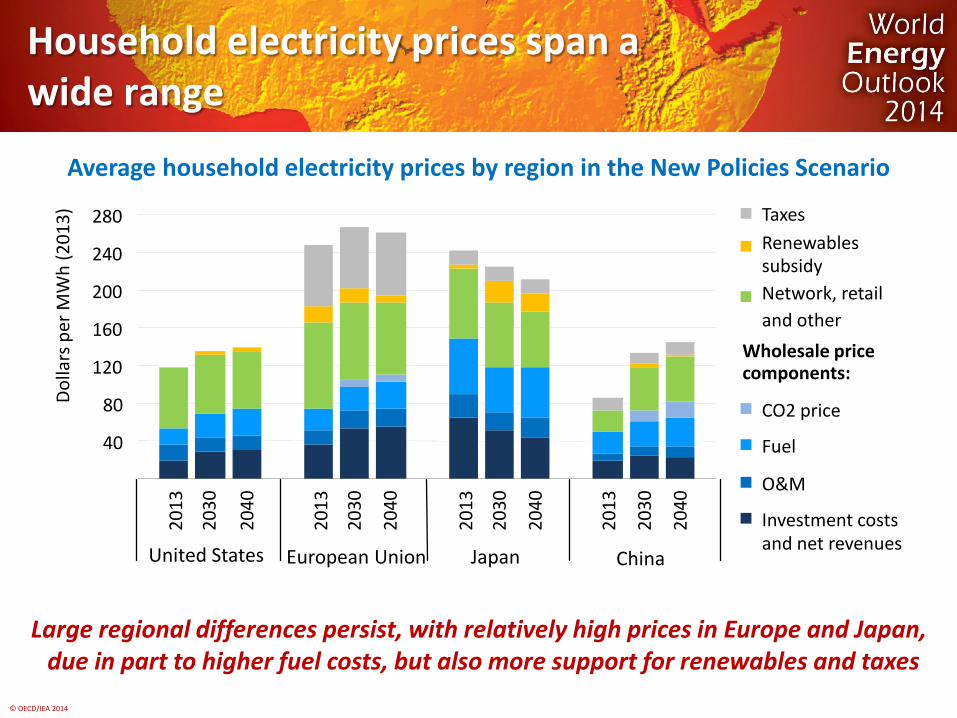
Household electricity prices span a wide range
Average household electricity prices by region in the New Policies Scenario
Large regional differences persist, with relatively high prices in Europe and Japan, due in part to higher fuel costs, but also more support for renewables and taxes
40
80
120
160
200
240
280
2013
2030
2040
2013
2030
2040
2013
2030
2040
2013
2030
2040
Dolla
rs p
er M
Wh
(201
3) Taxes
CO2 price
Fuel
O&M
Investment costs
United States European Union Japan China
Wholesale price components:
Renewables subsidy Network, retail and other
and net revenues

© OECD/IEA 2014
Energy efficiency helps containing costs and give boost to the economy
0.00
0.05
0.10
0.15
0.20
0.25
0.30
Dolla
rs p
er k
Wh
(201
3)
European Union
China
Japan
$1330
United States
$1456 $152 $981
kWh 0.00
0.05
0.10
0.15
0.20
0.25
0.30
Dolla
rs p
er k
Wh
(201
3)
European Union
China
Japan
$984
kWh
$480 $1079
$176
$1692
$319
$106
United States
$56
Improvements in energy efficiency moderate the increase in households’ consumer electricity bills, boosting spending in other parts of the economy.
2013 2040
Household electricity spending and savings due to energy efficiency

© OECD/IEA 2014
In sub-Saharan Africa, 620 million people – two-thirds of the population – live without electricity. Only a handful of countries have electrification rates above 50%
Less than 50% More than 50%
Share of population with access to electricity:
Africa: rich in resources, but poor in supply

© OECD/IEA 2014
The poorest face the highest share of energy spending
Household energy spending as share of income, 2012
Across Sub-Saharan Africa, the wealthiest 20% of households account for about 50% of residential spending on energy, while the poorest 20% for just 5%
2%
4%
6%
8%
10%
12%
Q1 Q2 Q3 Q4 Q5 Q1 Q2 Q3 Q4 Q5 Q1 Q2 Q3 Q4 Q5
1 000
2 000
3 000
4 000
5 000
6 000
Dolla
rs p
er y
ear Other
Electricity Per capita income (right axis)
South Africa Kenya Malawi
© OECD/IEA 2014
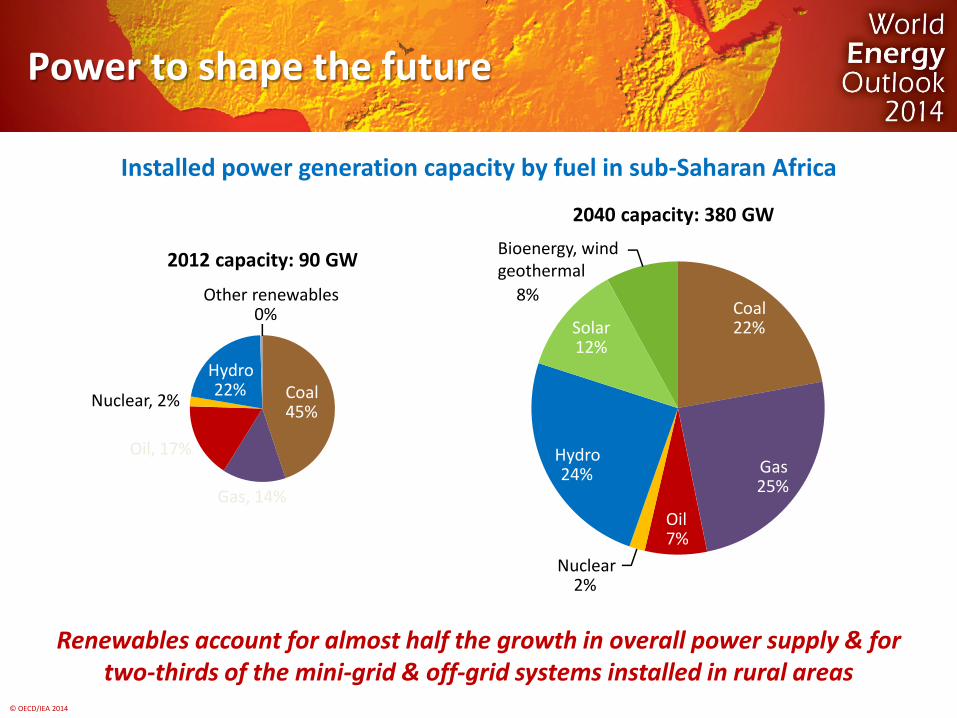
Power to shape the future
Installed power generation capacity by fuel in sub-Saharan Africa
Renewables account for almost half the growth in overall power supply & for two-thirds of the mini-grid & off-grid systems installed in rural areas
Coal 45%
Gas, 14%
Oil, 17%
Nuclear, 2%
Hydro 22%
Other renewables 0%
2012 capacity: 90 GW
2040 capacity: 380 GW
Coal 22%
Gas 25%
Oil 7%
Hydro 24%
Solar 12%
Nuclear 2%
Bioenergy, wind geothermal
8%
© OECD/IEA 2014
100
200
300
400
500
600
700 M
illio
n pe
ople
Without access to electricity
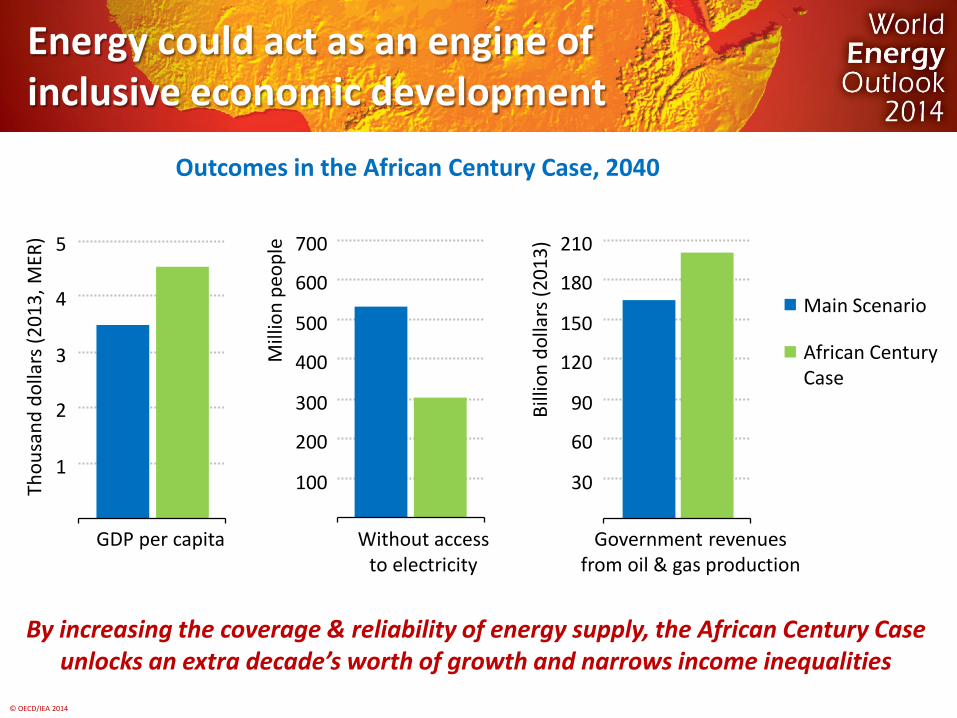
Energy could act as an engine of inclusive economic development
Outcomes in the African Century Case, 2040
By increasing the coverage & reliability of energy supply, the African Century Case unlocks an extra decade’s worth of growth and narrows income inequalities
Main Scenario
African Century Case
1
2
3
4
5
Thou
sand
dol
lars
(201
3, M
ER)
GDP per capita Bi
llion
dol
lars
(201
3)
Government revenues from oil & gas production
30
60
90
120
150
180
210
© OECD/IEA 2014
www.worldenergyoutlook.org www.worldenergyoutlook.org/africa/